Embed Size (px)
Citation preview
Rhiza Ratio: Generations and the ‘Hispanic Vote
RHIZA | SEPTEMBER 2015
© 2015 Rhiza
The Rhiza Ratio
The Rhiza Ratio identifies correlations derived from the intersection of large datasets. We release information on varying topics on a monthly basis, with a focus on the junction of consumers and media.
2 | Confidential
© 2015 Rhiza
Introduction
With heightened discussion around the importance of the Hispanic vote in the 2016 presidential election, the latest round of the Rhiza Ratio takes a granular look at this segment of the voter population. Specifically, the Rhiza Ratio examines party affiliation, media habits and policy preferences based on age.
The following data intersections were discovered using Rhiza’s platform, with data culled from the L2 Nationwide Voter File which includes anonymized voter registration data. We have pulled out some key excerpts below.
3 | Confidential
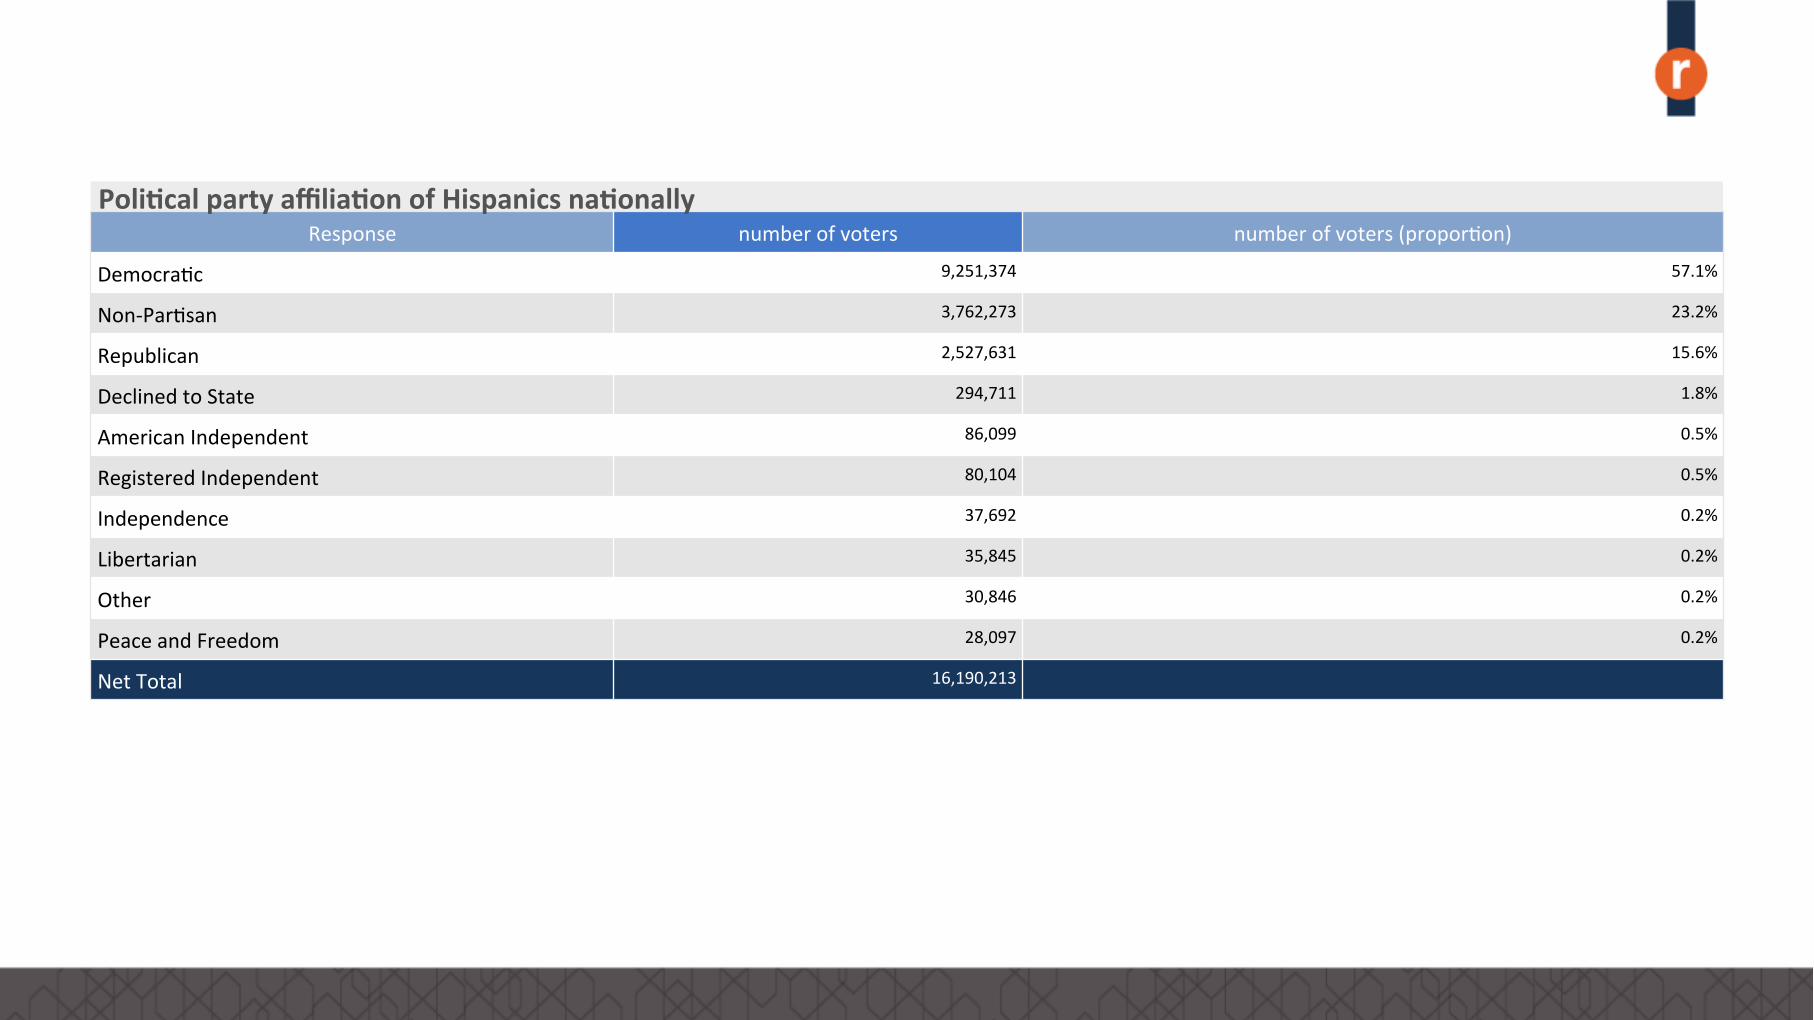
Response number of voters number of voters (propor0on)
Democra0c 9,251,374 57.1%
Non-‐Par0san 3,762,273 23.2%
Republican 2,527,631 15.6%
Declined to State 294,711 1.8%
American Independent 86,099 0.5%
Registered Independent 80,104 0.5%
Independence 37,692 0.2%
Libertarian 35,845 0.2%
Other 30,846 0.2%
Peace and Freedom 28,097 0.2%
Net Total 16,190,213
Poli%cal party affilia%on of Hispanics na%onally
Response
num
ber o
f vot
ers
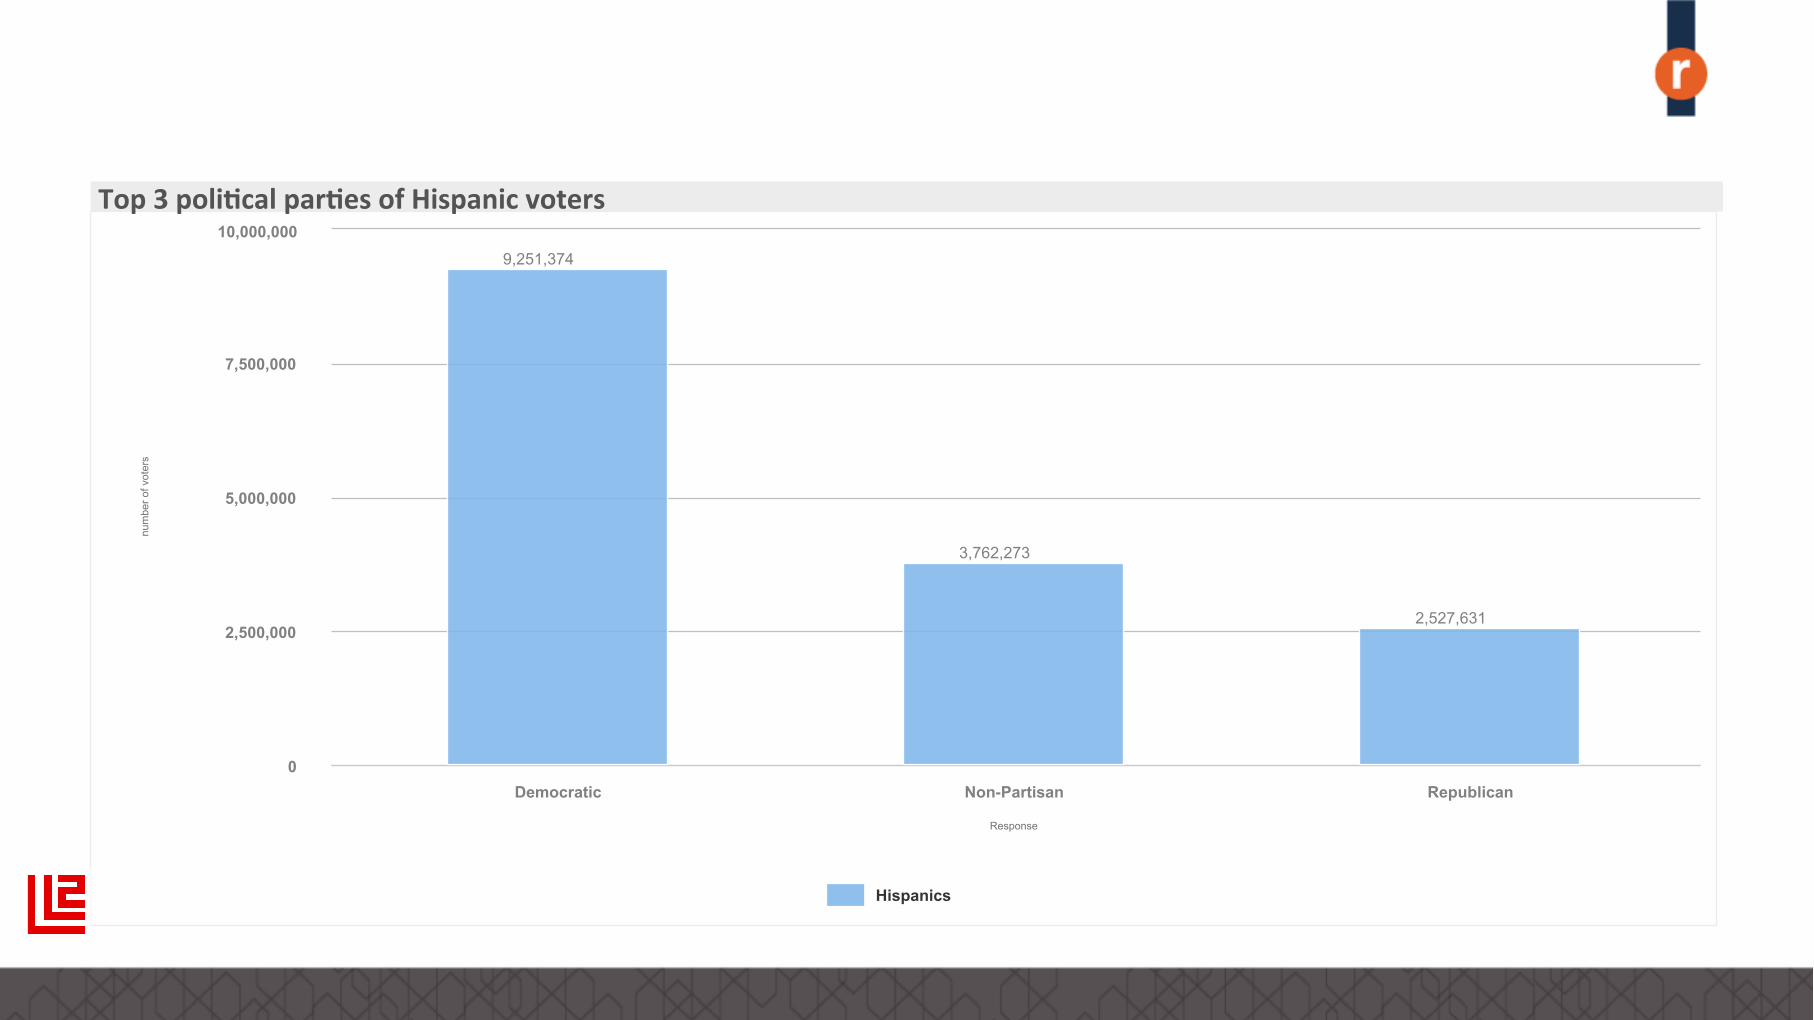
9,251,374
3,762,273
2,527,631
Hispanics
Democratic Non-Partisan Republican 0
10,000,000
2,500,000
5,000,000
7,500,000
Top 3 poli%cal par%es of Hispanic voters
Res
pons
e
number of voters (proportion)
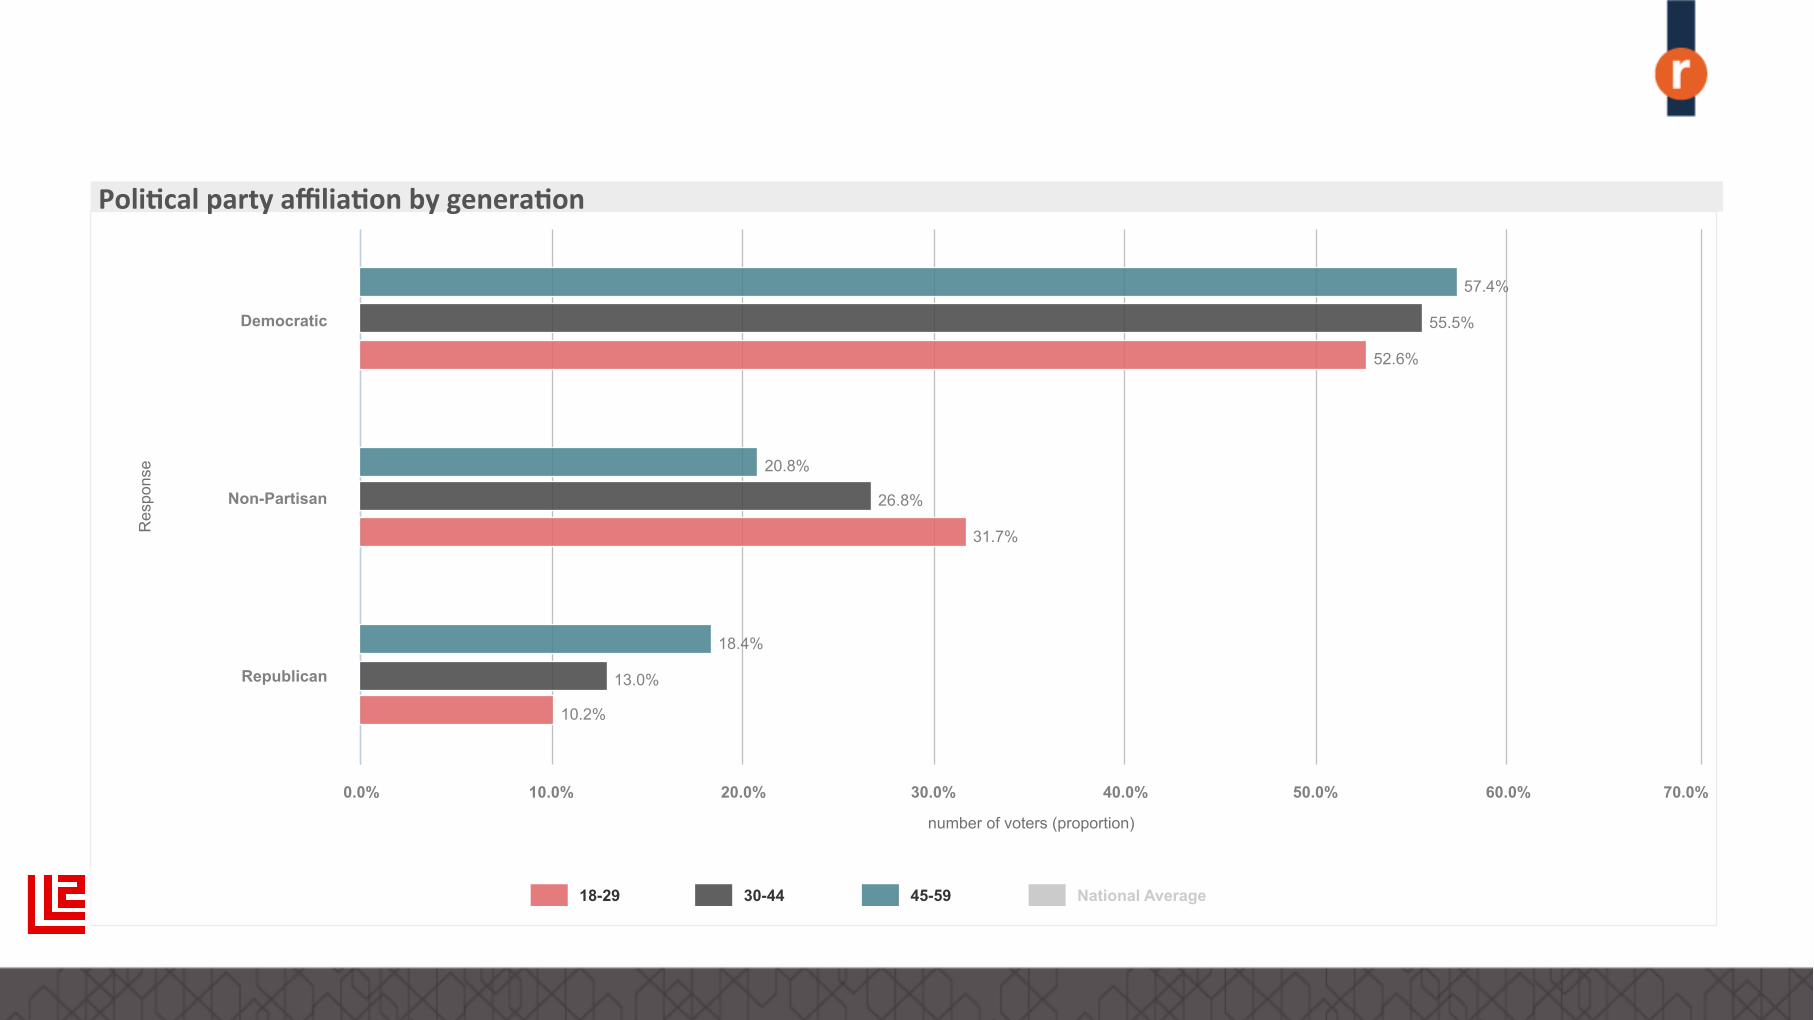
52.6%
31.7%
10.2%
55.5%
26.8%
13.0%
57.4%
20.8%
18.4%
18-29 30-44 45-59 National Average
Democratic
Non-Partisan
Republican
0.0% 10.0% 20.0% 30.0% 40.0% 50.0% 60.0% 70.0%
Poli%cal party affilia%on by genera%on
Response
num
ber o
f vot
ers
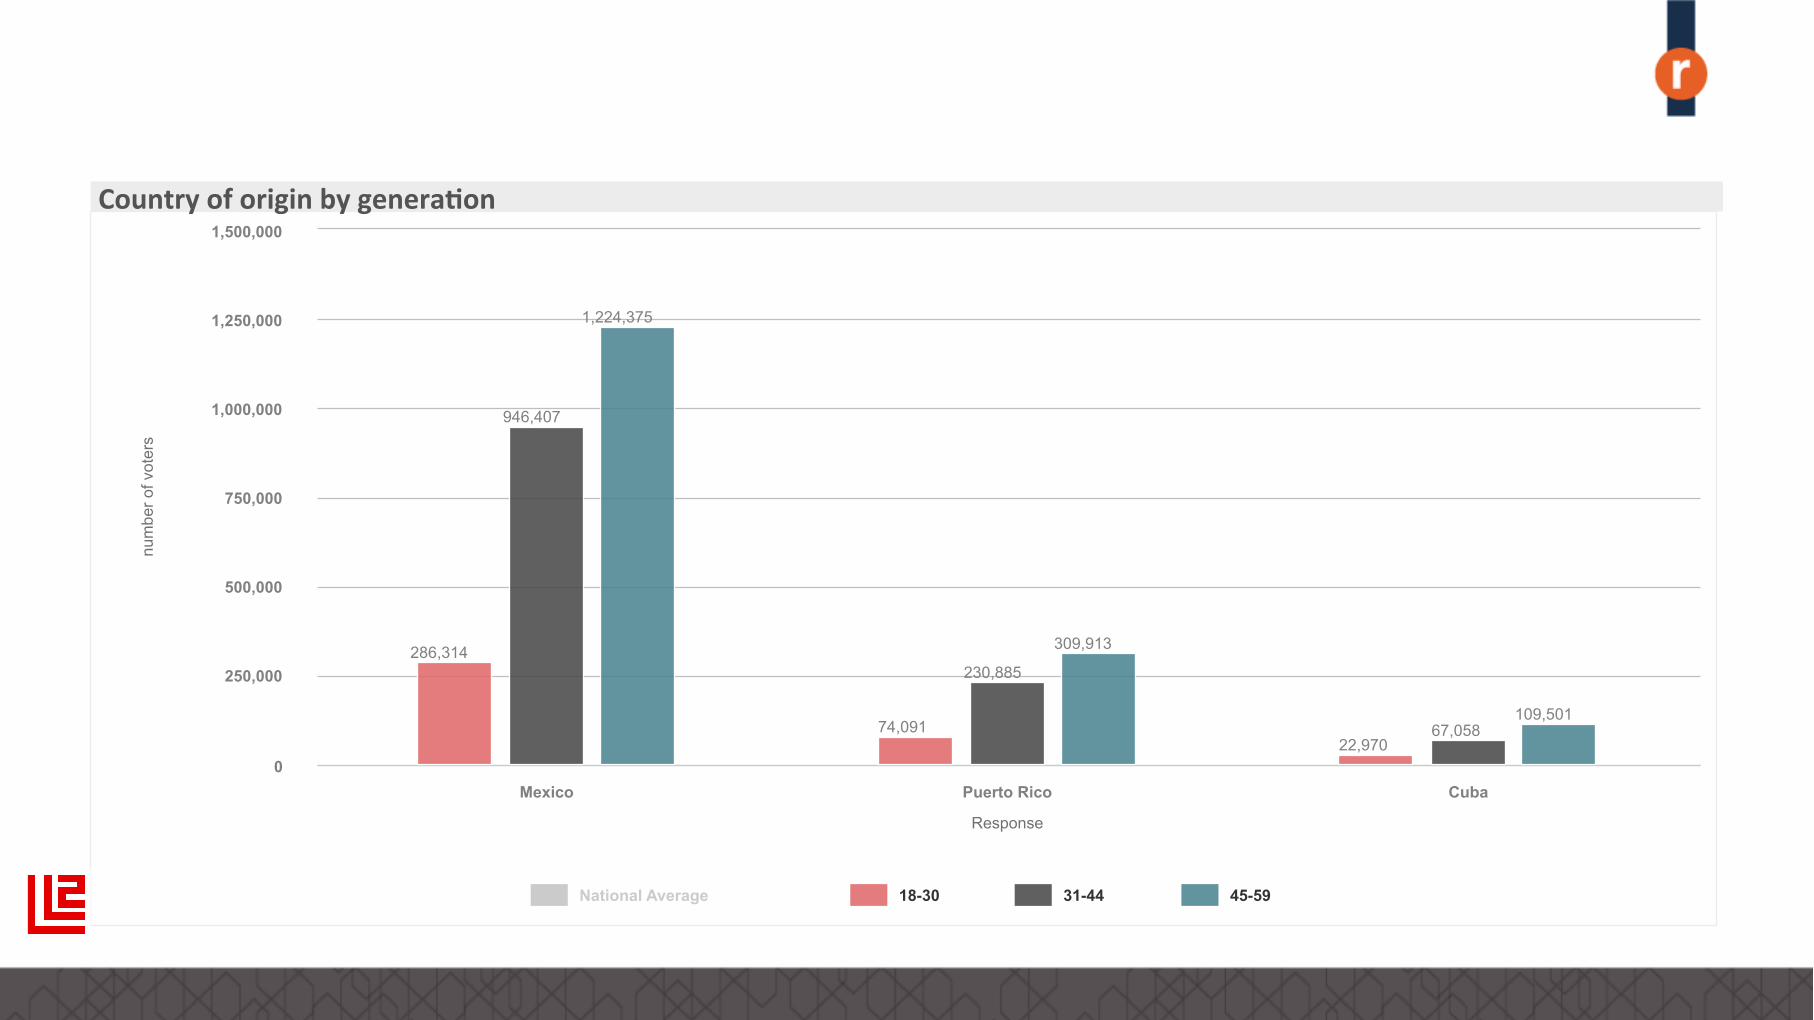
286,314
74,091 22,970
946,407
230,885
67,058
1,224,375
309,913
109,501
National Average 18-30 31-44 45-59
Mexico Puerto Rico Cuba 0
250,000
500,000
750,000
1,000,000
1,250,000
1,500,000
Country of origin by genera%on

Policy stances by generation
Res
pons
e
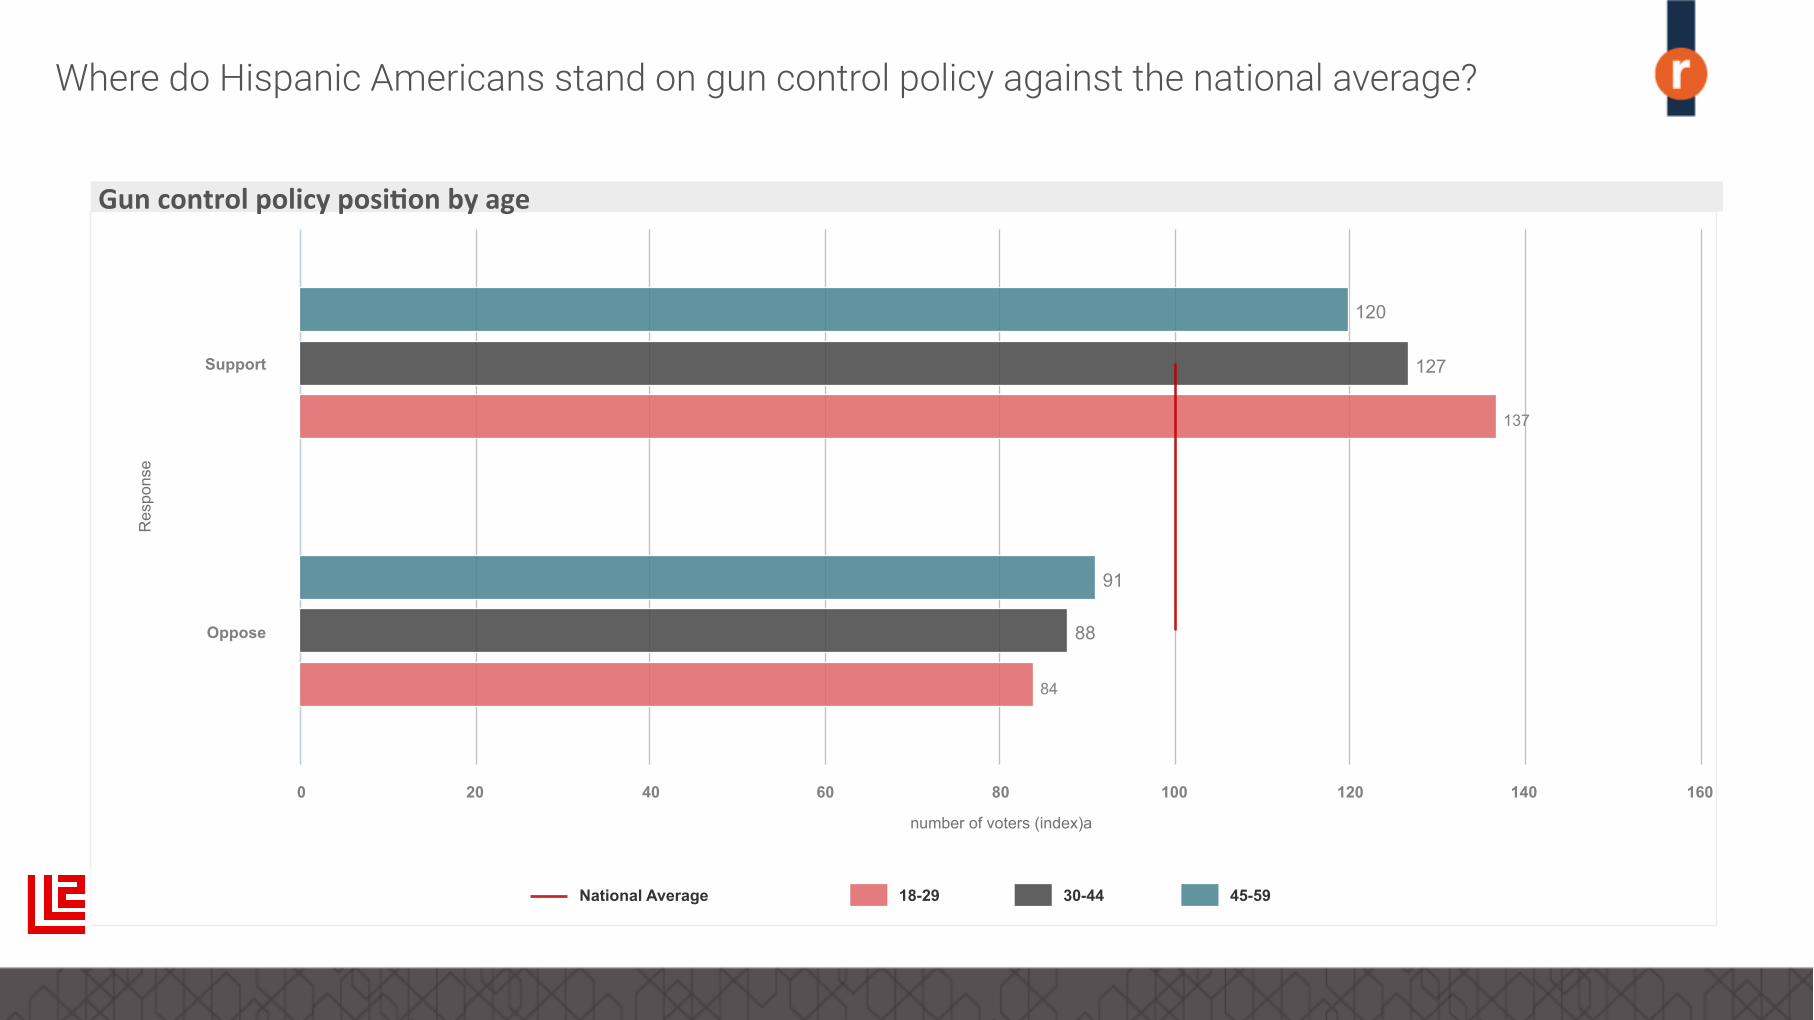
number of voters (index)a
137
84
127
88
120
91
National Average 18-29 30-44 45-59
Support
Oppose
0 20 40 60 80 100 120 140 160
Gun control policy posi%on by age
Where do Hispanic Americans stand on gun control policy against the national average?
Res
pons
e
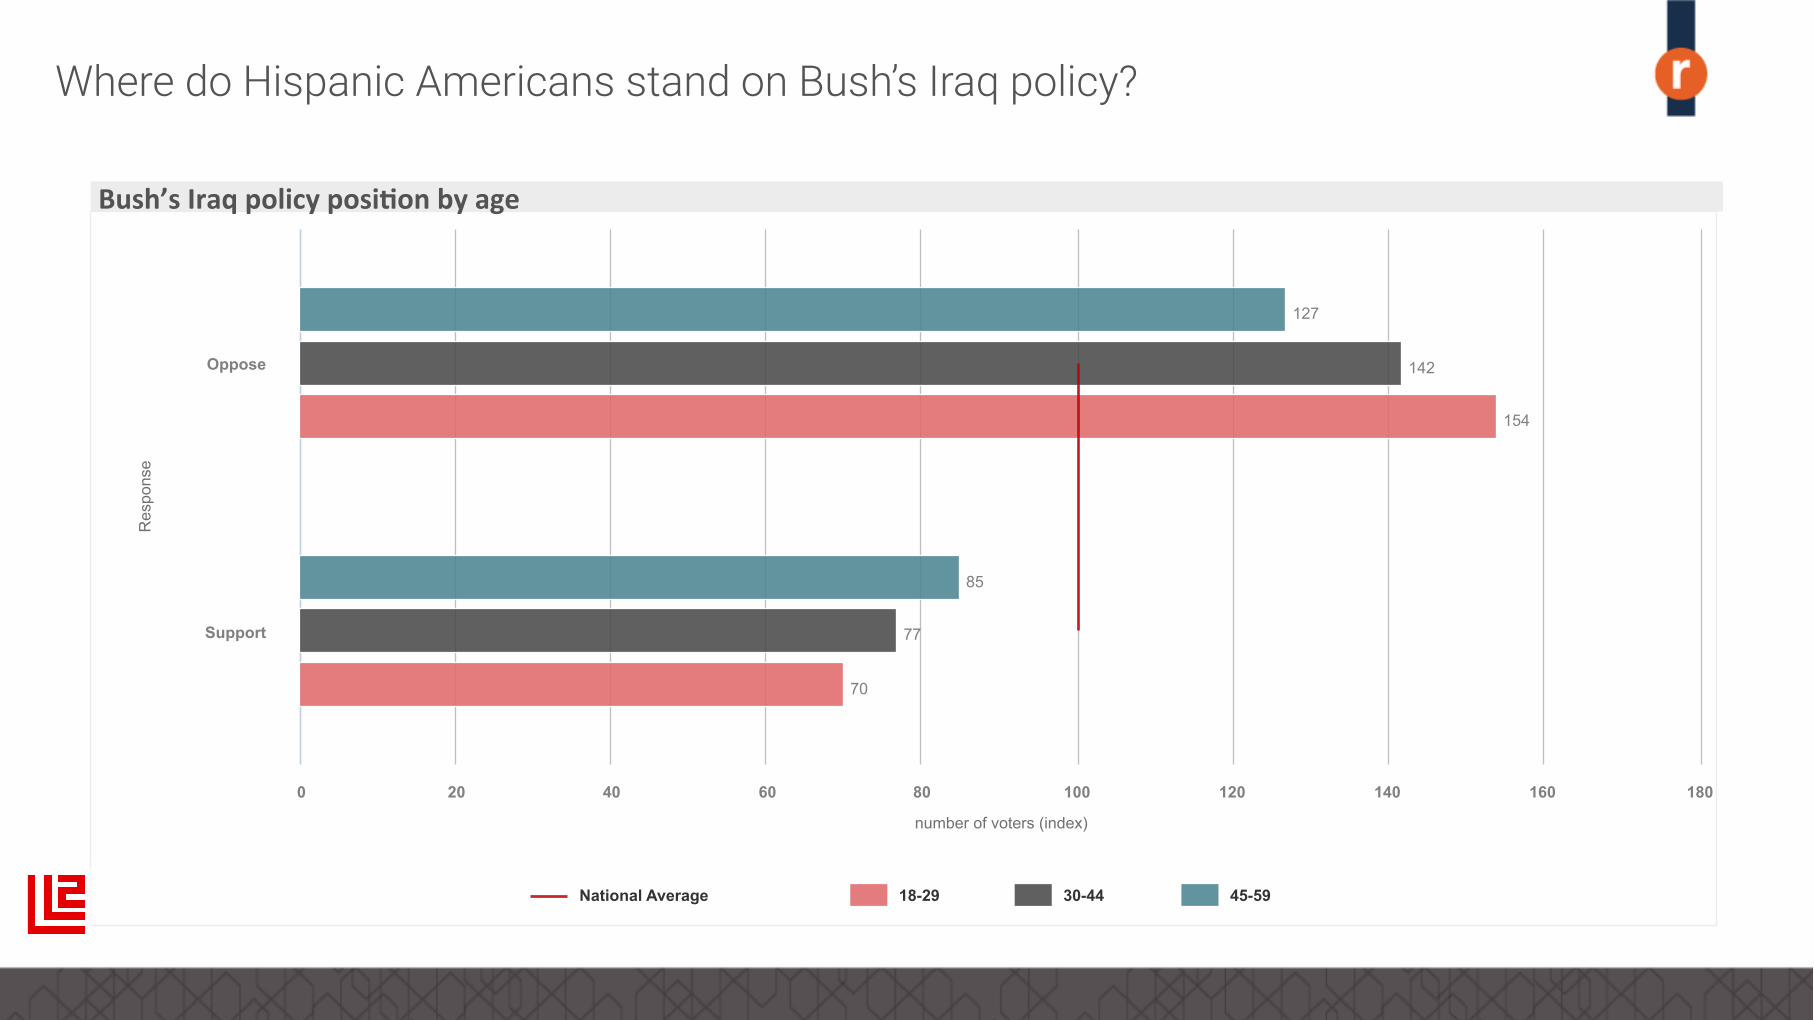
number of voters (index)
154
70
142
77
127
85
National Average 18-29 30-44 45-59
Oppose
Support
0 20 40 60 80 100 120 140 160 180
Bush’s Iraq policy posi%on by age
Where do Hispanic Americans stand on Bush’s Iraq policy?
Res
pons
e
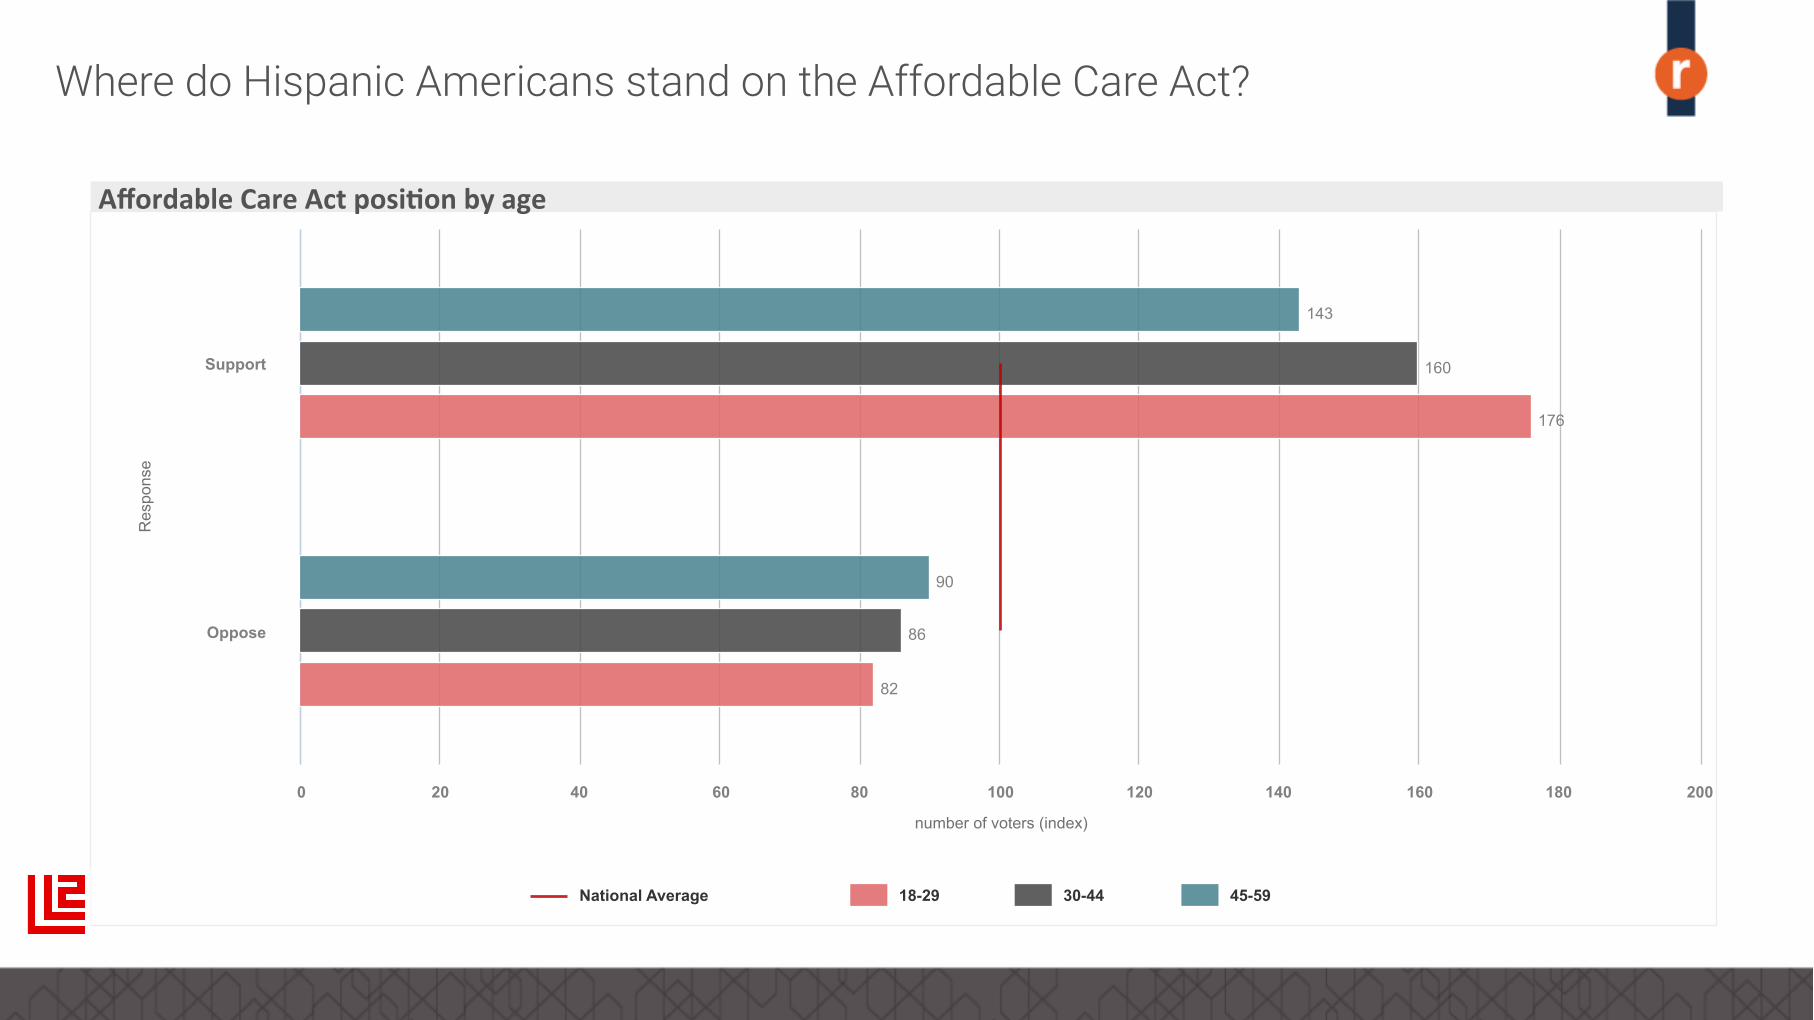
number of voters (index)
176
82
160
86
143
90
National Average 18-29 30-44 45-59
Support
Oppose
0 20 40 60 80 100 120 140 160 180 200
Affordable Care Act posi%on by age
Where do Hispanic Americans stand on the Affordable Care Act?
Res
pons
e
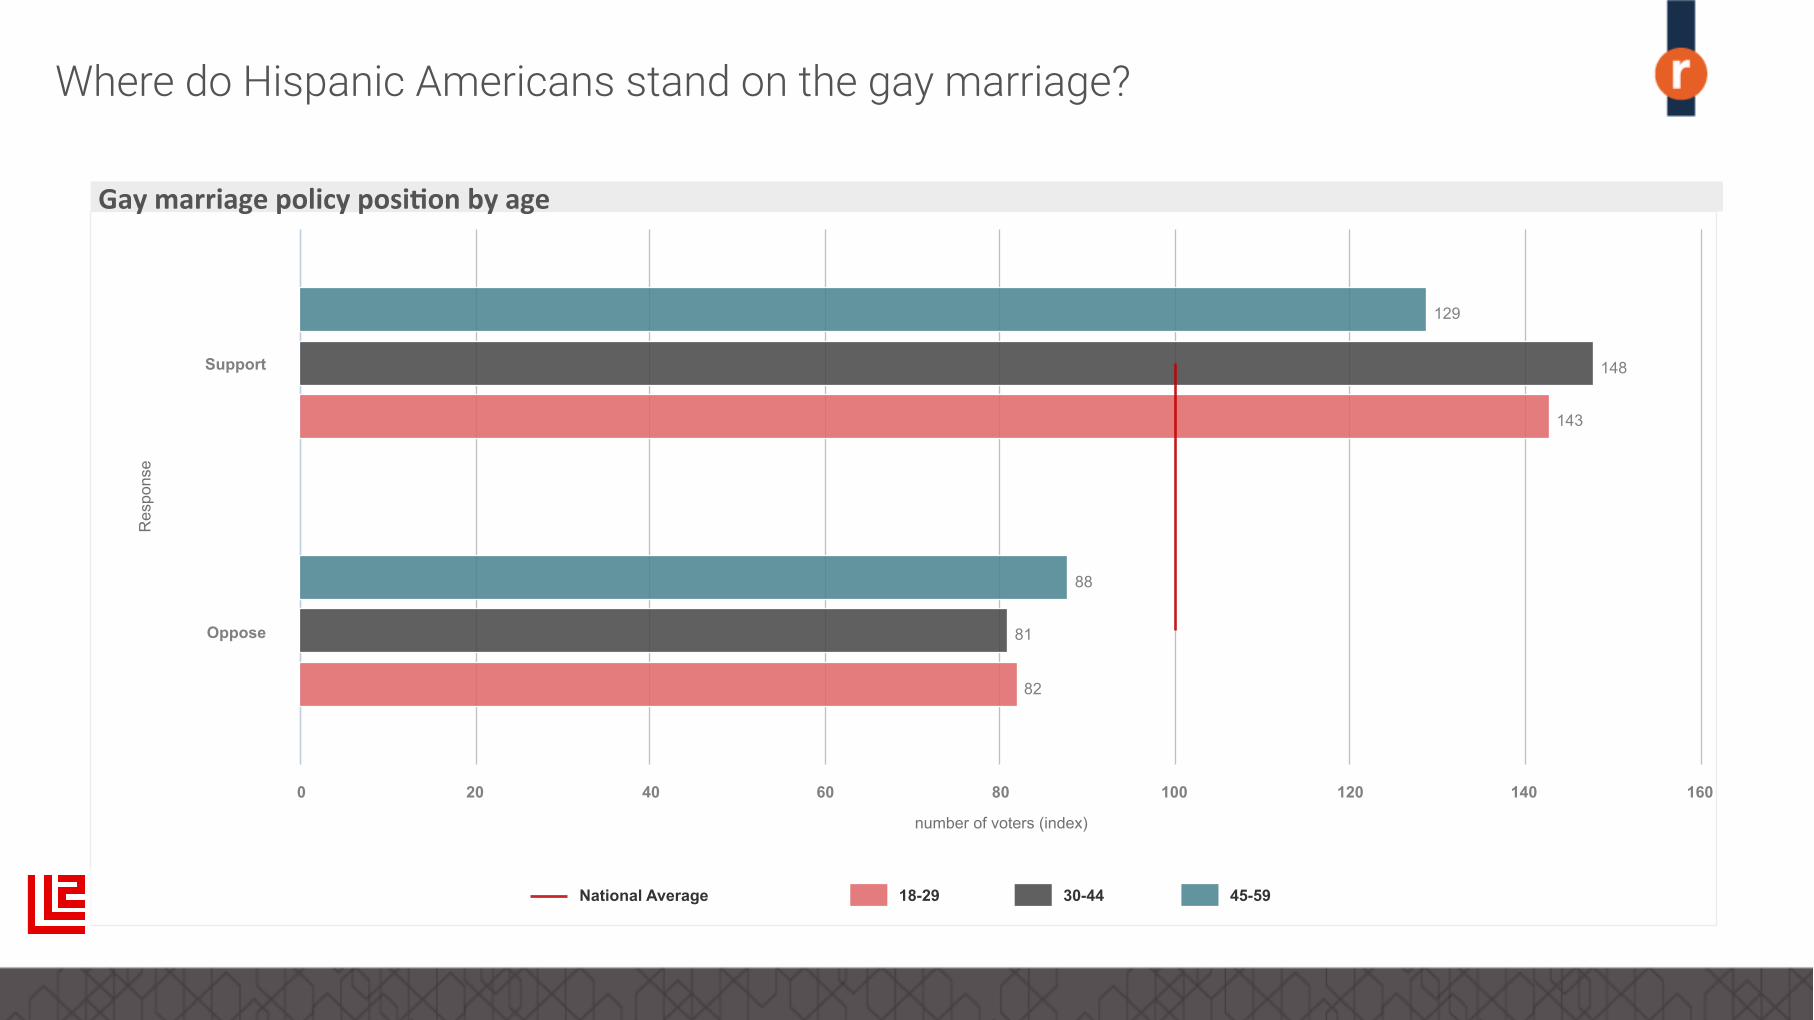
number of voters (index)
143
82
148
81
129
88
National Average 18-29 30-44 45-59
Support
Oppose
0 20 40 60 80 100 120 140 160
Gay marriage policy posi%on by age
Where do Hispanic Americans stand on the gay marriage?
Res
pons
e
number of voters (index)
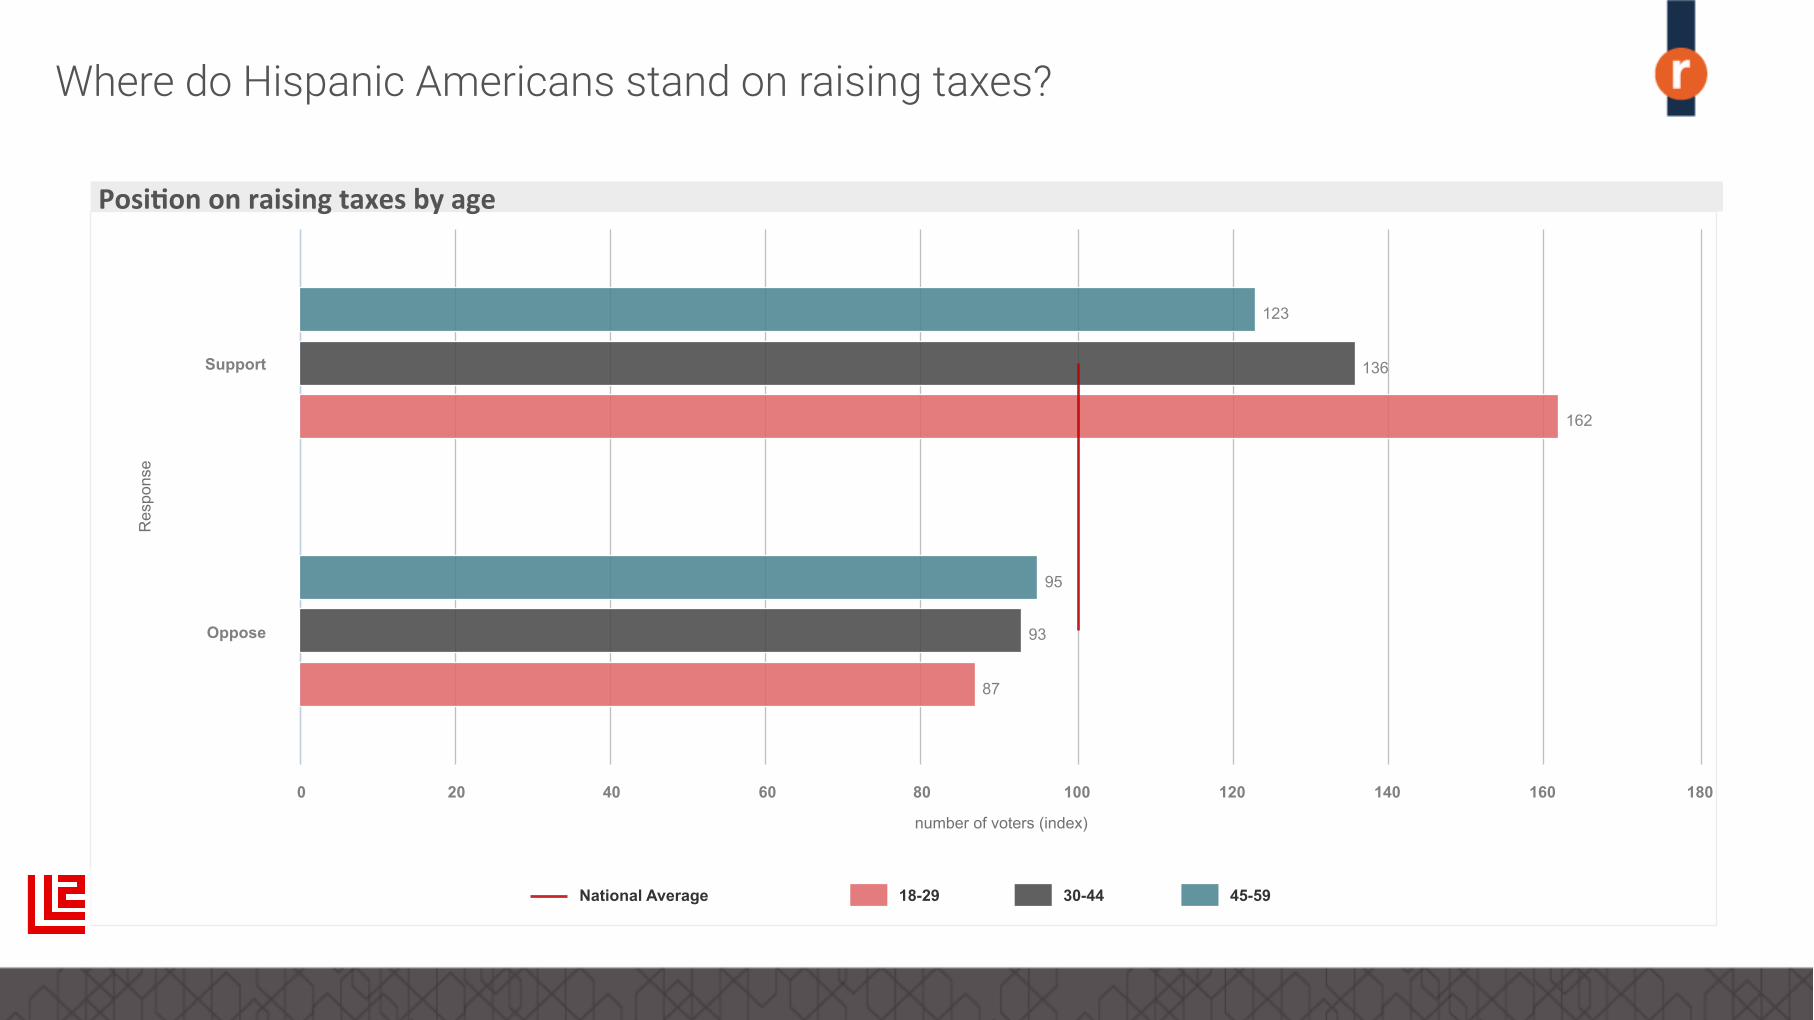
162
87
136
93
123
95
National Average 18-29 30-44 45-59
Support
Oppose
0 20 40 60 80 100 120 140 160 180
Posi%on on raising taxes by age
Where do Hispanic Americans stand on raising taxes?

Education levels
Res
pons
e
number of voters (index)
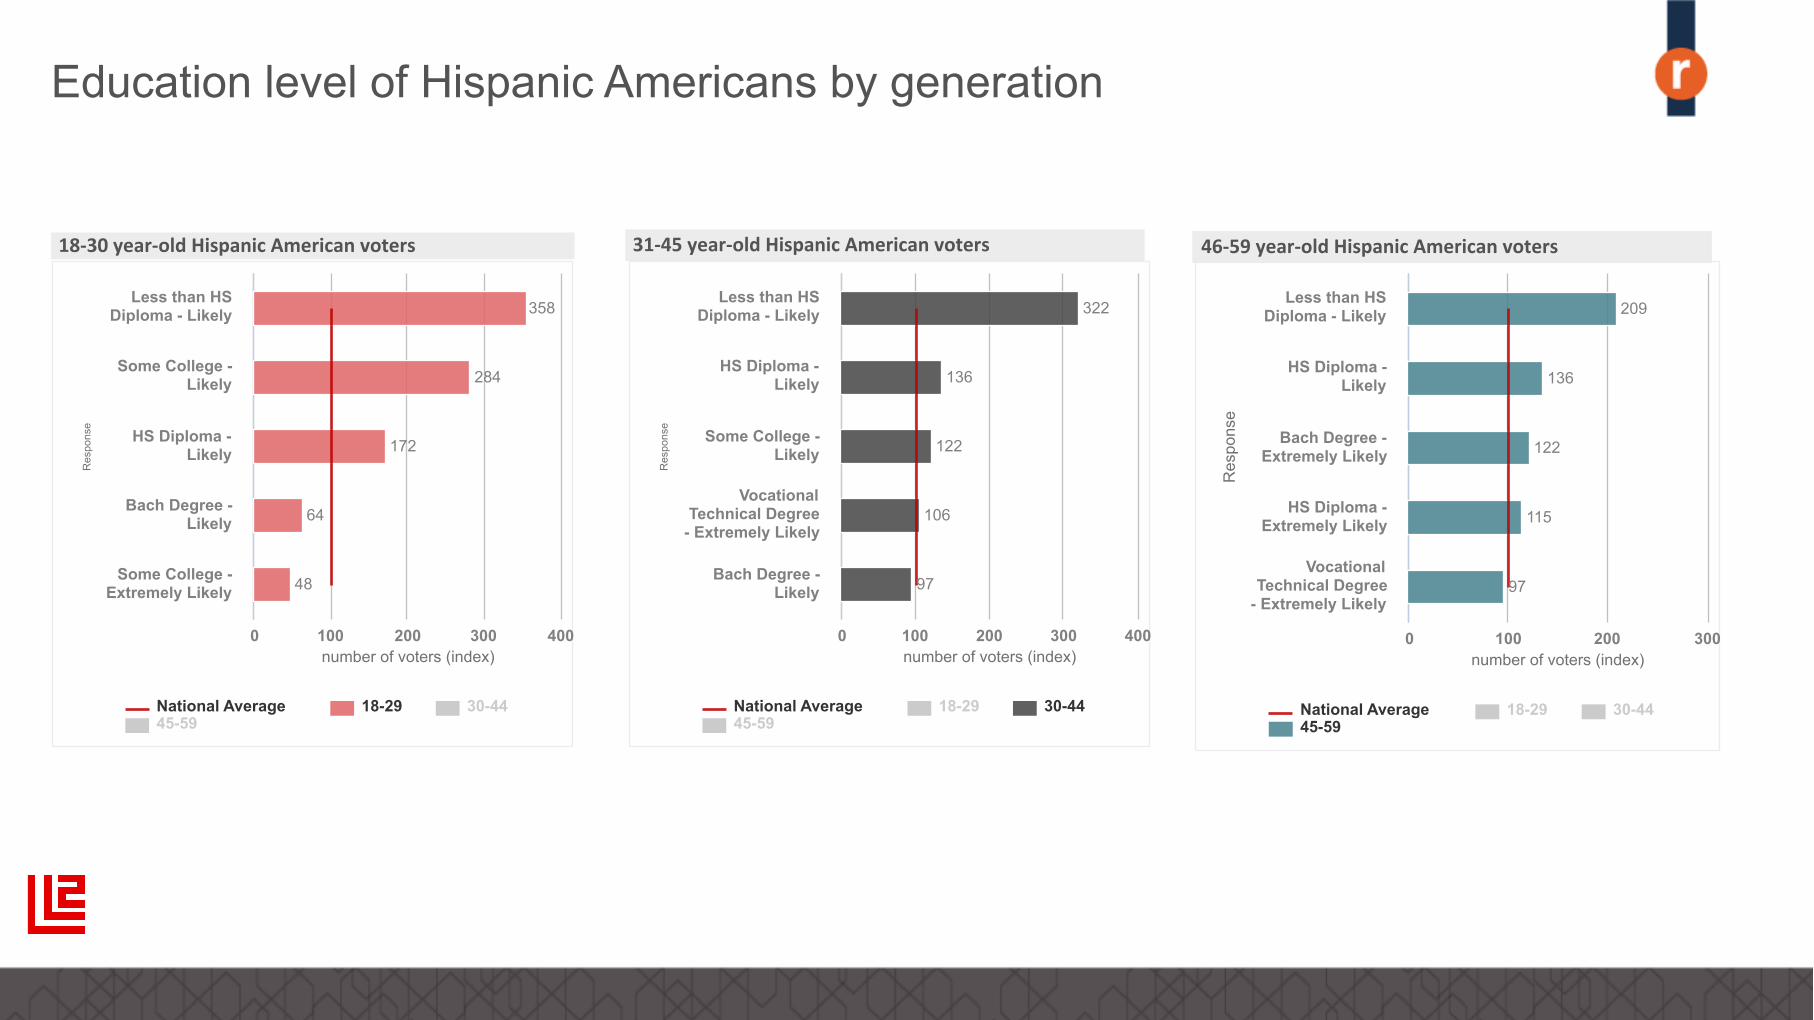
358
284
172
64
48
National Average 18-29 30-44 45-59
Less than HS Diploma - Likely
Some College - Likely
HS Diploma - Likely
Bach Degree - Likely
Some College - Extremely Likely
0 100 200 300 400
18-‐30 year-‐old Hispanic American voters
Res
pons
e number of voters (index)
322
136
122
106
97
National Average 18-29 30-44 45-59
Less than HS Diploma - Likely
HS Diploma - Likely
Some College - Likely
Vocational Technical Degree
- Extremely Likely
Bach Degree - Likely
0 100 200 300 400
31-‐45 year-‐old Hispanic American voters
Education level of Hispanic Americans by generation
Res
pons
e
number of voters (index)
209
136
122
115
97
National Average 18-29 30-44 45-59
Less than HS Diploma - Likely
HS Diploma - Likely
Bach Degree - Extremely Likely
HS Diploma - Extremely Likely
Vocational Technical Degree
- Extremely Likely
0 100 200 300
46-‐59 year-‐old Hispanic American voters
Res
pons
e
number of voters (index)
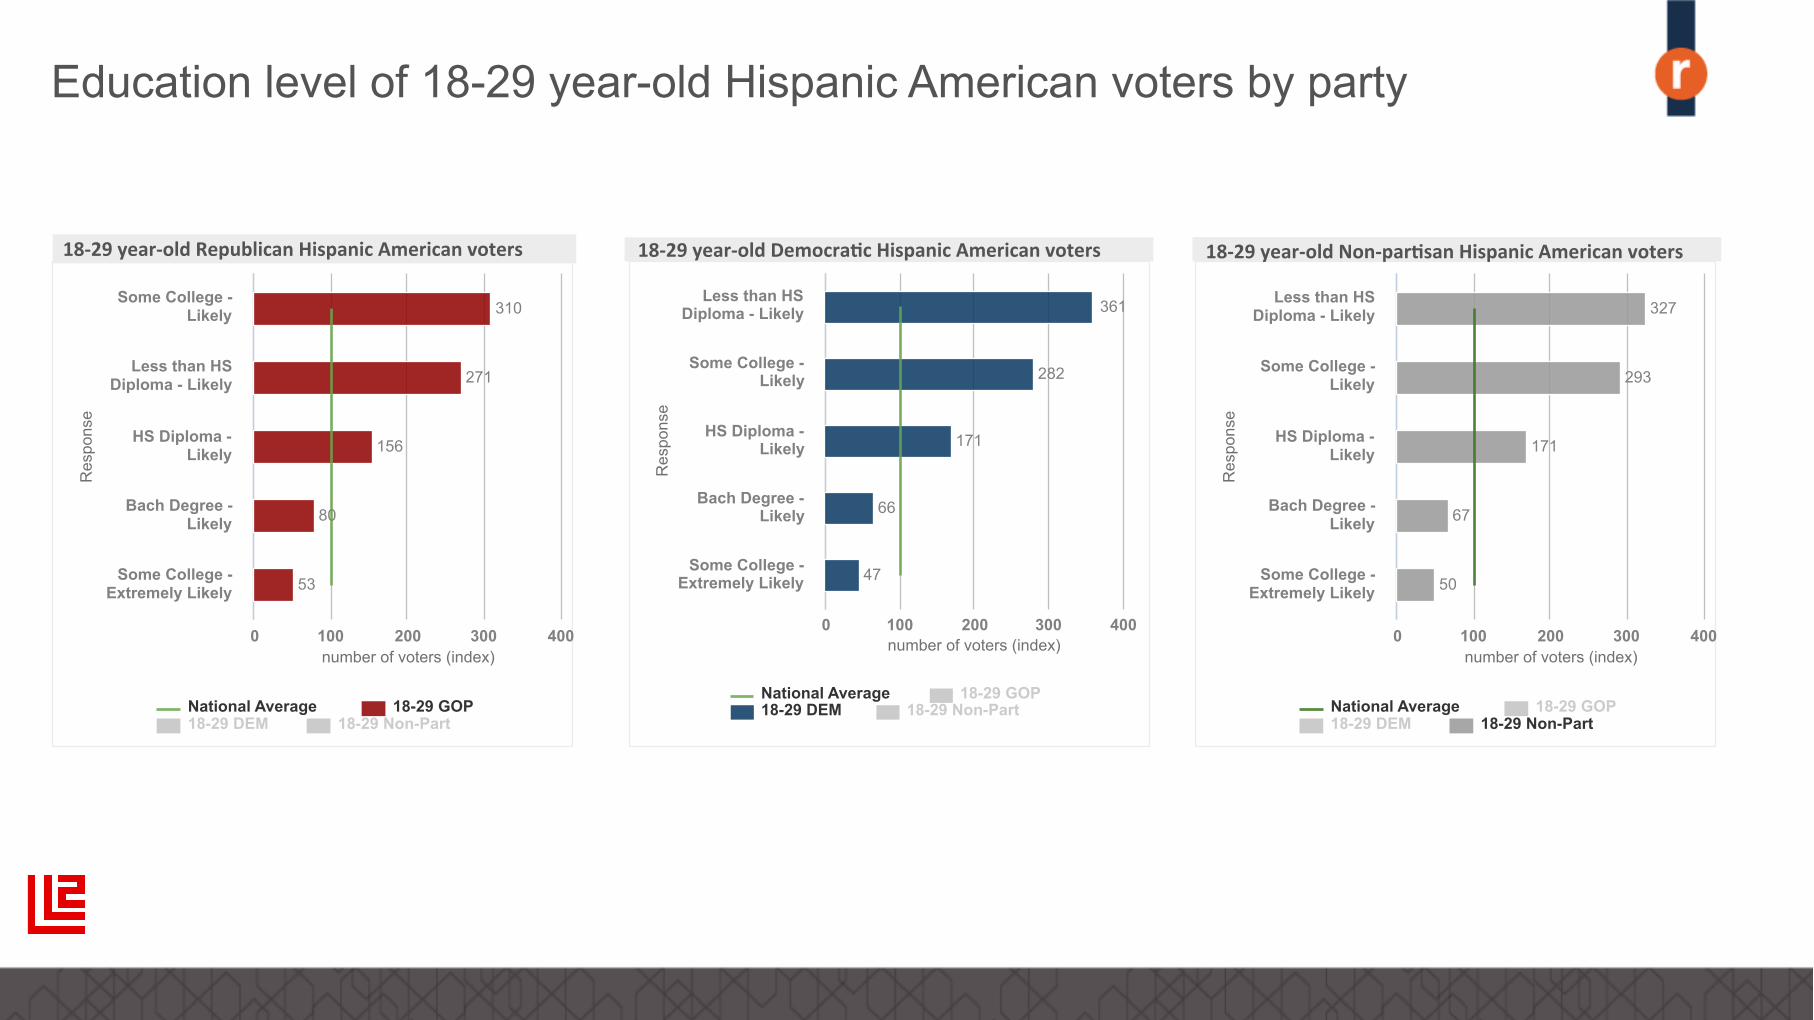
310
271
156
80
53
National Average 18-29 GOP 18-29 DEM 18-29 Non-Part
Some College - Likely
Less than HS Diploma - Likely
HS Diploma - Likely
Bach Degree - Likely
Some College - Extremely Likely
0 100 200 300 400
18-‐29 year-‐old Republican Hispanic American voters
Res
pons
e number of voters (index)
361
282
171
66
47
National Average 18-29 GOP 18-29 DEM 18-29 Non-Part
Less than HS Diploma - Likely
Some College - Likely
HS Diploma - Likely
Bach Degree - Likely
Some College - Extremely Likely
0 100 200 300 400
18-‐29 year-‐old Democra%c Hispanic American voters
Education level of 18-29 year-old Hispanic American voters by party
Res
pons
e
number of voters (index)
327
293
171
67
50
National Average 18-29 GOP 18-29 DEM 18-29 Non-Part
Less than HS Diploma - Likely
Some College - Likely
HS Diploma - Likely
Bach Degree - Likely
Some College - Extremely Likely
0 100 200 300 400
18-‐29 year-‐old Non-‐par%san Hispanic American voters
Res
pons
e
number of voters (index)
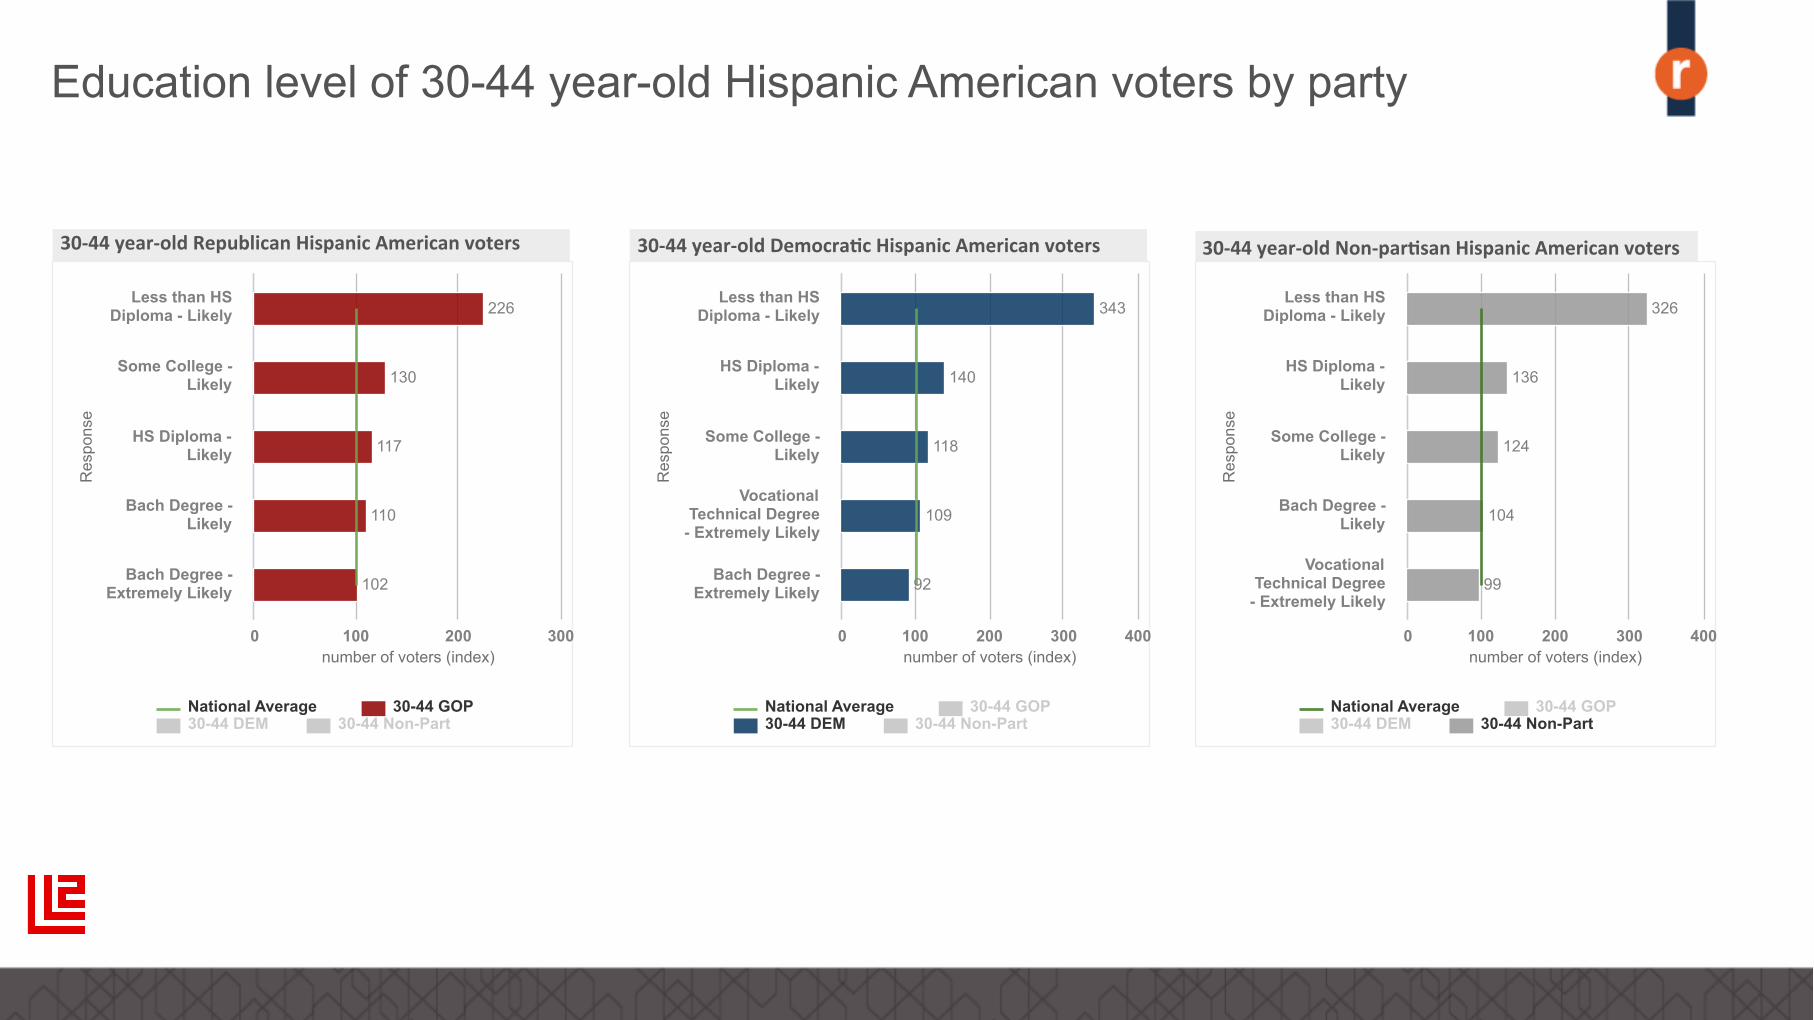
226
130
117
110
102
National Average 30-44 GOP 30-44 DEM 30-44 Non-Part
Less than HS Diploma - Likely
Some College - Likely
HS Diploma - Likely
Bach Degree - Likely
Bach Degree - Extremely Likely
0 100 200 300
30-‐44 year-‐old Republican Hispanic American voters
Res
pons
e number of voters (index)
343
140
118
109
92
National Average 30-44 GOP 30-44 DEM 30-44 Non-Part
Less than HS Diploma - Likely
HS Diploma - Likely
Some College - Likely
Vocational Technical Degree
- Extremely Likely
Bach Degree - Extremely Likely
0 100 200 300 400
30-‐44 year-‐old Democra%c Hispanic American voters
Education level of 30-44 year-old Hispanic American voters by party
Res
pons
e
number of voters (index)
326
136
124
104
99
National Average 30-44 GOP 30-44 DEM 30-44 Non-Part
Less than HS Diploma - Likely
HS Diploma - Likely
Some College - Likely
Bach Degree - Likely
Vocational Technical Degree
- Extremely Likely
0 100 200 300 400
30-‐44 year-‐old Non-‐par%san Hispanic American voters
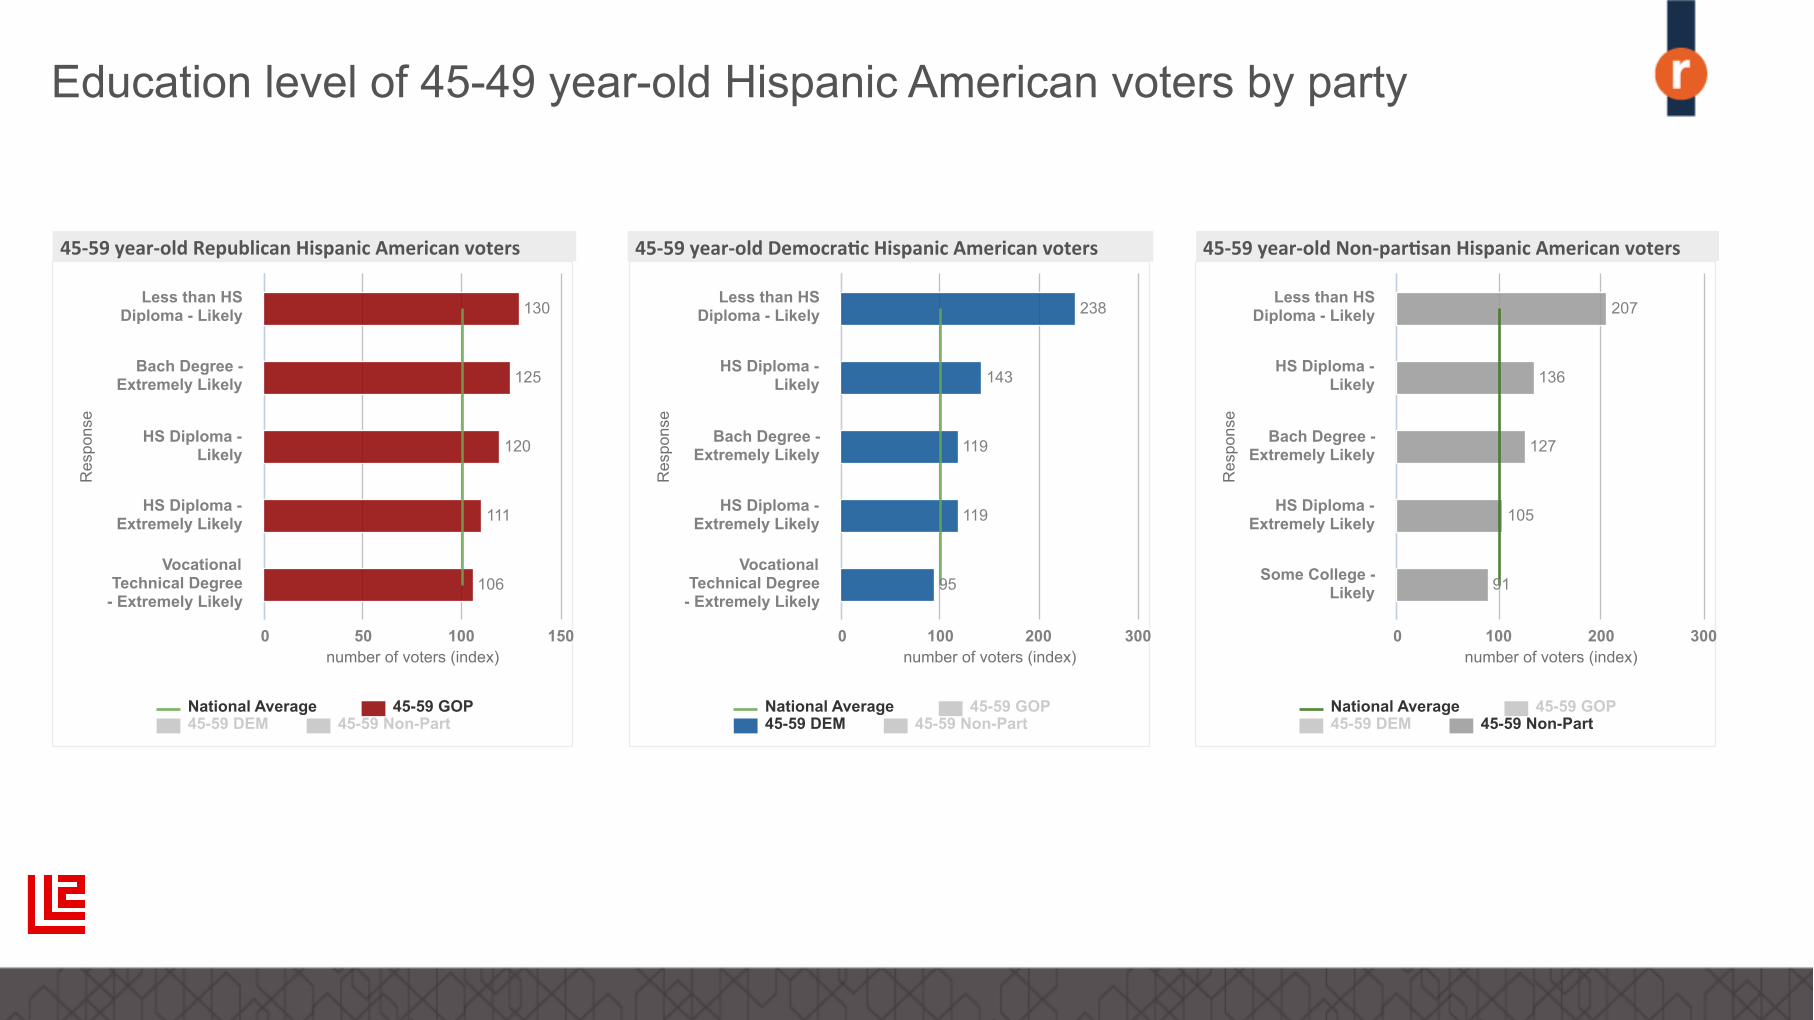
Res
pons
e
number of voters (index)
130
125
120
111
106
National Average 45-59 GOP 45-59 DEM 45-59 Non-Part
Less than HS Diploma - Likely
Bach Degree - Extremely Likely
HS Diploma - Likely
HS Diploma - Extremely Likely
Vocational Technical Degree
- Extremely Likely
0 50 100 150
45-‐59 year-‐old Republican Hispanic American voters
Res
pons
e number of voters (index)
238
143
119
119
95
National Average 45-59 GOP 45-59 DEM 45-59 Non-Part
Less than HS Diploma - Likely
HS Diploma - Likely
Bach Degree - Extremely Likely
HS Diploma - Extremely Likely
Vocational Technical Degree
- Extremely Likely
0 100 200 300
45-‐59 year-‐old Democra%c Hispanic American voters
Education level of 45-49 year-old Hispanic American voters by party
Res
pons
e
number of voters (index)
207
136
127
105
91
National Average 45-59 GOP 45-59 DEM 45-59 Non-Part
Less than HS Diploma - Likely
HS Diploma - Likely
Bach Degree - Extremely Likely
HS Diploma - Extremely Likely
Some College - Likely
0 100 200 300
45-‐59 year-‐old Non-‐par%san Hispanic American voters

Media Consumption Behaviors
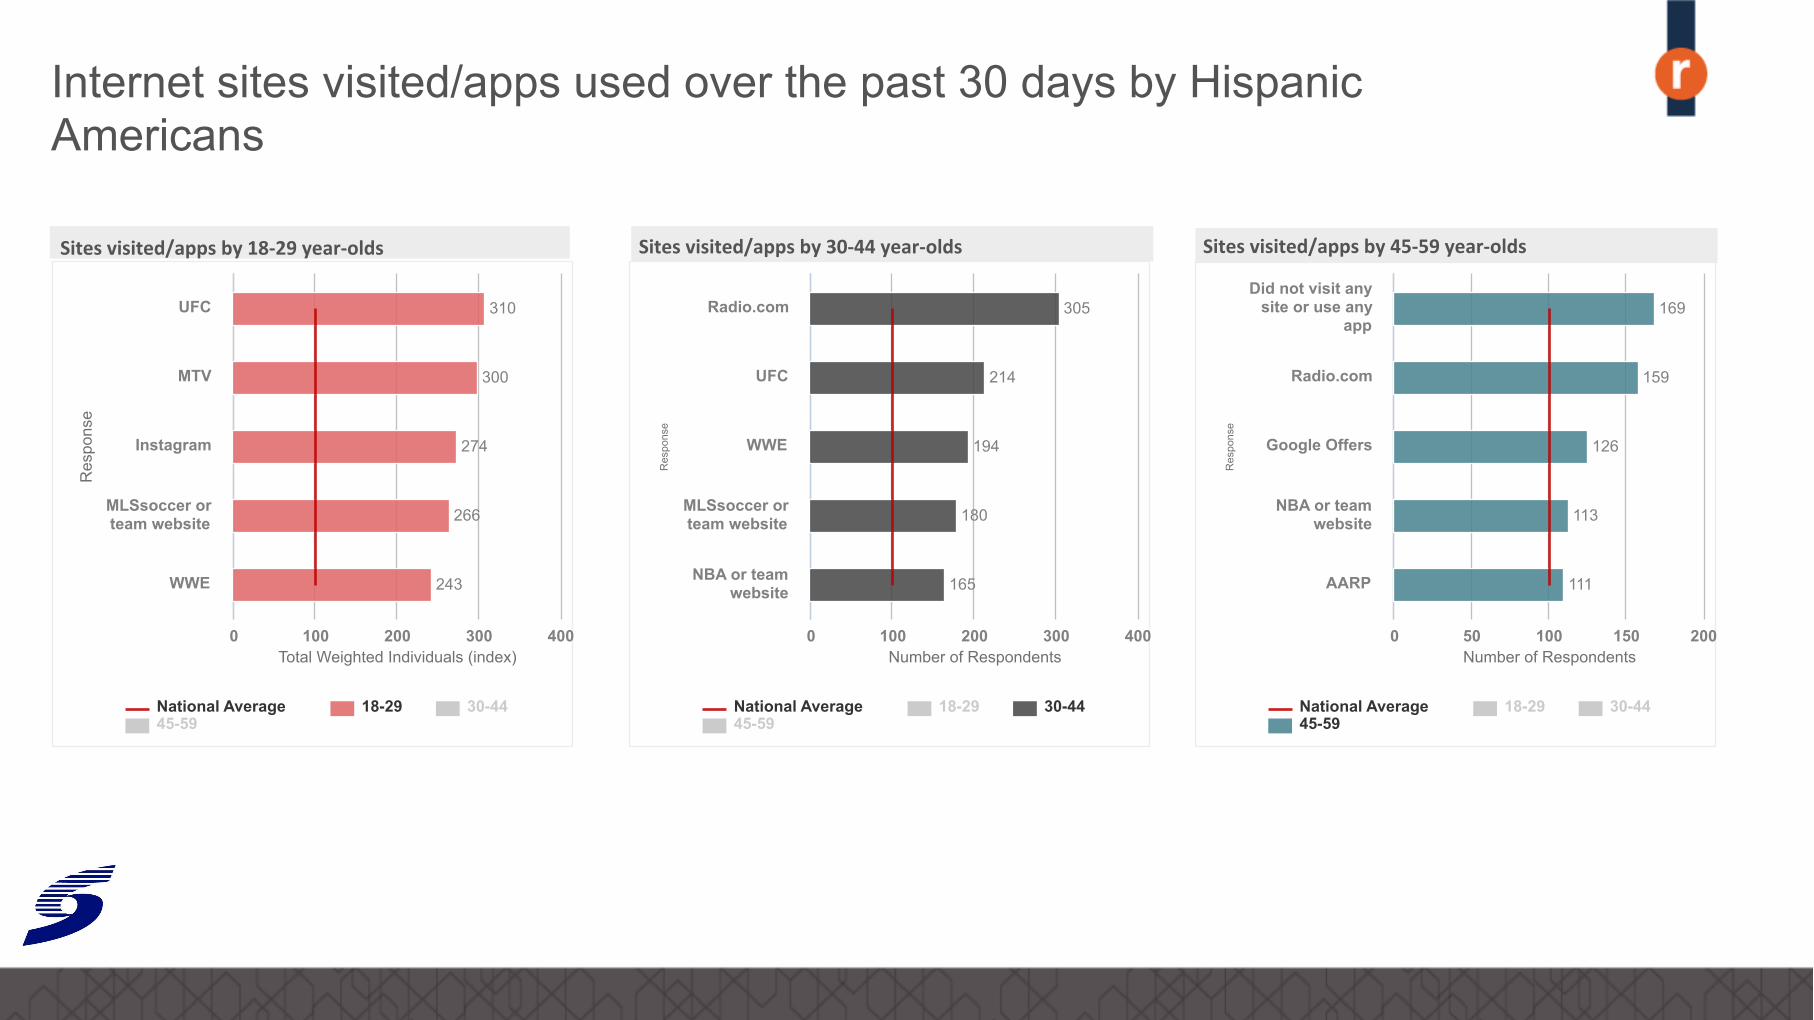
Res
pons
e
Total Weighted Individuals (index)
310
300
274
266
243
National Average 18-29 30-44 45-59
UFC
MTV
MLSsoccer or team website
WWE
0 100 200 300 400
Sites visited/apps by 18-‐29 year-‐olds
Res
pons
e Number of Respondents
305
214
194
180
165
National Average 18-29 30-44 45-59
Radio.com
UFC
WWE
MLSsoccer or team website
NBA or team website
0 100 200 300 400
Sites visited/apps by 30-‐44 year-‐olds
Internet sites visited/apps used over the past 30 days by Hispanic Americans
Res
pons
e
Number of Respondents
169
159
126
113
111
National Average 18-29 30-44 45-59
Did not visit any site or use any
app
Radio.com
Google Offers
NBA or team website
AARP
0 50 100 150 200
Sites visited/apps by 45-‐59 year-‐olds
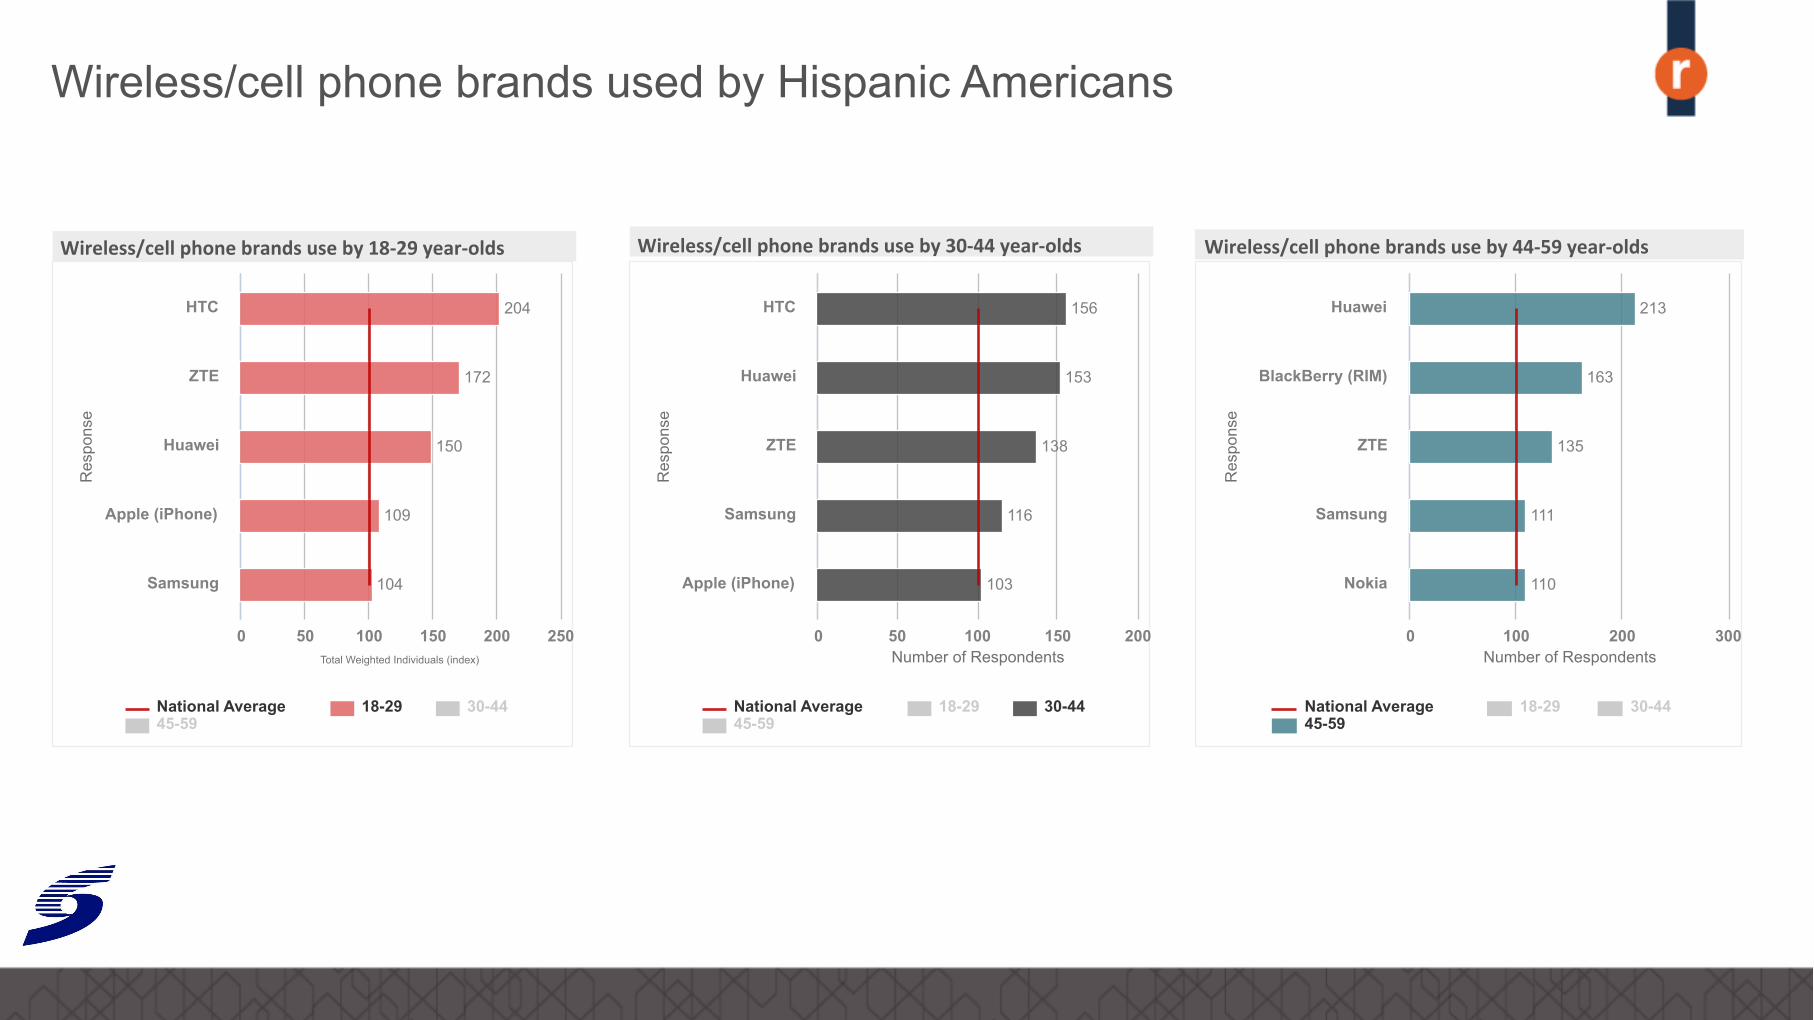
Res
pons
e
Total Weighted Individuals (index)
204
172
150
109
104
National Average 18-29 30-44 45-59
HTC
ZTE
Huawei
Apple (iPhone)
Samsung
0 50 100 150 200 250
Wireless/cell phone brands use by 18-‐29 year-‐olds
Res
pons
e Number of Respondents
156
153
138
116
103
National Average 18-29 30-44 45-59
HTC
Huawei
ZTE
Samsung
Apple (iPhone)
0 50 100 150 200
Wireless/cell phone brands use by 30-‐44 year-‐olds
Wireless/cell phone brands used by Hispanic Americans
Res
pons
e
Number of Respondents
213
163
135
111
110
National Average 18-29 30-44 45-59
Huawei
BlackBerry (RIM)
ZTE
Samsung
Nokia
0 100 200 300
Wireless/cell phone brands use by 44-‐59 year-‐olds
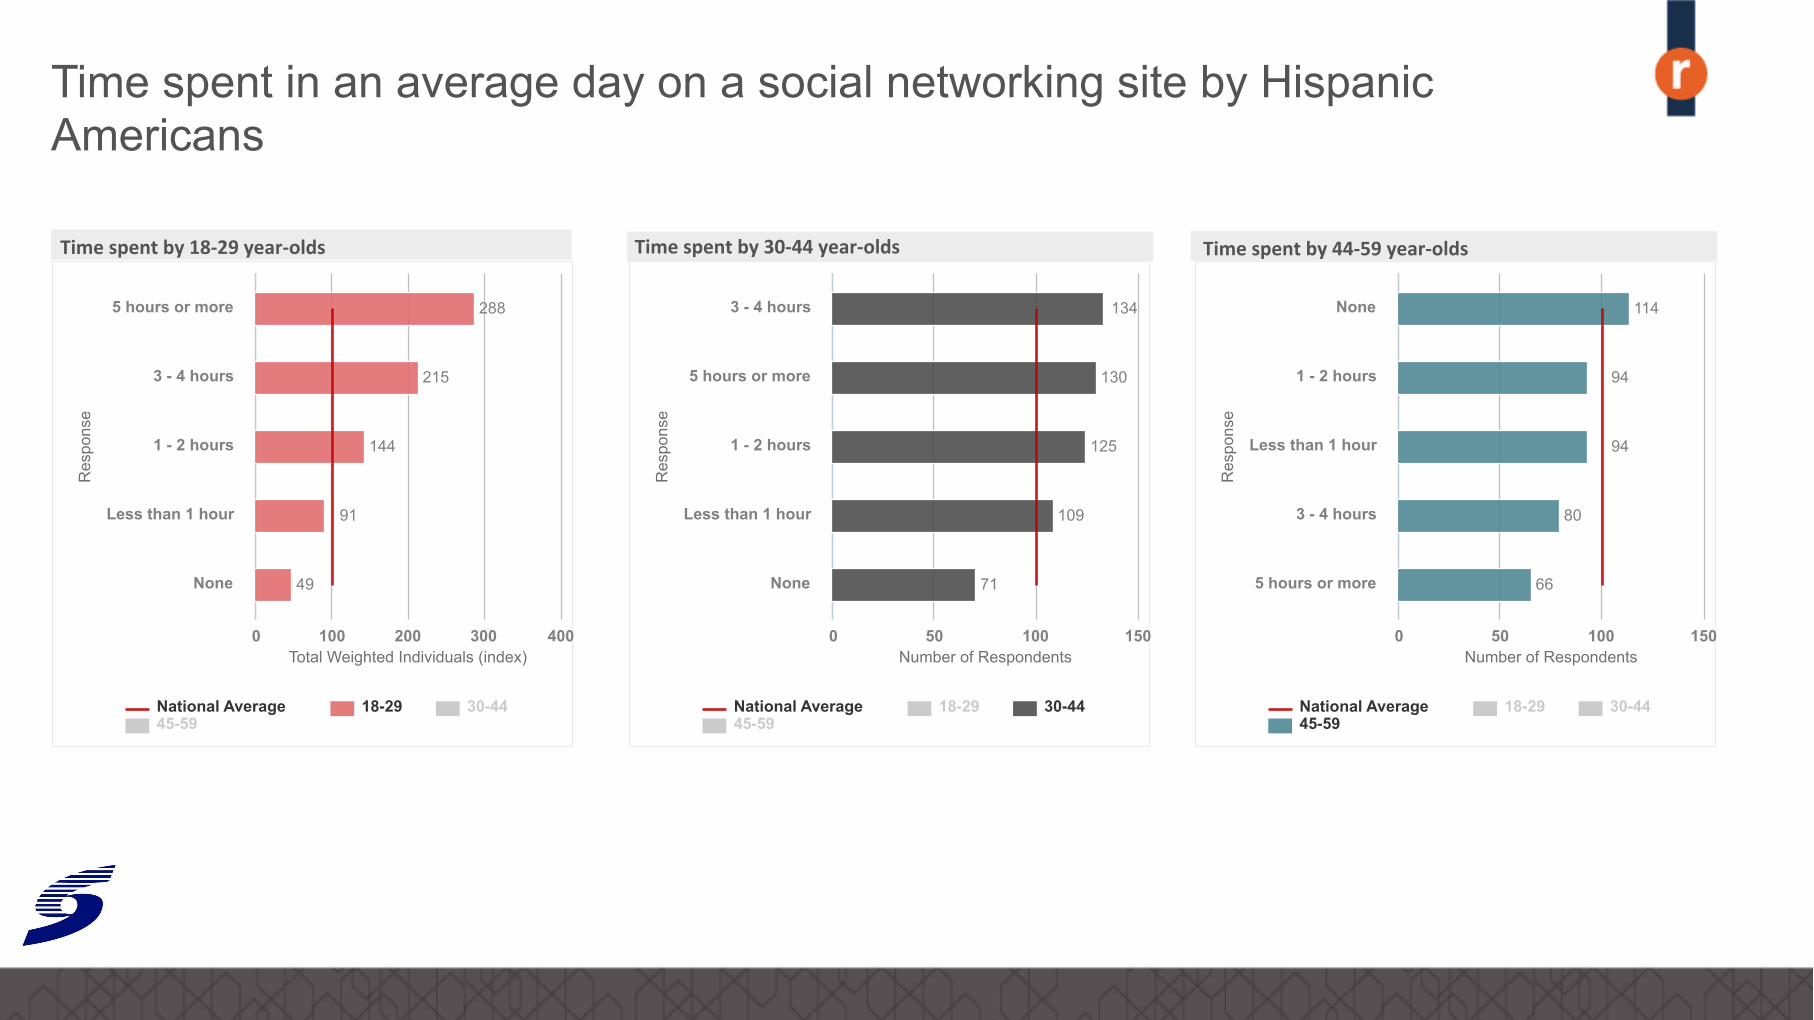
Res
pons
e
Total Weighted Individuals (index)
288
215
144
91
49
National Average 18-29 30-44 45-59
5 hours or more
3 - 4 hours
1 - 2 hours
Less than 1 hour
None
0 100 200 300 400
Time spent by 18-‐29 year-‐olds
Res
pons
e Number of Respondents
134
130
125
109
71
National Average 18-29 30-44 45-59
3 - 4 hours
5 hours or more
1 - 2 hours
Less than 1 hour
None
0 50 100 150
Time spent by 30-‐44 year-‐olds
Time spent in an average day on a social networking site by Hispanic Americans
Res
pons
e
Number of Respondents
114
94
94
80
66
National Average 18-29 30-44 45-59
None
1 - 2 hours
Less than 1 hour
3 - 4 hours
5 hours or more
0 50 100 150
Time spent by 44-‐59 year-‐olds
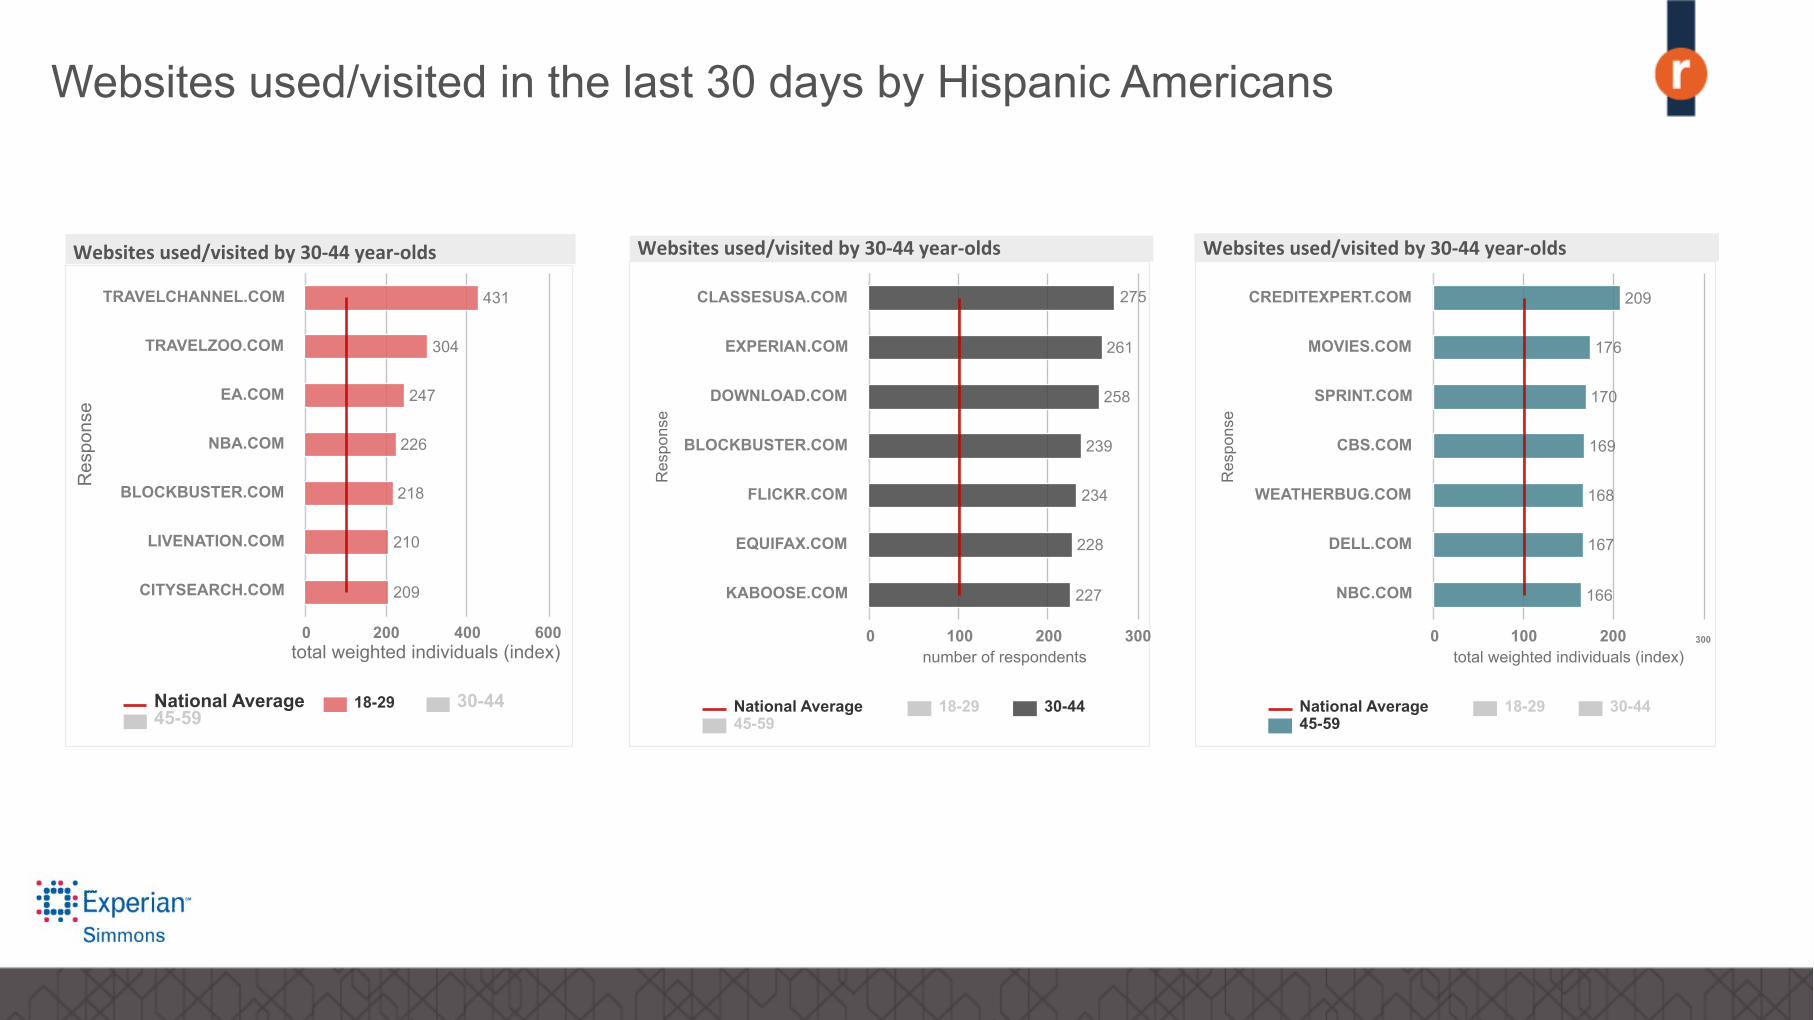
Res
pons
e
total weighted individuals (index)
431
304
247
226
218
210
209
National Average 18-29 30-44 45-59
TRAVELCHANNEL.COM
TRAVELZOO.COM
EA.COM
NBA.COM
BLOCKBUSTER.COM
LIVENATION.COM
CITYSEARCH.COM
0 200 400 600
Websites used/visited by 30-‐44 year-‐olds
Res
pons
e number of respondents
275
261
258
239
234
228
227
National Average 18-29 30-44 45-59
CLASSESUSA.COM
EXPERIAN.COM
DOWNLOAD.COM
BLOCKBUSTER.COM
FLICKR.COM
EQUIFAX.COM
KABOOSE.COM
0 100 200 300
Websites used/visited by 30-‐44 year-‐olds
Websites used/visited in the last 30 days by Hispanic Americans
Res
pons
e
total weighted individuals (index)
209
176
170
169
168
167
166
National Average 18-29 30-44 45-59
CREDITEXPERT.COM
MOVIES.COM
SPRINT.COM
CBS.COM
WEATHERBUG.COM
DELL.COM
NBC.COM
0 100 200 300
Websites used/visited by 30-‐44 year-‐olds
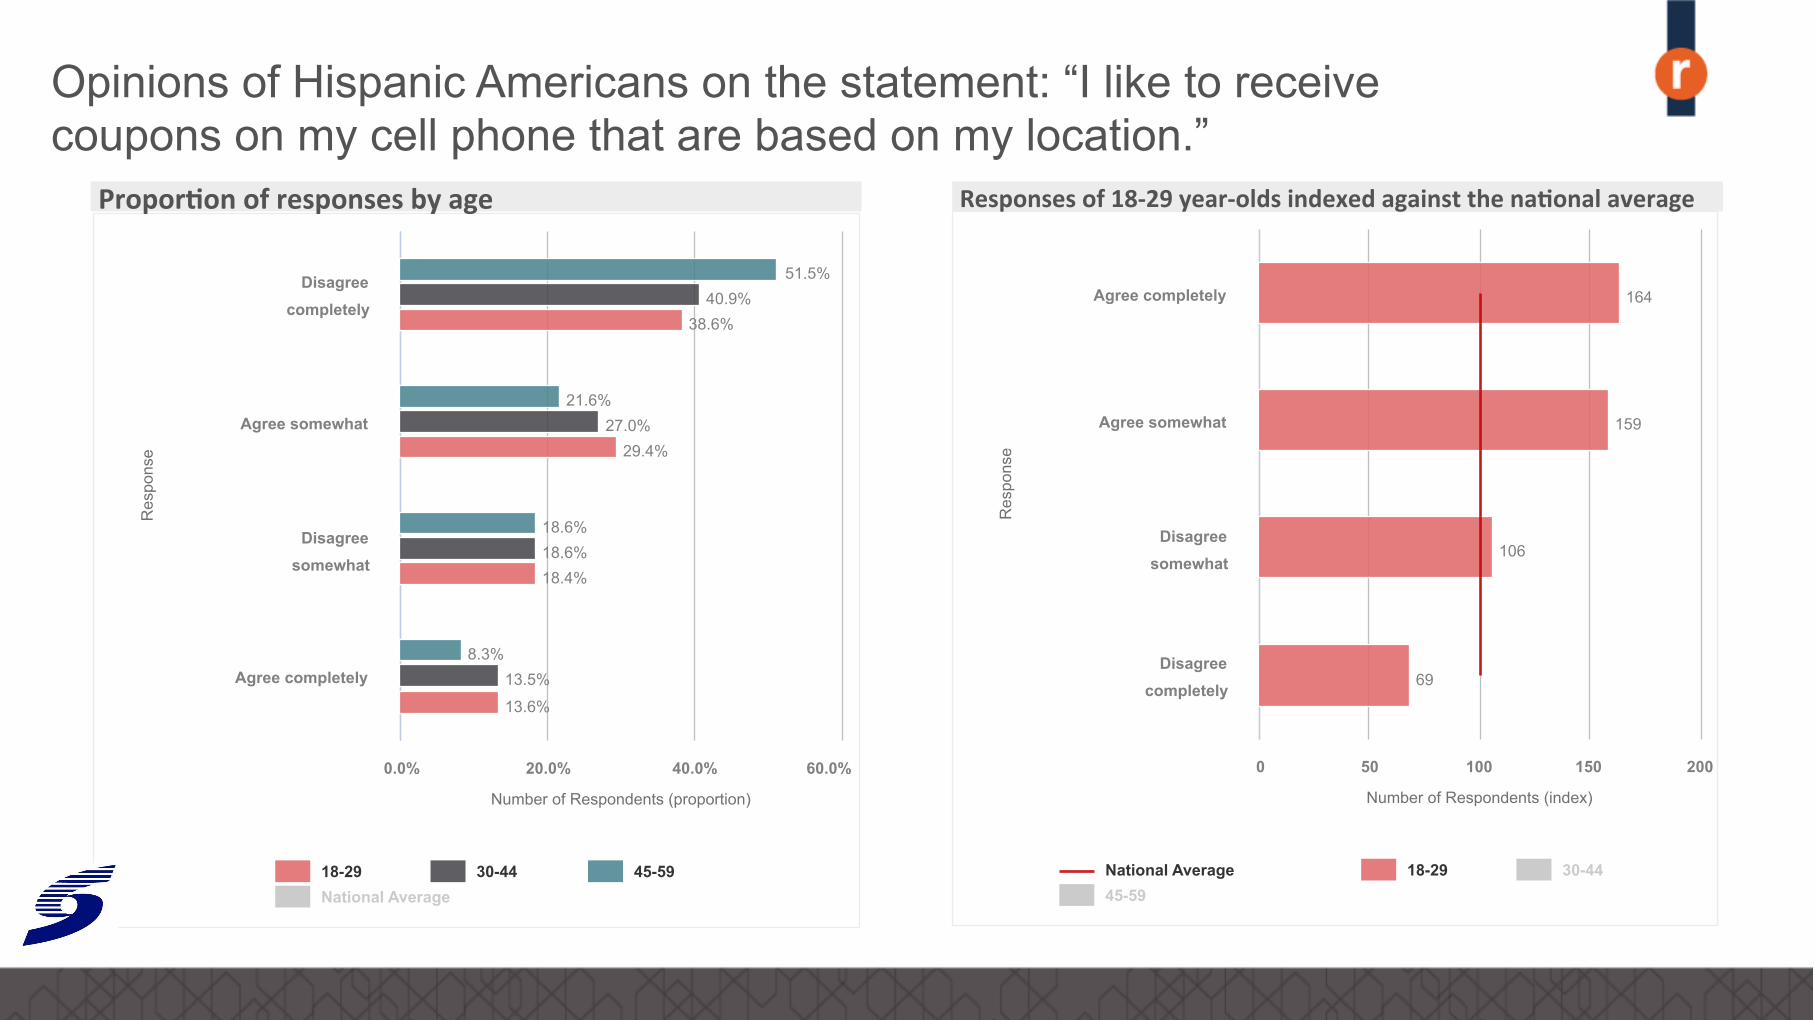
Res
pons
e
Number of Respondents (index)
164
159
106
69
National Average 18-29 30-44 45-59
Agree completely
Agree somewhat
Disagree somewhat
Disagree completely
0 50 100 150 200
Responses of 18-‐29 year-‐olds indexed against the na%onal average
Opinions of Hispanic Americans on the statement: “I like to receive coupons on my cell phone that are based on my location.”
Res
pons
e
Number of Respondents (proportion)
38.6%
29.4%
18.4%
13.6%
40.9%
27.0%
18.6%
13.5%
51.5%
21.6%
18.6%
8.3%
18-29 30-44 45-59 National Average
Disagree completely
Agree somewhat
Disagree somewhat
Agree completely
0.0% 20.0% 40.0% 60.0%
Propor%on of responses by age
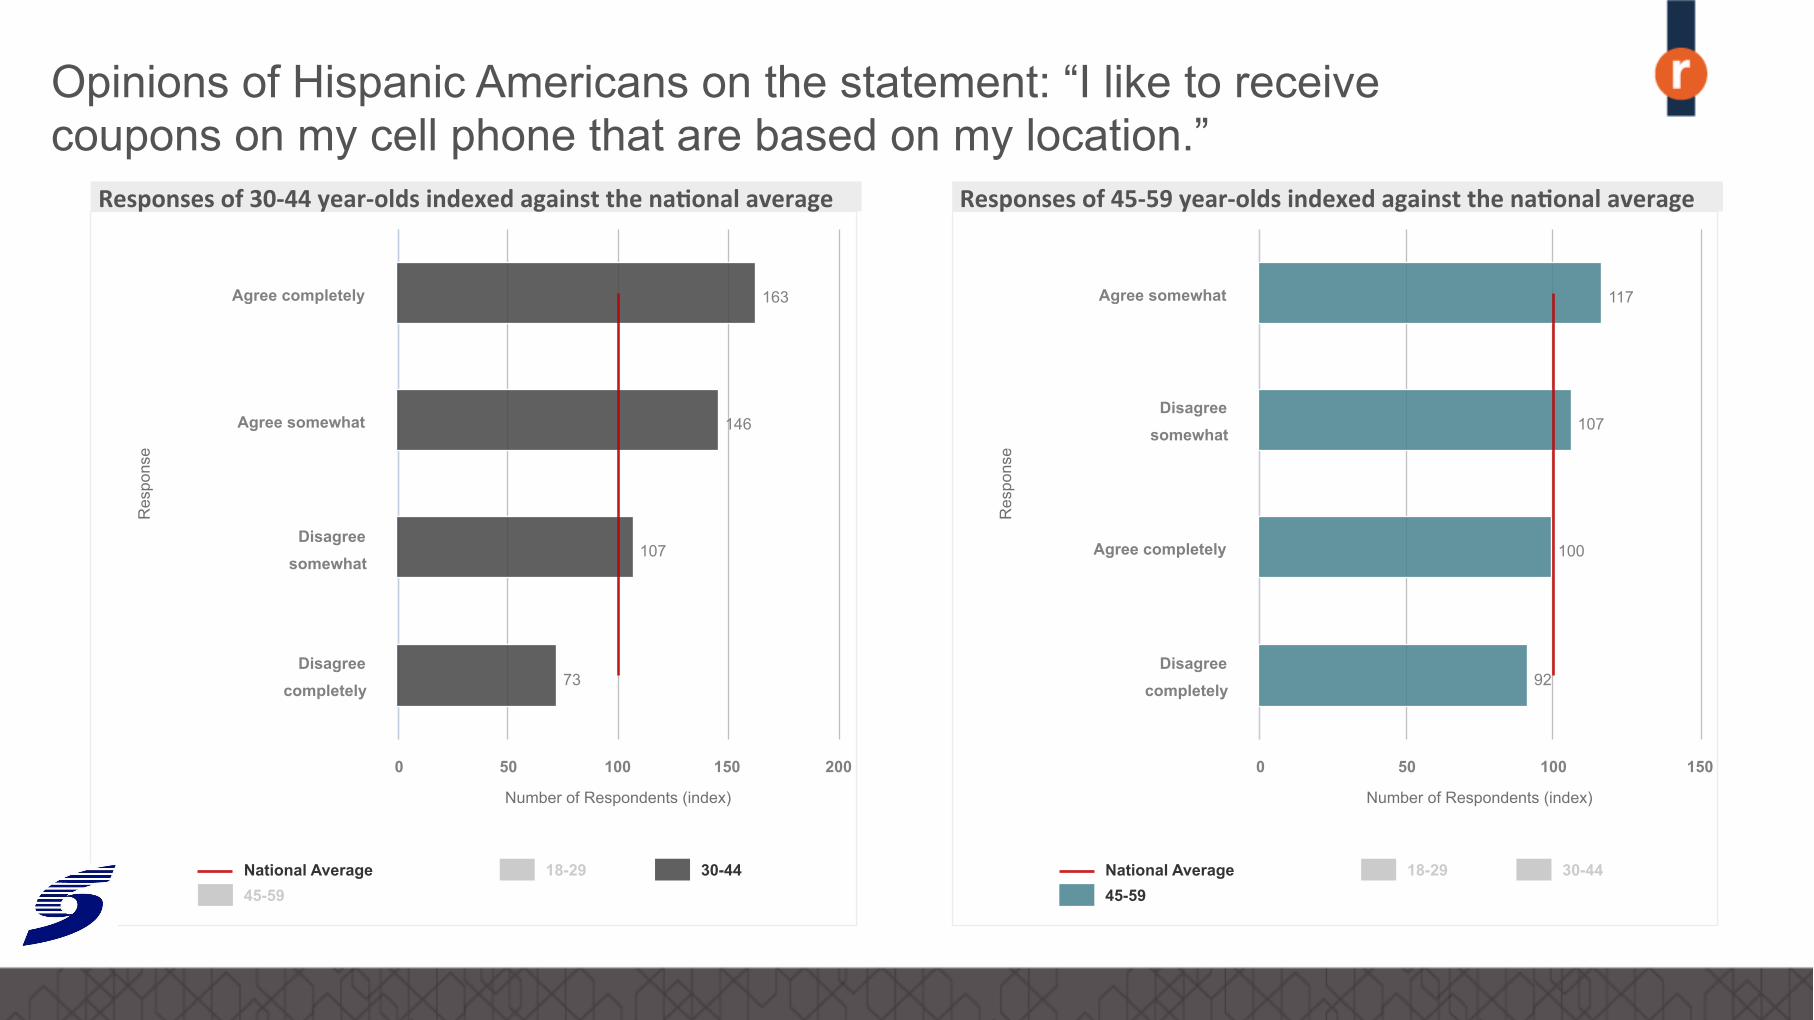
Res
pons
e
Number of Respondents (index)
163
146
107
73
National Average 18-29 30-44 45-59
Agree completely
Agree somewhat
Disagree somewhat
Disagree completely
0 50 100 150 200
Responses of 30-‐44 year-‐olds indexed against the na%onal average
Res
pons
e
Number of Respondents (index)
117
107
100
92
National Average 18-29 30-44 45-59
Agree somewhat
Disagree somewhat
Agree completely
Disagree completely
0 50 100 150
Responses of 45-‐59 year-‐olds indexed against the na%onal average
Opinions of Hispanic Americans on the statement: “I like to receive coupons on my cell phone that are based on my location.”
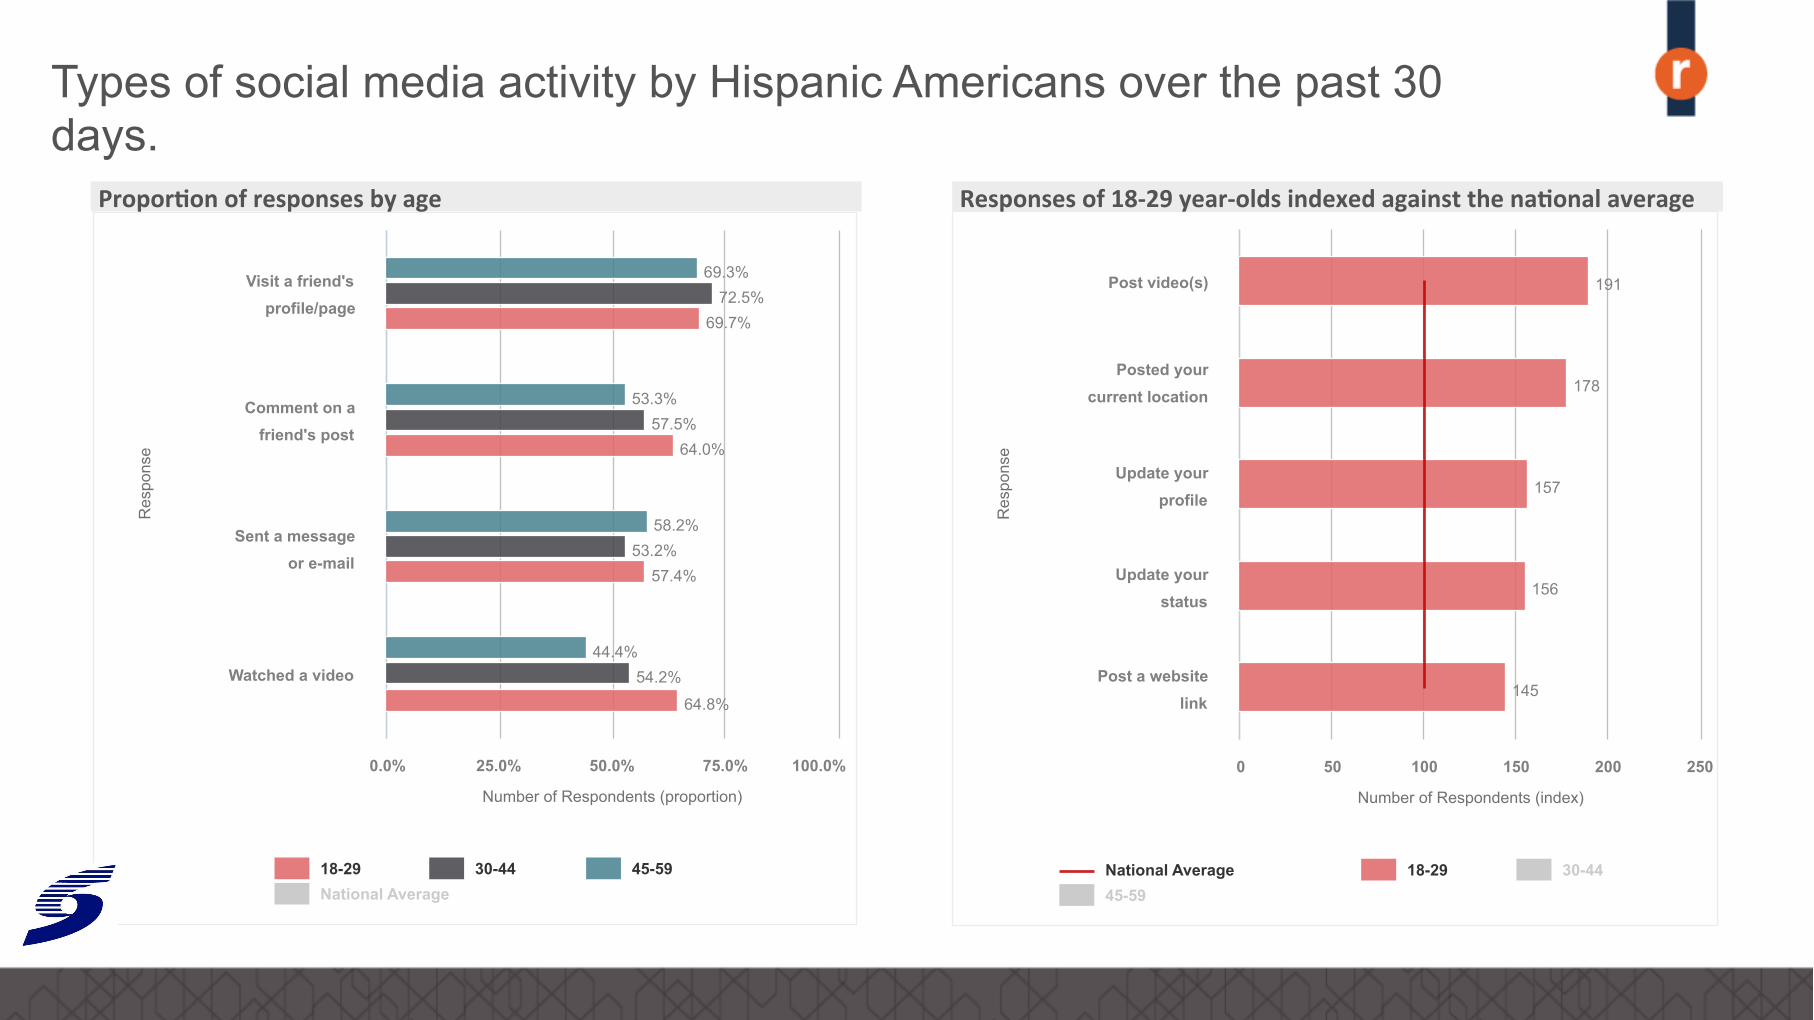
Res
pons
e
Number of Respondents (index)
191
178
157
156
145
National Average 18-29 30-44 45-59
Post video(s)
Posted your current location
Update your profile
Update your status
Post a website link
0 50 100 150 200 250
Responses of 18-‐29 year-‐olds indexed against the na%onal average
Types of social media activity by Hispanic Americans over the past 30 days.
Res
pons
e
Number of Respondents (proportion)
69.7%
64.0%
57.4%
64.8%
72.5%
57.5%
53.2%
54.2%
69.3%
53.3%
58.2%
44.4%
18-29 30-44 45-59 National Average
Visit a friend's profile/page
Comment on a friend's post
Sent a message or e-mail
Watched a video
0.0% 25.0% 50.0% 75.0% 100.0%
Propor%on of responses by age
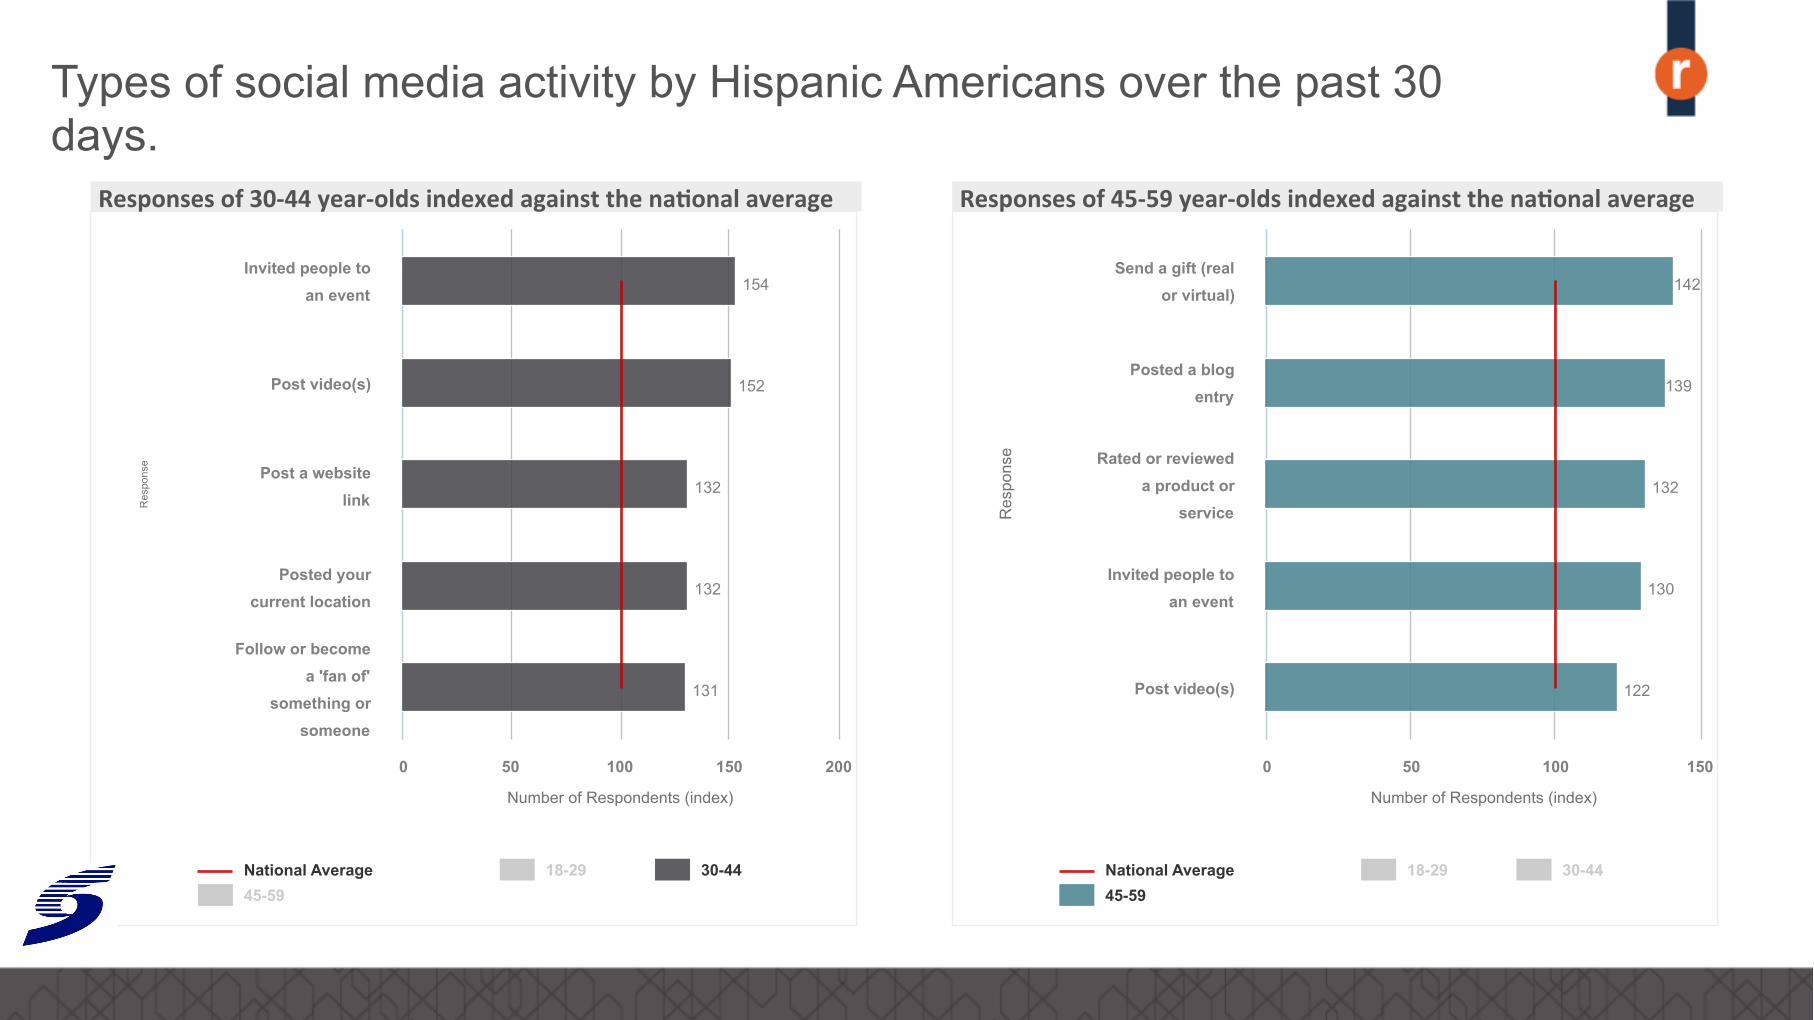
Res
pons
e
Number of Respondents (index)
154
152
132
132
131
National Average 18-29 30-44 45-59
Invited people to an event
Post video(s)
Post a website link
Posted your current location
Follow or become a 'fan of'
something or someone
0 50 100 150 200
Responses of 30-‐44 year-‐olds indexed against the na%onal average
Res
pons
e
Number of Respondents (index)
142
139
132
130
122
National Average 18-29 30-44 45-59
Send a gift (real or virtual)
Posted a blog entry
Rated or reviewed a product or
service
Invited people to an event
Post video(s)
0 50 100 150
Responses of 45-‐59 year-‐olds indexed against the na%onal average
Types of social media activity by Hispanic Americans over the past 30 days.
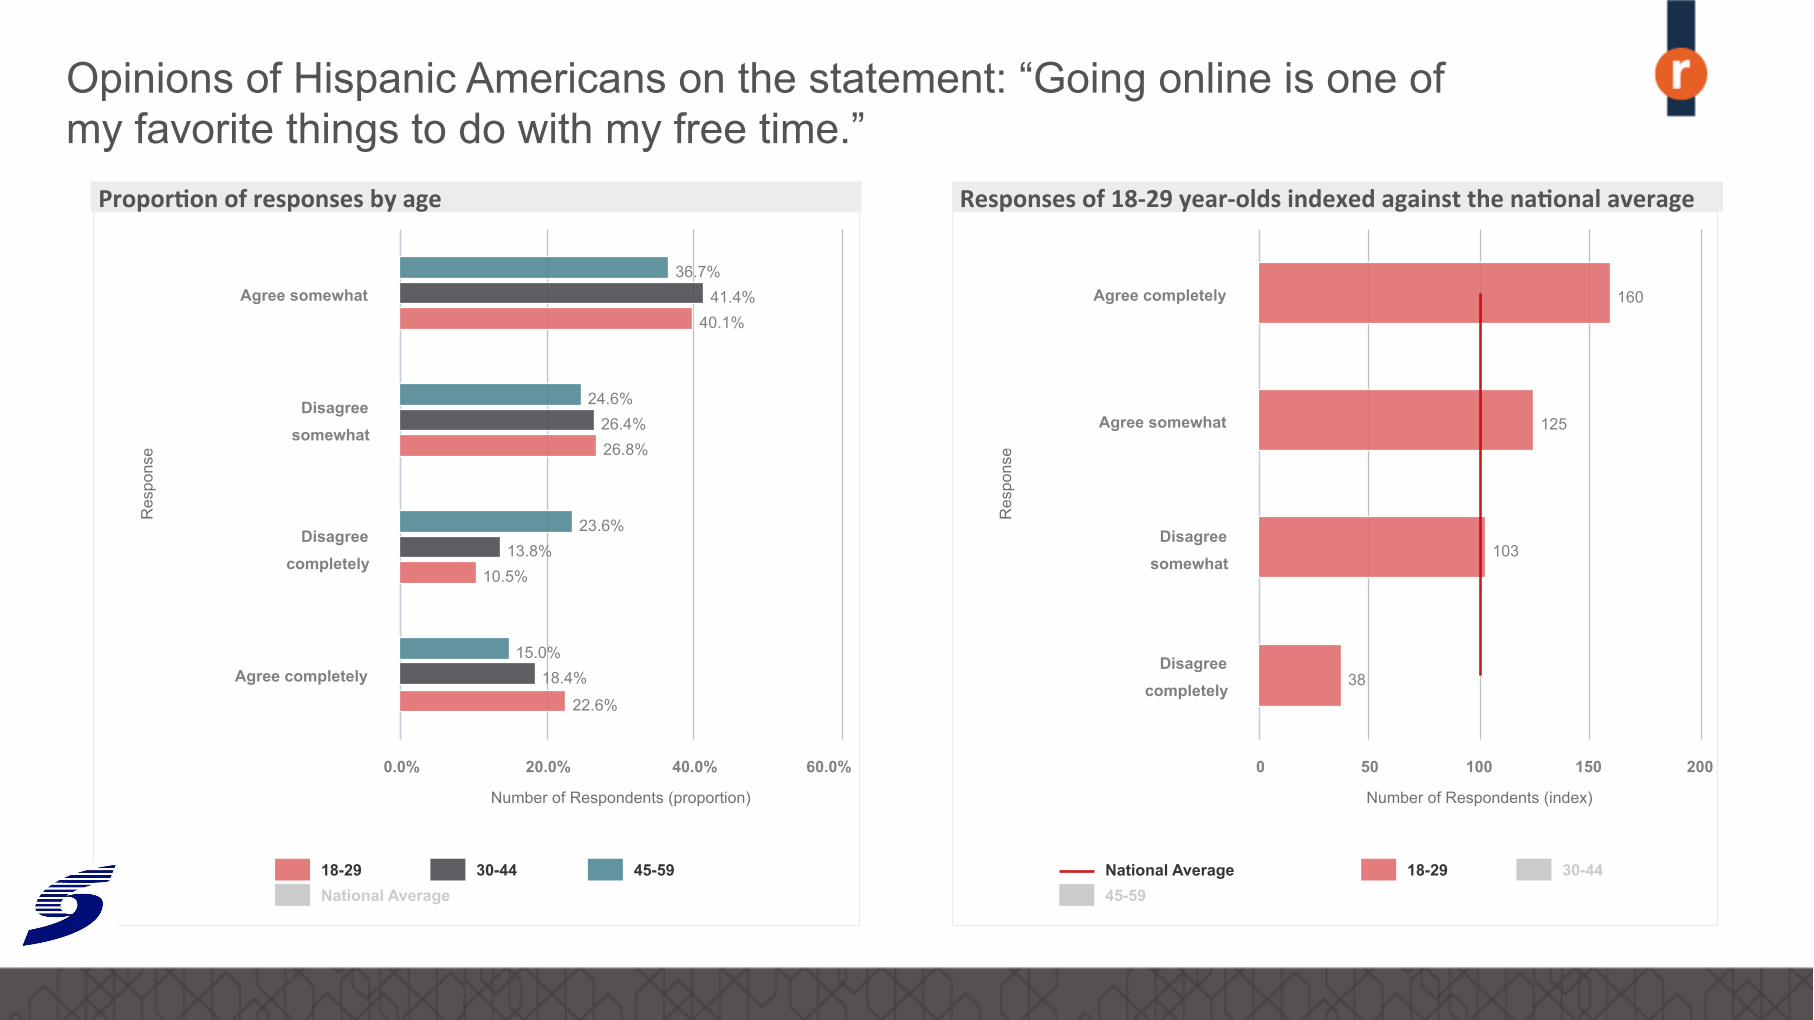
Res
pons
e
Number of Respondents (index)
160
125
103
38
National Average 18-29 30-44 45-59
Agree completely
Agree somewhat
Disagree somewhat
Disagree completely
0 50 100 150 200
Responses of 18-‐29 year-‐olds indexed against the na%onal average
Opinions of Hispanic Americans on the statement: “Going online is one of my favorite things to do with my free time.”
Res
pons
e
Number of Respondents (proportion)
40.1%
26.8%
10.5%
22.6%
41.4%
26.4%
13.8%
18.4%
36.7%
24.6%
23.6%
15.0%
18-29 30-44 45-59 National Average
Agree somewhat
Disagree somewhat
Disagree completely
Agree completely
0.0% 20.0% 40.0% 60.0%
Propor%on of responses by age
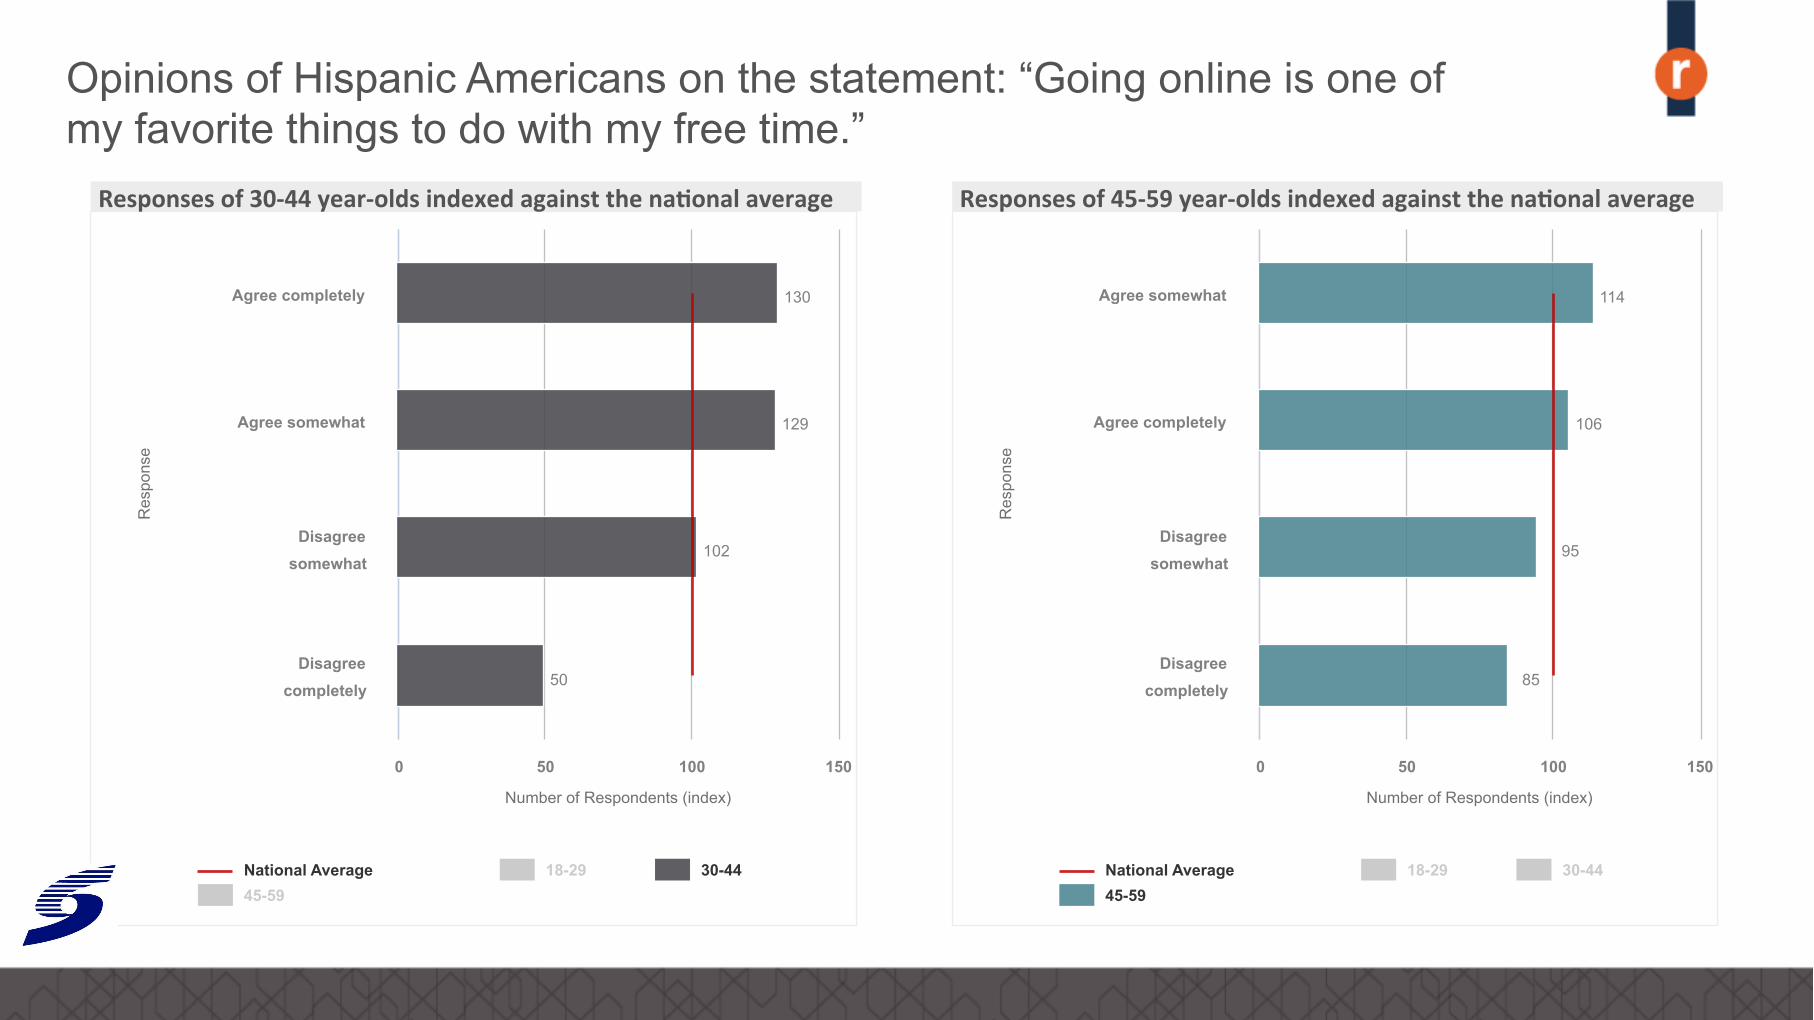
Res
pons
e
Number of Respondents (index)
130
129
102
50
National Average 18-29 30-44 45-59
Agree completely
Agree somewhat
Disagree somewhat
Disagree completely
0 50 100 150
Responses of 30-‐44 year-‐olds indexed against the na%onal average
Res
pons
e
Number of Respondents (index)
114
106
95
85
National Average 18-29 30-44 45-59
Agree somewhat
Agree completely
Disagree somewhat
Disagree completely
0 50 100 150
Responses of 45-‐59 year-‐olds indexed against the na%onal average
Opinions of Hispanic Americans on the statement: “Going online is one of my favorite things to do with my free time.”
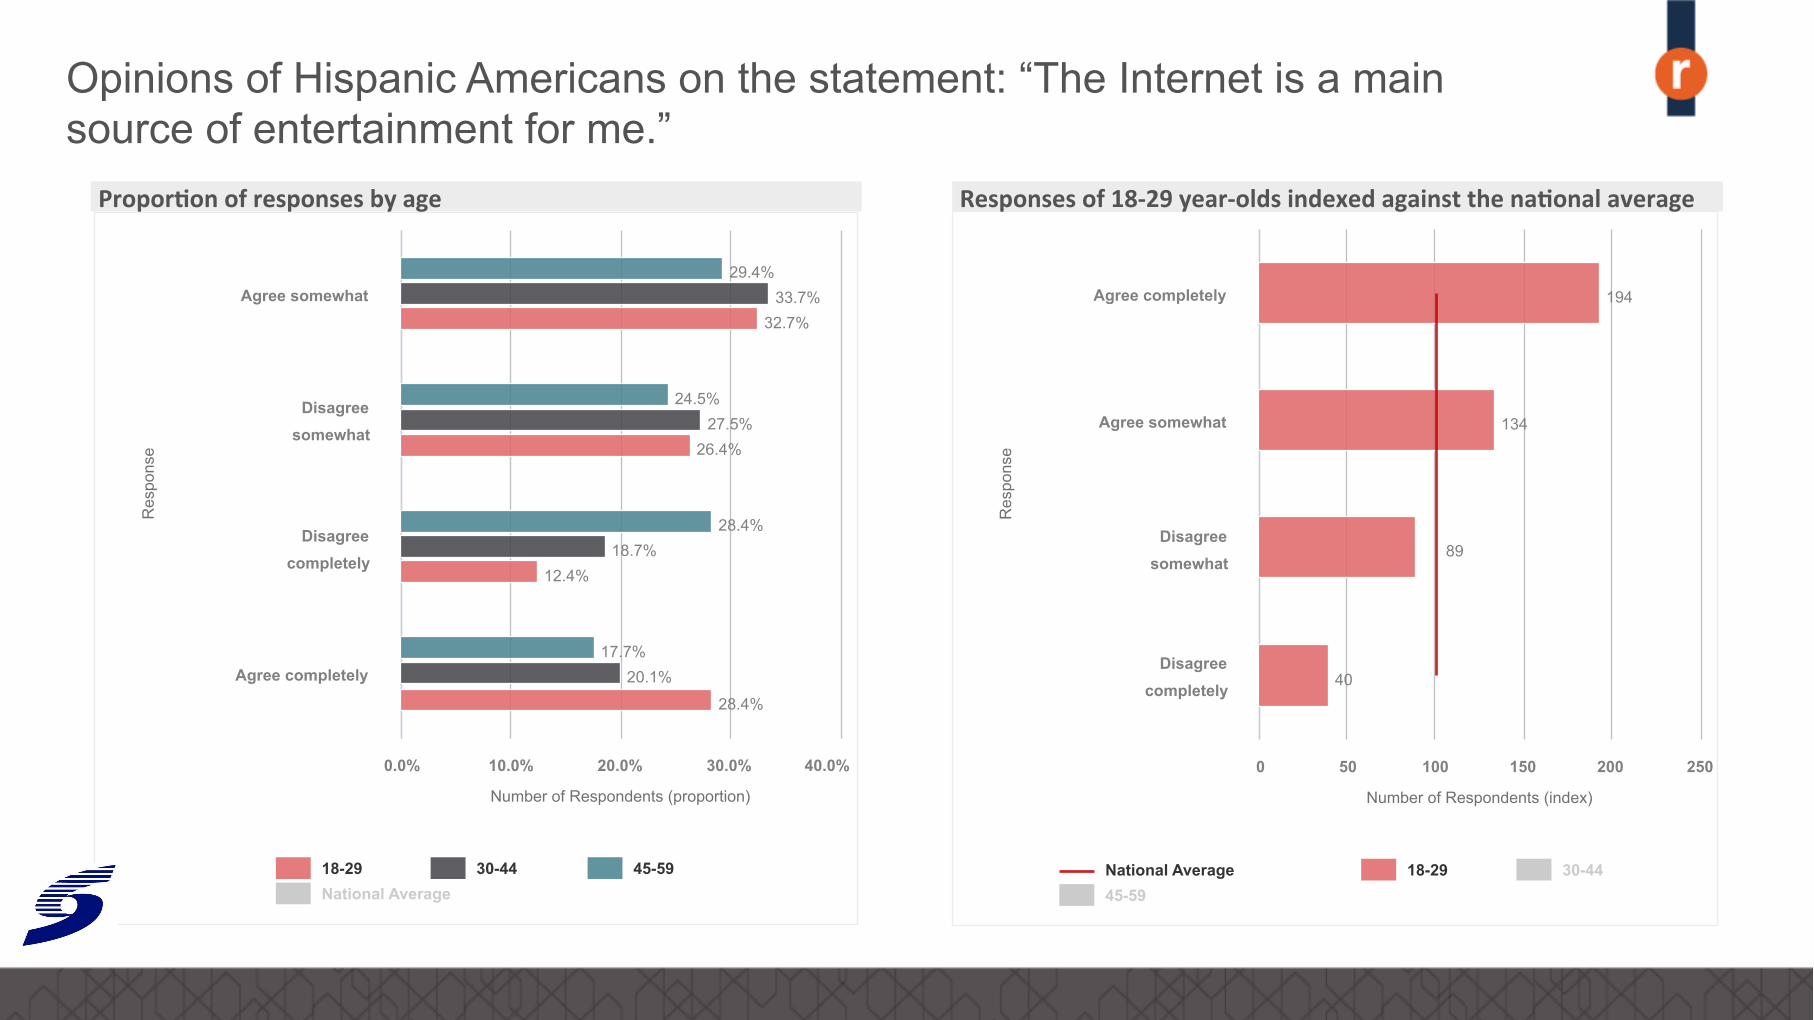
Res
pons
e
Number of Respondents (index)
194
134
89
40
National Average 18-29 30-44 45-59
Agree completely
Agree somewhat
Disagree somewhat
Disagree completely
0 50 100 150 200 250
Responses of 18-‐29 year-‐olds indexed against the na%onal average
Opinions of Hispanic Americans on the statement: “The Internet is a main source of entertainment for me.”
Res
pons
e
Number of Respondents (proportion)
32.7%
26.4%
12.4%
28.4%
33.7%
27.5%
18.7%
20.1%
29.4%
24.5%
28.4%
17.7%
18-29 30-44 45-59 National Average
Agree somewhat
Disagree somewhat
Disagree completely
Agree completely
0.0% 10.0% 20.0% 30.0% 40.0%
Propor%on of responses by age
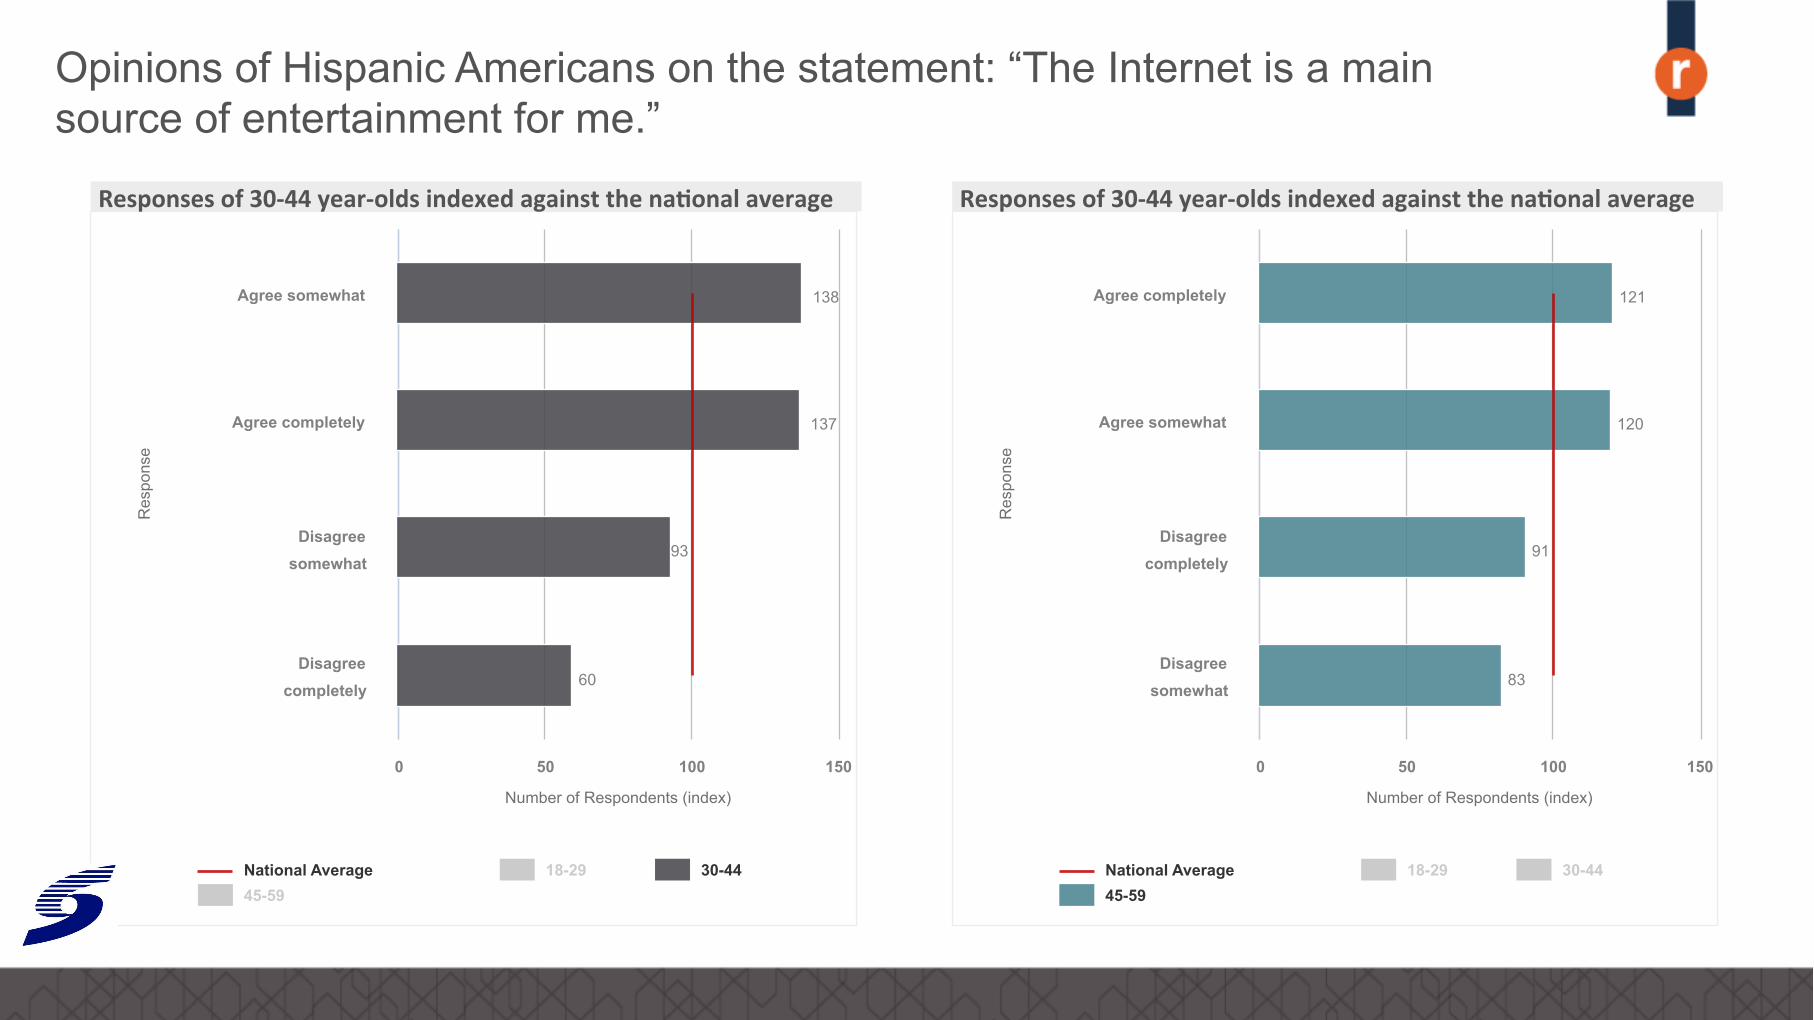
Res
pons
e
Number of Respondents (index)
138
137
93
60
National Average 18-29 30-44 45-59
Agree somewhat
Agree completely
Disagree somewhat
Disagree completely
0 50 100 150
Responses of 30-‐44 year-‐olds indexed against the na%onal average
Res
pons
e
Number of Respondents (index)
121
120
91
83
National Average 18-29 30-44 45-59
Agree completely
Agree somewhat
Disagree completely
Disagree somewhat
0 50 100 150
Responses of 30-‐44 year-‐olds indexed against the na%onal average
Opinions of Hispanic Americans on the statement: “The Internet is a main source of entertainment for me.”
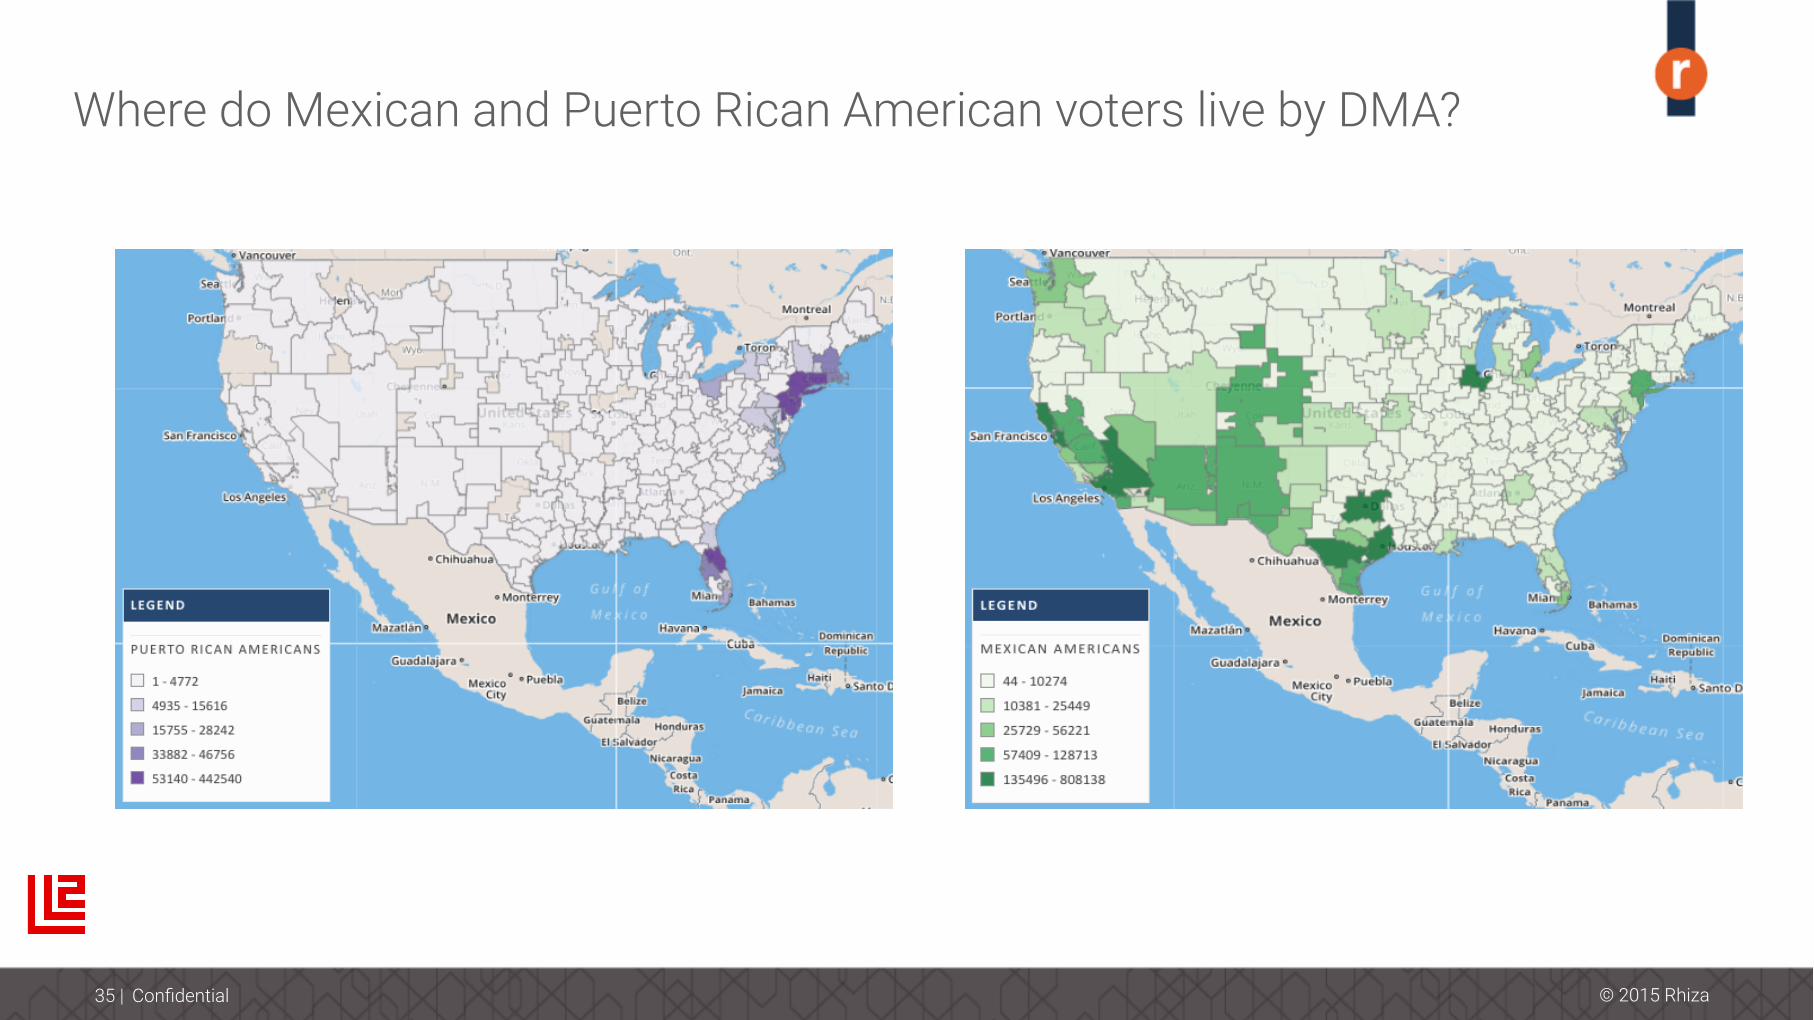
Voting behavior of Mexican and Puerto Rican Americans
Response
num
ber o
f vot
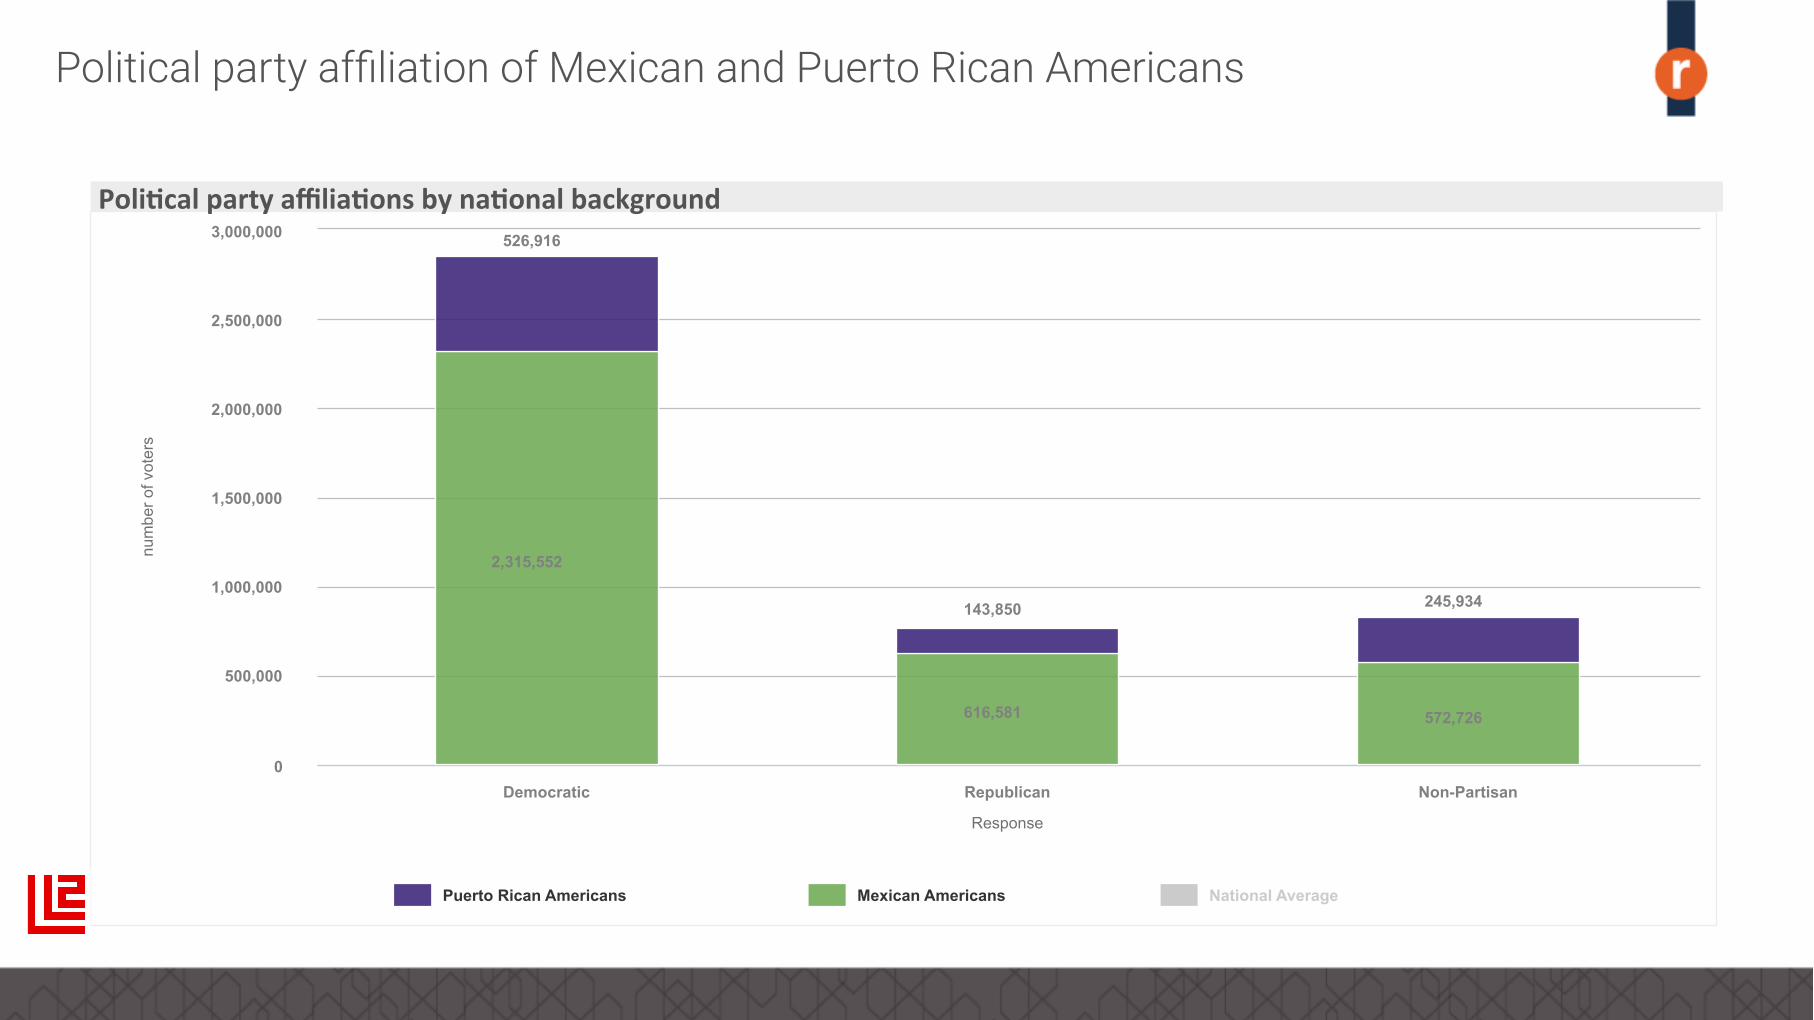
ers
526,916
143,850 245,934
2,315,552
616,581 572,726
Puerto Rican Americans Mexican Americans National Average
Democratic Republican Non-Partisan 0
500,000
1,000,000
1,500,000
2,000,000
2,500,000
3,000,000
Poli%cal party affilia%ons by na%onal background
Political party affiliation of Mexican and Puerto Rican Americans
© 2015 Rhiza
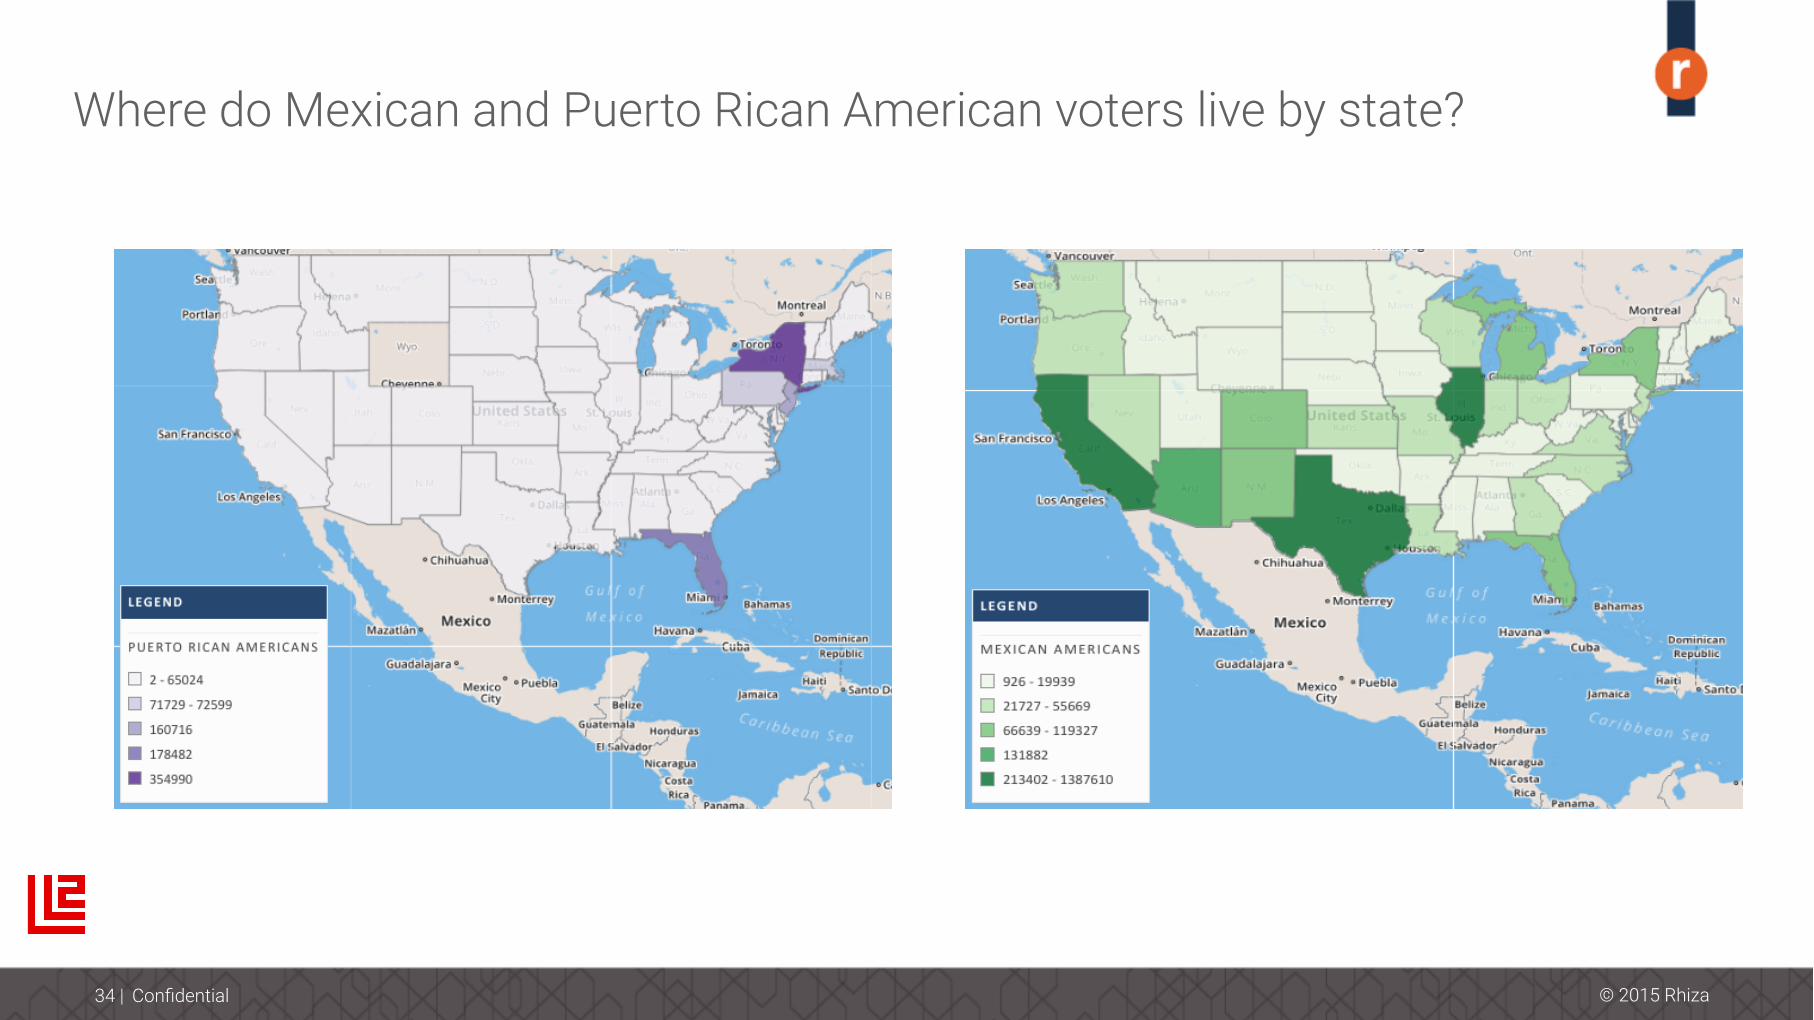
Where do Mexican and Puerto Rican American voters live by state?
34 | Confidential
© 2015 Rhiza
Where do Mexican and Puerto Rican American voters live by DMA?
35 | Confidential
© 2015 Rhiza
Attribution
• L2 Nationwide Voter File �Date published by provider: 2015-07 �
• Scarborough/GfK MRI Attitudinal Insights�Date published by provider: 2015�
• Scarborough USA+ Date published by provider: 2015
• Simmons Local Spring 2014 Release & 2012 Experian Information Solutions, Inc. Date published by provider: 2014-07 �
36 | Confidential