Embed Size (px)
Citation preview
Benchmark Report Comparing Six Latin American Public Transport Systems
Juan Carlos Muñoz, Marco Batarce, Ignacia Torres Bus Rapid Transit Centre of Excellence Pontificia Universidad Católica de Chile
June 2013
Goals of the study • Compare operational indicators of the transit systems (bus and
Metro) of Ciudad de México, Guadalajara, Bogotá, Lima, Porto Alegre and Santiago.
• Urbanized metropolitan areas were considered.
• Characterize the trips made during the morning rush
• Compare the real level of service offered to users for different trip characteristics (distance, transport modes, infrastructure, etc.)
• Assumptions
– Users take the fastest route
– Measure real level of service, not user perceptions
– Only formal and massive transport modes were analyzed
Description of the Study
• We collected 100 indicators from each city – Socio demographic
– Public Transport Operations
– Fares and payment mechanisms
– Contracts and payments to operators
– Infrastructure for public transport
– Vehicle characteristics
– Information for users
– User perception
Description
• Performance indicators were obtained from observation – They are hard to find in the literature
– A common methodology is needed for comparison
• Travel times
• Walking times
• Waiting times
• In-vehicle times
• Operational Speeds
• Frequencies
• Reliability
• Number of transfers
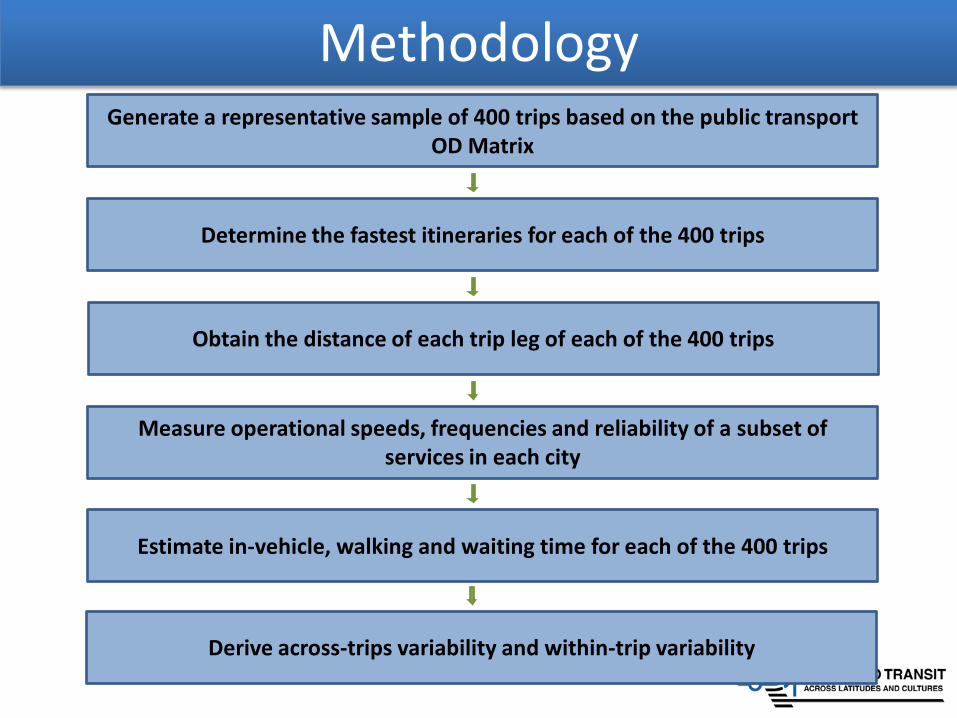
Methodology Generate a representative sample of 400 trips based on the public transport
OD Matrix
Determine the fastest itineraries for each of the 400 trips
Obtain the distance of each trip leg of each of the 400 trips
Measure operational speeds, frequencies and reliability of a subset of services in each city
Estimate in-vehicle, walking and waiting time for each of the 400 trips
Derive across-trips variability and within-trip variability

General Information
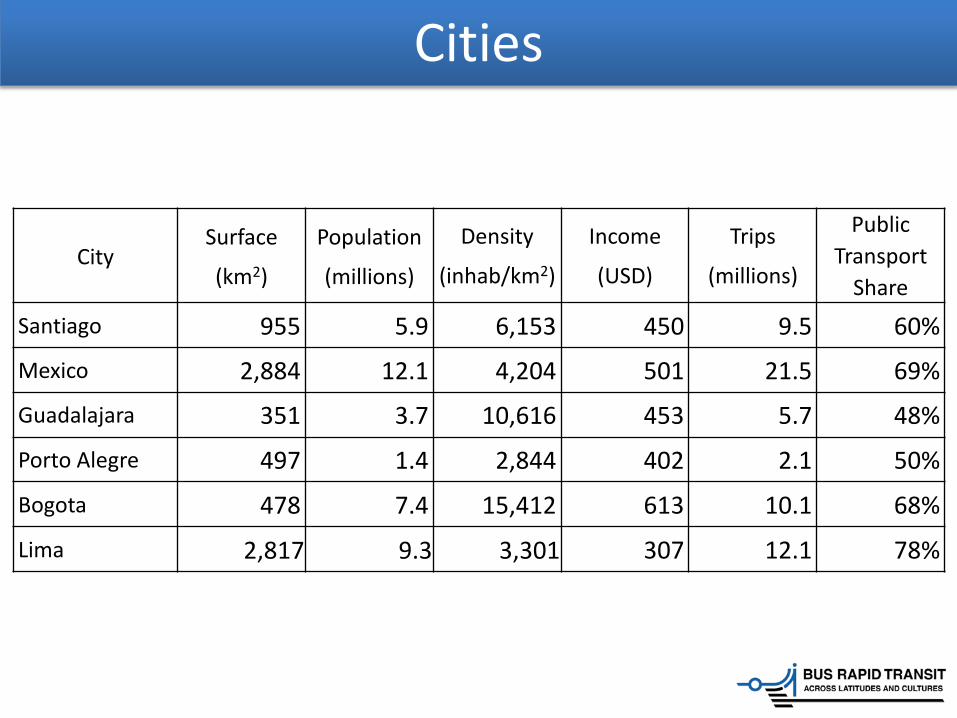
Cities
City Surface
(km2)
Population
(millions)
Density
(inhab/km2)
Income
(USD)
Trips
(millions)
Public Transport
Share
Santiago 955 5.9 6,153 450 9.5 60%
Mexico 2,884 12.1 4,204 501 21.5 69%
Guadalajara 351 3.7 10,616 453 5.7 48%
Porto Alegre 497 1.4 2,844 402 2.1 50%
Bogota 478 7.4 15,412 613 10.1 68%
Lima 2,817 9.3 3,301 307 12.1 78%
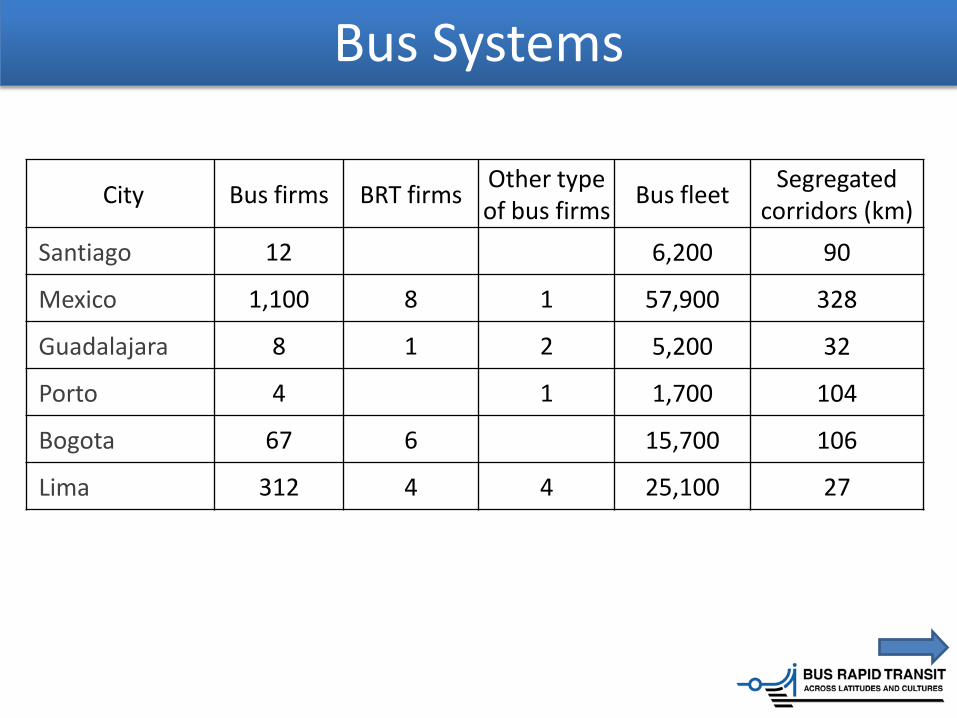
Bus Systems
City Bus firms BRT firms Other type of bus firms Bus fleet Segregated
corridors (km) Santiago 12 6,200 90
Mexico 1,100 8 1 57,900 328
Guadalajara 8 1 2 5,200 32
Porto 4 1 1,700 104
Bogota 67 6 15,700 106
Lima 312 4 4 25,100 27
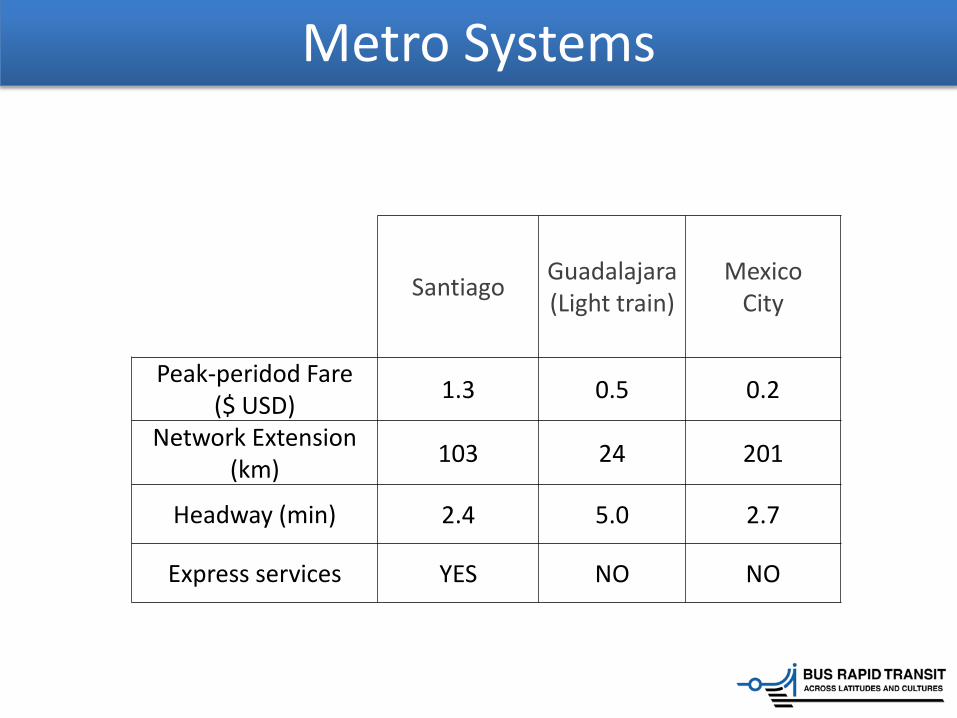
Metro Systems
Santiago Guadalajara (Light train)
Mexico City
Peak-peridod Fare ($ USD) 1.3 0.5 0.2
Network Extension (km) 103 24 201
Headway (min) 2.4 5.0 2.7
Express services YES NO NO
Main Results
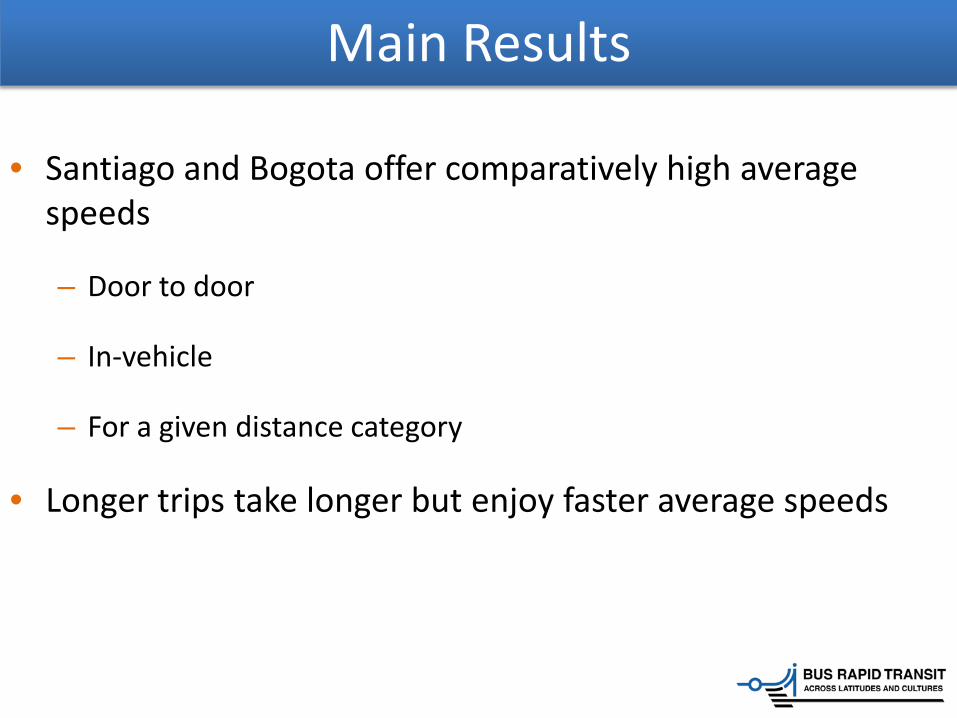
Main Results
• Santiago and Bogota offer comparatively high average speeds
– Door to door
– In-vehicle
– For a given distance category
• Longer trips take longer but enjoy faster average speeds
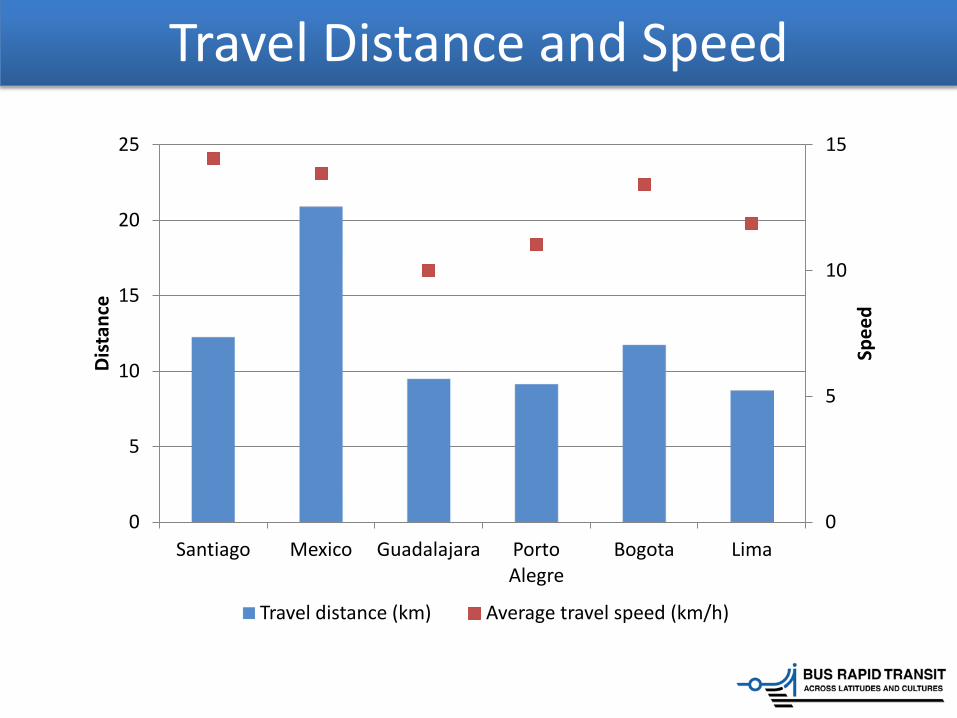
Travel Distance and Speed
0
5
10
15
0
5
10
15
20
25
Santiago Mexico Guadalajara Porto Alegre
Bogota Lima
Spee
d
Dist
ance
Travel distance (km) Average travel speed (km/h)
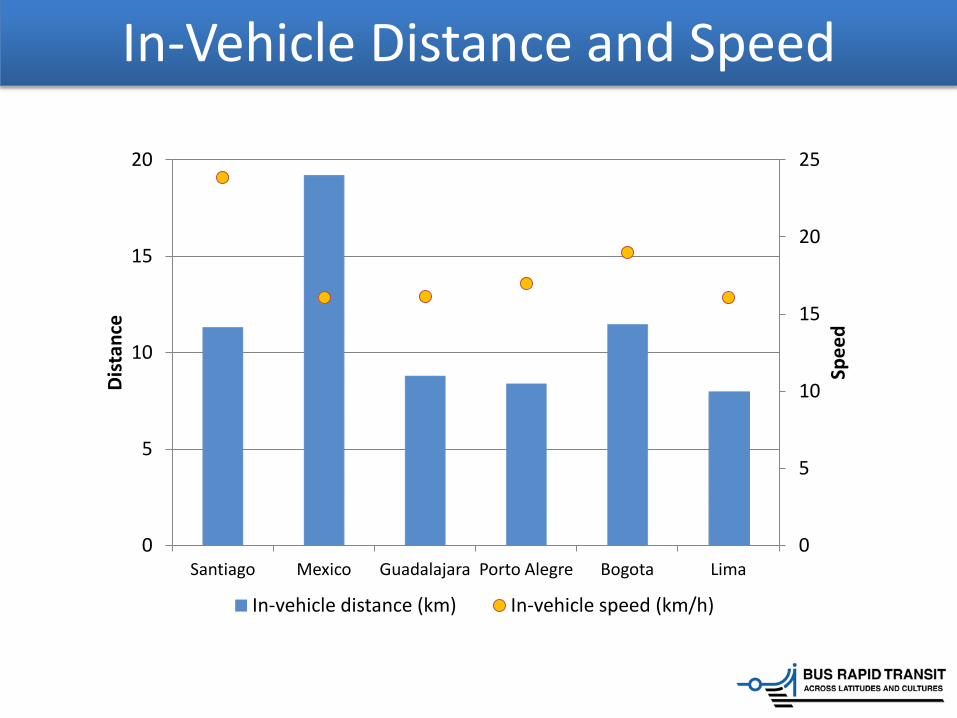
In-Vehicle Distance and Speed
0
5
10
15
20
25
0
5
10
15
20
Santiago Mexico Guadalajara Porto Alegre Bogota Lima
Spee
d
Di
stan
ce
In-vehicle distance (km) In-vehicle speed (km/h)
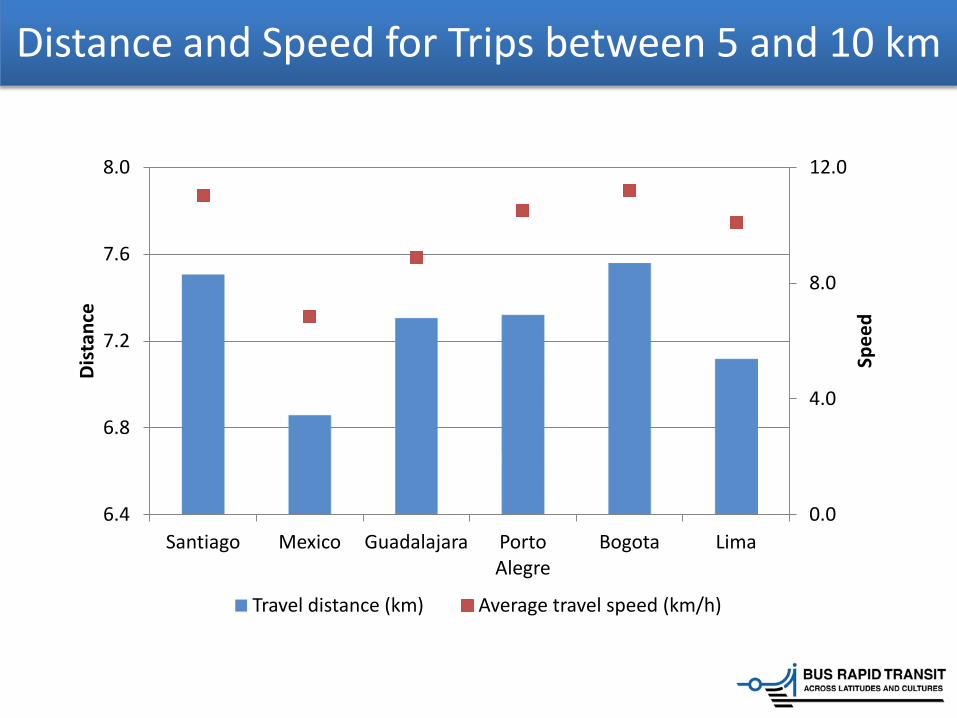
Distance and Speed for Trips between 5 and 10 km
0.0
4.0
8.0
12.0
6.4
6.8
7.2
7.6
8.0
Santiago Mexico Guadalajara Porto Alegre
Bogota Lima
Spee
d
Dist
ance
Travel distance (km) Average travel speed (km/h)
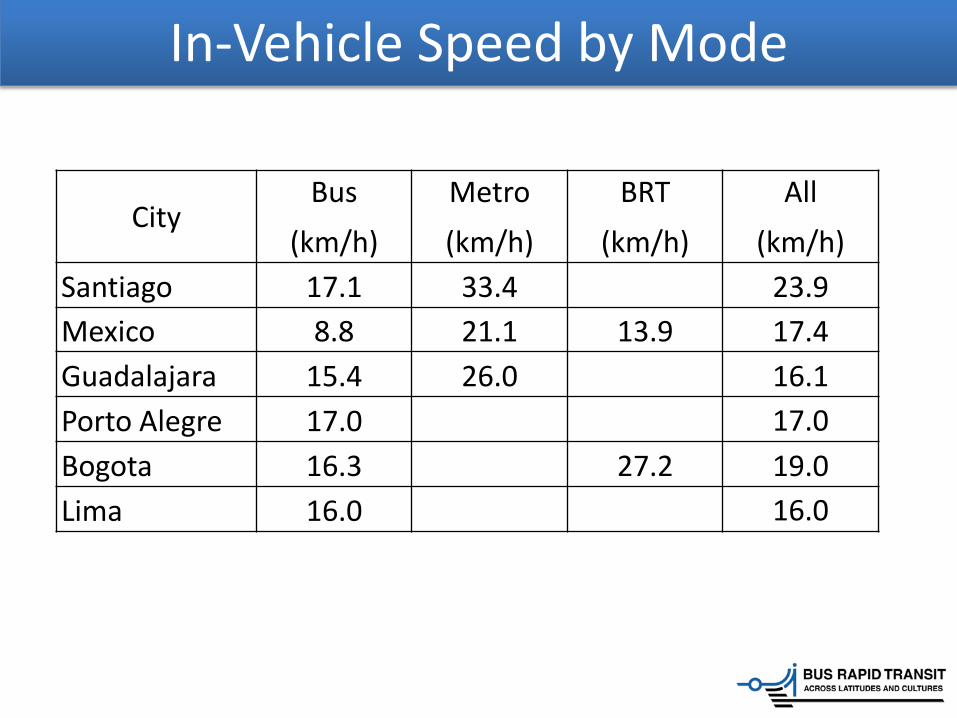
In-Vehicle Speed by Mode
City Bus
(km/h) Metro (km/h)
BRT (km/h)
All (km/h)
Santiago 17.1 33.4 23.9 Mexico 8.8 21.1 13.9 17.4 Guadalajara 15.4 26.0 16.1 Porto Alegre 17.0 17.0 Bogota 16.3 27.2 19.0 Lima 16.0 16.0
Main Results
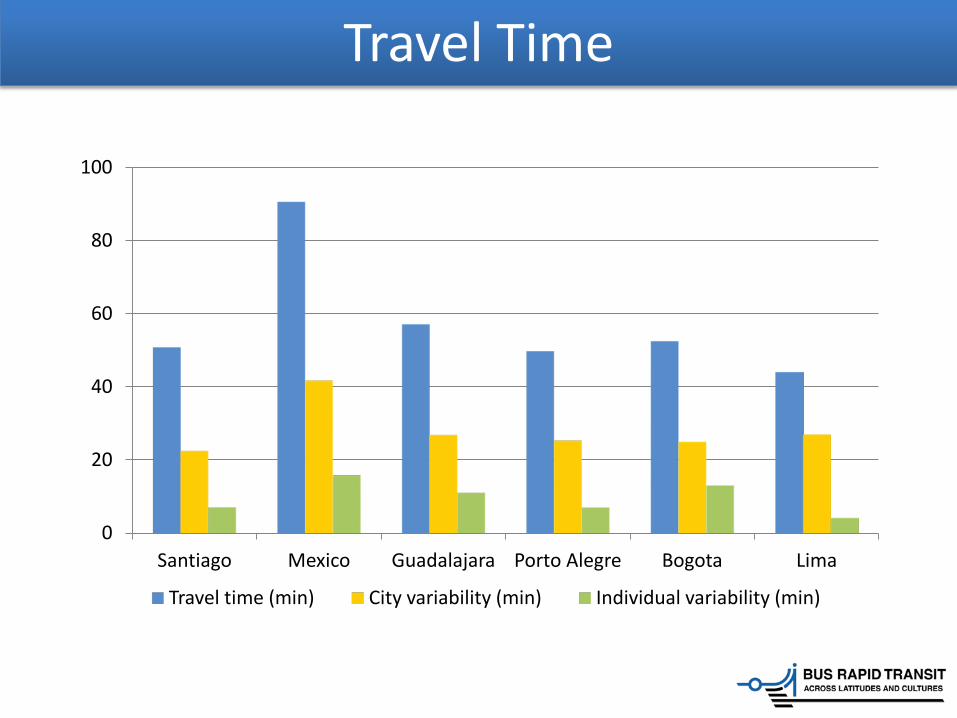
• In Santiago travel time variability among different trips of similar length is the lowest, the highest is in Mexico City. This is indicative of equity.
– Due to an integrated system in Santiago in which each user can access the system through the fastest possible route for the same fare
• In most systems the variability of waiting times for bus services was quite high. In Metro was almost zero. This is indicative of reliability. The lowest were in Lima, Porto Alegre and Santiago.
Travel Time
0
20
40
60
80
100
Santiago Mexico Guadalajara Porto Alegre Bogota Lima
Travel time (min) City variability (min) Individual variability (min)
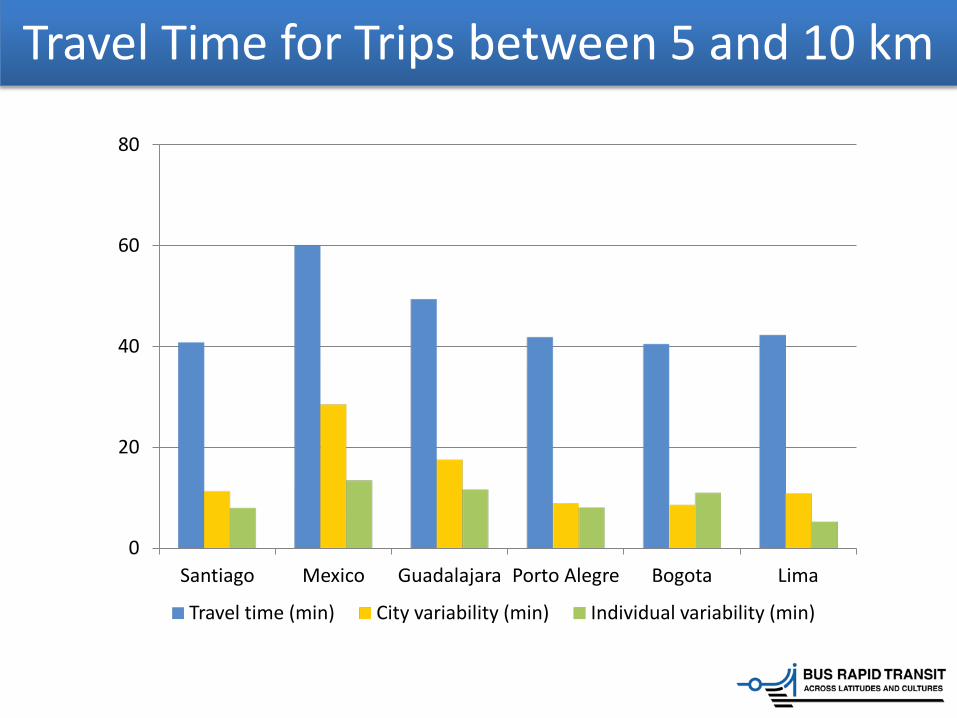
Travel Time for Trips between 5 and 10 km
0
20
40
60
80
Santiago Mexico Guadalajara Porto Alegre Bogota Lima
Travel time (min) City variability (min) Individual variability (min)
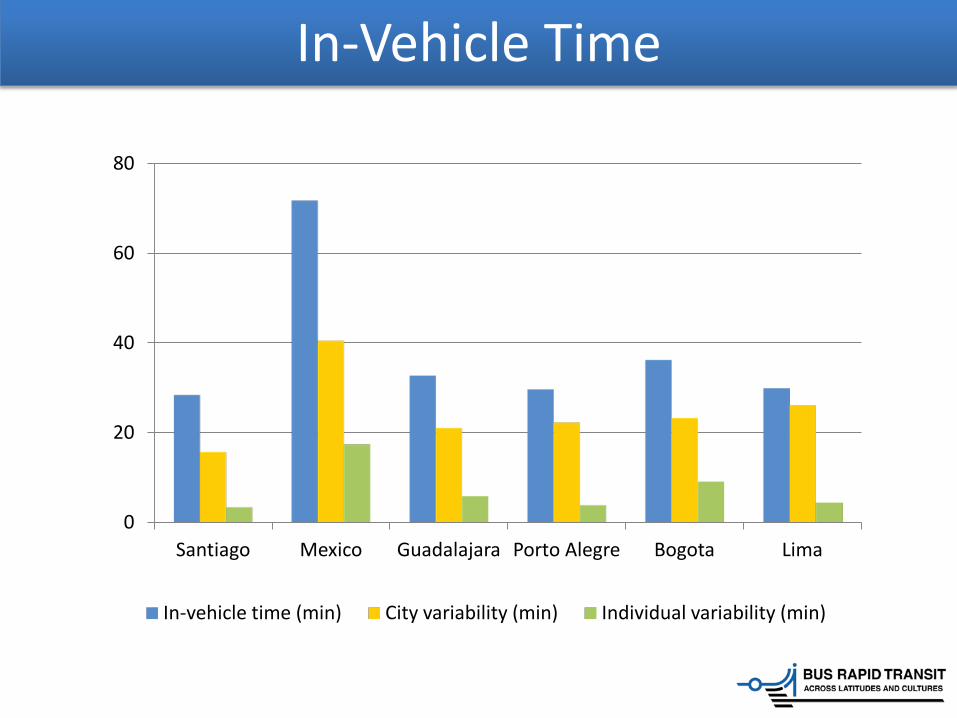
In-Vehicle Time
0
20
40
60
80
Santiago Mexico Guadalajara Porto Alegre Bogota Lima
In-vehicle time (min) City variability (min) Individual variability (min)
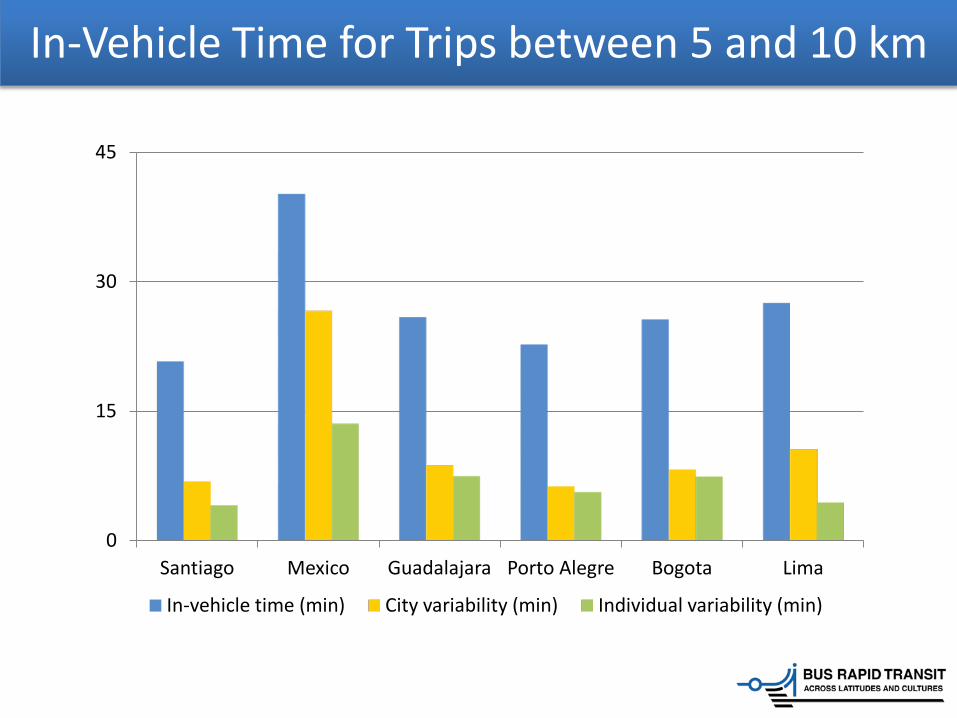
In-Vehicle Time for Trips between 5 and 10 km
0
15
30
45
Santiago Mexico Guadalajara Porto Alegre Bogota Lima
In-vehicle time (min) City variability (min) Individual variability (min)
Main results
• In Santiago, Guadalajara and Porto Alegre waiting time is higher than that in other cities.
• In Bogotá, Lima and Ciudad de México waiting time is smaller since a large fraction of services (90%) are unregulated.
• These systems operate larger fleets and high frequencies (55,000 in Ciudad de México, 25,000 in Lima and 13,000 in Bogotá; in Santiago only 6.000)
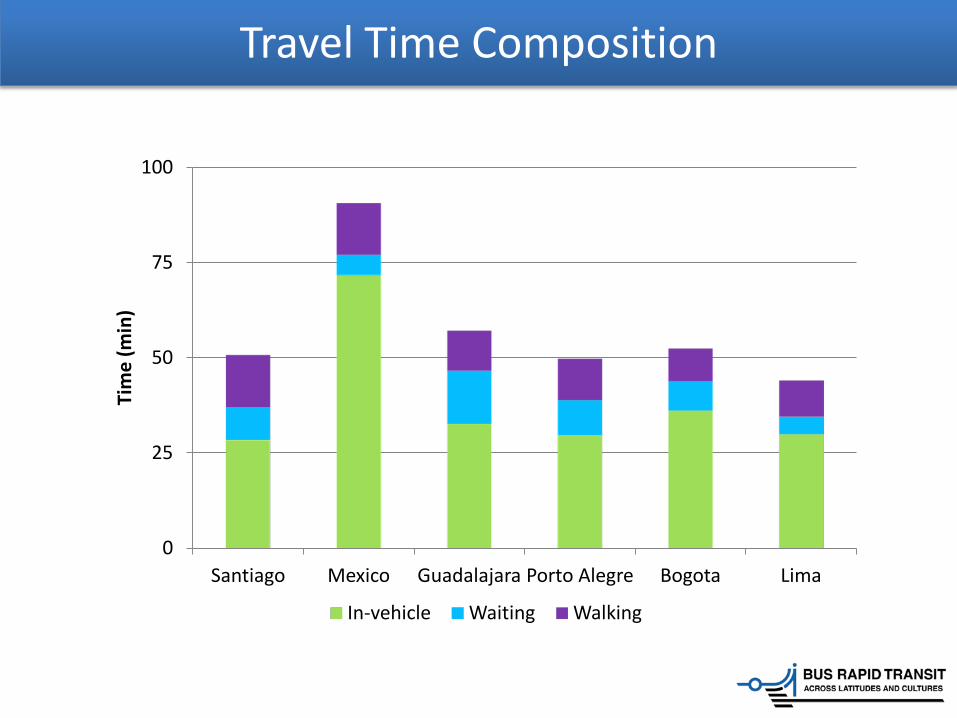
Travel Time Composition
0
25
50
75
100
Santiago Mexico Guadalajara Porto Alegre Bogota Lima
Tim
e (m
in)
In-vehicle Waiting Walking
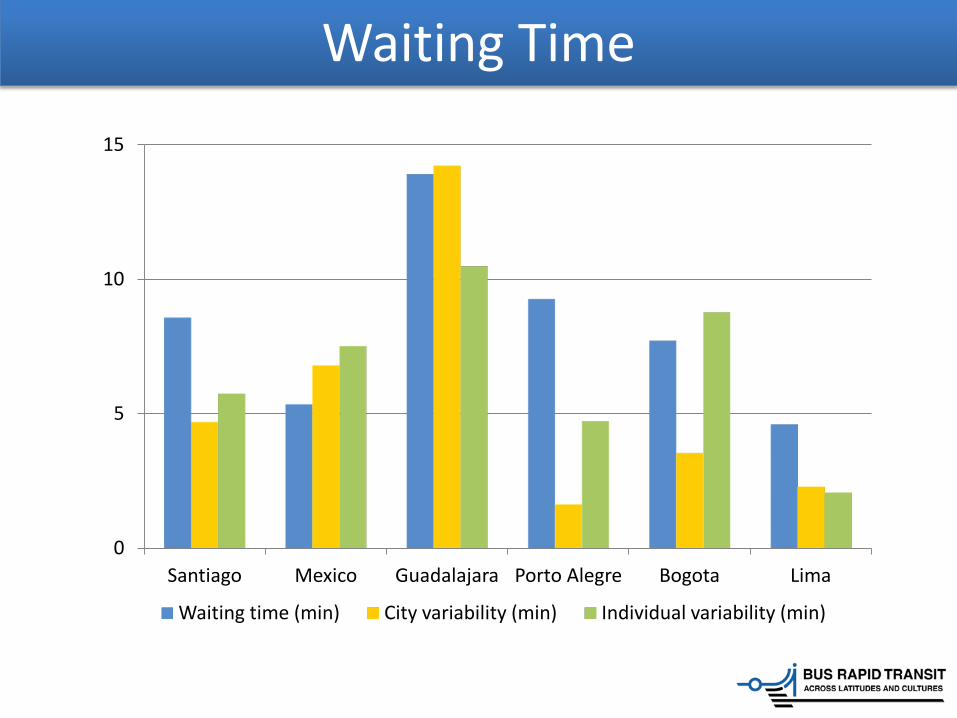
Waiting Time
0
5
10
15
Santiago Mexico Guadalajara Porto Alegre Bogota Lima
Waiting time (min) City variability (min) Individual variability (min)
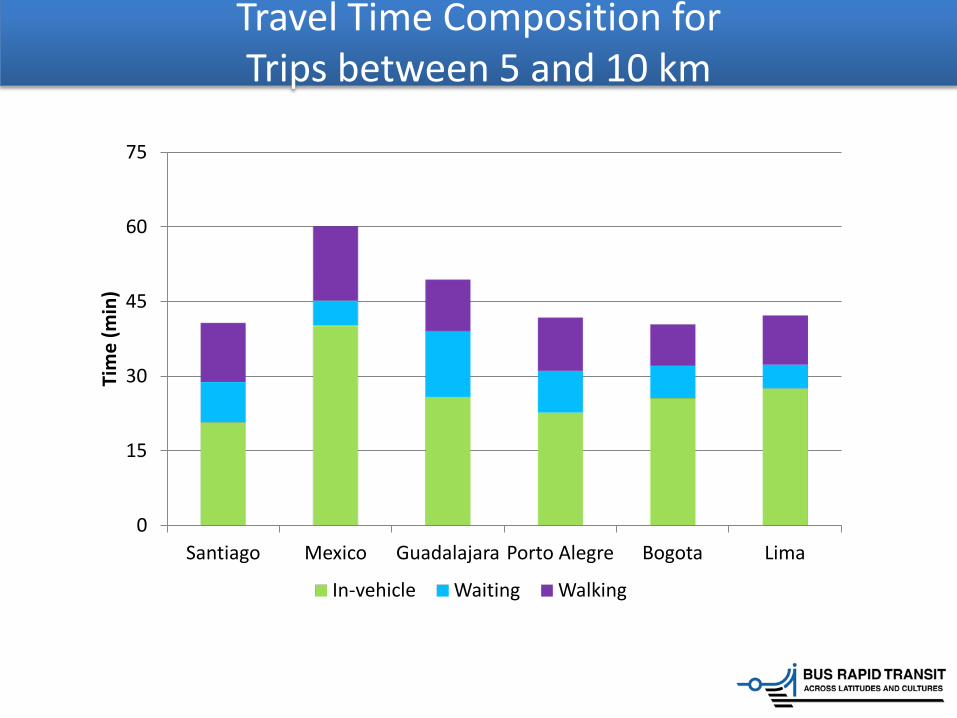
Travel Time Composition for Trips between 5 and 10 km
0
15
30
45
60
75
Santiago Mexico Guadalajara Porto Alegre Bogota Lima
Tim
e (m
in)
In-vehicle Waiting Walking
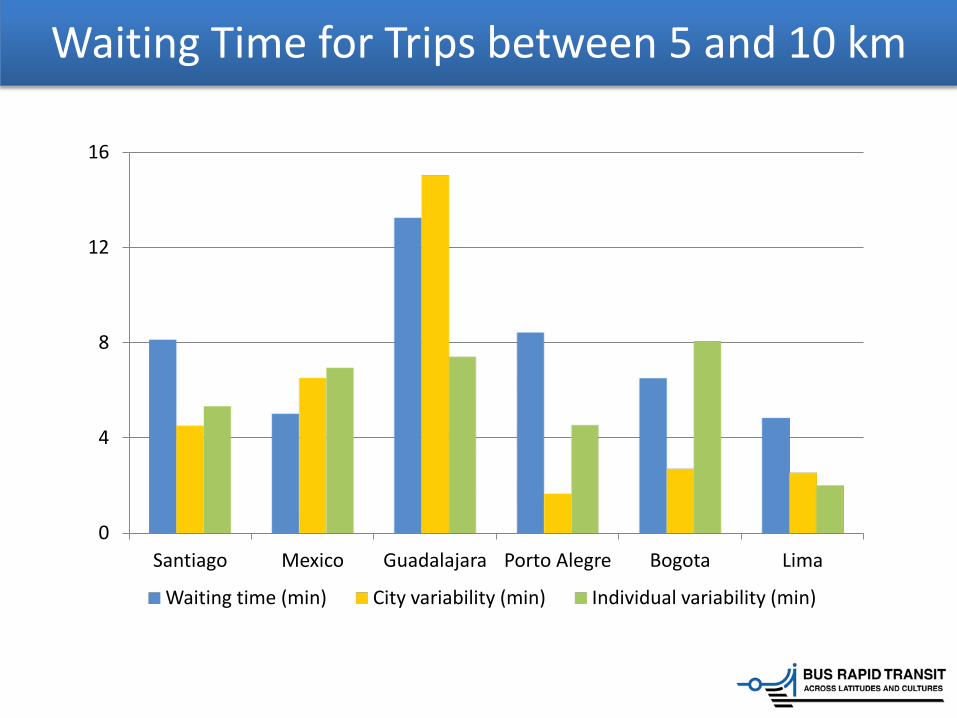
Waiting Time for Trips between 5 and 10 km
0
4
8
12
16
Santiago Mexico Guadalajara Porto Alegre Bogota Lima
Waiting time (min) City variability (min) Individual variability (min)
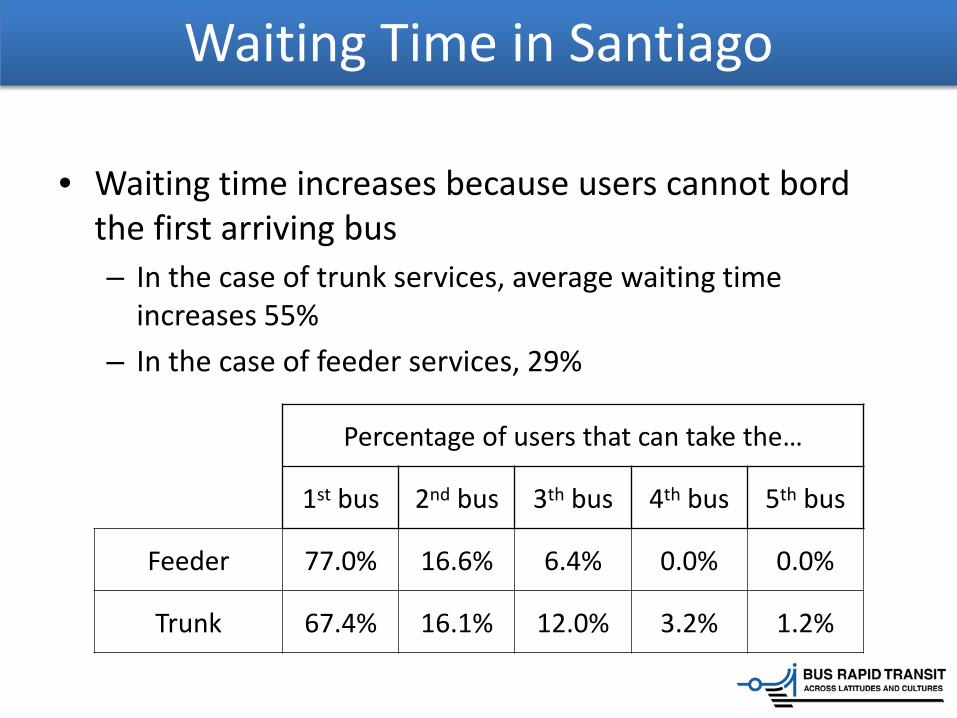
• Waiting time increases because users cannot bord the first arriving bus – In the case of trunk services, average waiting time
increases 55% – In the case of feeder services, 29%
Waiting Time in Santiago
Percentage of users that can take the…
1st bus 2nd bus 3th bus 4th bus 5th bus
Feeder 77.0% 16.6% 6.4% 0.0% 0.0%
Trunk 67.4% 16.1% 12.0% 3.2% 1.2%
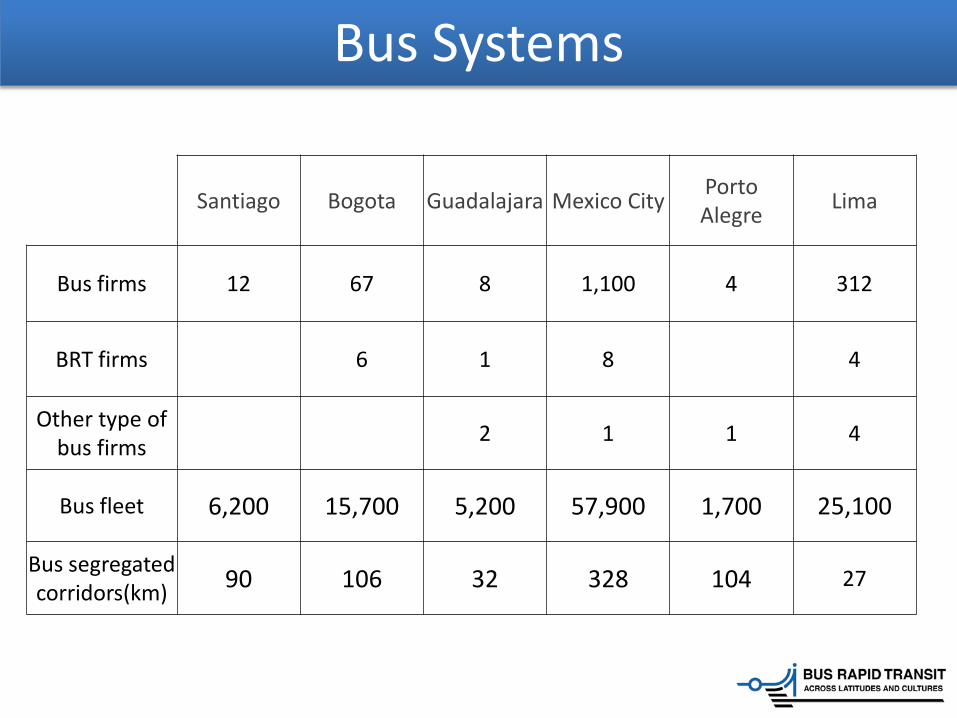
Bus Systems
Santiago Bogota Guadalajara Mexico City Porto Alegre Lima
Bus firms 12 67 8 1,100 4 312
BRT firms 6 1 8 4
Other type of bus firms 2 1 1 4
Bus fleet 6,200 15,700 5,200 57,900 1,700 25,100
Bus segregated corridors(km) 90 106 32 328 104 27
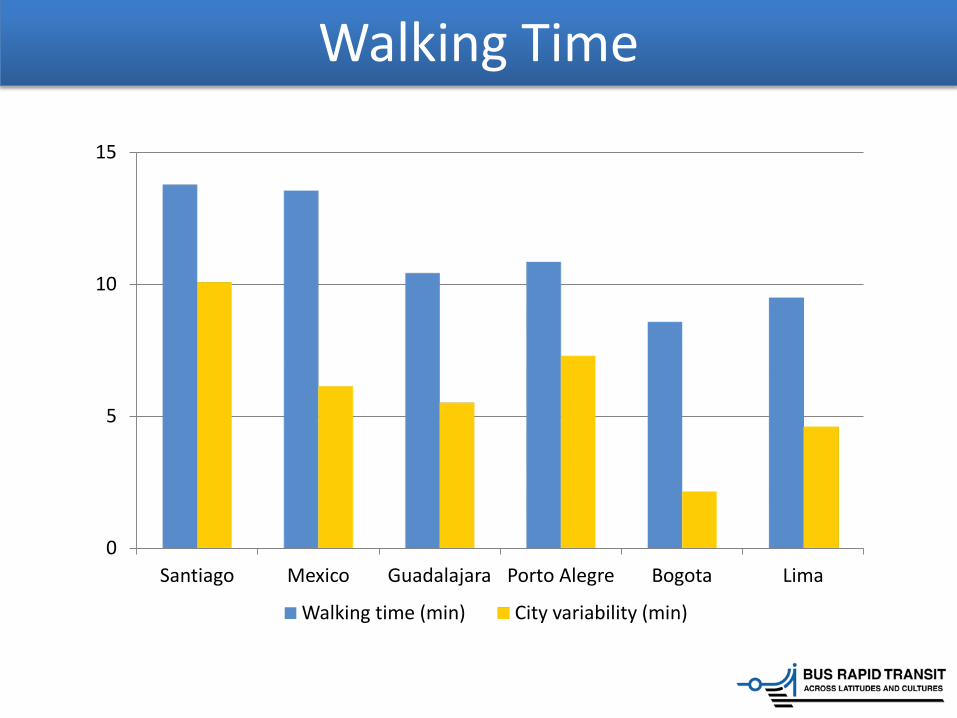
Main results
• The walking times in Santiago and Mexico City are also quite high.
• In Santiago the average distance to access the first vehicle is 383 m, versus 340 m in Lima and 209 m in Bogotá.
• This is partly explained by buses in Santiago stopping only at designated stops.
• Bogotá has low walking times
Walking Time
0
5
10
15
Santiago Mexico Guadalajara Porto Alegre Bogota Lima
Walking time (min) City variability (min)
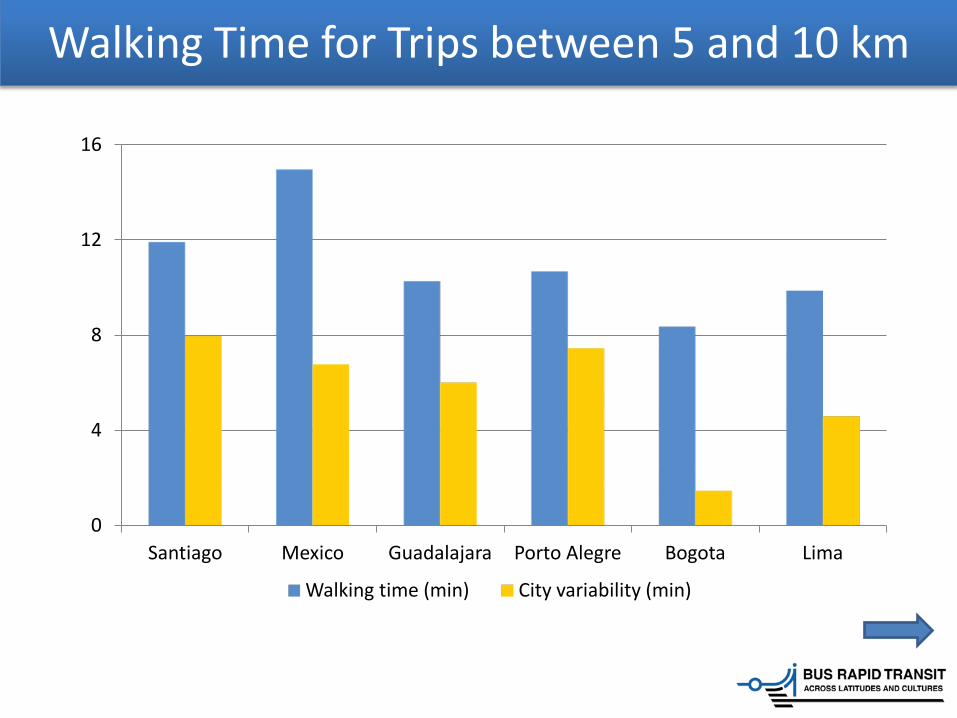
Walking Time for Trips between 5 and 10 km
0
4
8
12
16
Santiago Mexico Guadalajara Porto Alegre Bogota Lima
Walking time (min) City variability (min)
Santiago vs Bogotá
• Santiago and Bogotá have similar populations and average trip length
• Operational speed for each trip length category is also similar
• Average door to door speed in Bogotá is 13.4 km/h while Santiago´s is 14.5 km/h
• However… both cities have followed a very different paths
– Santiago: 100 kms of Metro, declining transit modal share
– Bogotá: 100 kms of BRT, stable? transit modal share • High capacity buses, segregated corridors, extra-vehicular payment
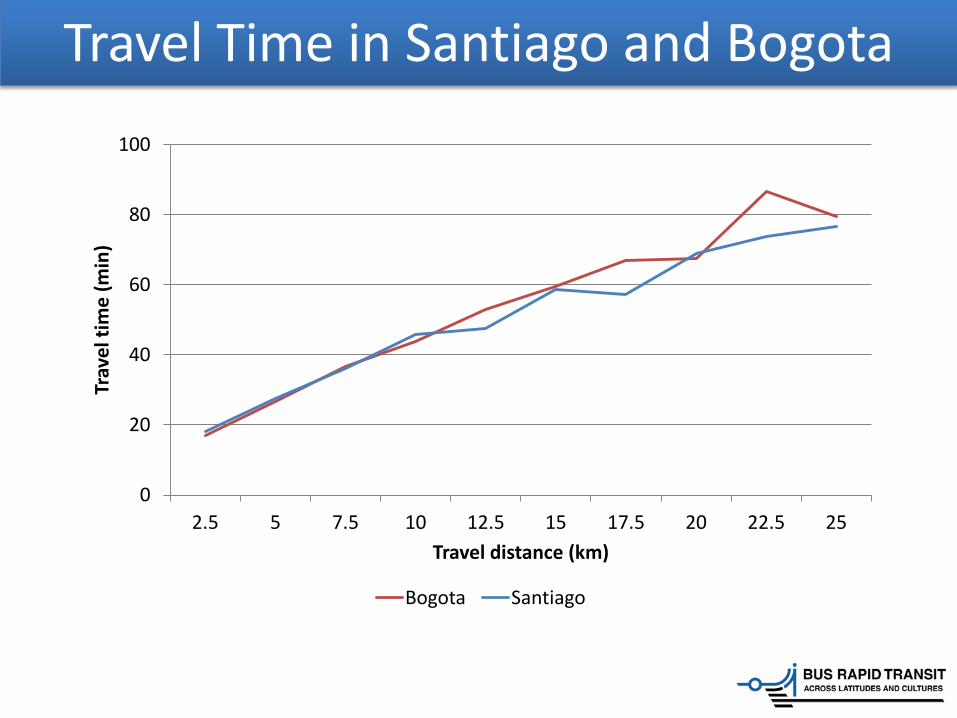
Travel Time in Santiago and Bogota
0
20
40
60
80
100
2.5 5 7.5 10 12.5 15 17.5 20 22.5 25
Trav
el ti
me
(min
)
Travel distance (km)
Bogota Santiago
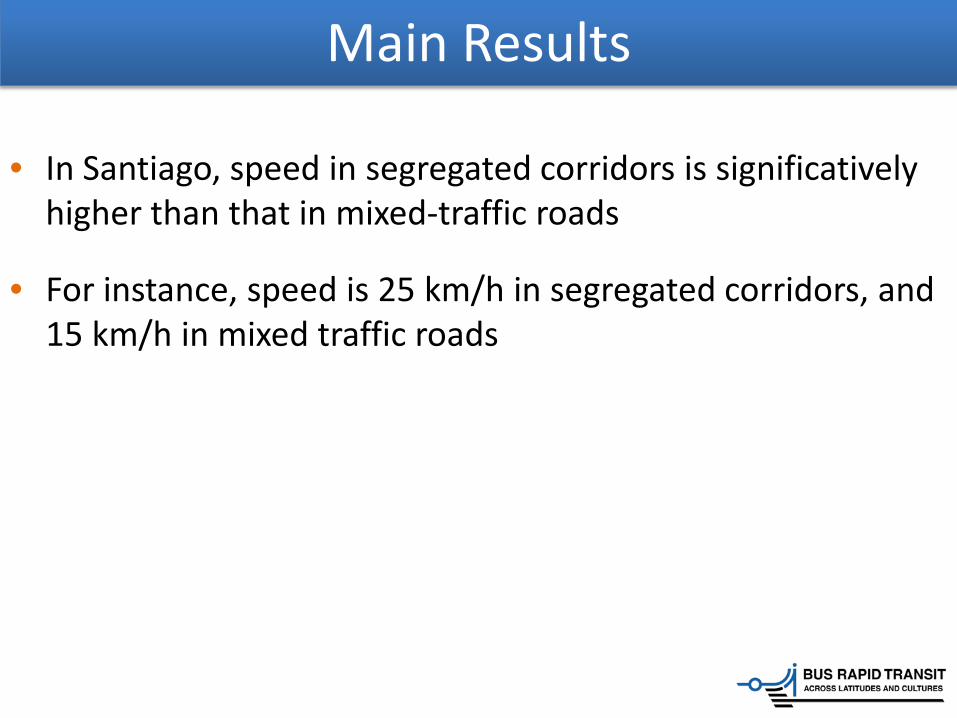
Main Results
• In Santiago, speed in segregated corridors is significatively higher than that in mixed-traffic roads
• For instance, speed is 25 km/h in segregated corridors, and 15 km/h in mixed traffic roads
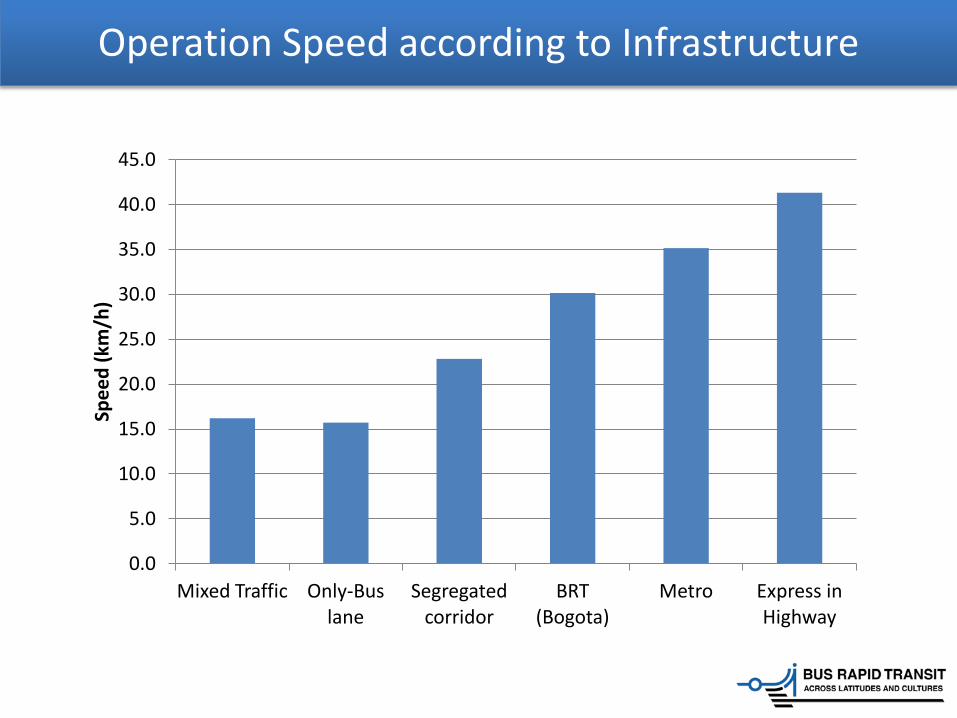
Operation Speed according to Infrastructure
0.0
5.0
10.0
15.0
20.0
25.0
30.0
35.0
40.0
45.0
Mixed Traffic Only-Bus lane
Segregated corridor
BRT (Bogota)
Metro Express in Highway
Spee
d (k
m/h
)
Main Results
• An additional conclusion, which is obtained from the comparison process, is that the information availability is very heterogeneous

Additional Observations
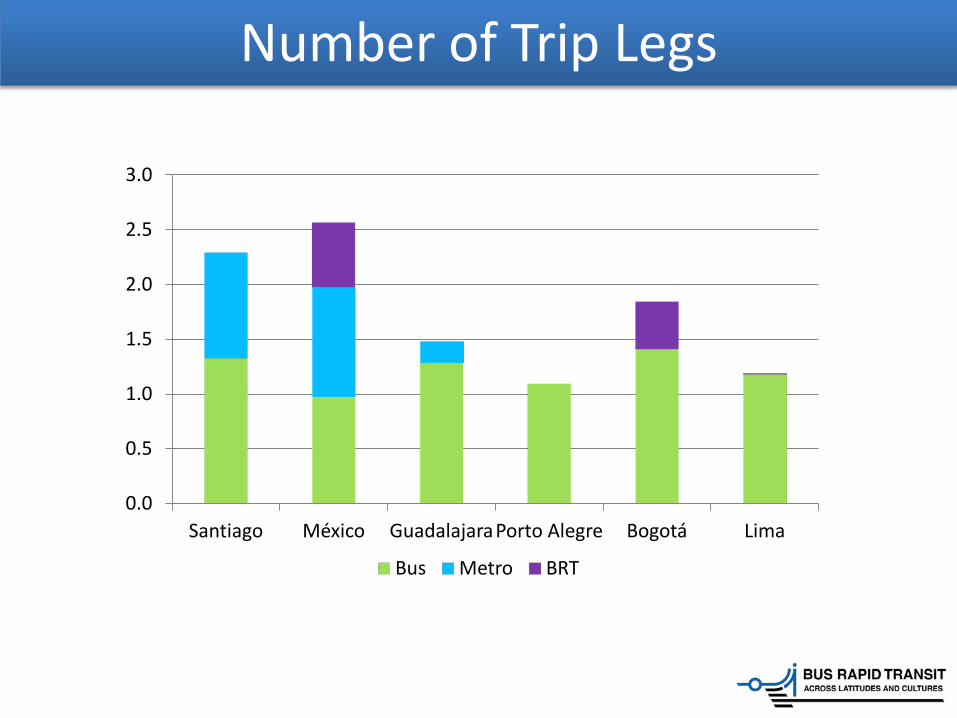
Number of Trip Legs
0.0
0.5
1.0
1.5
2.0
2.5
3.0
Santiago México Guadalajara Porto Alegre Bogotá Lima
Bus Metro BRT
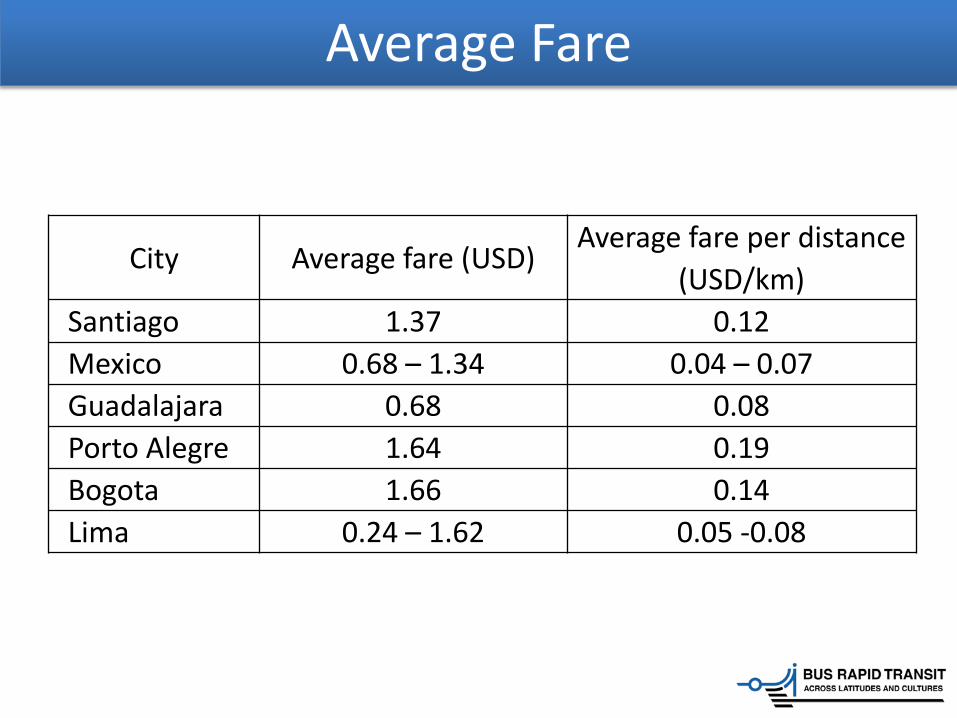
Average Fare
City Average fare (USD) Average fare per distance
(USD/km) Santiago 1.37 0.12 Mexico 0.68 – 1.34 0.04 – 0.07 Guadalajara 0.68 0.08 Porto Alegre 1.64 0.19 Bogota 1.66 0.14 Lima 0.24 – 1.62 0.05 -0.08

Benchmark Report Comparing Six Latin American Public Transport Systems
Juan Carlos Muñoz, Marco Batarce, Ignacia Torres Bus Rapid Transit Centre of Excellence Pontificia Universidad Católica de Chile
June 2013
Detailed Analysis of Santiago (in Spanish)
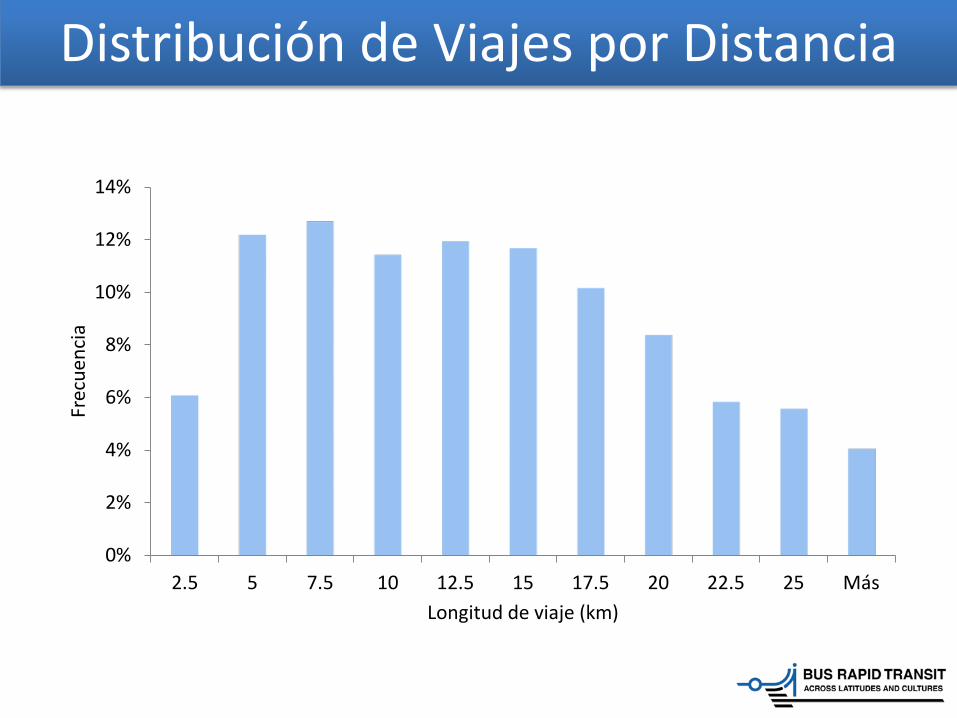
Distribución de Viajes por Distancia
0%
2%
4%
6%
8%
10%
12%
14%
2.5 5 7.5 10 12.5 15 17.5 20 22.5 25 Más
Frec
uenc
ia
Longitud de viaje (km)
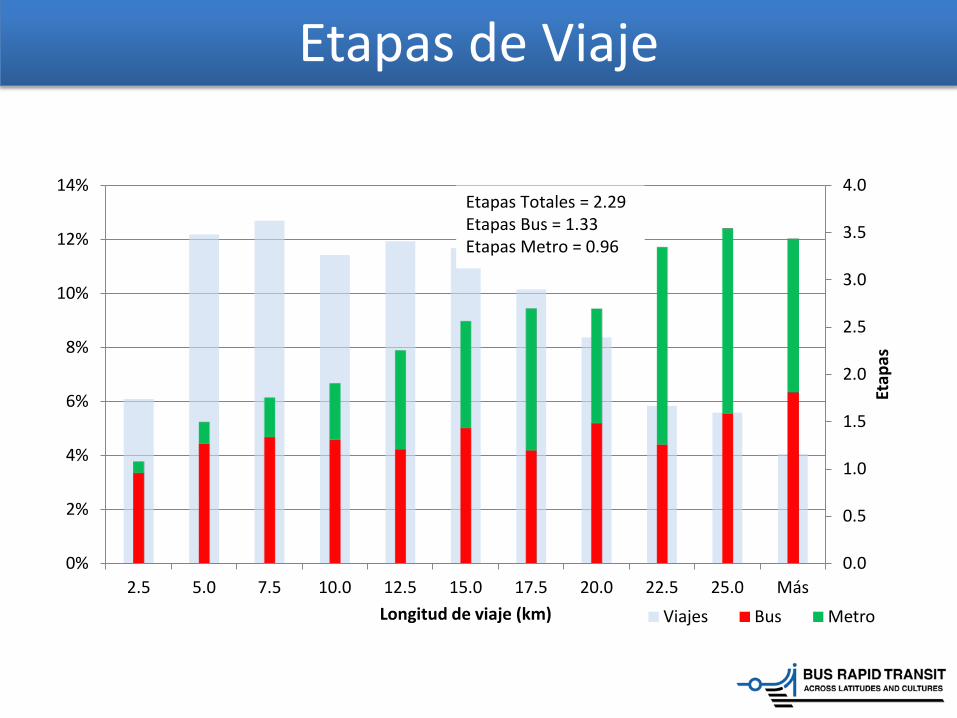
Etapas de Viaje
0.0
0.5
1.0
1.5
2.0
2.5
3.0
3.5
4.0
0%
2%
4%
6%
8%
10%
12%
14%
2.5 5.0 7.5 10.0 12.5 15.0 17.5 20.0 22.5 25.0 Más
Etap
as
Longitud de viaje (km) Viajes Bus Metro
Etapas Totales = 2.29 Etapas Bus = 1.33 Etapas Metro = 0.96
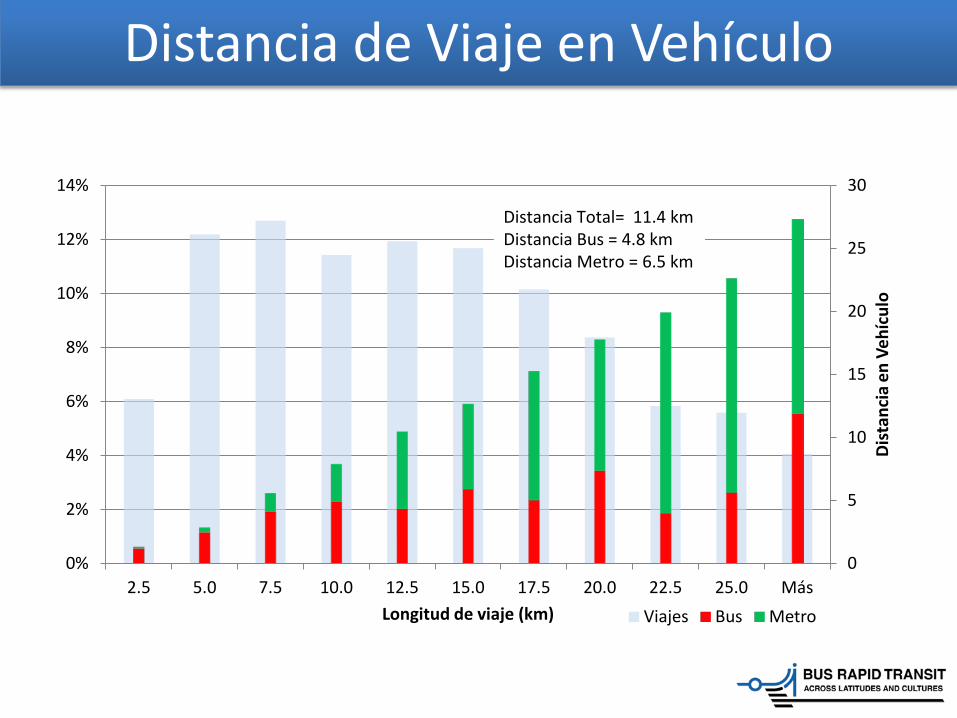
Distancia de Viaje en Vehículo
0
5
10
15
20
25
30
0%
2%
4%
6%
8%
10%
12%
14%
2.5 5.0 7.5 10.0 12.5 15.0 17.5 20.0 22.5 25.0 Más
Dist
anci
a en
Veh
ícul
o
Longitud de viaje (km) Viajes Bus Metro
Distancia Total= 11.4 km Distancia Bus = 4.8 km Distancia Metro = 6.5 km
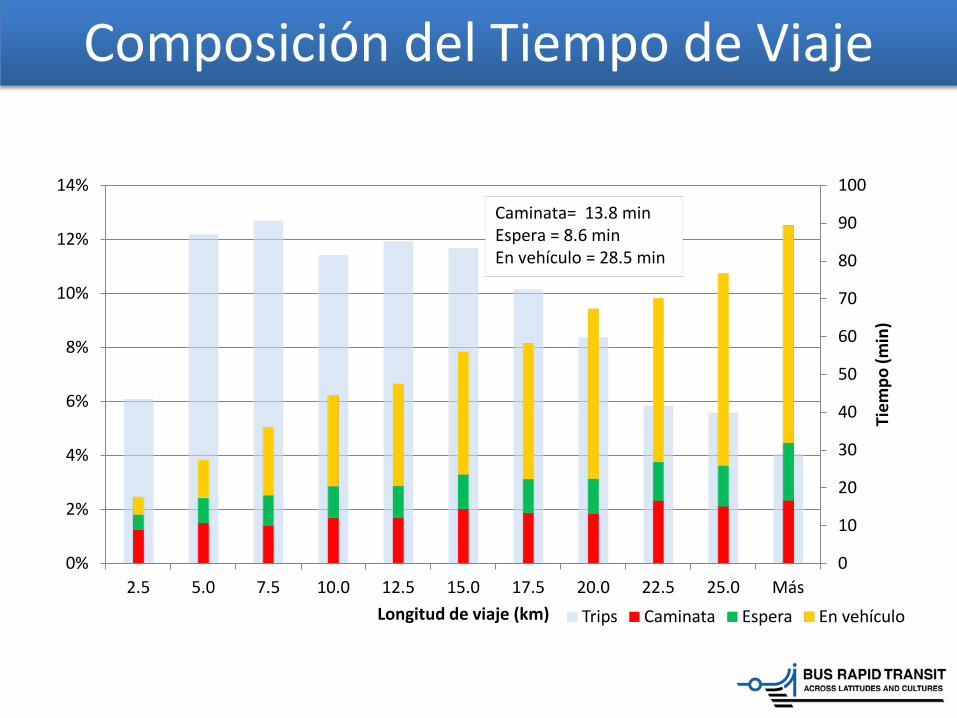
Composición del Tiempo de Viaje
0
10
20
30
40
50
60
70
80
90
100
0%
2%
4%
6%
8%
10%
12%
14%
2.5 5.0 7.5 10.0 12.5 15.0 17.5 20.0 22.5 25.0 Más
Tiem
po (m
in)
Longitud de viaje (km) Trips Caminata Espera En vehículo
Caminata= 13.8 min Espera = 8.6 min En vehículo = 28.5 min
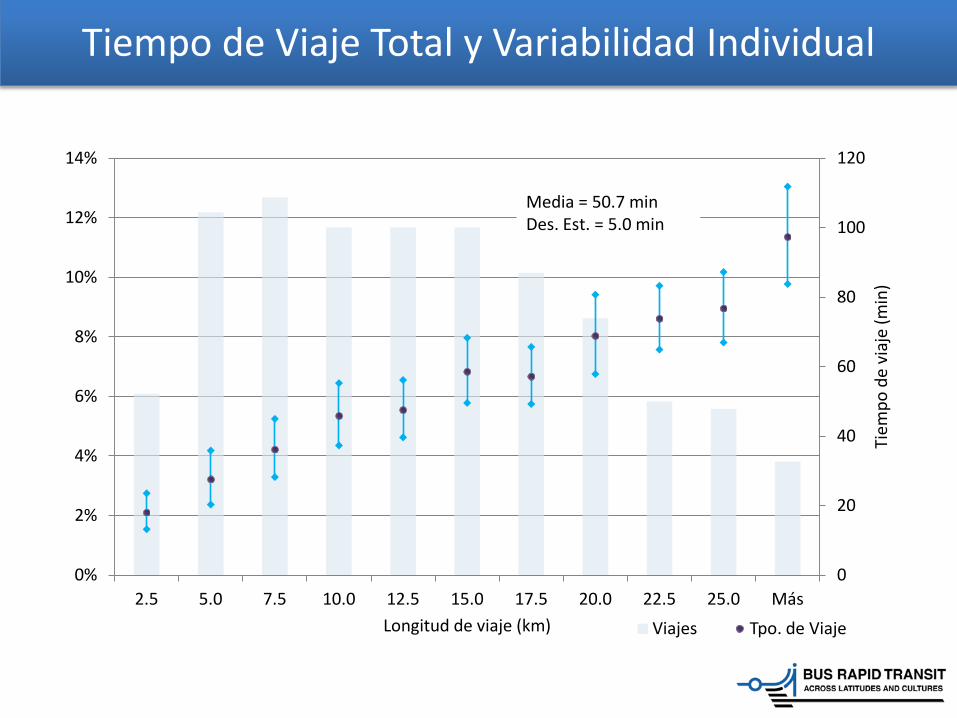
Tiempo de Viaje Total y Variabilidad Individual
0
20
40
60
80
100
120
0%
2%
4%
6%
8%
10%
12%
14%
2.5 5.0 7.5 10.0 12.5 15.0 17.5 20.0 22.5 25.0 Más
Tiem
po d
e vi
aje
(min
)
Longitud de viaje (km) Viajes Tpo. de Viaje
Media = 50.7 min Des. Est. = 5.0 min
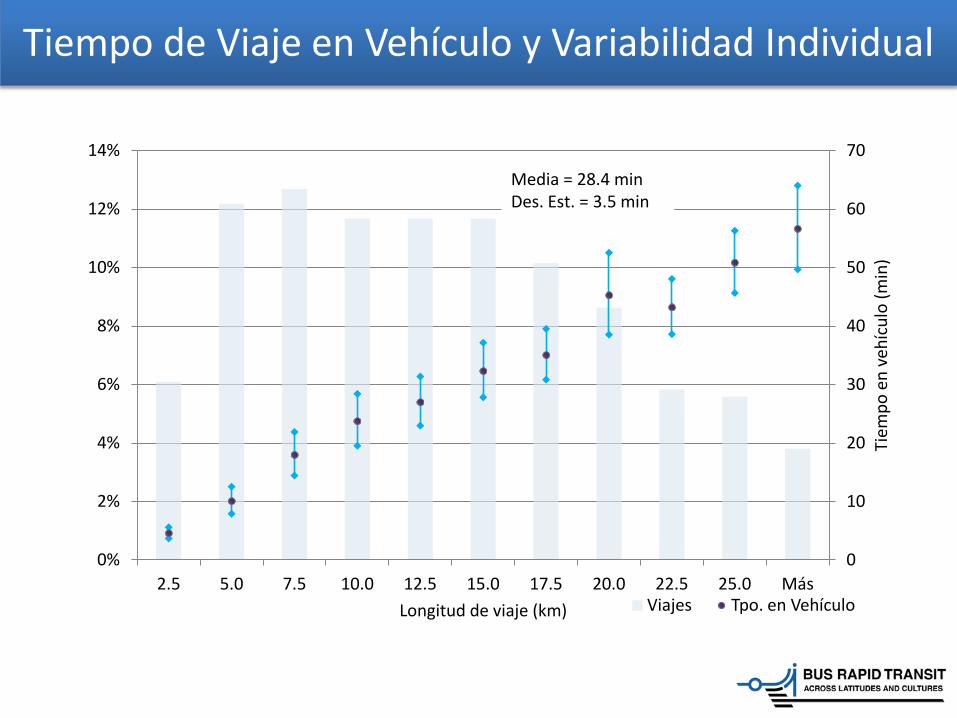
Tiempo de Viaje en Vehículo y Variabilidad Individual
0
10
20
30
40
50
60
70
0%
2%
4%
6%
8%
10%
12%
14%
2.5 5.0 7.5 10.0 12.5 15.0 17.5 20.0 22.5 25.0 Más
Tiem
po e
n ve
hícu
lo (m
in)
Longitud de viaje (km) Viajes Tpo. en Vehículo
Media = 28.4 min Des. Est. = 3.5 min
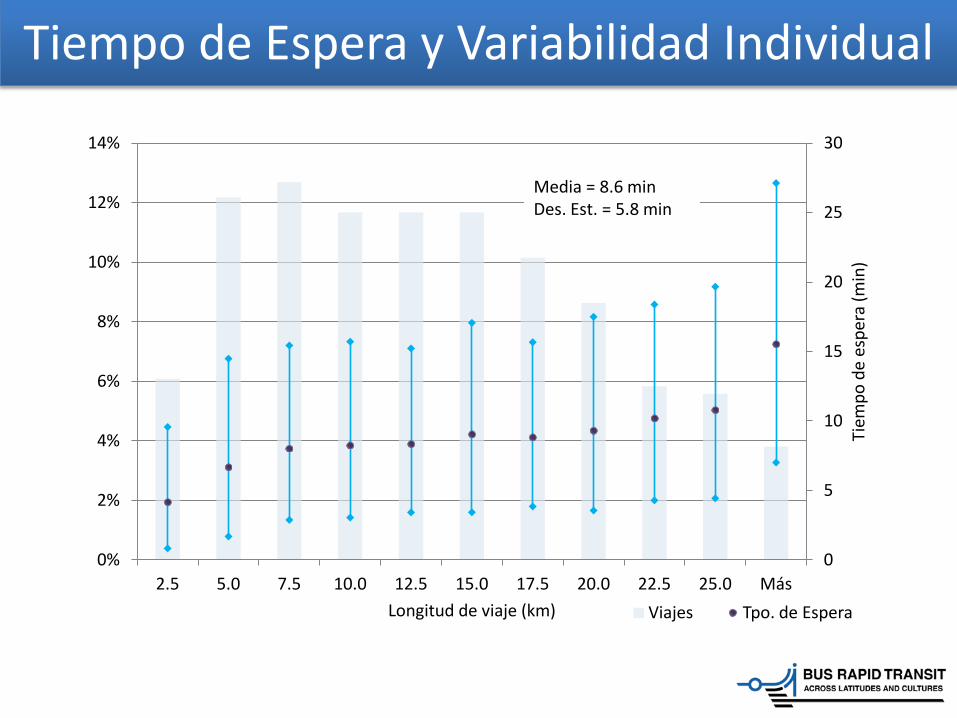
Tiempo de Espera y Variabilidad Individual
0
5
10
15
20
25
30
0%
2%
4%
6%
8%
10%
12%
14%
2.5 5.0 7.5 10.0 12.5 15.0 17.5 20.0 22.5 25.0 Más
Tiem
po d
e es
pera
(min
)
Longitud de viaje (km) Viajes Tpo. de Espera
Media = 8.6 min Des. Est. = 5.8 min
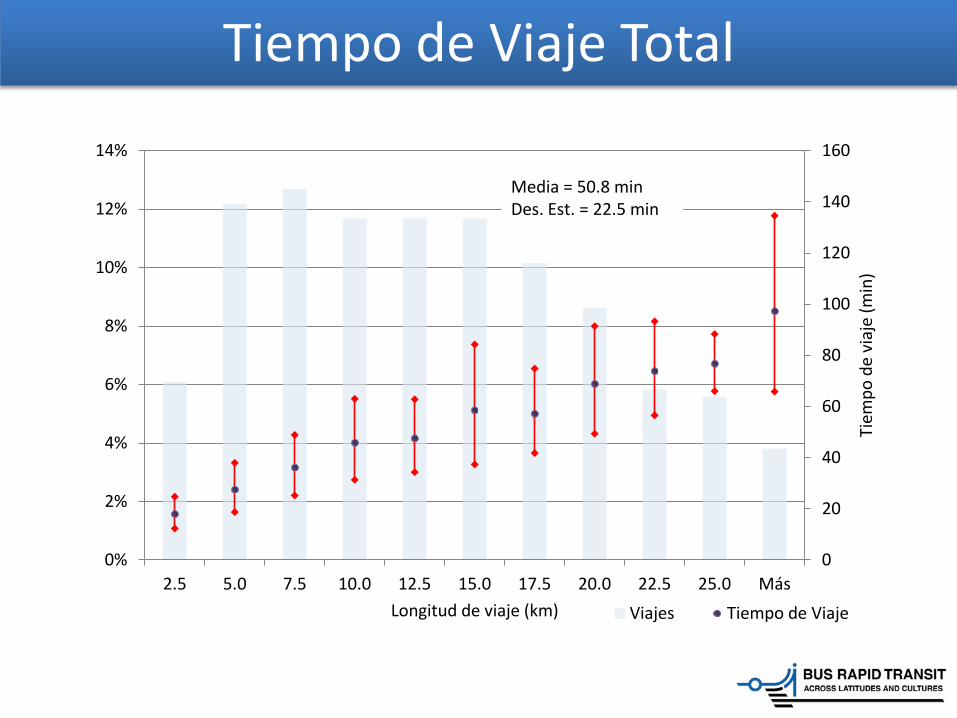
Tiempo de Viaje Total
0
20
40
60
80
100
120
140
160
0%
2%
4%
6%
8%
10%
12%
14%
2.5 5.0 7.5 10.0 12.5 15.0 17.5 20.0 22.5 25.0 Más
Tiem
po d
e vi
aje
(min
)
Longitud de viaje (km) Viajes Tiempo de Viaje
Media = 50.8 min Des. Est. = 22.5 min
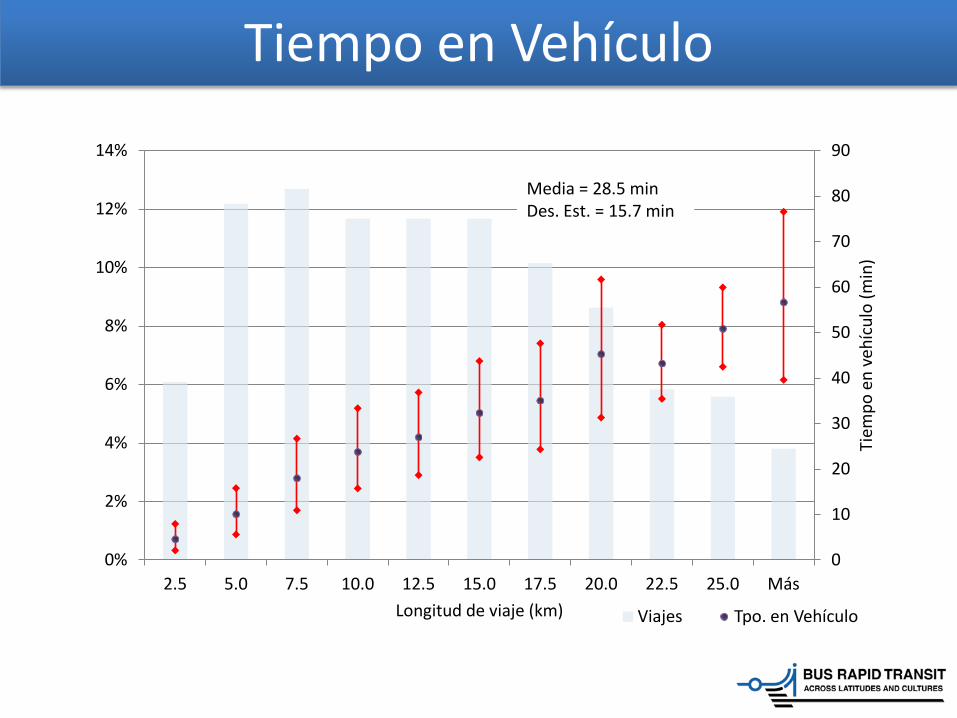
Tiempo en Vehículo
0
10
20
30
40
50
60
70
80
90
0%
2%
4%
6%
8%
10%
12%
14%
2.5 5.0 7.5 10.0 12.5 15.0 17.5 20.0 22.5 25.0 Más
Tiem
po e
n ve
hícu
lo (m
in)
Longitud de viaje (km) Viajes Tpo. en Vehículo
Media = 28.5 min Des. Est. = 15.7 min
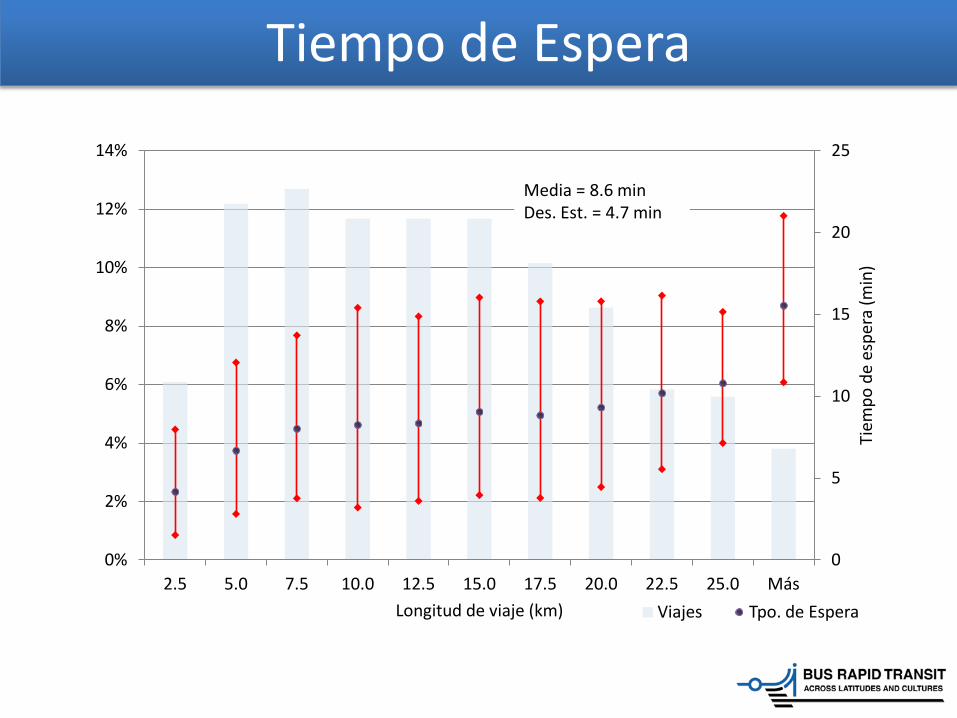
Tiempo de Espera
0
5
10
15
20
25
0%
2%
4%
6%
8%
10%
12%
14%
2.5 5.0 7.5 10.0 12.5 15.0 17.5 20.0 22.5 25.0 Más
Tiem
po d
e es
pera
(min
)
Longitud de viaje (km) Viajes Tpo. de Espera
Media = 8.6 min Des. Est. = 4.7 min
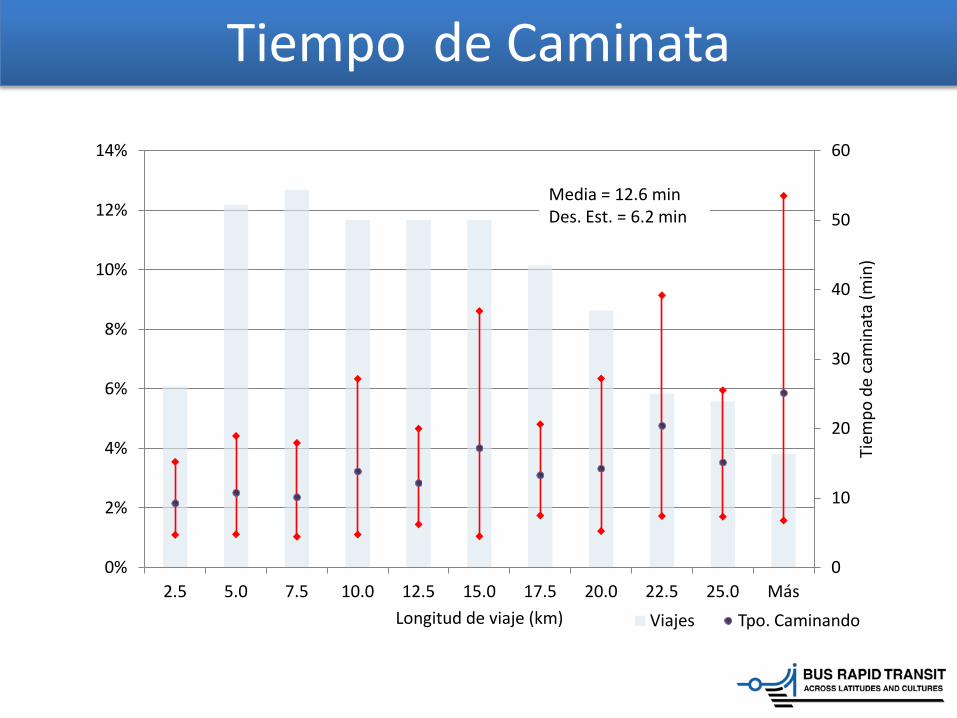
Tiempo de Caminata
0
10
20
30
40
50
60
0%
2%
4%
6%
8%
10%
12%
14%
2.5 5.0 7.5 10.0 12.5 15.0 17.5 20.0 22.5 25.0 Más
Tiem
po d
e ca
min
ata
(min
)
Longitud de viaje (km) Viajes Tpo. Caminando
Media = 12.6 min Des. Est. = 6.2 min
Detailed Analysis of Bogota (in Spanish)
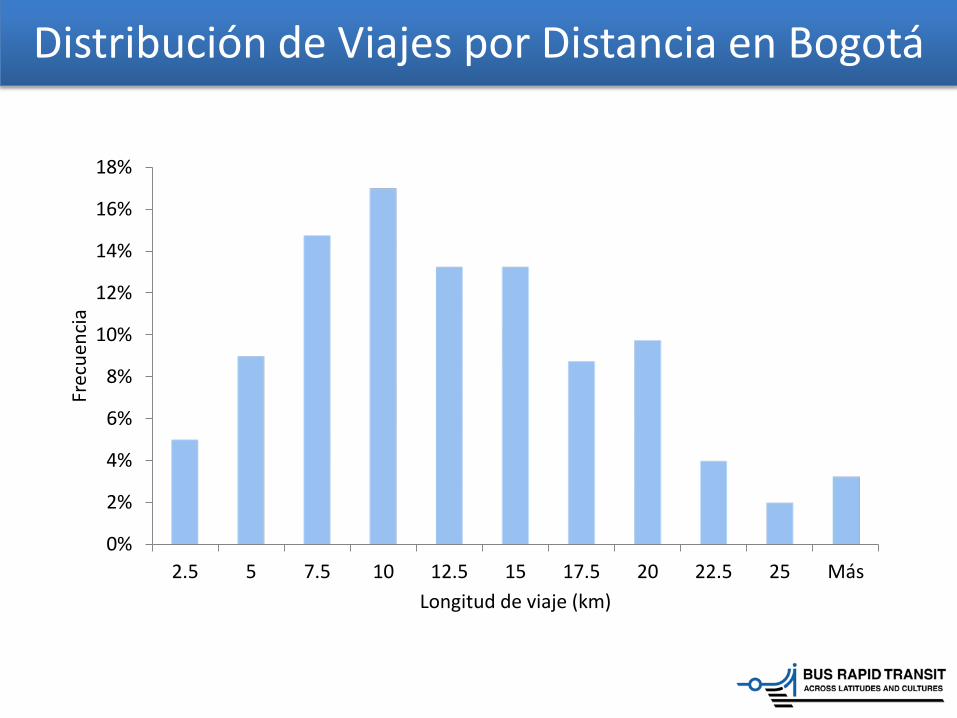
Distribución de Viajes por Distancia en Bogotá
0%
2%
4%
6%
8%
10%
12%
14%
16%
18%
2.5 5 7.5 10 12.5 15 17.5 20 22.5 25 Más
Frec
uenc
ia
Longitud de viaje (km)
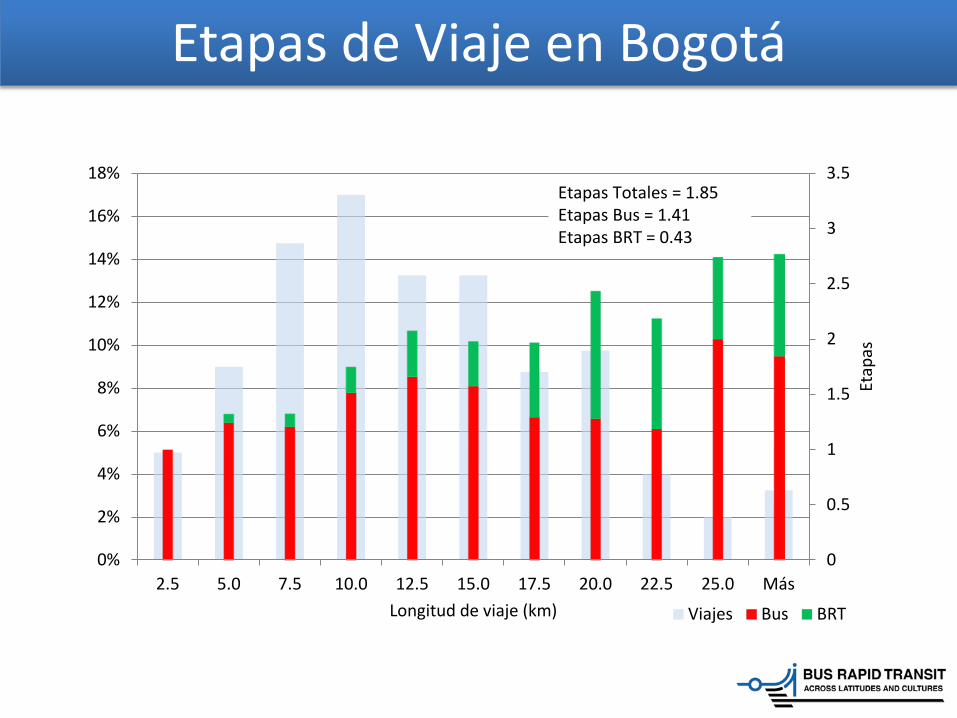
Etapas de Viaje en Bogotá
0
0.5
1
1.5
2
2.5
3
3.5
0%
2%
4%
6%
8%
10%
12%
14%
16%
18%
2.5 5.0 7.5 10.0 12.5 15.0 17.5 20.0 22.5 25.0 Más
Etap
as
Longitud de viaje (km) Viajes Bus BRT
Etapas Totales = 1.85 Etapas Bus = 1.41 Etapas BRT = 0.43
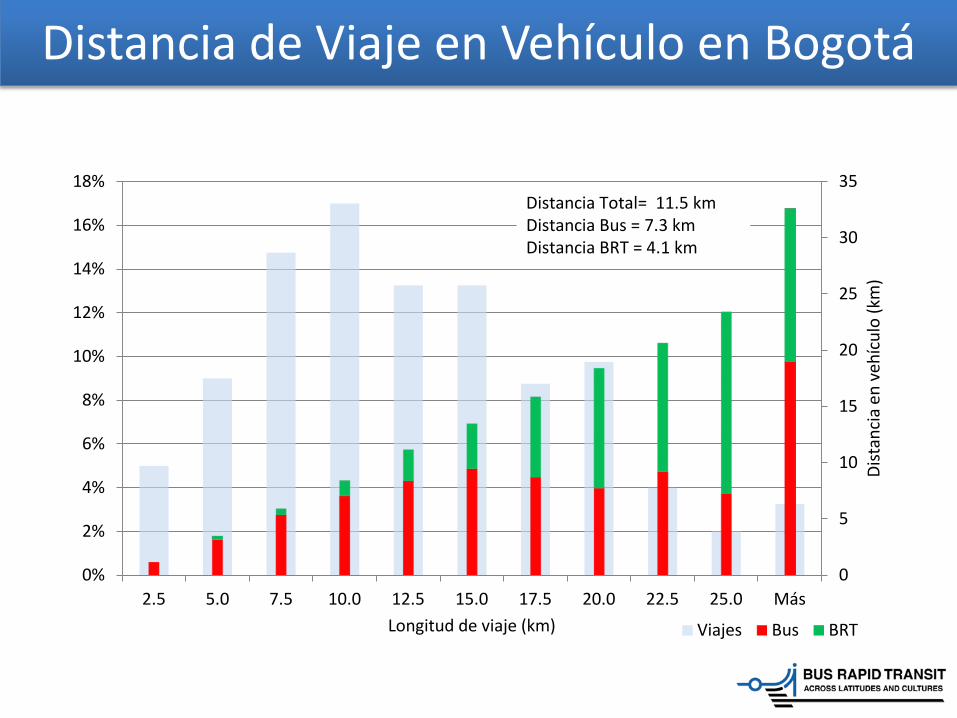
Distancia de Viaje en Vehículo en Bogotá
0
5
10
15
20
25
30
35
0%
2%
4%
6%
8%
10%
12%
14%
16%
18%
2.5 5.0 7.5 10.0 12.5 15.0 17.5 20.0 22.5 25.0 Más
Dist
anci
a en
veh
ícul
o (k
m)
Longitud de viaje (km) Viajes Bus BRT
Distancia Total= 11.5 km Distancia Bus = 7.3 km Distancia BRT = 4.1 km
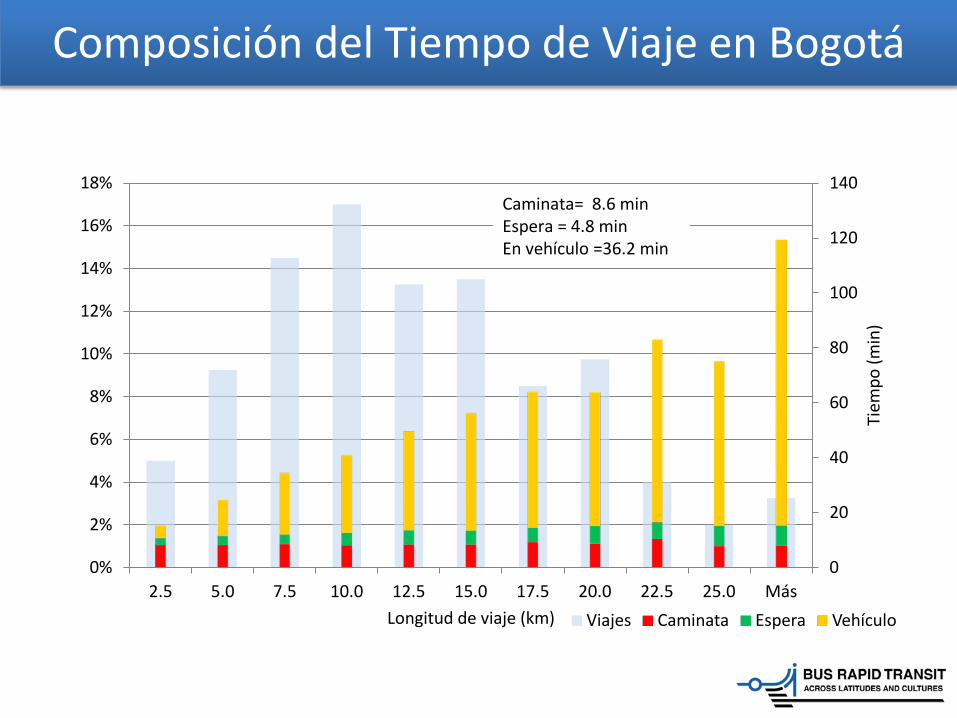
Composición del Tiempo de Viaje en Bogotá
0
20
40
60
80
100
120
140
0%
2%
4%
6%
8%
10%
12%
14%
16%
18%
2.5 5.0 7.5 10.0 12.5 15.0 17.5 20.0 22.5 25.0 Más
Tiem
po (m
in)
Longitud de viaje (km) Viajes Caminata Espera Vehículo
Caminata= 8.6 min Espera = 4.8 min En vehículo =36.2 min
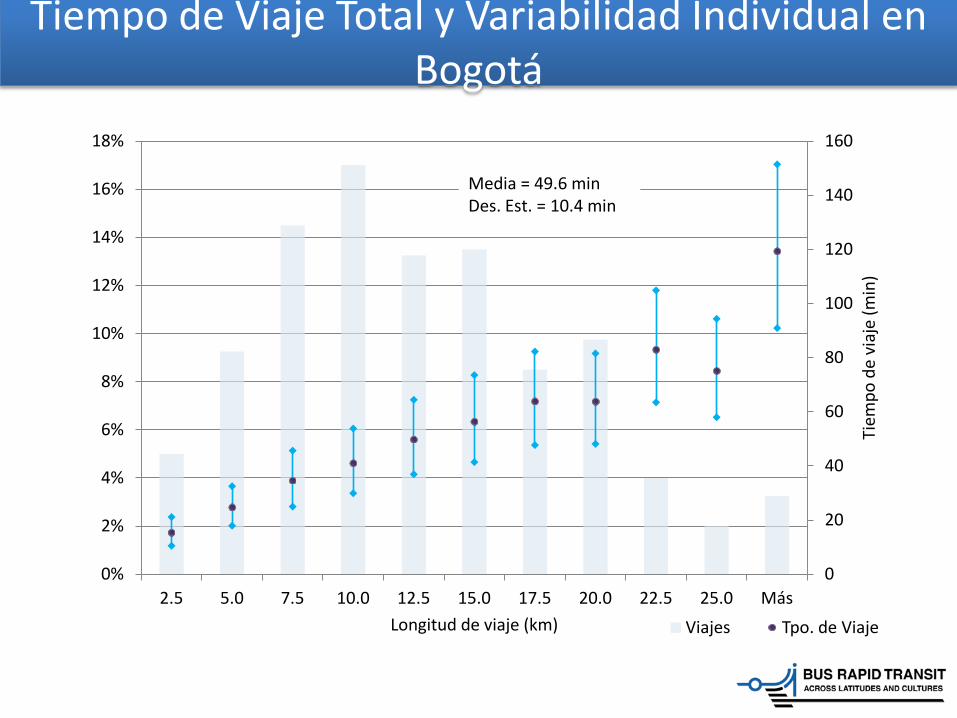
Tiempo de Viaje Total y Variabilidad Individual en Bogotá
0
20
40
60
80
100
120
140
160
0%
2%
4%
6%
8%
10%
12%
14%
16%
18%
2.5 5.0 7.5 10.0 12.5 15.0 17.5 20.0 22.5 25.0 Más
Tiem
po d
e vi
aje
(min
)
Longitud de viaje (km) Viajes Tpo. de Viaje
Media = 49.6 min Des. Est. = 10.4 min
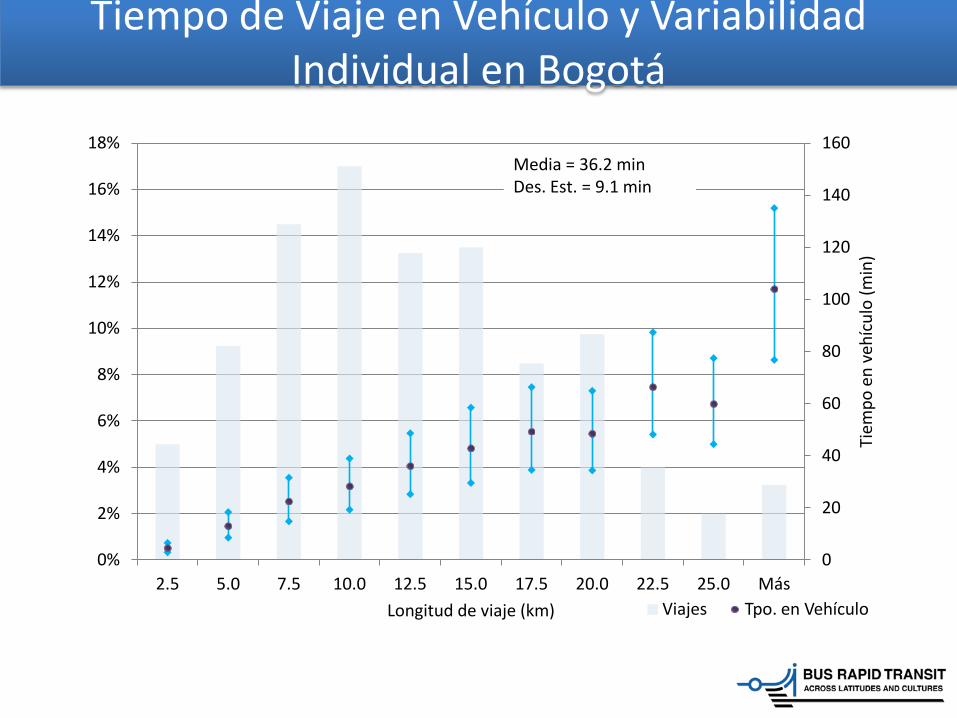
Tiempo de Viaje en Vehículo y Variabilidad Individual en Bogotá
0
20
40
60
80
100
120
140
160
0%
2%
4%
6%
8%
10%
12%
14%
16%
18%
2.5 5.0 7.5 10.0 12.5 15.0 17.5 20.0 22.5 25.0 Más
Tiem
po e
n ve
hícu
lo (m
in)
Longitud de viaje (km) Viajes Tpo. en Vehículo
Media = 36.2 min Des. Est. = 9.1 min
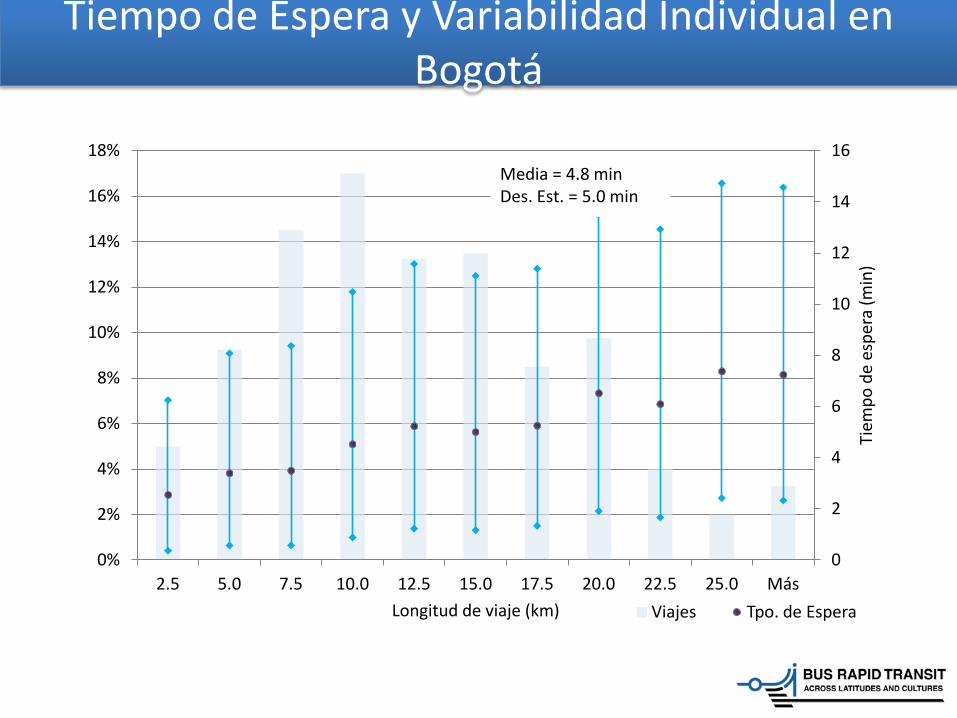
Tiempo de Espera y Variabilidad Individual en Bogotá
0
2
4
6
8
10
12
14
16
0%
2%
4%
6%
8%
10%
12%
14%
16%
18%
2.5 5.0 7.5 10.0 12.5 15.0 17.5 20.0 22.5 25.0 Más
Tiem
po d
e es
pera
(min
)
Longitud de viaje (km) Viajes Tpo. de Espera
Media = 4.8 min Des. Est. = 5.0 min
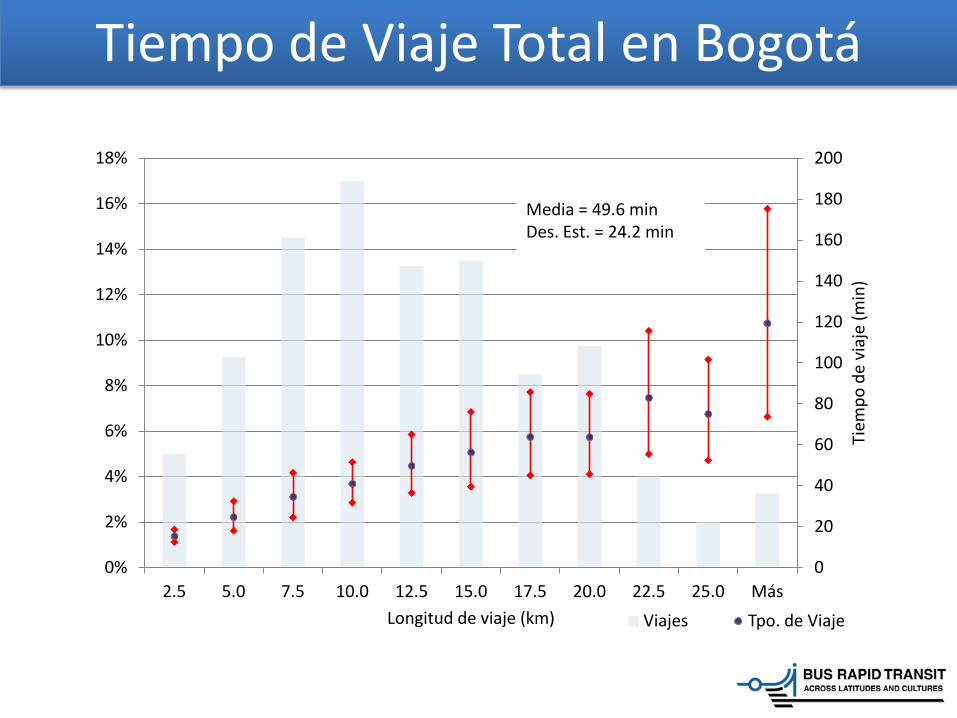
Tiempo de Viaje Total en Bogotá
0
20
40
60
80
100
120
140
160
180
200
0%
2%
4%
6%
8%
10%
12%
14%
16%
18%
2.5 5.0 7.5 10.0 12.5 15.0 17.5 20.0 22.5 25.0 Más
Tiem
po d
e vi
aje
(min
)
Longitud de viaje (km) Viajes Tpo. de Viaje
Media = 49.6 min Des. Est. = 24.2 min
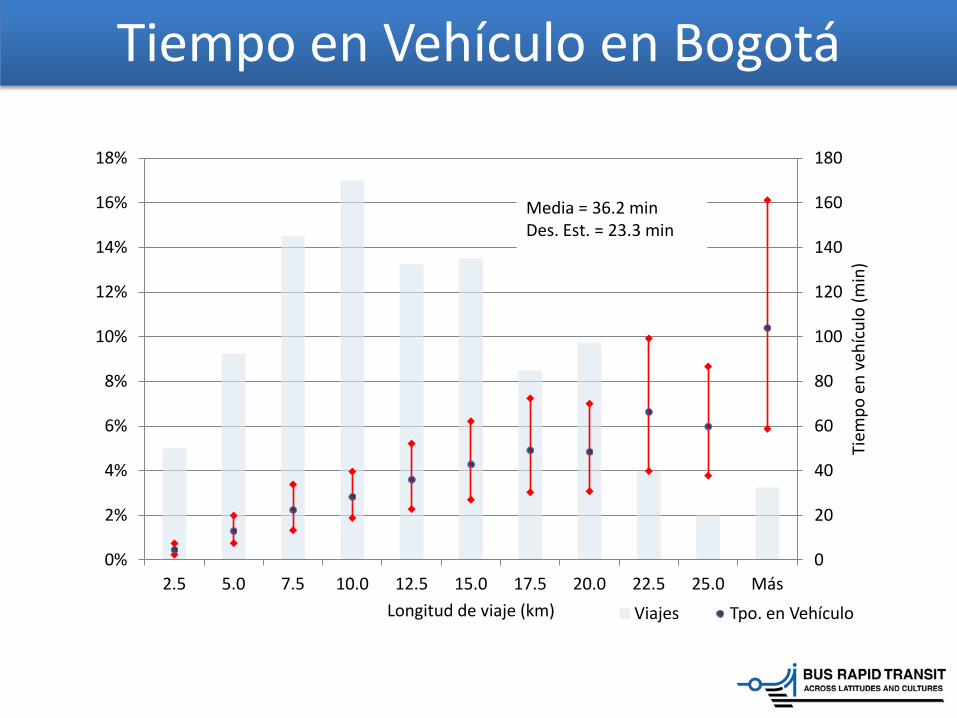
Tiempo en Vehículo en Bogotá
0
20
40
60
80
100
120
140
160
180
0%
2%
4%
6%
8%
10%
12%
14%
16%
18%
2.5 5.0 7.5 10.0 12.5 15.0 17.5 20.0 22.5 25.0 Más
Tiem
po e
n ve
hícu
lo (m
in)
Longitud de viaje (km) Viajes Tpo. en Vehículo
Media = 36.2 min Des. Est. = 23.3 min
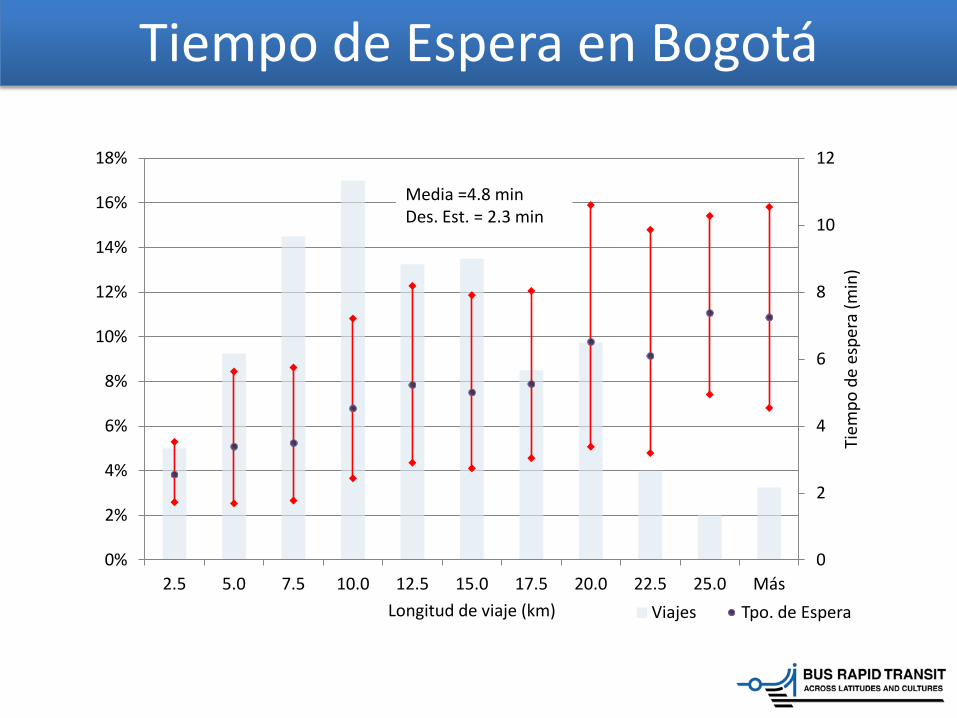
Tiempo de Espera en Bogotá
0
2
4
6
8
10
12
0%
2%
4%
6%
8%
10%
12%
14%
16%
18%
2.5 5.0 7.5 10.0 12.5 15.0 17.5 20.0 22.5 25.0 Más
Tiem
po d
e es
pera
(min
)
Longitud de viaje (km) Viajes Tpo. de Espera
Media =4.8 min Des. Est. = 2.3 min
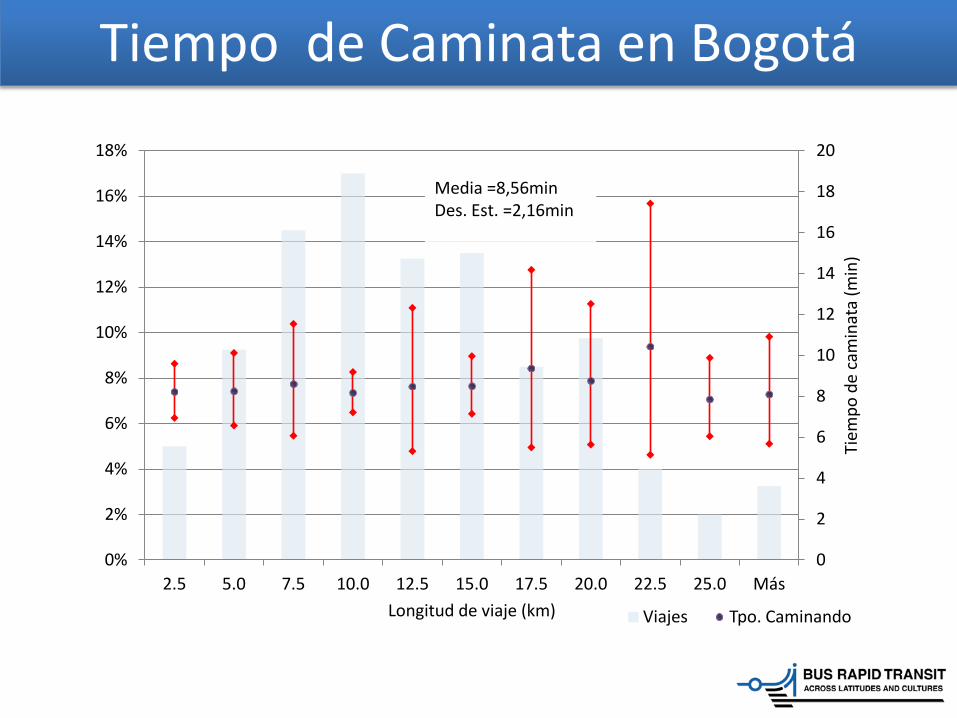
Tiempo de Caminata en Bogotá
0
2
4
6
8
10
12
14
16
18
20
0%
2%
4%
6%
8%
10%
12%
14%
16%
18%
2.5 5.0 7.5 10.0 12.5 15.0 17.5 20.0 22.5 25.0 Más
Tiem
po d
e ca
min
ata
(min
)
Longitud de viaje (km) Viajes Tpo. Caminando
Media =8,56min Des. Est. =2,16min