Embed Size (px)
Citation preview
District Spatial Plan - Thrissur LAND USE
Department of Town & Country Planning, KeralaDepartment of Town & Country Planning, Kerala
Use of a percent of land is indicated by the pre-
dominant activity be it agriculture, residential, com-
mercial, forest etc, for which the land is put to. Hence
the analysis of the existing land use is inevitable to
understand the predominant economic activities of an
area as well as the availability of vacant land for future
economic activities. In order to spatially analyze the
land use pattern and economic activity as well as link-
ages between them land use survey in all the 99 LSGs in
the district has to be completed. However this will take
considerable time period. The source of the data is from
Satellite Data from IRS P6 LISS-IV Mx/ LISS- III/
PAN 2003-‘04 (India Satellite Data). The Data forms part
of the Natural Resources and Environmental Data Base
(NREDB). The Data on Land Use has been procured from
Kerala State Land use Board. The above data base is
predominantly agriculture oriented and as such the
Chapter –5LAND USE
analysis limited to that extent.
5.1 LAND USE PATTERN OF KERALA STATE
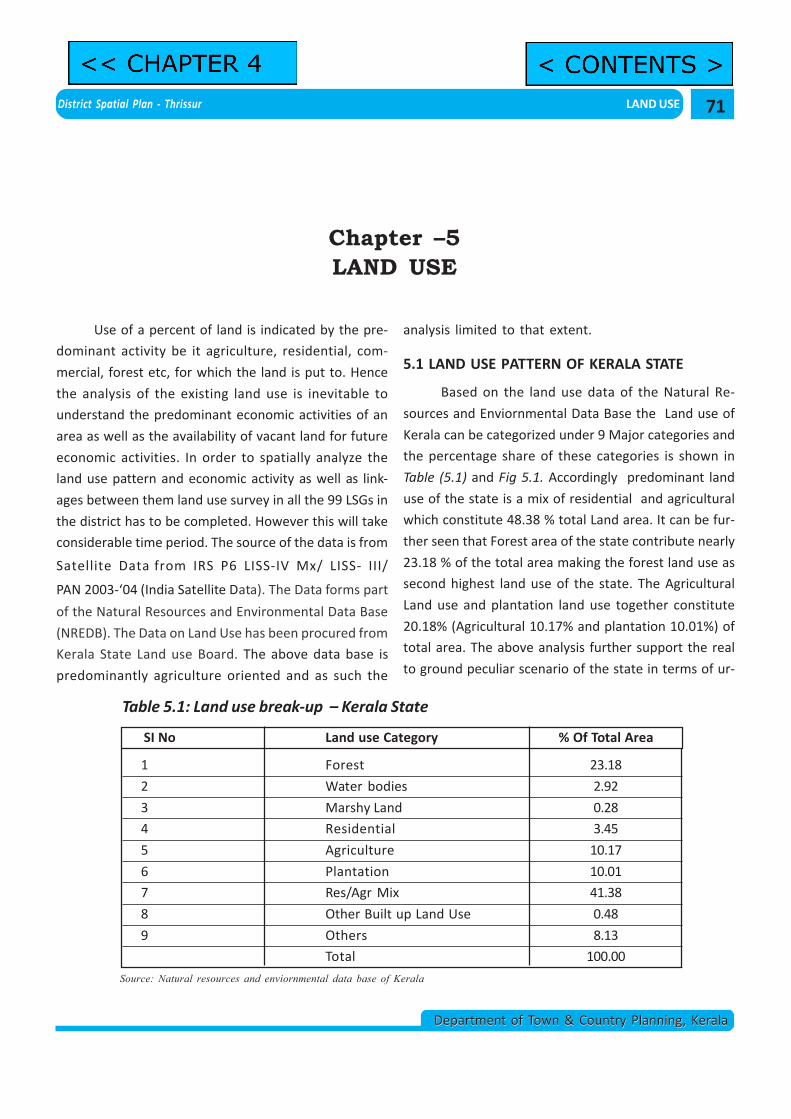
Based on the land use data of the Natural Re-
sources and Enviornmental Data Base the Land use of
Kerala can be categorized under 9 Major categories and
the percentage share of these categories is shown in
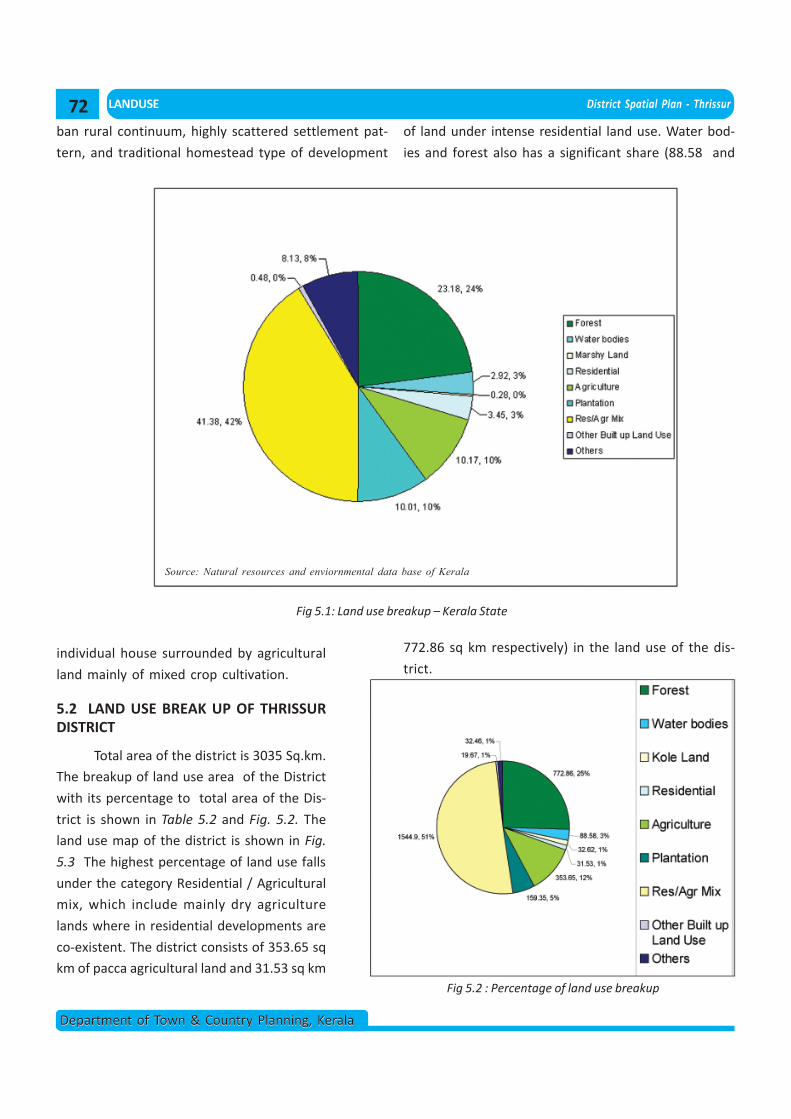
Table (5.1) and Fig 5.1. Accordingly predominant land
use of the state is a mix of residential and agricultural
which constitute 48.38 % total Land area. It can be fur-
ther seen that Forest area of the state contribute nearly
23.18 % of the total area making the forest land use as
second highest land use of the state. The Agricultural
Land use and plantation land use together constitute
20.18% (Agricultural 10.17% and plantation 10.01%) of
total area. The above analysis further support the real
to ground peculiar scenario of the state in terms of ur-
Table 5.1: Land use break-up – Kerala State
SI No Land use Category % Of Total Area
1 Forest 23.18
2 Water bodies 2.92
3 Marshy Land 0.28
4 Residential 3.45
5 Agriculture 10.17
6 Plantation 10.01
7 Res/Agr Mix 41.38
8 Other Built up Land Use 0.48
9 Others 8.13
Total 100.00
Source: Natural resources and enviornmental data base of Kerala
71
LANDUSE District Spatial Plan - Thrissur
Department of Town & Country Planning, KeralaDepartment of Town & Country Planning, Kerala
ban rural continuum, highly scattered settlement pat-
tern, and traditional homestead type of development
23.18%
8.13%
10.01%
10.17%
41.38x
Source: Natural resources and enviornmental data base of Kerala
Fig 5.1: Land use breakup – Kerala State
individual house surrounded by agricultural
land mainly of mixed crop cultivation.
5.2 LAND USE BREAK UP OF THRISSURDISTRICT
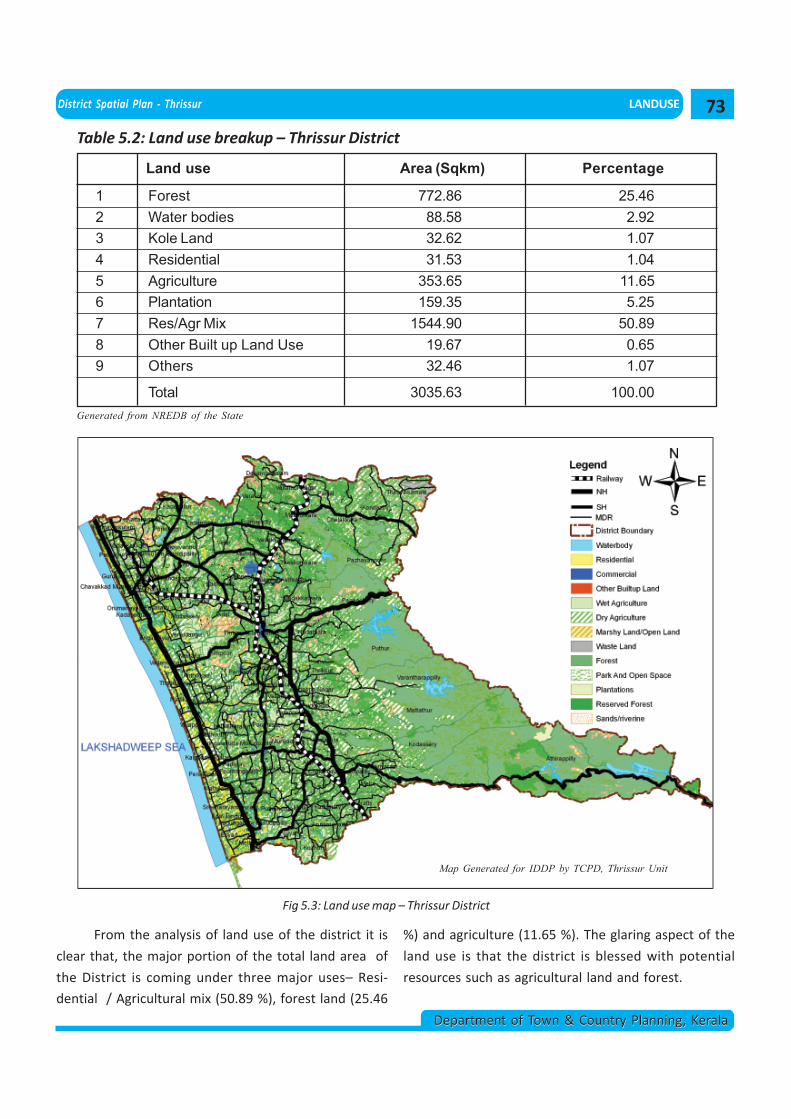
Total area of the district is 3035 Sq.km.
The breakup of land use area of the District
with its percentage to total area of the Dis-
trict is shown in Table 5.2 and Fig. 5.2. The
land use map of the district is shown in Fig.
5.3 The highest percentage of land use falls
under the category Residential / Agricultural
mix, which include mainly dry agriculture
lands where in residential developments are
co-existent. The district consists of 353.65 sq
km of pacca agricultural land and 31.53 sq kmFig 5.2 : Percentage of land use breakup
of land under intense residential land use. Water bod-
ies and forest also has a significant share (88.58 and
772.86 sq km respectively) in the land use of the dis-
trict.
72
District Spatial Plan - Thrissur LANDUSE
Department of Town & Country Planning, KeralaDepartment of Town & Country Planning, Kerala
Table 5.2: Land use breakup – Thrissur District
SI No. Land use Area (Sqkm) Percentage
1 Forest 772.86 25.462 Water bodies 88.58 2.923 Kole Land 32.62 1.074 Residential 31.53 1.045 Agriculture 353.65 11.656 Plantation 159.35 5.257 Res/Agr Mix 1544.90 50.898 Other Built up Land Use 19.67 0.659 Others 32.46 1.07
Total 3035.63 100.00Generated from NREDB of the State
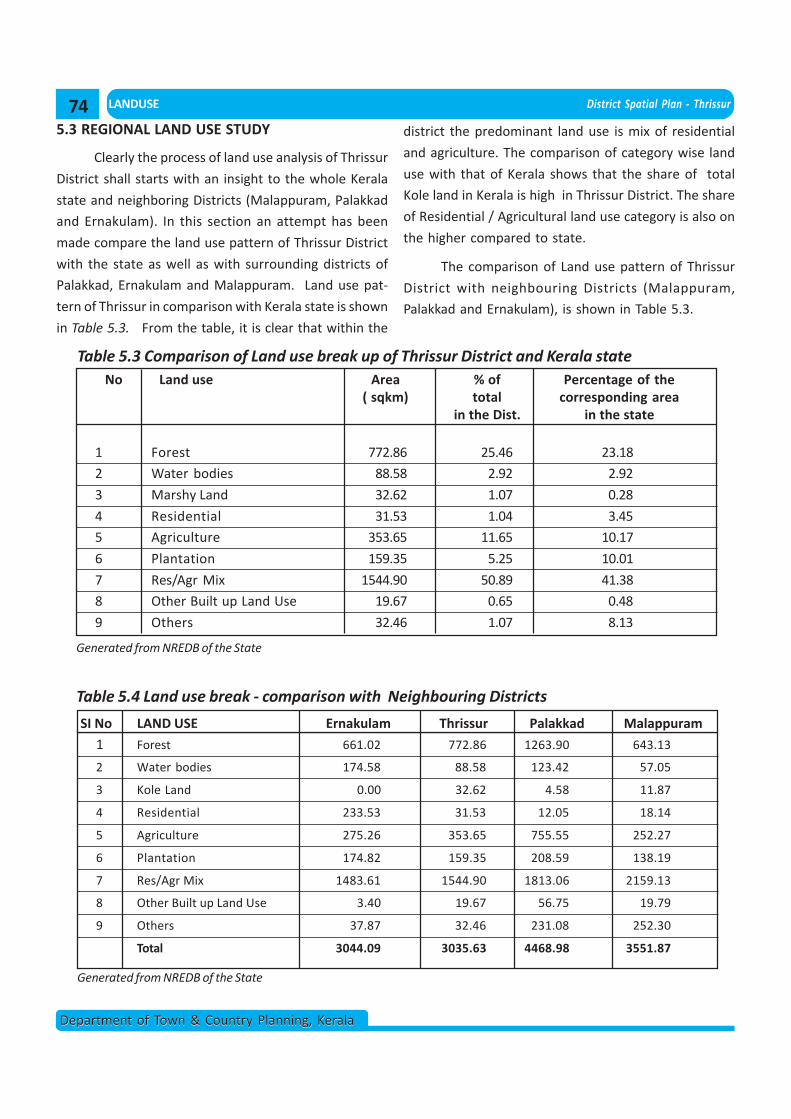
Fig 5.3: Land use map – Thrissur District
From the analysis of land use of the district it is
clear that, the major portion of the total land area of
the District is coming under three major uses– Resi-
dential / Agricultural mix (50.89 %), forest land (25.46
Map Generated for IDDP by TCPD, Thrissur Unit
%) and agriculture (11.65 %). The glaring aspect of the
land use is that the district is blessed with potential
resources such as agricultural land and forest.
73
LANDUSE District Spatial Plan - Thrissur
Department of Town & Country Planning, KeralaDepartment of Town & Country Planning, Kerala
5.3 REGIONAL LAND USE STUDY
Clearly the process of land use analysis of Thrissur
District shall starts with an insight to the whole Kerala
state and neighboring Districts (Malappuram, Palakkad
and Ernakulam). In this section an attempt has been
made compare the land use pattern of Thrissur District
with the state as well as with surrounding districts of
Palakkad, Ernakulam and Malappuram. Land use pat-
tern of Thrissur in comparison with Kerala state is shown
in Table 5.3. From the table, it is clear that within the
SI No Land use Area % of Percentage of the( sqkm) total corresponding area
in the Dist. in the state
1 Forest 772.86 25.46 23.18
2 Water bodies 88.58 2.92 2.92
3 Marshy Land 32.62 1.07 0.28
4 Residential 31.53 1.04 3.45
5 Agriculture 353.65 11.65 10.17
6 Plantation 159.35 5.25 10.01
7 Res/Agr Mix 1544.90 50.89 41.38
8 Other Built up Land Use 19.67 0.65 0.48
9 Others 32.46 1.07 8.13
Table 5.4 Land use break - comparison with Neighbouring Districts
Generated from NREDB of the State
SI No LAND USE Ernakulam Thrissur Palakkad Malappuram
1 Forest 661.02 772.86 1263.90 643.13
2 Water bodies 174.58 88.58 123.42 57.05
3 Kole Land 0.00 32.62 4.58 11.87
4 Residential 233.53 31.53 12.05 18.14
5 Agriculture 275.26 353.65 755.55 252.27
6 Plantation 174.82 159.35 208.59 138.19
7 Res/Agr Mix 1483.61 1544.90 1813.06 2159.13
8 Other Built up Land Use 3.40 19.67 56.75 19.79
9 Others 37.87 32.46 231.08 252.30
Total 3044.09 3035.63 4468.98 3551.87
Generated from NREDB of the State
Table 5.3 Comparison of Land use break up of Thrissur District and Kerala state
district the predominant land use is mix of residential
and agriculture. The comparison of category wise land
use with that of Kerala shows that the share of total
Kole land in Kerala is high in Thrissur District. The share
of Residential / Agricultural land use category is also on
the higher compared to state.
The comparison of Land use pattern of Thrissur
District with neighbouring Districts (Malappuram,
Palakkad and Ernakulam), is shown in Table 5.3.
74
District Spatial Plan - Thrissur LANDUSE
Department of Town & Country Planning, KeralaDepartment of Town & Country Planning, Kerala
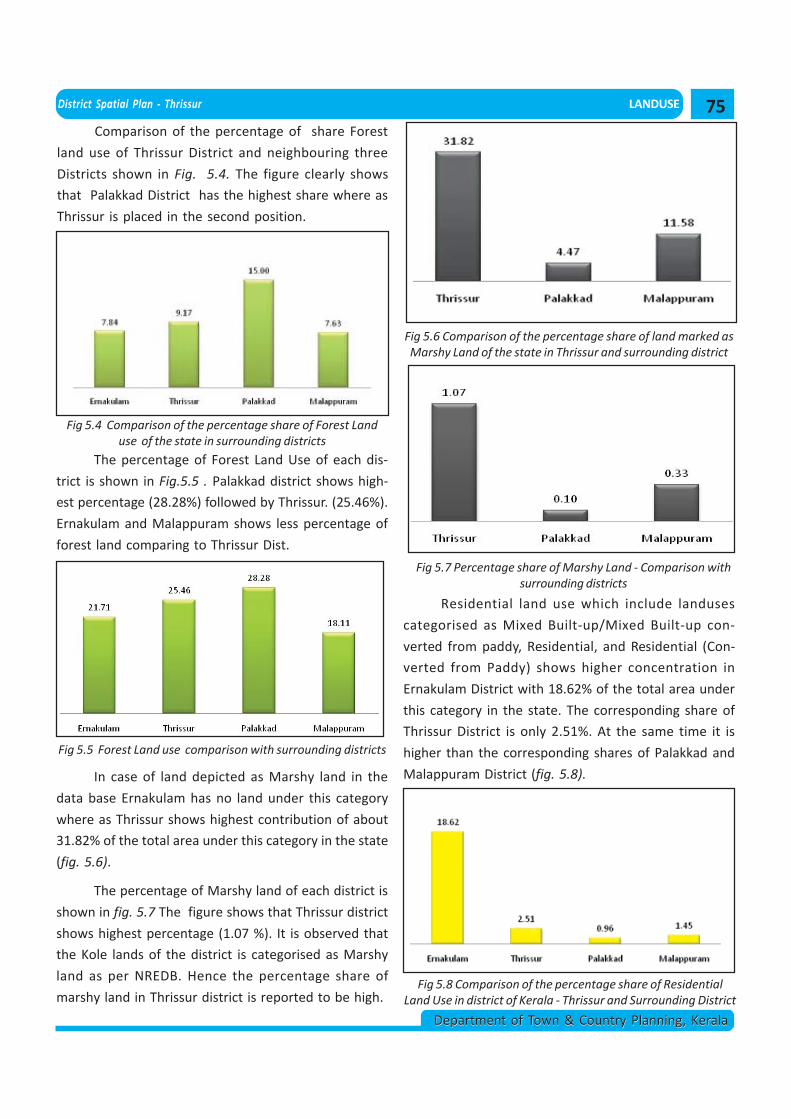
Comparison of the percentage of share Forest
land use of Thrissur District and neighbouring three
Districts shown in Fig. 5.4. The figure clearly shows
that Palakkad District has the highest share where as
Thrissur is placed in the second position.
Fig 5.4 Comparison of the percentage share of Forest Landuse of the state in surrounding districts
Fig 5.5 Forest Land use comparison with surrounding districts
The percentage of Forest Land Use of each dis-
trict is shown in Fig.5.5 . Palakkad district shows high-
est percentage (28.28%) followed by Thrissur. (25.46%).
Ernakulam and Malappuram shows less percentage of
forest land comparing to Thrissur Dist.
In case of land depicted as Marshy land in the
data base Ernakulam has no land under this category
where as Thrissur shows highest contribution of about
31.82% of the total area under this category in the state
(fig. 5.6).
The percentage of Marshy land of each district is
shown in fig. 5.7 The figure shows that Thrissur district
shows highest percentage (1.07 %). It is observed that
the Kole lands of the district is categorised as Marshy
land as per NREDB. Hence the percentage share of
marshy land in Thrissur district is reported to be high.
Fig 5.6 Comparison of the percentage share of land marked asMarshy Land of the state in Thrissur and surrounding district
Fig 5.7 Percentage share of Marshy Land - Comparison withsurrounding districts
Residential land use which include landuses
categorised as Mixed Built-up/Mixed Built-up con-
verted from paddy, Residential, and Residential (Con-
verted from Paddy) shows higher concentration in
Ernakulam District with 18.62% of the total area under
this category in the state. The corresponding share of
Thrissur District is only 2.51%. At the same time it is
higher than the corresponding shares of Palakkad and
Malappuram District (fig. 5.8).
Fig 5.8 Comparison of the percentage share of ResidentialLand Use in district of Kerala - Thrissur and Surrounding District
75
LANDUSE District Spatial Plan - Thrissur
Department of Town & Country Planning, KeralaDepartment of Town & Country Planning, Kerala
Fig 5.9 Comparison of Percentage share of Residential landuse in Thrissur & Surrounding Districts
The percentage of Residential Land use of
Thrissur & Surrounding Districts is shown in Fig. 5.9 The
figure shows that Ernakulam district shows highest per-
centage (7.67%) followed by Thrissur. (1.04%).
Malappuram and Palakkad shows lowest percentages.
In case of wet agriculture land use Palakkad shows
dominance (20.45%) within whole Kerala State and
Thrissur has a share of 9.57% of agricultural land in the
state Fig. 5.10
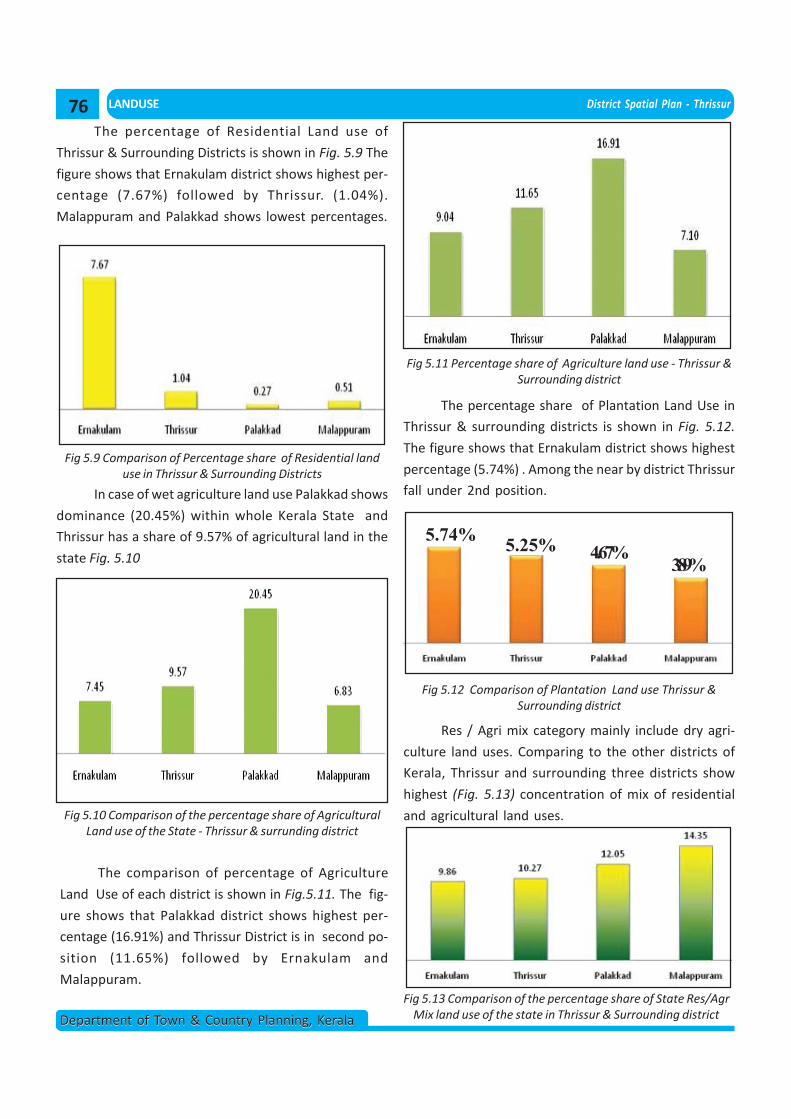
The comparison of percentage of Agriculture
Land Use of each district is shown in Fig.5.11. The fig-
ure shows that Palakkad district shows highest per-
centage (16.91%) and Thrissur District is in second po-
sition (11.65%) followed by Ernakulam and
Malappuram.
Fig 5.11 Percentage share of Agriculture land use - Thrissur &Surrounding district
Fig 5.10 Comparison of the percentage share of AgriculturalLand use of the State - Thrissur & surrunding district
Res / Agri mix category mainly include dry agri-
culture land uses. Comparing to the other districts of
Kerala, Thrissur and surrounding three districts show
highest (Fig. 5.13) concentration of mix of residential
and agricultural land uses.
Fig 5.13 Comparison of the percentage share of State Res/AgrMix land use of the state in Thrissur & Surrounding district
The percentage share of Plantation Land Use in
Thrissur & surrounding districts is shown in Fig. 5.12.
The figure shows that Ernakulam district shows highest
percentage (5.74%) . Among the near by district Thrissur
fall under 2nd position.
Fig 5.12 Comparison of Plantation Land use Thrissur &Surrounding district
5.74% 5.25% 4.67%3.89%
76
District Spatial Plan - Thrissur LANDUSE
Department of Town & Country Planning, KeralaDepartment of Town & Country Planning, Kerala
The percentage share of Forest Land Use of each
district is shown in Fig. 5.14. The figure shows that
Malappuram district shows highest percentage (60.79%)
followed by Thrissur (50.89%), Ernakulam shows
(48.74%), Palakkad shows less percentage (40.57%) of
Resi / Agri mix land.
Fig 5.14 Percentage of Res / Agr mix land use in the district
5.4 CONCENTRATION PATTERN OF LAND USE
The concentration pattern of a land uses gives an
idea about where that particular land use is concen-
trated within the District.
The Concentration Index value may be greater
than one, equal to one or less than one. LSGS
with Concentration Index greater than one indicates
that the land use under consideration is concentrated
more than the other LSGS in the district.
Using the above method concentration index of
9 categories of Land use (which are Forest, Water Bod-
ies, Marshy Land, Residential, Agriculture, Plantation,
Resi/Agri Mix, Other built up land use and Others) are
analysed.
The regional land use study shows a general ob-
servation that Thrissur stand in the second or third po-
sition with respect to surrounding district in the case of
urban components of landuse (residential, mixed
builtup, resi/agri mix etc., other built up etc.) and rural
components of the landuse ( Agriculture, plantation
etc.)
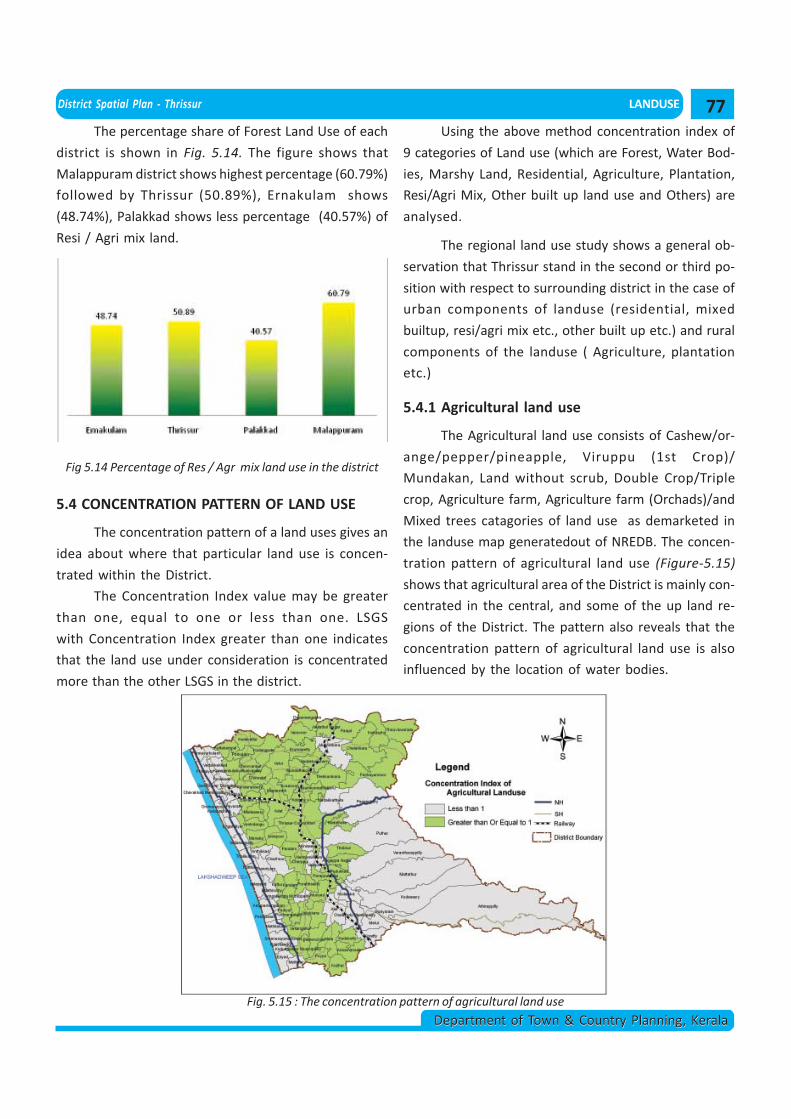
5.4.1 Agricultural land use
The Agricultural land use consists of Cashew/or-
ange/pepper/pineapple, Viruppu (1st Crop)/
Mundakan, Land without scrub, Double Crop/Triple
crop, Agriculture farm, Agriculture farm (Orchads)/and
Mixed trees catagories of land use as demarketed in
the landuse map generatedout of NREDB. The concen-
tration pattern of agricultural land use (Figure-5.15)
shows that agricultural area of the District is mainly con-
centrated in the central, and some of the up land re-
gions of the District. The pattern also reveals that the
concentration pattern of agricultural land use is also
influenced by the location of water bodies.
Fig. 5.15 : The concentration pattern of agricultural land use
77
LANDUSE District Spatial Plan - Thrissur
Department of Town & Country Planning, KeralaDepartment of Town & Country Planning, Kerala
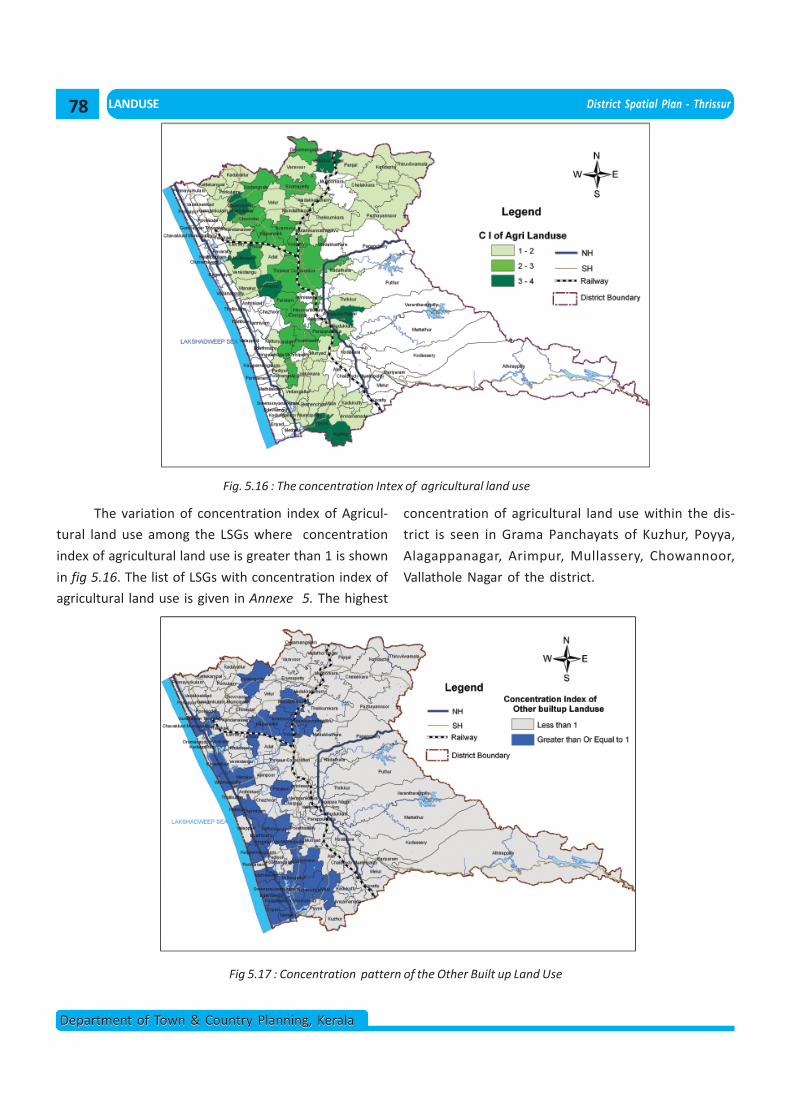
Fig. 5.16 : The concentration Intex of agricultural land use
The variation of concentration index of Agricul-
tural land use among the LSGs where concentration
index of agricultural land use is greater than 1 is shown
in fig 5.16. The list of LSGs with concentration index of
agricultural land use is given in Annexe 5. The highest
concentration of agricultural land use within the dis-
trict is seen in Grama Panchayats of Kuzhur, Poyya,
Alagappanagar, Arimpur, Mullassery, Chowannoor,
Vallathole Nagar of the district.
Fig 5.17 : Concentration pattern of the Other Built up Land Use
78
District Spatial Plan - Thrissur LANDUSE
Department of Town & Country Planning, KeralaDepartment of Town & Country Planning, Kerala
5.4.2 Other Built up Land Use
Other built up land use include Commercial, In-
dustrial /Industrial Park and Educational Institutions.
Figure 5.17 shows the distribution of the concentration
pattern of the Other Built up Land Use. From the figure
it is clear that the concentration index of the Other Built
up Land Use in urban LSGs and in those LSGs along the
major transport corridors are higher than that in other
LSGs. Also it is observed that high land area of the dis-
trict has lesser concentration of Other Built up Land Uses
even in LSGs along main transportation corridors indi-
cating that the economic activity of hill areas is not con-
siderably dependent on secondary / tertiary sectors.
The list of LSGs with concentration index of the Other
Built up Land Use is given in Annexe 6 and the list of
LSGs with high concentration of the Other Built up Land
Use (i.e. concentration index of other built up land use
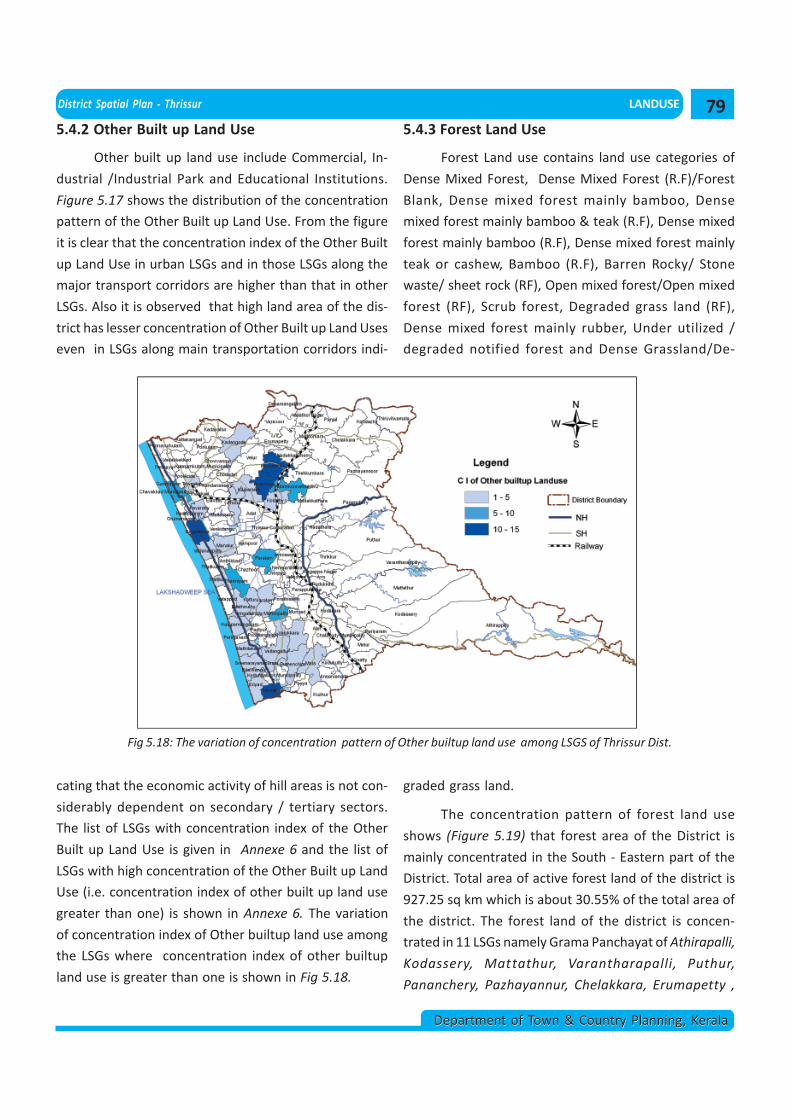
greater than one) is shown in Annexe 6. The variation
of concentration index of Other builtup land use among
the LSGs where concentration index of other builtup
land use is greater than one is shown in Fig 5.18.
Fig 5.18: The variation of concentration pattern of Other builtup land use among LSGS of Thrissur Dist.
5.4.3 Forest Land Use
Forest Land use contains land use categories of
Dense Mixed Forest, Dense Mixed Forest (R.F)/Forest
Blank, Dense mixed forest mainly bamboo, Dense
mixed forest mainly bamboo & teak (R.F), Dense mixed
forest mainly bamboo (R.F), Dense mixed forest mainly
teak or cashew, Bamboo (R.F), Barren Rocky/ Stone
waste/ sheet rock (RF), Open mixed forest/Open mixed
forest (RF), Scrub forest, Degraded grass land (RF),
Dense mixed forest mainly rubber, Under utilized /
degraded notified forest and Dense Grassland/De-
graded grass land.
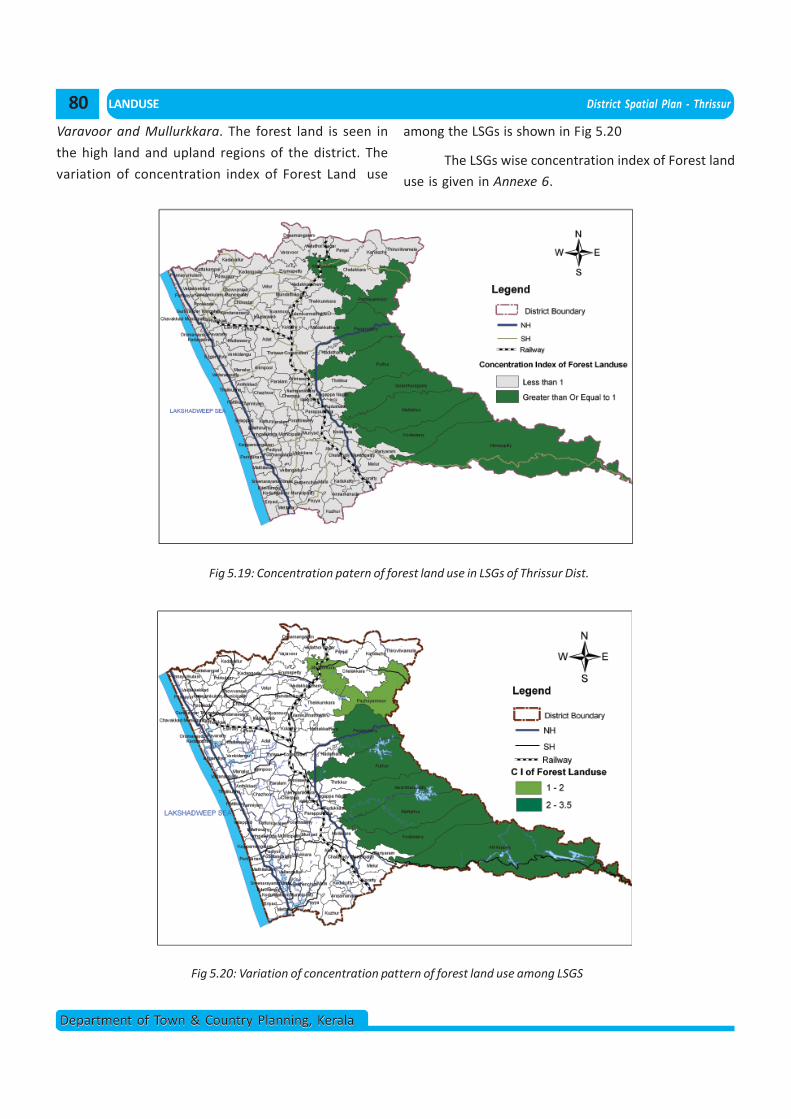
The concentration pattern of forest land use
shows (Figure 5.19) that forest area of the District is
mainly concentrated in the South - Eastern part of the
District. Total area of active forest land of the district is
927.25 sq km which is about 30.55% of the total area of
the district. The forest land of the district is concen-
trated in 11 LSGs namely Grama Panchayat of Athirapalli,
Kodassery, Mattathur, Varantharapalli, Puthur,
Pananchery, Pazhayannur, Chelakkara, Erumapetty ,
79
LANDUSE District Spatial Plan - Thrissur
Department of Town & Country Planning, KeralaDepartment of Town & Country Planning, Kerala
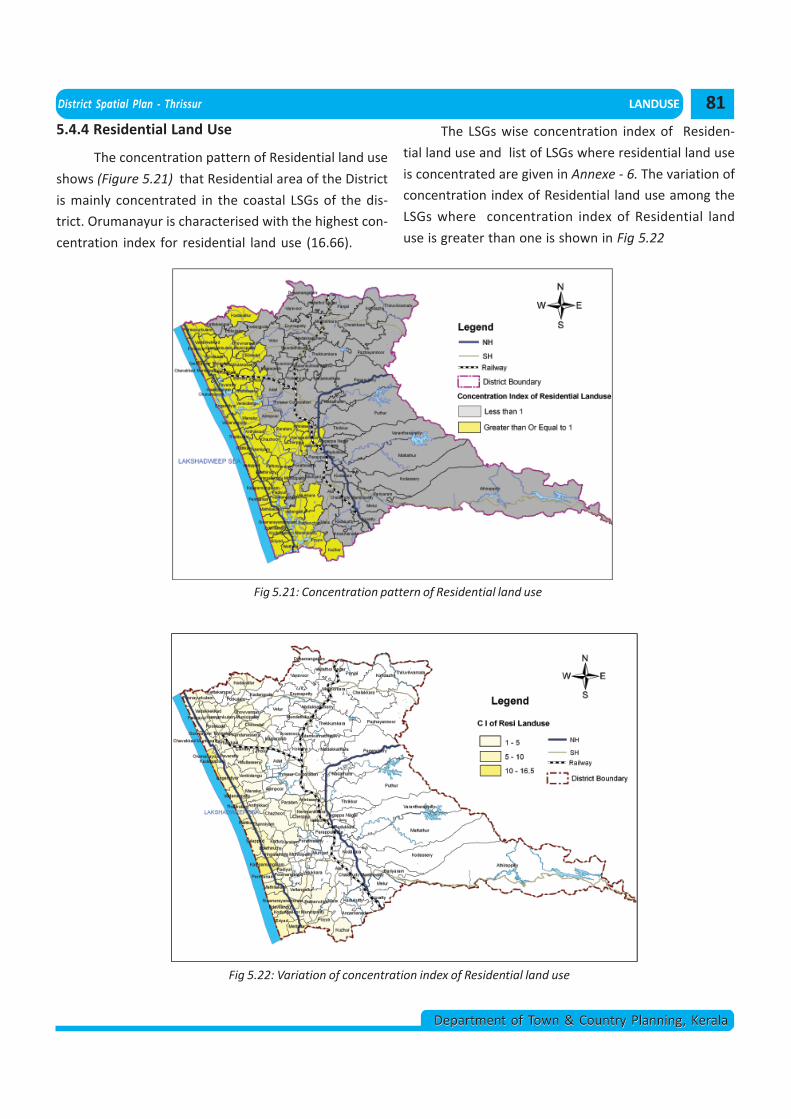
Varavoor and Mullurkkara. The forest land is seen in
the high land and upland regions of the district. The
variation of concentration index of Forest Land use
Fig 5.19: Concentration patern of forest land use in LSGs of Thrissur Dist.
among the LSGs is shown in Fig 5.20
The LSGs wise concentration index of Forest land
use is given in Annexe 6.
Fig 5.20: Variation of concentration pattern of forest land use among LSGS
80
District Spatial Plan - Thrissur LANDUSE
Department of Town & Country Planning, KeralaDepartment of Town & Country Planning, Kerala
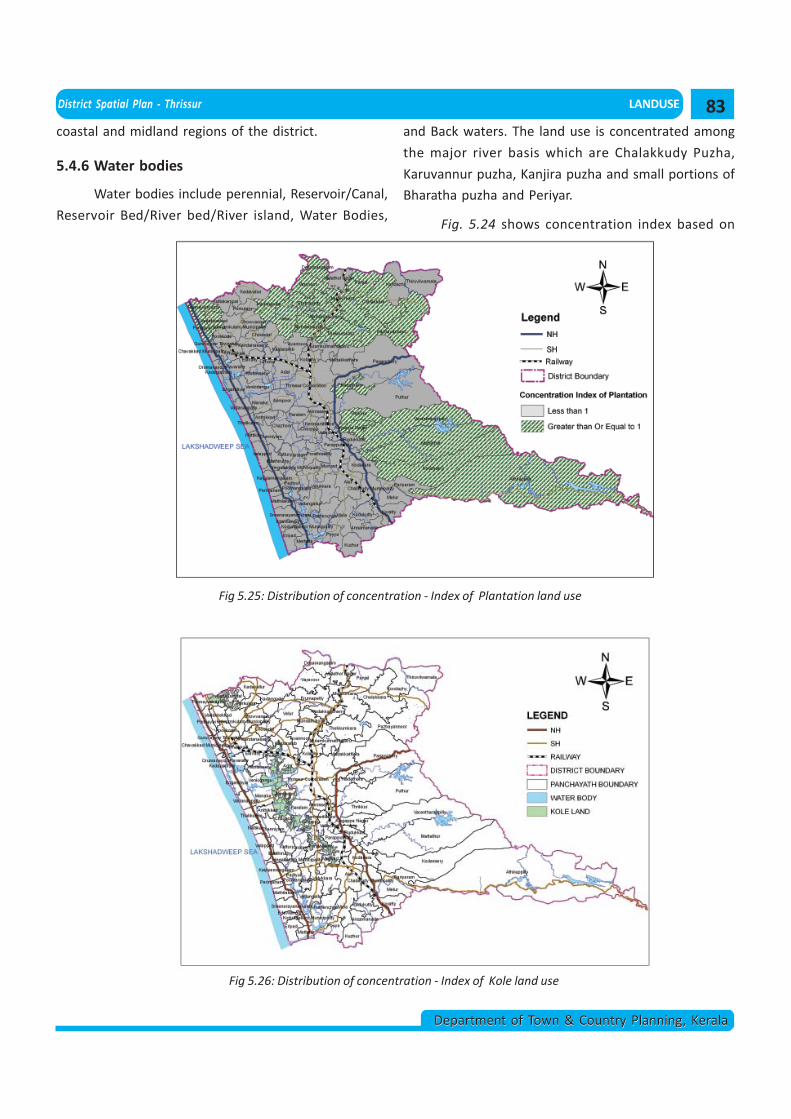
Fig 5.22: Variation of concentration index of Residential land use
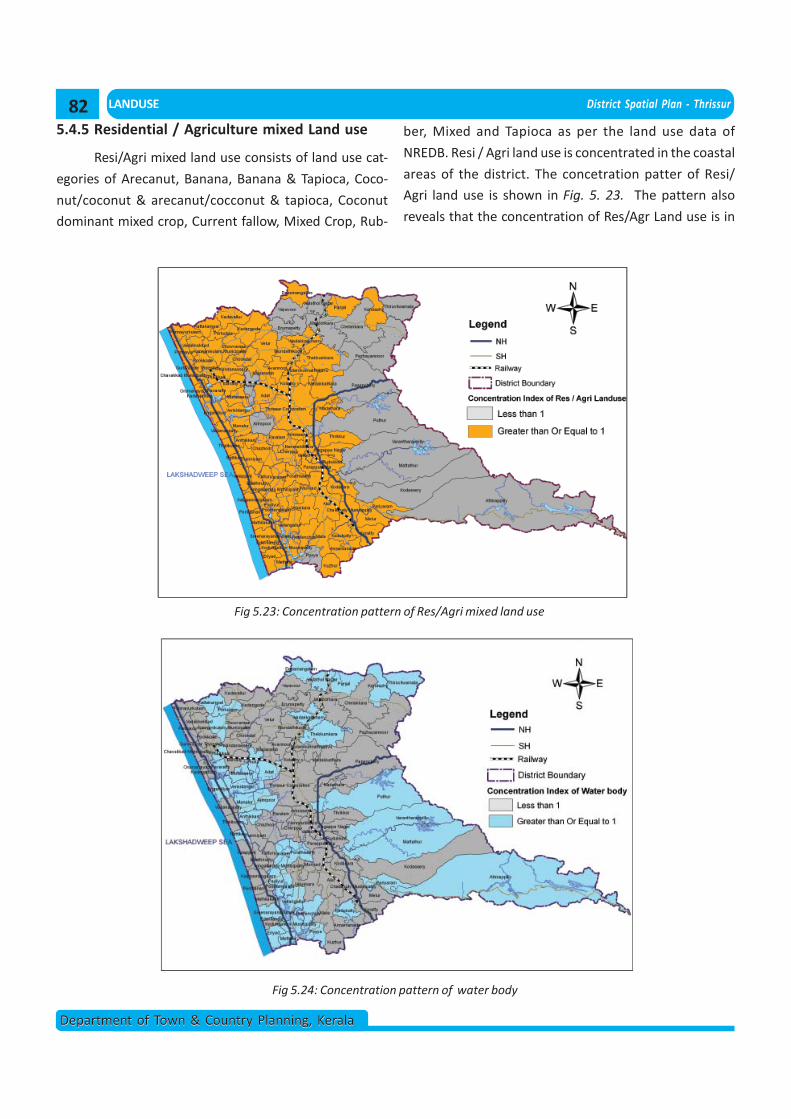
Fig 5.21: Concentration pattern of Residential land use
5.4.4 Residential Land Use
The concentration pattern of Residential land use
shows (Figure 5.21) that Residential area of the District
is mainly concentrated in the coastal LSGs of the dis-
trict. Orumanayur is characterised with the highest con-
centration index for residential land use (16.66).
The LSGs wise concentration index of Residen-
tial land use and list of LSGs where residential land use
is concentrated are given in Annexe - 6. The variation of
concentration index of Residential land use among the
LSGs where concentration index of Residential land
use is greater than one is shown in Fig 5.22
81
LANDUSE District Spatial Plan - Thrissur
Department of Town & Country Planning, KeralaDepartment of Town & Country Planning, Kerala
5.4.5 Residential / Agriculture mixed Land use
Resi/Agri mixed land use consists of land use cat-
egories of Arecanut, Banana, Banana & Tapioca, Coco-
nut/coconut & arecanut/cocconut & tapioca, Coconut
dominant mixed crop, Current fallow, Mixed Crop, Rub-
Fig 5.23: Concentration pattern of Res/Agri mixed land use
ber, Mixed and Tapioca as per the land use data of
NREDB. Resi / Agri land use is concentrated in the coastal
areas of the district. The concetration patter of Resi/
Agri land use is shown in Fig. 5. 23. The pattern also
reveals that the concentration of Res/Agr Land use is in
Fig 5.24: Concentration pattern of water body
82
District Spatial Plan - Thrissur LANDUSE
Department of Town & Country Planning, KeralaDepartment of Town & Country Planning, Kerala
coastal and midland regions of the district.
5.4.6 Water bodies
Water bodies include perennial, Reservoir/Canal,
Reservoir Bed/River bed/River island, Water Bodies,
and Back waters. The land use is concentrated among
the major river basis which are Chalakkudy Puzha,
Karuvannur puzha, Kanjira puzha and small portions of
Bharatha puzha and Periyar.
Fig. 5.24 shows concentration index based on
Fig 5.25: Distribution of concentration - Index of Plantation land use
Fig 5.26: Distribution of concentration - Index of Kole land use
83
LANDUSE District Spatial Plan - Thrissur
Department of Town & Country Planning, KeralaDepartment of Town & Country Planning, Kerala
extend of land under water bodies in LSGs of Thrissur.
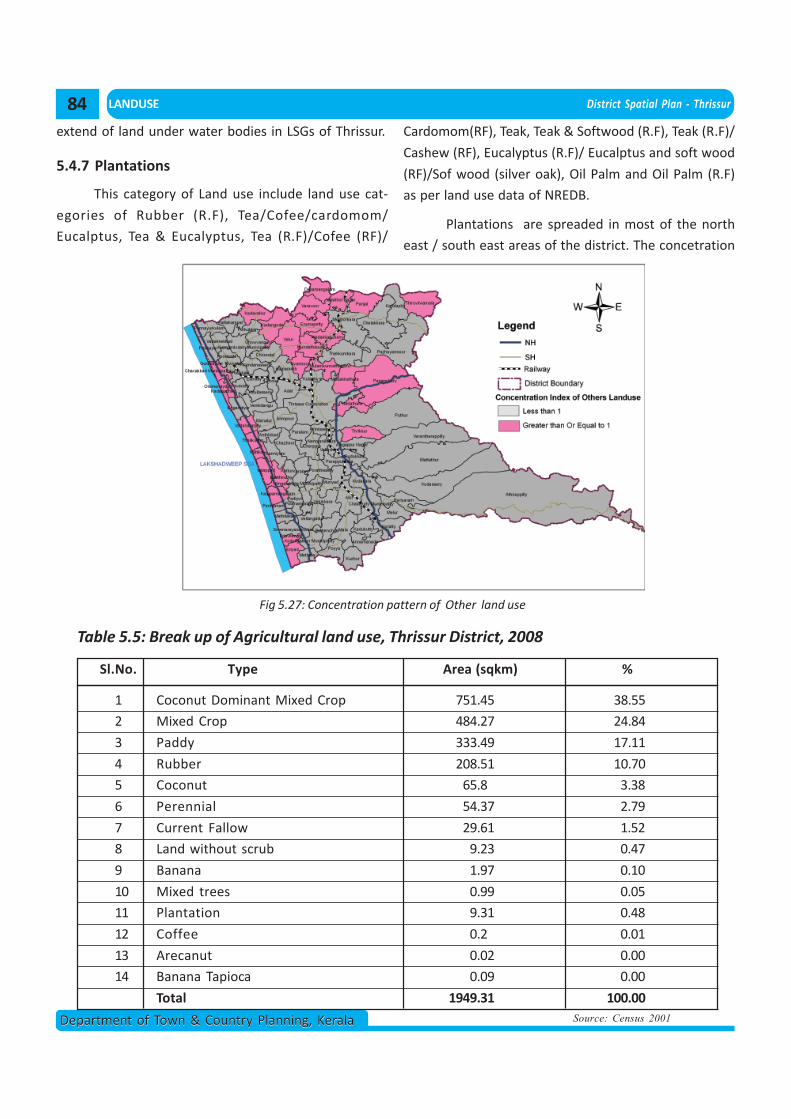
5.4.7 Plantations
This category of Land use include land use cat-
egories of Rubber (R.F), Tea/Cofee/cardomom/
Eucalptus, Tea & Eucalyptus, Tea (R.F)/Cofee (RF)/
Fig 5.27: Concentration pattern of Other land use
Cardomom(RF), Teak, Teak & Softwood (R.F), Teak (R.F)/
Cashew (RF), Eucalyptus (R.F)/ Eucalptus and soft wood
(RF)/Sof wood (silver oak), Oil Palm and Oil Palm (R.F)
as per land use data of NREDB.
Plantations are spreaded in most of the north
east / south east areas of the district. The concetration
Table 5.5: Break up of Agricultural land use, Thrissur District, 2008
1 Coconut Dominant Mixed Crop 751.45 38.55
2 Mixed Crop 484.27 24.84
3 Paddy 333.49 17.11
4 Rubber 208.51 10.70
5 Coconut 65.8 3.38
6 Perennial 54.37 2.79
7 Current Fallow 29.61 1.52
8 Land without scrub 9.23 0.47
9 Banana 1.97 0.10
10 Mixed trees 0.99 0.05
11 Plantation 9.31 0.48
12 Coffee 0.2 0.01
13 Arecanut 0.02 0.00
14 Banana Tapioca 0.09 0.00
Total 1949.31 100.00
Sl.No. Type Area (sqkm) %
Source: Census 2001
84
District Spatial Plan - Thrissur LANDUSE
Department of Town & Country Planning, KeralaDepartment of Town & Country Planning, Kerala
pattern of Plantations is shown in Fig.5.25..
5.4.8 Marshy Land / Kole Land
Land parcels which are categorised as Temporarily
marshy land / Marshy land/Permanently marshy land is
per NREDB is included under Marshy land / Kole land.
Distribution of concentration - Index of Kole land use
is shown in Figure 5.26
5.4.9 Other Land Use
Following land use of NREDB are grouped to
form the category Other Land use - Barren Rocky/ Stone
waste/ sheet rock, Coastal Sand, Sands/ riverine/Flood
plain, Beaches, Harbour / Port, Mining / Industrial waste
land, Airport, Playground, Dam wall, Mining. Other Land
uses are spreaded near by coastal areas and in the North
and Western region of the district. The concetration
pattern of Other land use is shown in Fig. 5.27.
Source: Census 2001
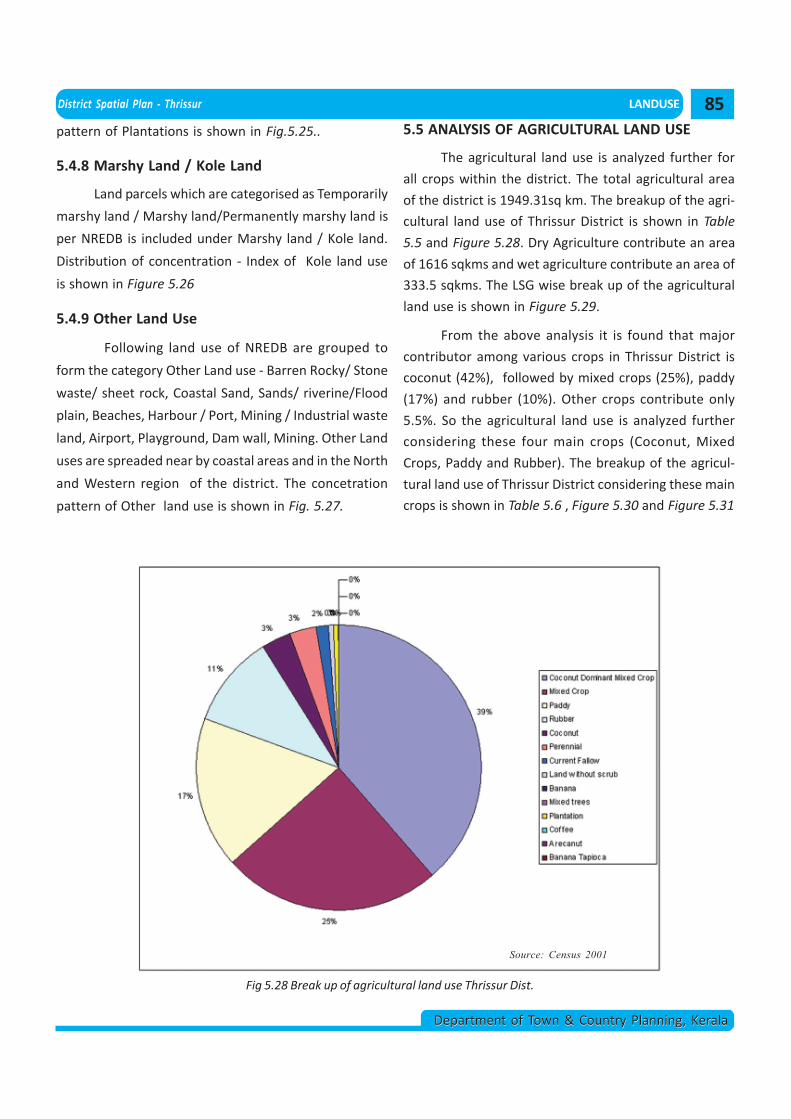
Fig 5.28 Break up of agricultural land use Thrissur Dist.
5.5 ANALYSIS OF AGRICULTURAL LAND USE
The agricultural land use is analyzed further for
all crops within the district. The total agricultural area
of the district is 1949.31sq km. The breakup of the agri-
cultural land use of Thrissur District is shown in Table
5.5 and Figure 5.28. Dry Agriculture contribute an area
of 1616 sqkms and wet agriculture contribute an area of
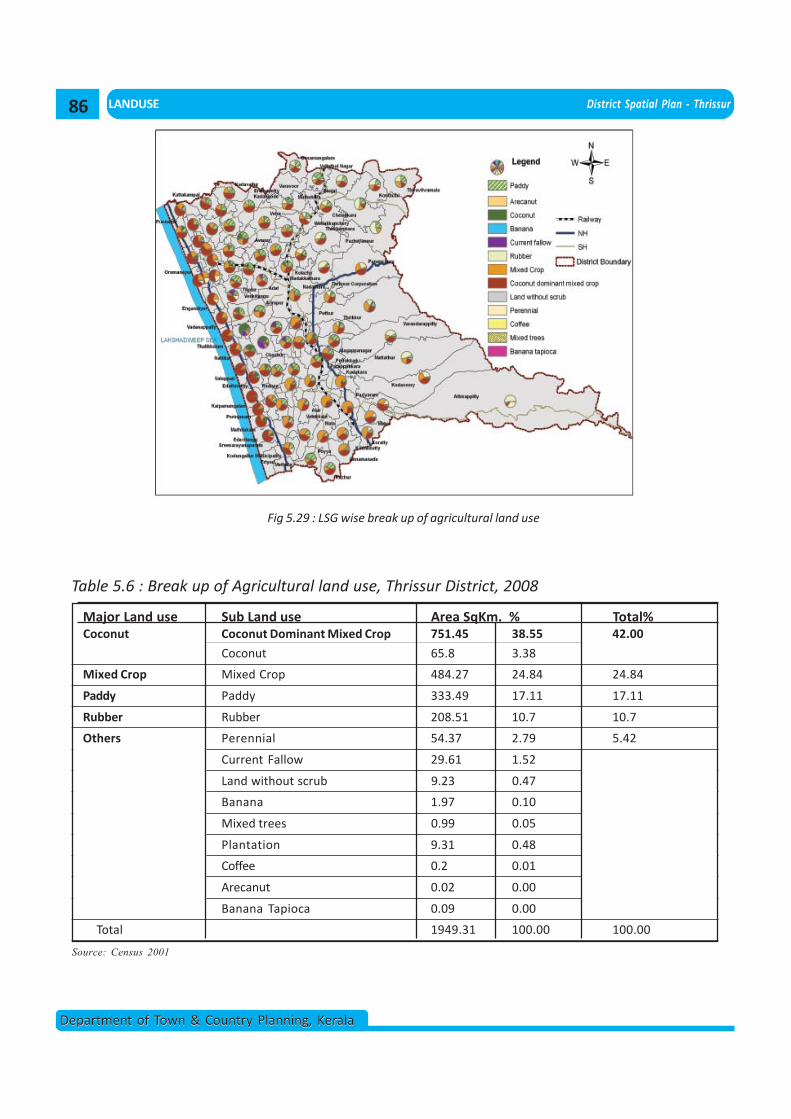
333.5 sqkms. The LSG wise break up of the agricultural
land use is shown in Figure 5.29.
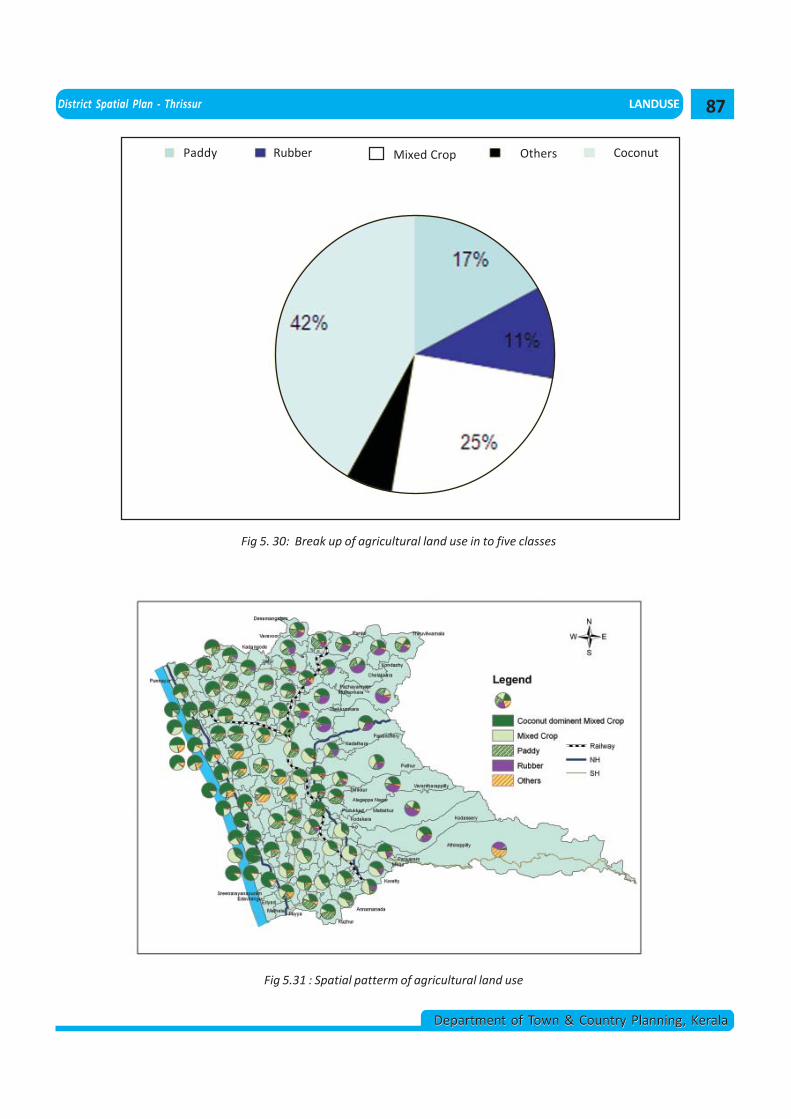
From the above analysis it is found that major
contributor among various crops in Thrissur District is
coconut (42%), followed by mixed crops (25%), paddy
(17%) and rubber (10%). Other crops contribute only
5.5%. So the agricultural land use is analyzed further
considering these four main crops (Coconut, Mixed
Crops, Paddy and Rubber). The breakup of the agricul-
tural land use of Thrissur District considering these main
crops is shown in Table 5.6 , Figure 5.30 and Figure 5.31
85
LANDUSE District Spatial Plan - Thrissur
Department of Town & Country Planning, KeralaDepartment of Town & Country Planning, Kerala
Fig 5.29 : LSG wise break up of agricultural land use
Table 5.6 : Break up of Agricultural land use, Thrissur District, 2008
Major Land use Sub Land use Area SqKm. % Total% Coconut Coconut Dominant Mixed Crop 751.45 38.55 42.00
Coconut 65.8 3.38
Mixed Crop Mixed Crop 484.27 24.84 24.84
Paddy Paddy 333.49 17.11 17.11
Rubber Rubber 208.51 10.7 10.7
Others Perennial 54.37 2.79 5.42
Current Fallow 29.61 1.52
Land without scrub 9.23 0.47
Banana 1.97 0.10
Mixed trees 0.99 0.05
Plantation 9.31 0.48
Coffee 0.2 0.01
Arecanut 0.02 0.00
Banana Tapioca 0.09 0.00
Total 1949.31 100.00 100.00
Source: Census 2001
86
District Spatial Plan - Thrissur LANDUSE
Department of Town & Country Planning, KeralaDepartment of Town & Country Planning, Kerala
5%
Fig 5. 30: Break up of agricultural land use in to five classes
Fig 5.31 : Spatial patterm of agricultural land use
Paddy Rubber Mixed Crop Others Coconut
87
LANDUSE District Spatial Plan - Thrissur
Department of Town & Country Planning, KeralaDepartment of Town & Country Planning, Kerala
5.5.1 Concentration Pattern of Agriculture landuse
The concentration pattern of Agricultural land use
gives an idea about where that particular Agriculture is
concentrated. For major agriculture viz: Coconut, Mixed
crop, Paddy and rubber - that dominant in Thrissur dis-
trict are analyzed here.
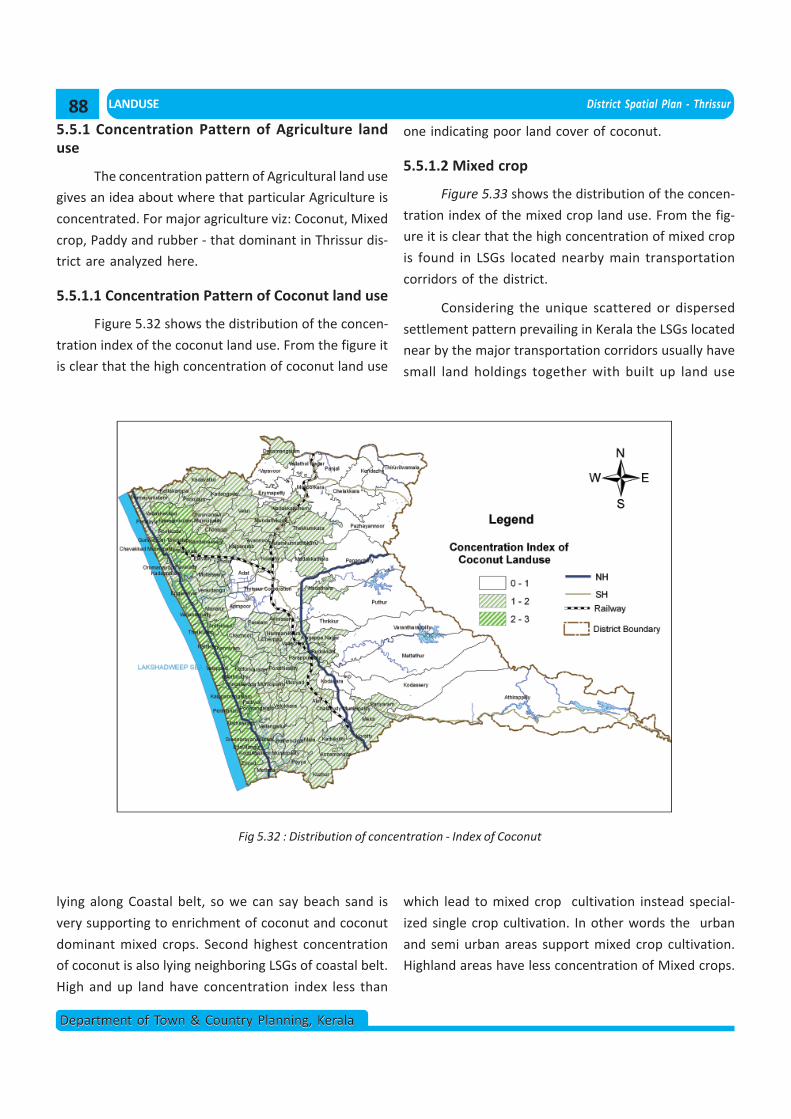
5.5.1.1 Concentration Pattern of Coconut land use
Figure 5.32 shows the distribution of the concen-
tration index of the coconut land use. From the figure it
is clear that the high concentration of coconut land use
Fig 5.32 : Distribution of concentration - Index of Coconut
lying along Coastal belt, so we can say beach sand is
very supporting to enrichment of coconut and coconut
dominant mixed crops. Second highest concentration
of coconut is also lying neighboring LSGs of coastal belt.
High and up land have concentration index less than
one indicating poor land cover of coconut.
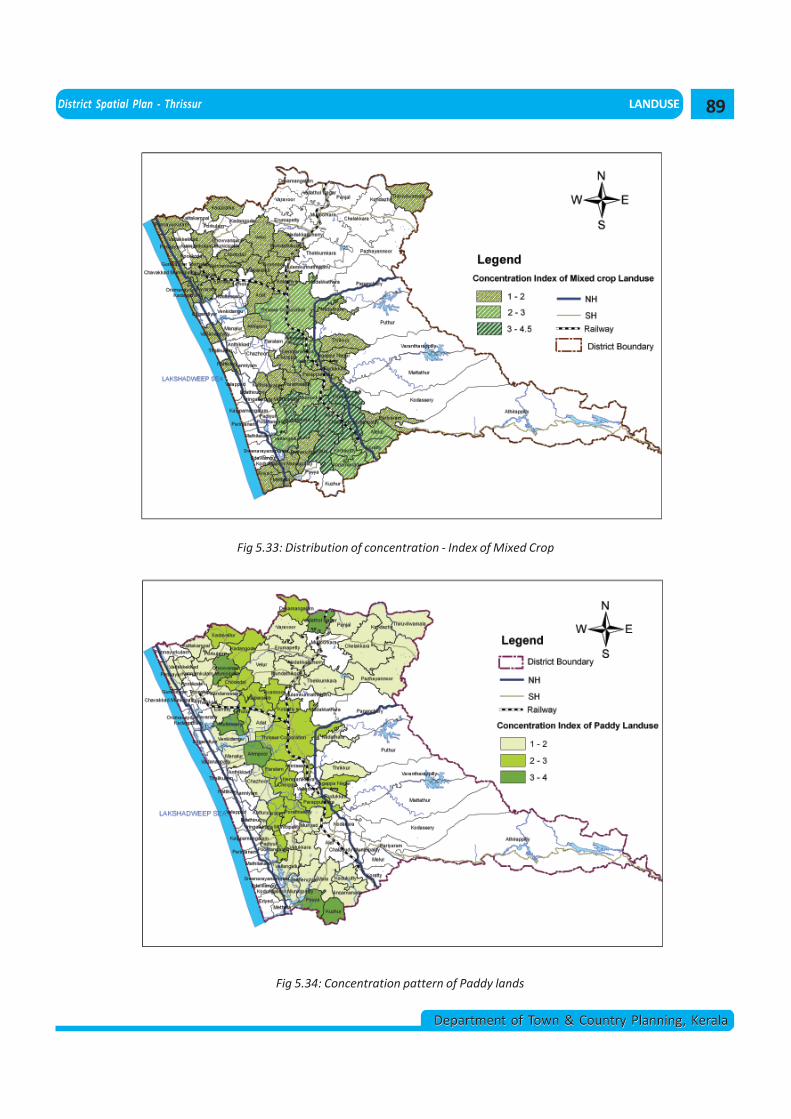
5.5.1.2 Mixed crop
Figure 5.33 shows the distribution of the concen-
tration index of the mixed crop land use. From the fig-
ure it is clear that the high concentration of mixed crop
is found in LSGs located nearby main transportation
corridors of the district.
Considering the unique scattered or dispersed
settlement pattern prevailing in Kerala the LSGs located
near by the major transportation corridors usually have
small land holdings together with built up land use
which lead to mixed crop cultivation instead special-
ized single crop cultivation. In other words the urban
and semi urban areas support mixed crop cultivation.
Highland areas have less concentration of Mixed crops.
88
District Spatial Plan - Thrissur LANDUSE
Department of Town & Country Planning, KeralaDepartment of Town & Country Planning, Kerala
Fig 5.33: Distribution of concentration - Index of Mixed Crop
Fig 5.34: Concentration pattern of Paddy lands
89
LANDUSE District Spatial Plan - Thrissur
Department of Town & Country Planning, KeralaDepartment of Town & Country Planning, Kerala
5.5.1.3 Paddy
Figure 5.34 shows the distribution of the concen-
tration index of the Paddy land use. Highest concentra-
tion index of the paddy area is found in LSGs in mid and
up land areas. It may be due to good drainage catch-
ment area that support paddy cultivation. Coastal and
upland areas have very poor concentration of paddy
lands.
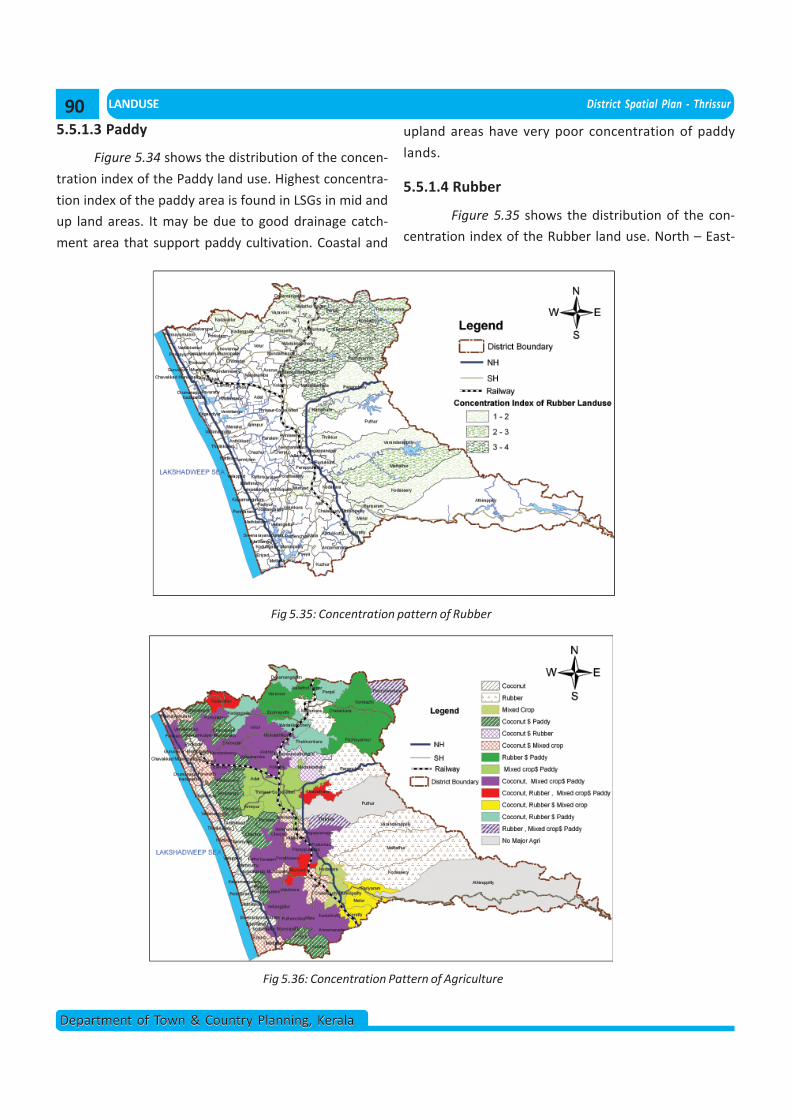
5.5.1.4 Rubber
Figure 5.35 shows the distribution of the con-
centration index of the Rubber land use. North – East-
Fig 5.35: Concentration pattern of Rubber
Fig 5.36: Concentration Pattern of Agriculture
90
District Spatial Plan - Thrissur LANDUSE
Department of Town & Country Planning, KeralaDepartment of Town & Country Planning, Kerala
ern parts of the district have the highest concentration
of Rubber land use. Most of the LSGs on highland re-
gions are showing a clear dominance to Rubber. As pro-
ceeding from highland area to low land area of the dis-
trict value of concentration index of rubber is descend-
ing. Coastal areas have very little concentration of Rub-
ber.
5.6 MAJOR AGRICULTURAL ACTIVITIES
In the above paragraphs, the areas of concentra-
tion of the major agriculture land uses in the District is
delineated taking land put to crops viz coconut, mixed
crop, paddy and rubber. By combining the concentra-
tion pattern of major agricultural land uses spatially and
by analyzing the resulting pattern, areas of major agri-
cultural (based on the existing land use) activity can be
delineated.
The area of specialization of each LSG of the dis-
trict against agriculture land use is given in Annexe 7.
Figure 5.36. shows the concentration pattern of all the
four major agriculture land uses together. From the fig-
ure, the areas of Specialization can be delineated. From
the figure it is found that only two Grama Panchayats
(Athirapalli and Puthoor) do not exhibit any
specialisation in agriculture activities. It may be due
the forest land cover of that LSGs.
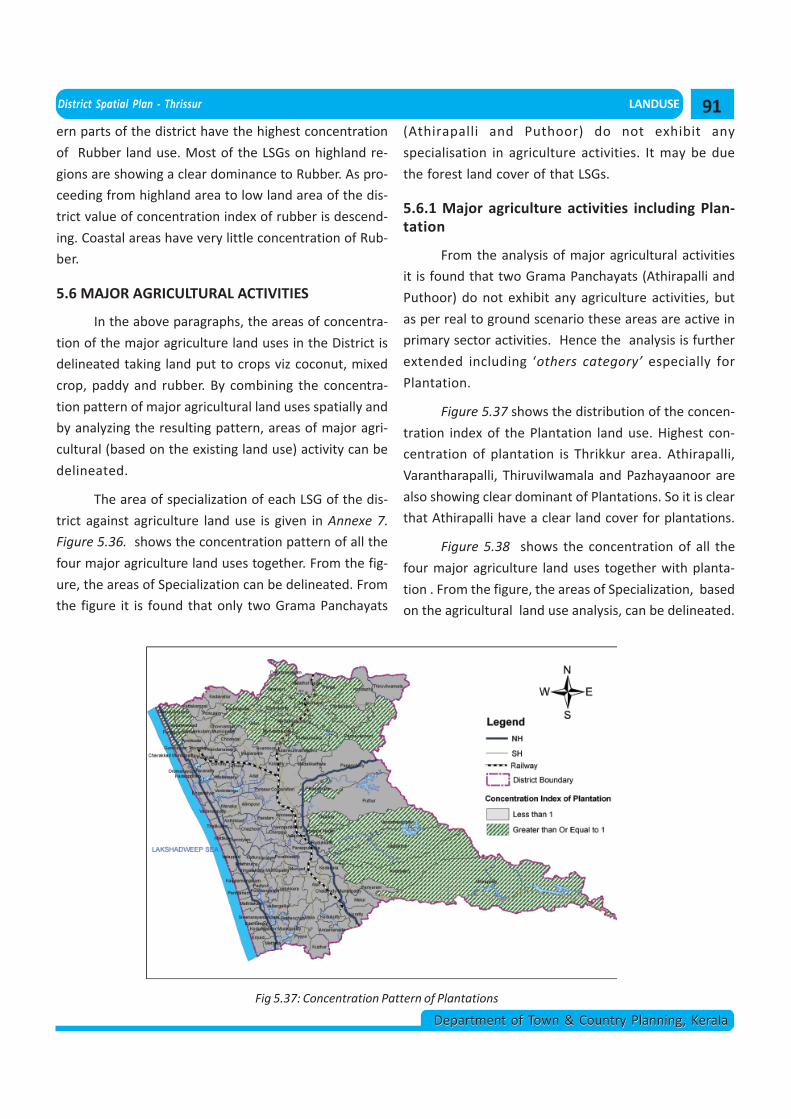
5.6.1 Major agriculture activities including Plan-tation
From the analysis of major agricultural activities
it is found that two Grama Panchayats (Athirapalli and
Puthoor) do not exhibit any agriculture activities, but
as per real to ground scenario these areas are active in
primary sector activities. Hence the analysis is further
extended including ‘others category’ especially for
Plantation.
Figure 5.37 shows the distribution of the concen-
tration index of the Plantation land use. Highest con-
centration of plantation is Thrikkur area. Athirapalli,
Varantharapalli, Thiruvilwamala and Pazhayaanoor are
also showing clear dominant of Plantations. So it is clear
that Athirapalli have a clear land cover for plantations.
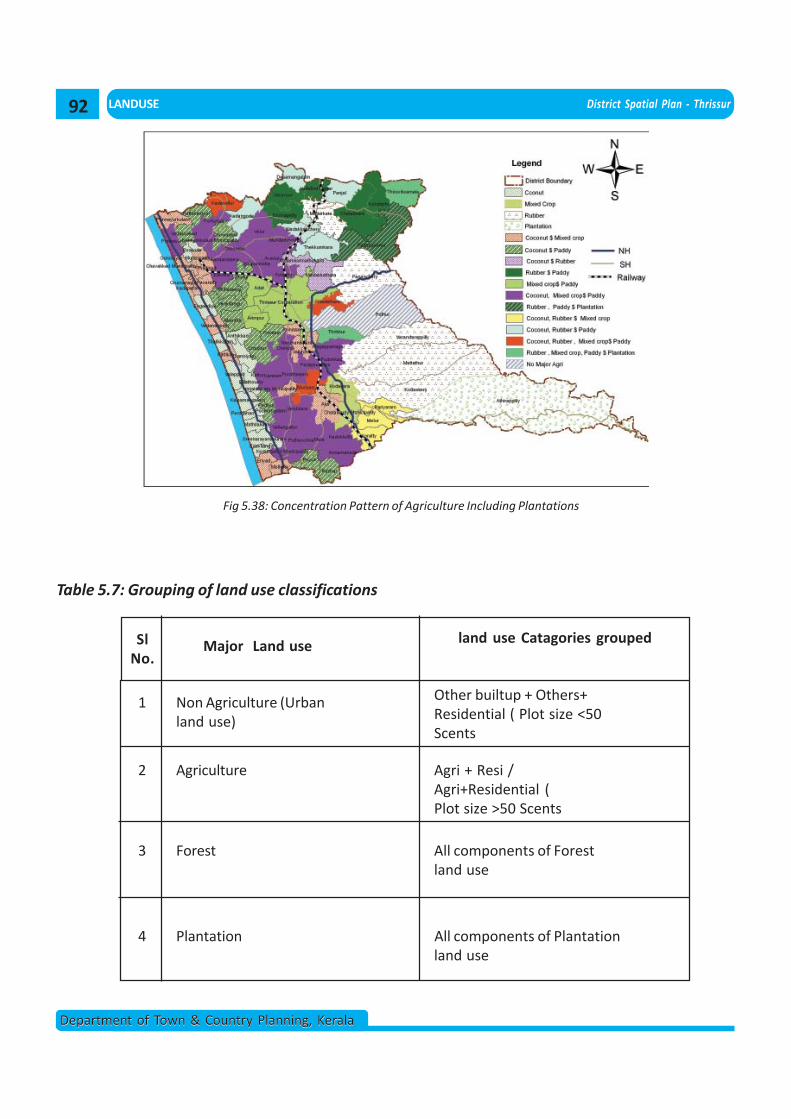
Figure 5.38 shows the concentration of all the
four major agriculture land uses together with planta-
tion . From the figure, the areas of Specialization, based
on the agricultural land use analysis, can be delineated.
Fig 5.37: Concentration Pattern of Plantations
91
LANDUSE District Spatial Plan - Thrissur
Department of Town & Country Planning, KeralaDepartment of Town & Country Planning, Kerala
Fig 5.38: Concentration Pattern of Agriculture Including Plantations
land use Catagories groupedMajor Land use
Non Agriculture (Urbanland use)
Other builtup + Others+Residential ( Plot size <50Scents
Agriculture Agri + Resi /Agri+Residential (Plot size >50 Scents
Forest All components of Forestland use
Plantation All components of Plantationland use
Table 5.7: Grouping of land use classifications
SlNo.
1
2
3
4
92
District Spatial Plan - Thrissur LANDUSE
Department of Town & Country Planning, KeralaDepartment of Town & Country Planning, Kerala
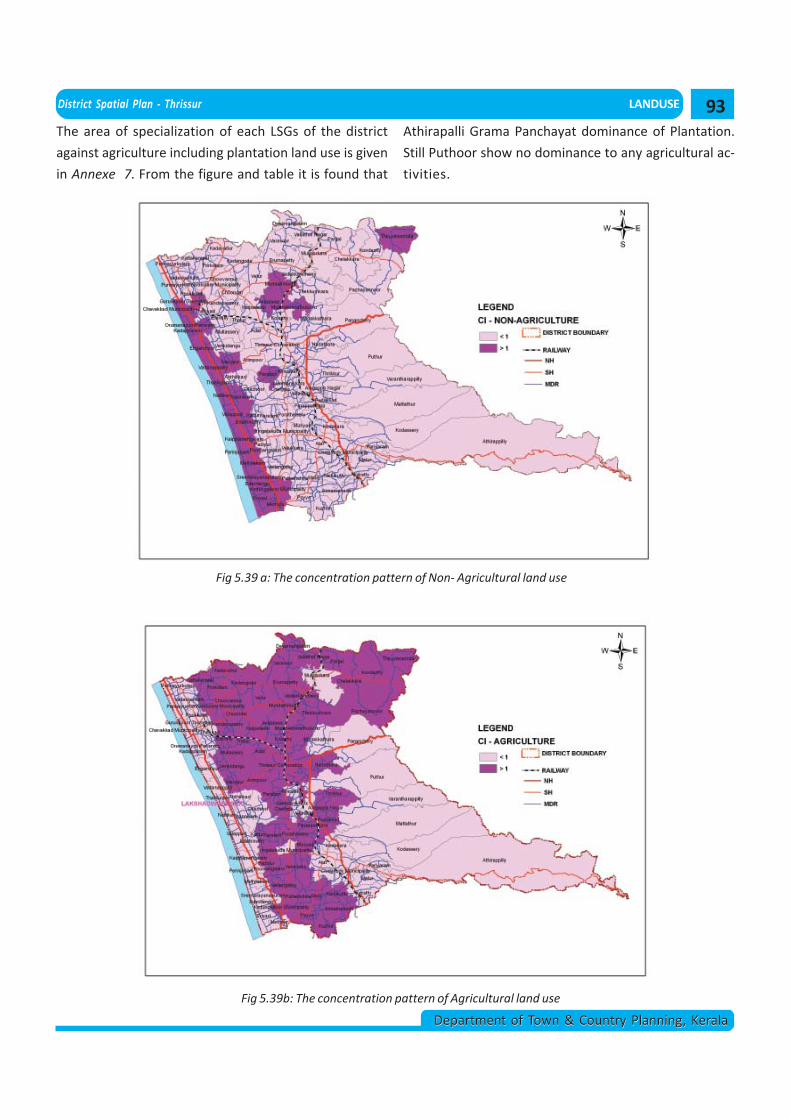
The area of specialization of each LSGs of the district
against agriculture including plantation land use is given
in Annexe 7. From the figure and table it is found that
Athirapalli Grama Panchayat dominance of Plantation.
Still Puthoor show no dominance to any agricultural ac-
tivities.
Fig 5.39 a: The concentration pattern of Non- Agricultural land use
Fig 5.39b: The concentration pattern of Agricultural land use
93
LANDUSE District Spatial Plan - Thrissur
Department of Town & Country Planning, KeralaDepartment of Town & Country Planning, Kerala
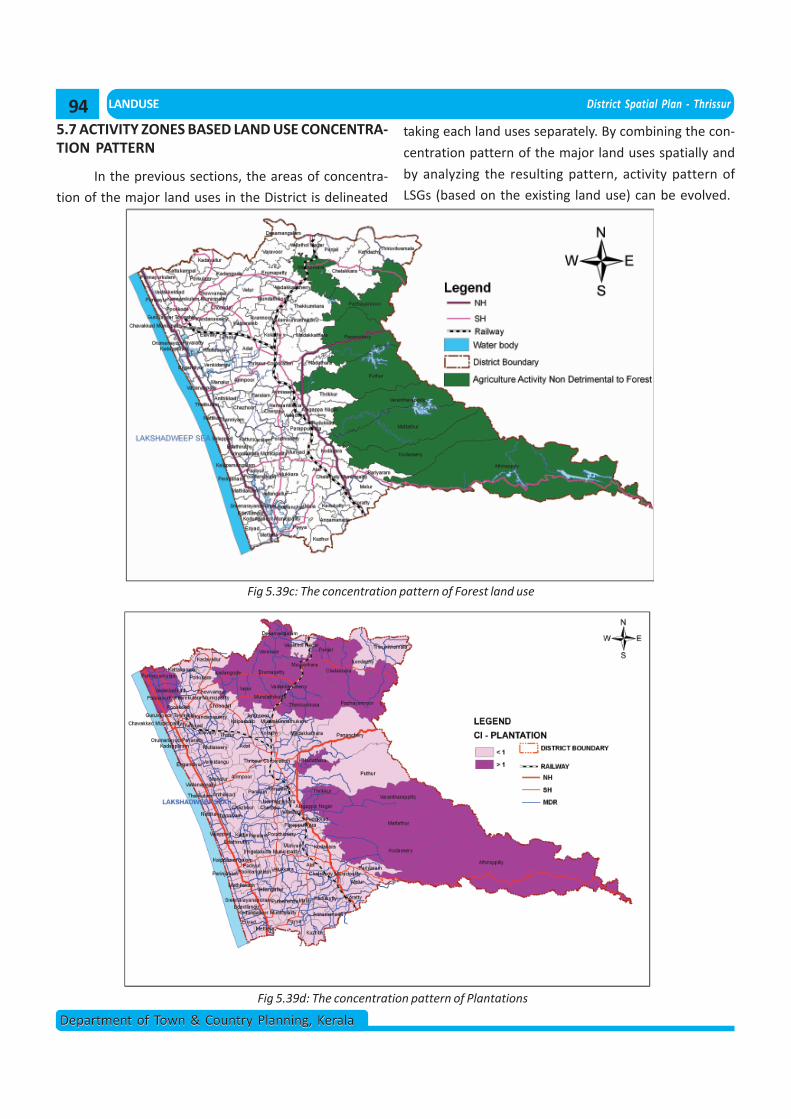
5.7 ACTIVITY ZONES BASED LAND USE CONCENTRA-TION PATTERN
In the previous sections, the areas of concentra-
tion of the major land uses in the District is delineated
Fig 5.39c: The concentration pattern of Forest land use
taking each land uses separately. By combining the con-
centration pattern of the major land uses spatially and
by analyzing the resulting pattern, activity pattern of
LSGs (based on the existing land use) can be evolved.
Fig 5.39d: The concentration pattern of Plantations
94
District Spatial Plan - Thrissur LANDUSE
Department of Town & Country Planning, KeralaDepartment of Town & Country Planning, Kerala
In order to evolve the activity pattern the nine
categories of land uses are grouped into 4 categories
which are Non agricultural, Agricultural, Forest and Plan-
tation as given in Table 5.7.
The concentration index of these major land use
catogories is shown in Annexe - 7. The concentration
patterns are shown in Fig. 5.39a, 5.39b, 5.39c, 5.39d re-
spectively. Based on the pattern, the activity of the LSGs
is evolved as per the criteria shown in Table. 5.8
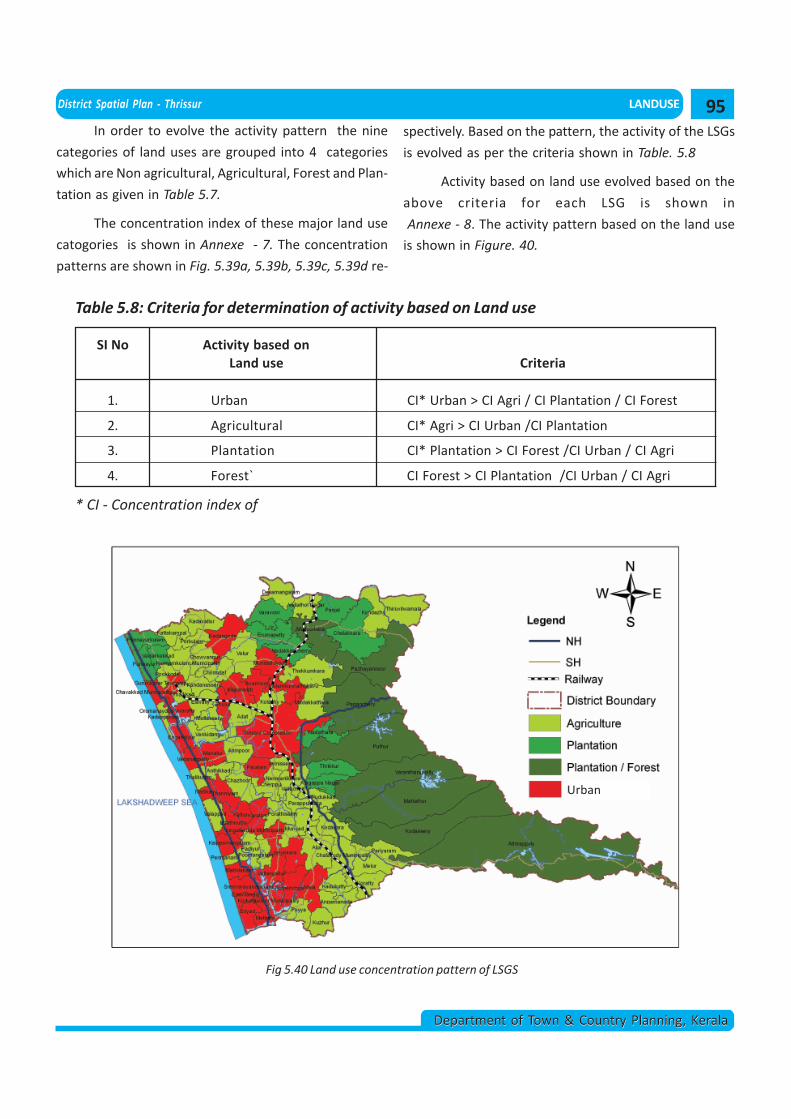
Activity based on land use evolved based on the
above criteria for each LSG is shown in
Annexe - 8. The activity pattern based on the land use
is shown in Figure. 40.
SI No Activity based onLand use Criteria
1. Urban CI* Urban > CI Agri / CI Plantation / CI Forest
2. Agricultural CI* Agri > CI Urban /CI Plantation
3. Plantation CI* Plantation > CI Forest /CI Urban / CI Agri
4. Forest` CI Forest > CI Plantation /CI Urban / CI Agri
Table 5.8: Criteria for determination of activity based on Land use
* CI - Concentration index of
Fig 5.40 Land use concentration pattern of LSGS
Urban
95
LANDUSE District Spatial Plan - Thrissur
Department of Town & Country Planning, KeralaDepartment of Town & Country Planning, Kerala
The analysis of land use concentration pattern
shows that most of the plantation / forest activities are
concentrated on the highland region of the district. The
urban activity is found to be mainly concentrated in
coastal regions and along the major transportation cor-
ridors. The agricultural activities are predominantly con-
centrated in the midland region of the district.
5.8 INFERENCE
From the above details we can conclude that the
whole District can be divided into four Activity zones
namely Agricultural, Non-Agricultural/Urban, Planta-
tion, Plantation/Forest. The analysis of land use con-
centration pattern shows that most of the plantation /
forest activities are concentrated on the highland re-
gion of the district. The urban activity is found to be
mainly concentrated in coastal regions and along the
major transportation corridors. The agricultural activi-
ties are predominantly concentrated in the midland
region of the district.
96