Embed Size (px)
DESCRIPTION
How to make sure a website can survive go-live and cope with ever increasing traffic and amounts of data: knowing what to measure and log, during both development and production phases; load testing ; identifying bottlenecks; preventing disasters
Citation preview

Make it scale! Tools and techniques for analyzing
performances of eZ Publish websites
Gaetano Giunta | eZ Summer Camp | Sept. 6 2012

Introduction
6/9/2012 SLIDE 3
Synopsys
How to make sure a website can survive go-live and cope with ever increasing
traffic and amounts of data: knowing what to measure and log, during both
development and production phases; load testing; identifying bottlenecks;
preventing disasters
PRESENTER: GAETANO GIUNTA
6/9/2012 SLIDE 4
Table of contents
The workshop is comprised of 2 parts:
• Theory
• As you might guess, it’s all about slides
• Can we skip this or do you want it really detailed? Raise hands!
• Practice
• Part 1: load testing
• Part 2: performance logging
Requirements:
• a working eZ Publish 4 installation on Linux (Debian/Ubuntu preferred)
[a VirtualBox image is available if you don’t have this]
• Shell access, root access
• Internet access
• LibreOffice (or any other spreadsheet software)
PRESENTER: GAETANO GIUNTA

Theory
1. A scalable web site
• It is impossible to go for infinite scalability
• Expected traffic figures should ideally be known beforehand
• If not, a round of load testing before go-live is highly recommended
2. “Fast enough” pages
• Definition of enough hash to be agreed upon: for a webshop it is smaller than for an institutional site
• Page load times experienced by the user depends on user bandwidth as well as html/js optimization (but that takes a dedicated workshop of its own)
scaling > faster pages
• Typical developer mistake: test pages on his own laptop (concurrency = 1)
• The fast page becomes extremely slow when concurrency increases
• If traffic never increases, your career as web developer is on a wrong path
6/9/2012 SLIDE 6
GOALS Finishing the workshop early to go bathing does not count ;-)
PRESENTER: GAETANO GIUNTA
• Developers measure traffic in PVS (page views per second/minute/hour/day)
• It is easy to relate to server load
• PV != Hits
• But serving static content should never pose a problem anyway
• Customers measure traffic in concurrent users
• It is a good idea to agree on metrics when defining goals
• Analytics packages generally measure user session length and average page
impressions per session => average page views per second per user
6/9/2012 SLIDE 7
What is “scalable” anyway? Lies, damn lies and statistics (W. Churchill)
PRESENTER: GAETANO GIUNTA
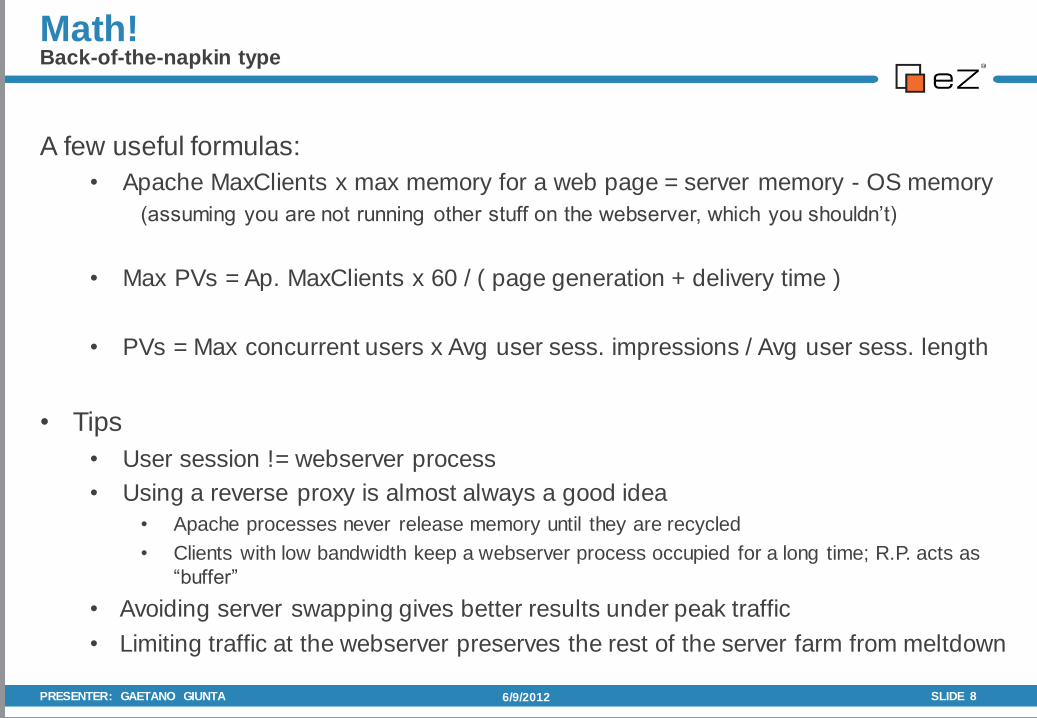
A few useful formulas:
• Apache MaxClients x max memory for a web page = server memory - OS memory
(assuming you are not running other stuff on the webserver, which you shouldn’t)
• Max PVs = Ap. MaxClients x 60 / ( page generation + delivery time )
• PVs = Max concurrent users x Avg user sess. impressions / Avg user sess. length
• Tips
• User session != webserver process
• Using a reverse proxy is almost always a good idea
• Apache processes never release memory until they are recycled
• Clients with low bandwidth keep a webserver process occupied for a long time; R.P. acts as
“buffer”
• Avoiding server swapping gives better results under peak traffic
• Limiting traffic at the webserver preserves the rest of the server farm from meltdown
6/9/2012 SLIDE 8
Math! Back-of-the-napkin type
PRESENTER: GAETANO GIUNTA
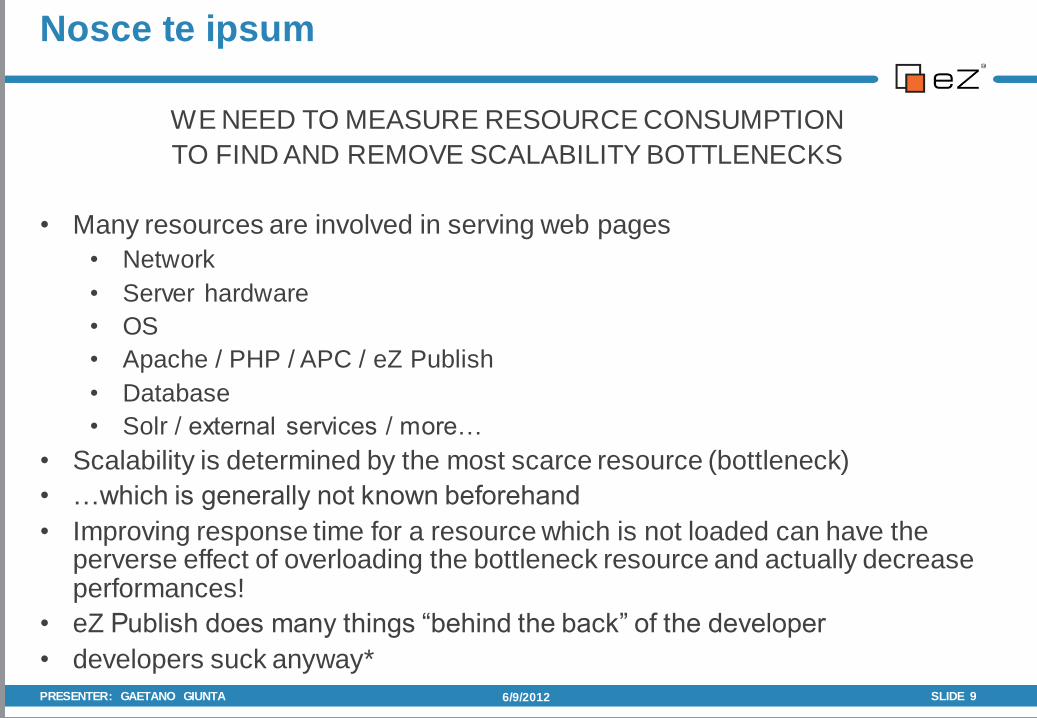
WE NEED TO MEASURE RESOURCE CONSUMPTION
TO FIND AND REMOVE SCALABILITY BOTTLENECKS
• Many resources are involved in serving web pages
• Network
• Server hardware
• OS
• Apache / PHP / APC / eZ Publish
• Database
• Solr / external services / more…
• Scalability is determined by the most scarce resource (bottleneck)
• …which is generally not known beforehand
• Improving response time for a resource which is not loaded can have the perverse effect of overloading the bottleneck resource and actually decrease performances!
• eZ Publish does many things “behind the back” of the developer
• developers suck anyway*
6/9/2012 SLIDE 9
Nosce te ipsum
PRESENTER: GAETANO GIUNTA
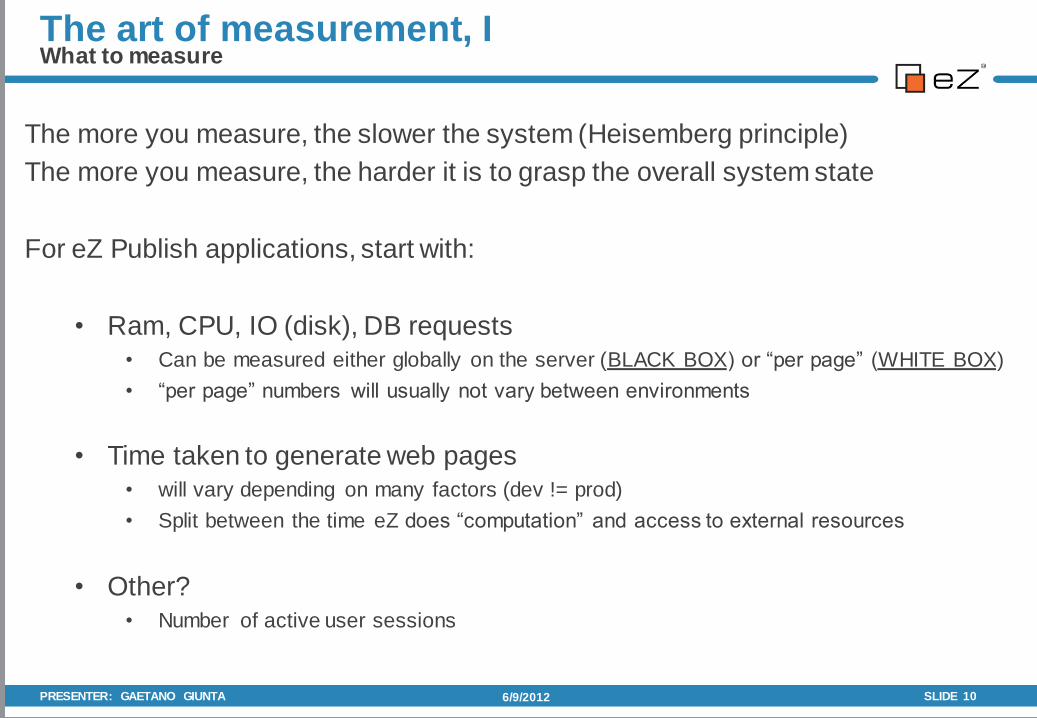
The more you measure, the slower the system (Heisemberg principle)
The more you measure, the harder it is to grasp the overall system state
For eZ Publish applications, start with:
• Ram, CPU, IO (disk), DB requests
• Can be measured either globally on the server (BLACK BOX) or “per page” (WHITE BOX)
• “per page” numbers will usually not vary between environments
• Time taken to generate web pages
• will vary depending on many factors (dev != prod)
• Split between the time eZ does “computation” and access to external resources
• Other?
• Number of active user sessions
6/9/2012 SLIDE 10
The art of measurement, I What to measure
PRESENTER: GAETANO GIUNTA
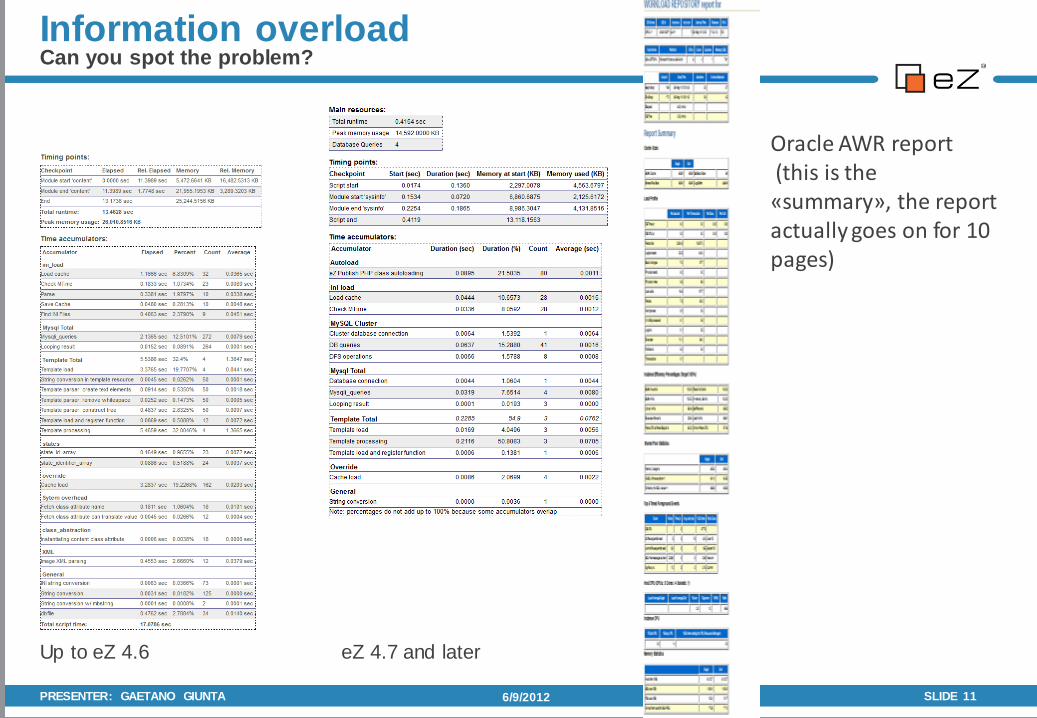
Up to eZ 4.6 eZ 4.7 and later
6/9/2012 SLIDE 11
Information overload Can you spot the problem?
Oracle AWR report (this is the «summary», the report actually goes on for 10 pages)
PRESENTER: GAETANO GIUNTA
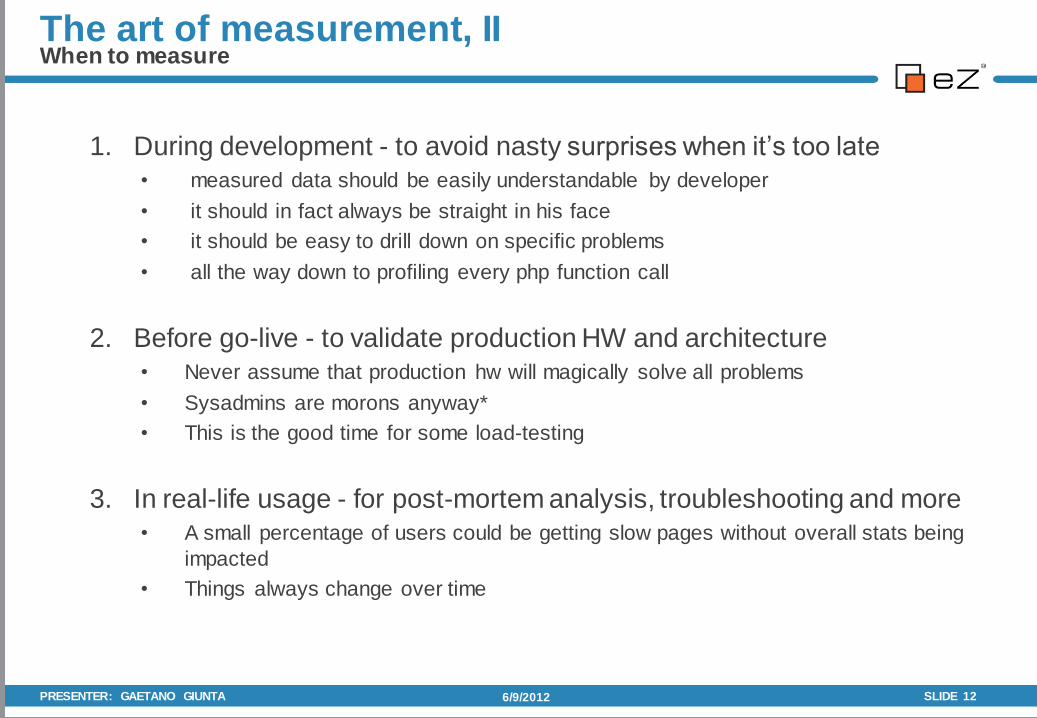
1. During development - to avoid nasty surprises when it’s too late
• measured data should be easily understandable by developer
• it should in fact always be straight in his face
• it should be easy to drill down on specific problems
• all the way down to profiling every php function call
2. Before go-live - to validate production HW and architecture
• Never assume that production hw will magically solve all problems
• Sysadmins are morons anyway*
• This is the good time for some load-testing
3. In real-life usage - for post-mortem analysis, troubleshooting and more
• A small percentage of users could be getting slow pages without overall stats being
impacted
• Things always change over time
6/9/2012 SLIDE 12
The art of measurement, II When to measure
PRESENTER: GAETANO GIUNTA
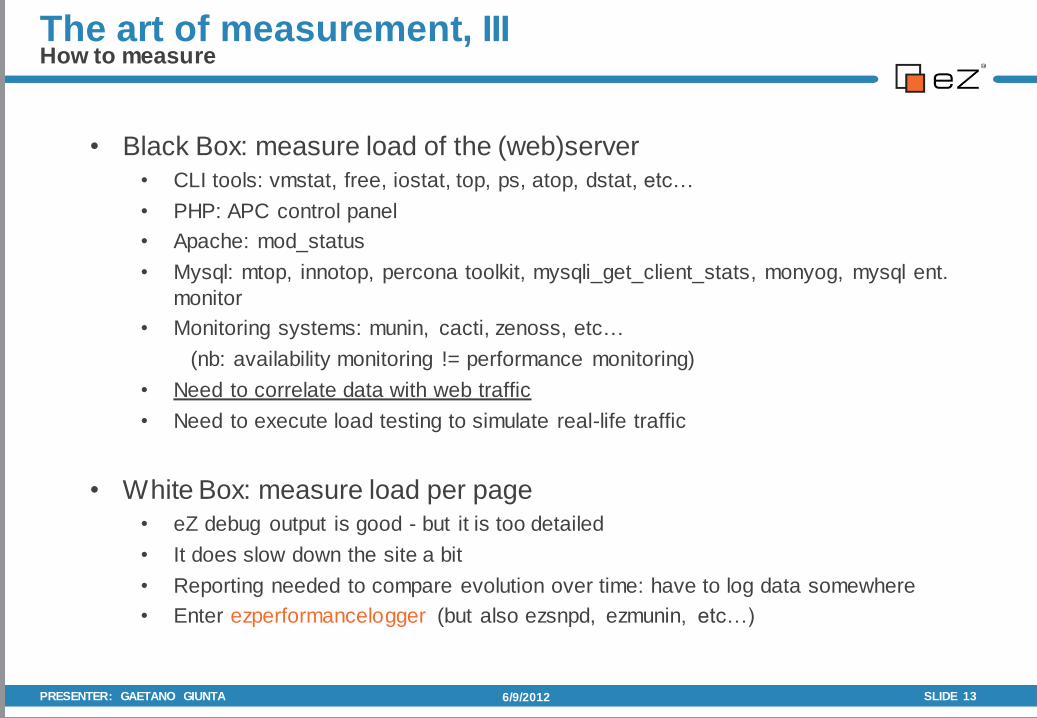
• Black Box: measure load of the (web)server
• CLI tools: vmstat, free, iostat, top, ps, atop, dstat, etc…
• PHP: APC control panel
• Apache: mod_status
• Mysql: mtop, innotop, percona toolkit, mysqli_get_client_stats, monyog, mysql ent.
monitor
• Monitoring systems: munin, cacti, zenoss, etc…
(nb: availability monitoring != performance monitoring)
• Need to correlate data with web traffic
• Need to execute load testing to simulate real-life traffic
• White Box: measure load per page
• eZ debug output is good - but it is too detailed
• It does slow down the site a bit
• Reporting needed to compare evolution over time: have to log data somewhere
• Enter ezperformancelogger (but also ezsnpd, ezmunin, etc…)
6/9/2012 SLIDE 13
The art of measurement, III How to measure
PRESENTER: GAETANO GIUNTA
• Always check error logs if there is something unexpected in measured data
• Testing should be done using a realistic data set (eg. 10.000 users, not 10)
• The clock of all servers should be in sync to allow correlation (no, really)
• Measuring VMs: time is generally a lie
6/9/2012 SLIDE 14
The art of measurement, IV Tips
PRESENTER: GAETANO GIUNTA

Load Testing
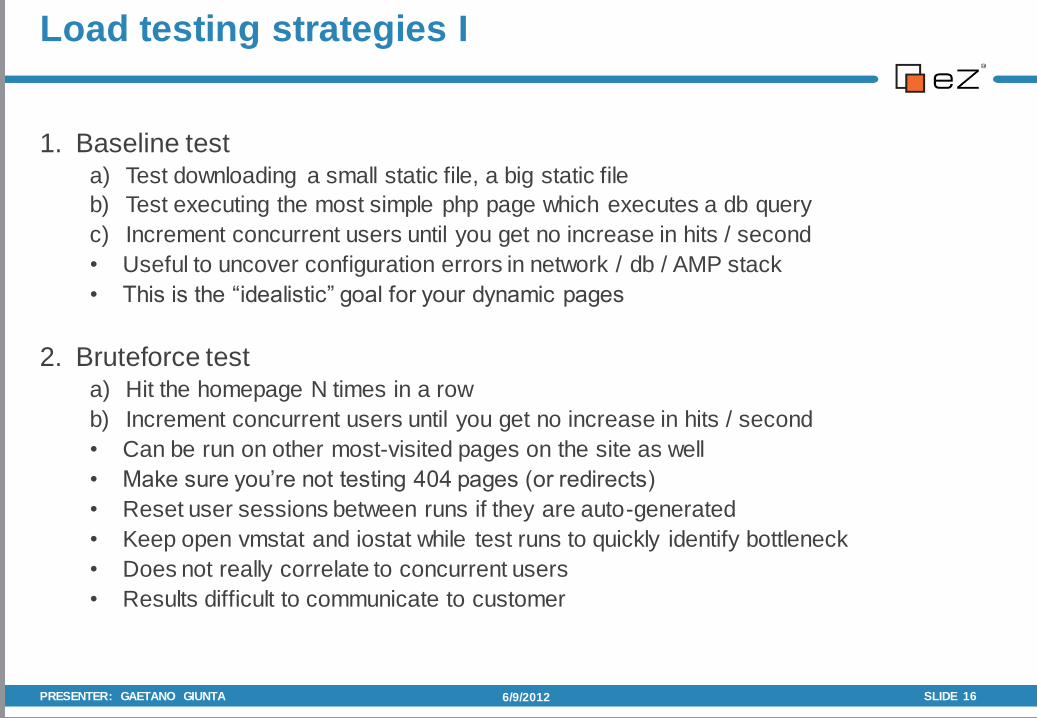
1. Baseline test a) Test downloading a small static file, a big static file
b) Test executing the most simple php page which executes a db query
c) Increment concurrent users until you get no increase in hits / second
• Useful to uncover configuration errors in network / db / AMP stack
• This is the “idealistic” goal for your dynamic pages
2. Bruteforce test a) Hit the homepage N times in a row
b) Increment concurrent users until you get no increase in hits / second
• Can be run on other most-visited pages on the site as well
• Make sure you’re not testing 404 pages (or redirects)
• Reset user sessions between runs if they are auto-generated
• Keep open vmstat and iostat while test runs to quickly identify bottleneck
• Does not really correlate to concurrent users
• Results difficult to communicate to customer
6/9/2012 SLIDE 16
Load testing strategies I
PRESENTER: GAETANO GIUNTA
3. Full site navigation test
a) Enable logging of interesting data
b) Use wget or httrack to navigate the whole site
c) Get log files data into a spreadhseet
• Useful to uncover pages with bad resource usage
• Can be run with both cold and warm caches to gauge cache efficiency
4. Scenario testing
• Need support from end user to determine most likely/useful scenarios
• Takes time to configure in load-testing tool
• Do not believe tools that promise to automagically generate a scenario by “sniffing”
browser sessions: manual intervention will be needed
• Always validate first each single response before running the whole test
• The one test which is closer to real life…
• …but also one which is easy to manipulate (many knobs to tweak)
6/9/2012 PRESENTER: GAETANO GIUNTA SLIDE 17
Load testing strategies II
• Do not use the webserver to execute the client (to avoid impact on cpu)
• Do not measure routers, firewalls or network card performance either (by testing from
remote network), unless what you want is real-world measures
• Always write down complete hw and sw specs – some of it will have changed next
time you want to run the test for comparison (a good idea: zip and save complete
apache and php config files, write down command line used for client in the report)
• Automate tasks to avoid human error / getting bored
6/9/2012 PRESENTER: GAETANO GIUNTA SLIDE 18
Load testing tips
• Apache bench • Good: always available
• Bad: not very flexible; limited support for advanced http features
• Siege • Good: better than Apache Bench; some support for scenario testing
• Bad: not available by default in many linux distros (or windows)
• Jmeter • Good: allows complex scenario testing; can run tests from a farm of machines
• Bad: has a learning curve; needs Java
• Httperf, web polygraph, …
• Web-based tools • Good: can test from many locations across the world; easy to use
• Bad: usually do not offer too much flexibility; $$$
• Roll-your-own (php) script • Good: flexible; can be used on servers where you can not install any other software
• Bad: can not compare with other measures; guarantee of correctness
• Excellent: it is there to use! https://github.com/gggeek/ezab
6/9/2012 PRESENTER: GAETANO GIUNTA SLIDE 19
Load testing tools (the ones I know about)
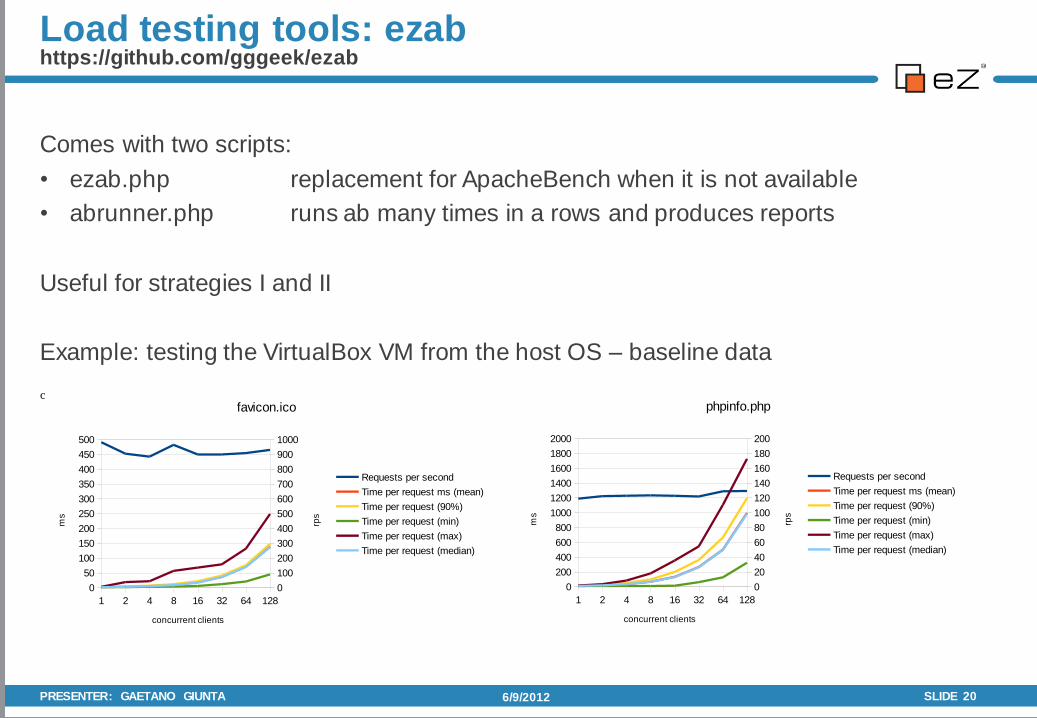
Comes with two scripts:
• ezab.php replacement for ApacheBench when it is not available
• abrunner.php runs ab many times in a rows and produces reports
Useful for strategies I and II
Example: testing the VirtualBox VM from the host OS – baseline data
6/9/2012 PRESENTER: GAETANO GIUNTA SLIDE 20
Load testing tools: ezab https://github.com/gggeek/ezab
1 2 4 8 16 32 64 128
0
200
400
600
800
1000
1200
1400
1600
1800
2000
0
20
40
60
80
100
120
140
160
180
200
phpinfo.php
Requests per second
Time per request ms (mean)
Time per request (90%)
Time per request (min)
Time per request (max)
Time per request (median)
concurrent clients
ms
rps
1 2 4 8 16 32 64 128
0
50
100
150
200
250
300
350
400
450
500
0
100
200
300
400
500
600
700
800
900
1000
favicon.ico
Requests per second
Time per request ms (mean)
Time per request (90%)
Time per request (min)
Time per request (max)
Time per request (median)
concurrent clients
ms
rps
c
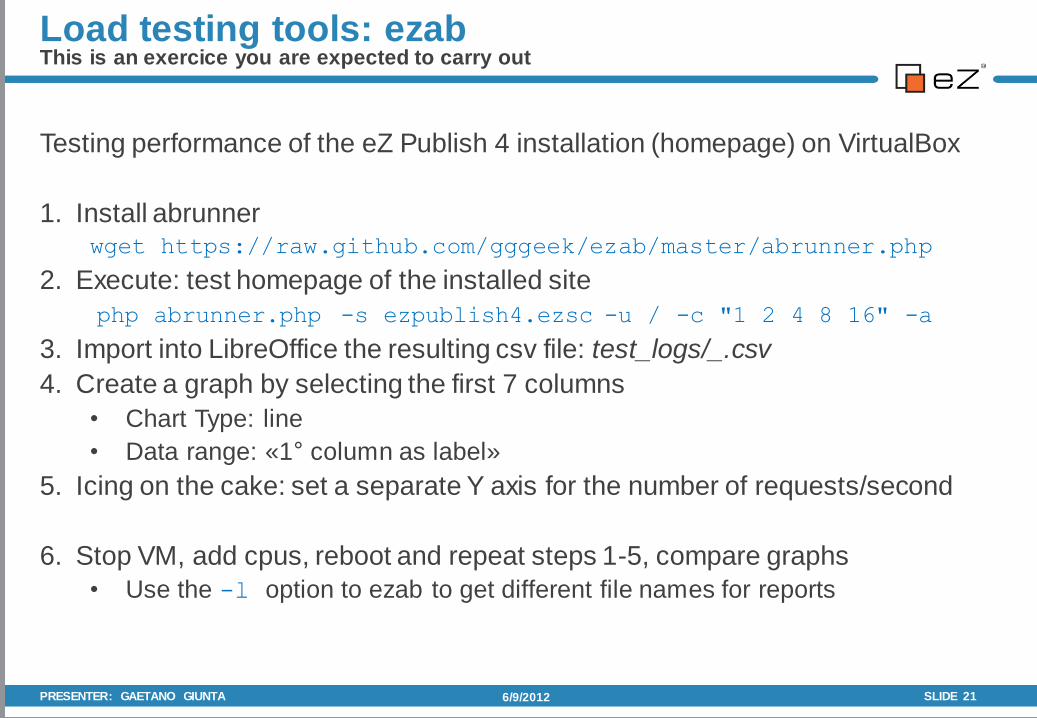
Testing performance of the eZ Publish 4 installation (homepage) on VirtualBox
1. Install abrunner wget https://raw.github.com/gggeek/ezab/master/abrunner.php
2. Execute: test homepage of the installed site
php abrunner.php -s ezpublish4.ezsc -u / -c "1 2 4 8 16" -a
3. Import into LibreOffice the resulting csv file: test_logs/_.csv
4. Create a graph by selecting the first 7 columns
• Chart Type: line
• Data range: «1° column as label»
5. Icing on the cake: set a separate Y axis for the number of requests/second
6. Stop VM, add cpus, reboot and repeat steps 1-5, compare graphs
• Use the -l option to ezab to get different file names for reports
6/9/2012 PRESENTER: GAETANO GIUNTA SLIDE 21
Load testing tools: ezab This is an exercice you are expected to carry out
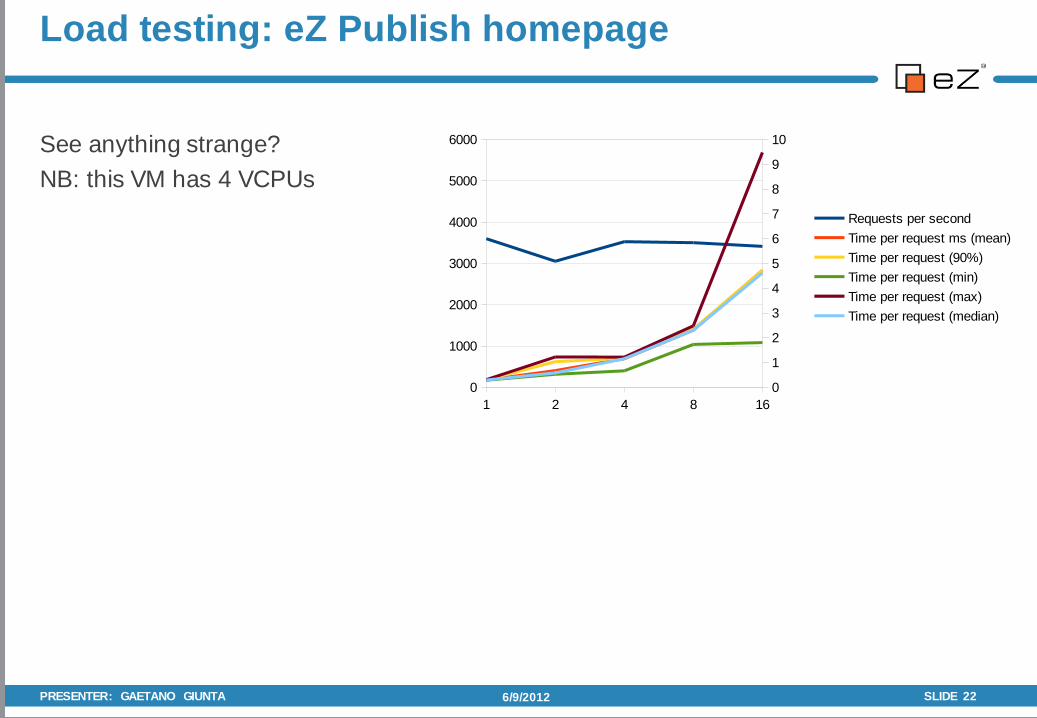
See anything strange?
NB: this VM has 4 VCPUs
6/9/2012 PRESENTER: GAETANO GIUNTA SLIDE 22
Load testing: eZ Publish homepage
1 2 4 8 16
0
1000
2000
3000
4000
5000
6000
0
1
2
3
4
5
6
7
8
9
10
Requests per second
Time per request ms (mean)
Time per request (90%)
Time per request (min)
Time per request (max)
Time per request (median)
See anything strange?
NB: this VM has 4 VCPUs
• Performance is waay too little:
6 page views per second
• RPS does not increase going
from 1 to 16 concurrent clients
6/9/2012 PRESENTER: GAETANO GIUNTA SLIDE 23
Load testing: eZ Publish homepage
1 2 4 8 16
0
1000
2000
3000
4000
5000
6000
0
1
2
3
4
5
6
7
8
9
10
Requests per second
Time per request ms (mean)
Time per request (90%)
Time per request (min)
Time per request (max)
Time per request (median)
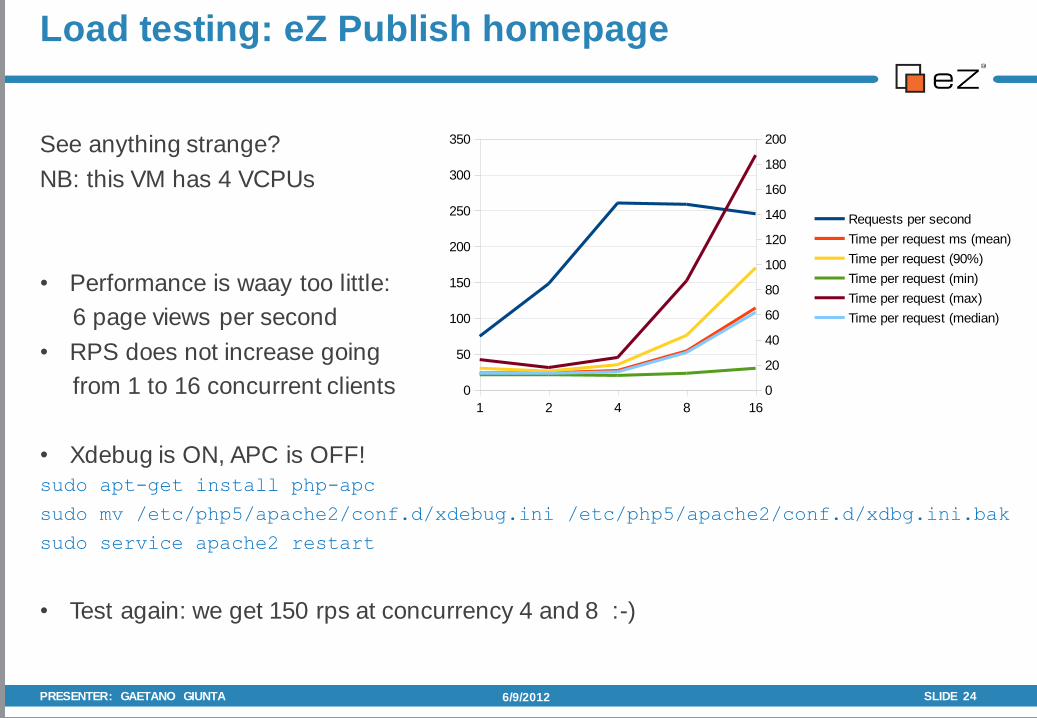
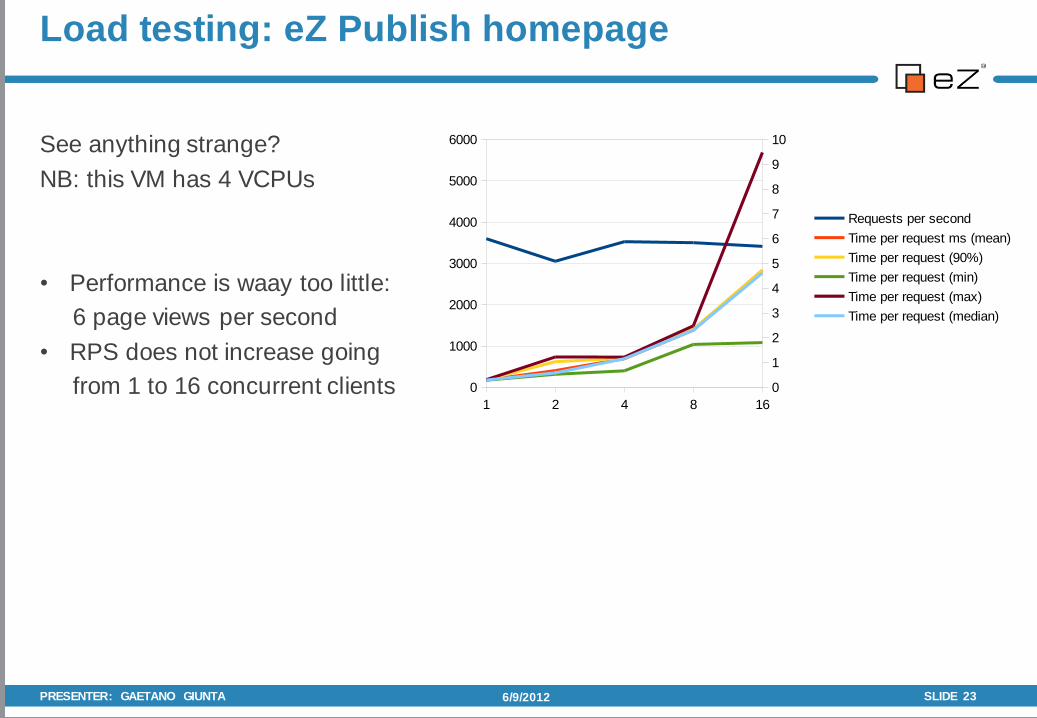
See anything strange?
NB: this VM has 4 VCPUs
• Performance is waay too little:
6 page views per second
• RPS does not increase going
from 1 to 16 concurrent clients
• Xdebug is ON, APC is OFF! sudo apt-get install php-apc
sudo mv /etc/php5/apache2/conf.d/xdebug.ini /etc/php5/apache2/conf.d/xdbg.ini.bak
sudo service apache2 restart
• Test again: we get 150 rps at concurrency 4 and 8 :-)
6/9/2012 PRESENTER: GAETANO GIUNTA SLIDE 24
Load testing: eZ Publish homepage
1 2 4 8 16
0
50
100
150
200
250
300
350
0
20
40
60
80
100
120
140
160
180
200
Requests per second
Time per request ms (mean)
Time per request (90%)
Time per request (min)
Time per request (max)
Time per request (median)
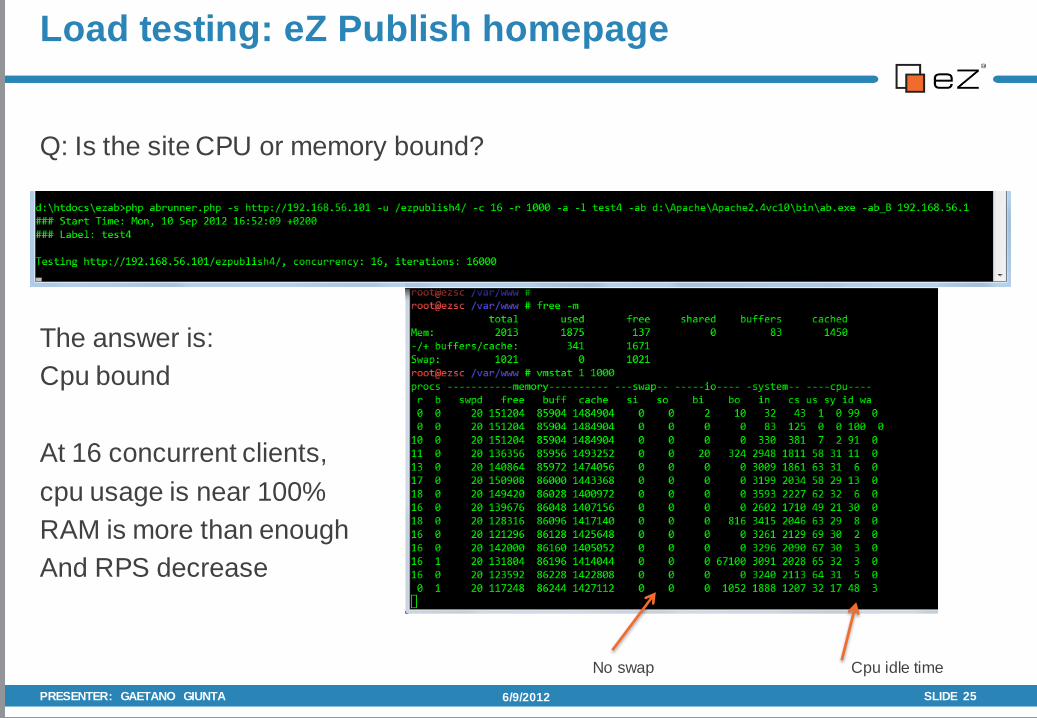
Q: Is the site CPU or memory bound?
The answer is:
Cpu bound
At 16 concurrent clients,
cpu usage is near 100%
RAM is more than enough
And RPS decrease
6/9/2012 PRESENTER: GAETANO GIUNTA SLIDE 25
Load testing: eZ Publish homepage
Cpu idle time No swap
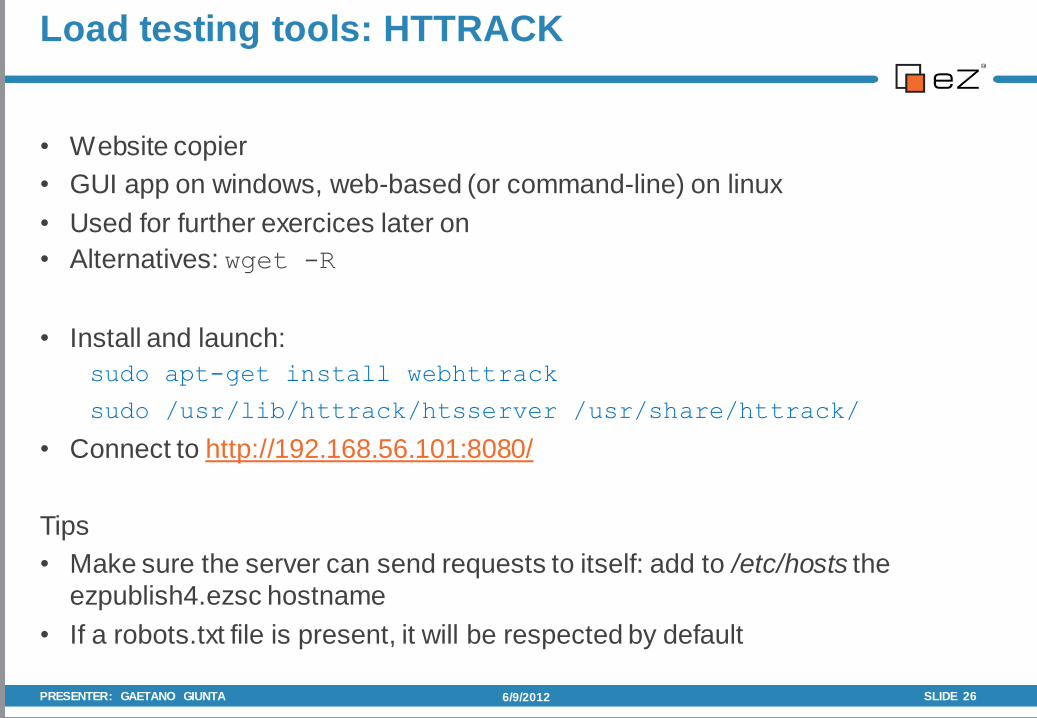
• Website copier
• GUI app on windows, web-based (or command-line) on linux
• Used for further exercices later on
• Alternatives: wget -R
• Install and launch:
sudo apt-get install webhttrack
sudo /usr/lib/httrack/htsserver /usr/share/httrack/
• Connect to http://192.168.56.101:8080/
Tips
• Make sure the server can send requests to itself: add to /etc/hosts the
ezpublish4.ezsc hostname
• If a robots.txt file is present, it will be respected by default
6/9/2012 PRESENTER: GAETANO GIUNTA SLIDE 26
Load testing tools: HTTRACK
eZ Performance Logger
• Allows the developer to define a set of variables (KPI) to be measured
• Each variable is measured for every page view (rest / ajax pages as well)
• Measured KPIs can be sent to multiple logging systems
• Csv formatted log probably the easiest to later parse
• Apache’s own access log probably the best suited to avoid any performance hit
• Supports logging directly to Google Analytics or Piwik via rewriting of html pages
• Common KPIs are available (eg. db queries, db time), custom ones can be added
• Integrates with Munin to visualize the measured data
• Throws in full integration with XHProf profiler as bonus
• According to facebook “good enough” to keep enabled in production
• Does NOT come with a nice GUI of its own
6/9/2012 SLIDE 28
eZ Performance Logger http://projects.ez.no/ezperformancelogger
PRESENTER: GAETANO GIUNTA
Requirements
• eZ Publish 4.x
• Apache webserver recommended
• Optional: Xhprof
• Optional: a Google Analytics account or Piwik
• Optional: Munin
The extension comes preinstalled in the Virtual Machine for the Workshop
To install by hand, follow the standard procedure – no need to touch the database
For advanced users: in classes/tracers, alternative connectors are provided for mysqli database and ezdfs cluster, which allow to measure performance data even in
production environments (where ezdebug is turned off).
6/9/2012 SLIDE 29
Installation
PRESENTER: GAETANO GIUNTA
1. Unzip and activate extension
2. Set logging format to csv-formatted file:
create file settings/override/ezperformancelogger.ini.append.php
[GeneralSettings]
LogMethods[]
LogMethods[]=csv
[csvSettings]
FileName=var/log/ezperflog.csv
3. Set performance indicators to be logged, eg: memory used, execution time
[GeneralSettings]
TrackVariables[]
TrackVariables[]=mem_usage
TrackVariables[]=execution_time
4. Test that it is working:
1. Browse to the homepage
2. Check for presence of var/log/ezperflog.csv
6/9/2012 SLIDE 30
First steps
PRESENTER: GAETANO GIUNTA
The eZPublish database connector measures all the commands sent to the database:
• Number of queries executed
• Time taken
This is only done when the debug output is enabled.
eZPerformanceLogger allows to log any existing «timing point»
1. Enable debug output (in settings/override/site.ini.append.php)
[DebugSettings]
DebugOutput=enabled
2. Add number of queries and time taken to the performance indicators logged
TrackVariables[]=accumulators/mysqli_query/count
TrackVariables[]=accumulators/mysqli_query
3. Rotate the csv file, since it will now have a different number of columns
php extension/ezperformancelogger/bin/php/rotateperflogs.php
4. Reload homepage, check log file
6/9/2012 SLIDE 31
Measuring database queries per page
PRESENTER: GAETANO GIUNTA
By default ajax calls and requests which end up in a redirect are not logged.
How to fix:
• Edit index.php, on line 198 add
eZExecution::addCleanupHandler( array( 'eZPerfLogger', 'cleanup' ) );
• Browse content in the Admin interface (which uses ezjscore)
• Look for calls to ezjscore/call in var/log/ezperflog.csv
• Other frontend controllers have to be patched as well
• index_ajax.php (removed in recent versions)
• index_treemenu.php, index_treemenu_tags.php, index_soap.php
• index_cluster.php currently not supported
6/9/2012 SLIDE 32
Making sure all requests are measured
PRESENTER: GAETANO GIUNTA
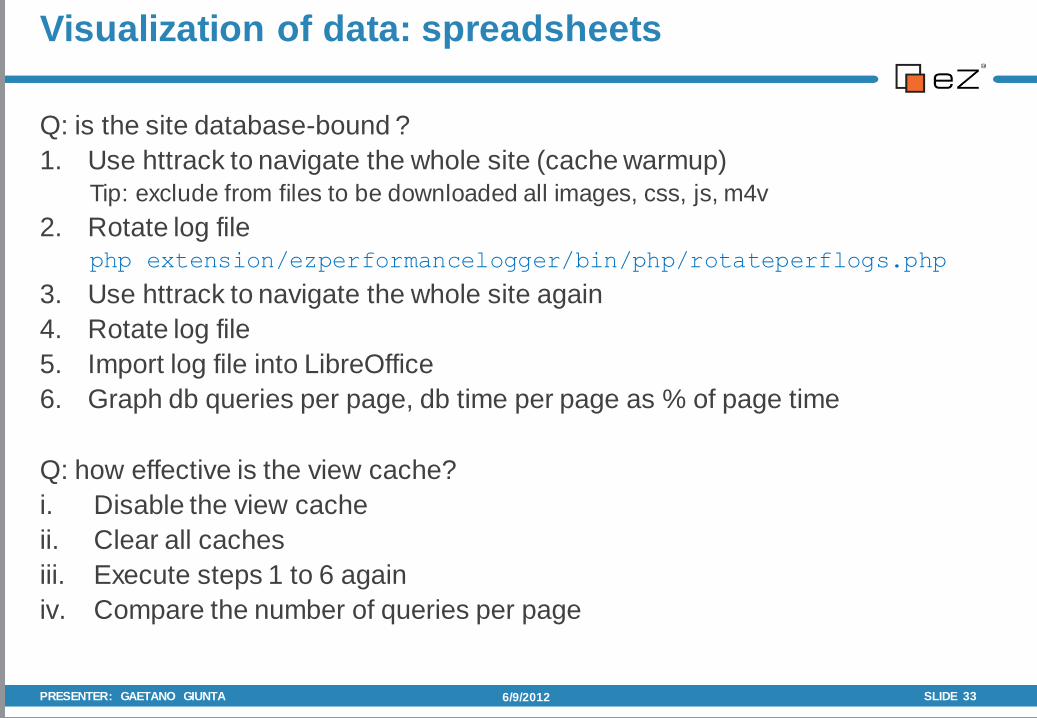
Q: is the site database-bound ?
1. Use httrack to navigate the whole site (cache warmup)
Tip: exclude from files to be downloaded all images, css, js, m4v
2. Rotate log file php extension/ezperformancelogger/bin/php/rotateperflogs.php
3. Use httrack to navigate the whole site again
4. Rotate log file
5. Import log file into LibreOffice
6. Graph db queries per page, db time per page as % of page time
Q: how effective is the view cache?
i. Disable the view cache
ii. Clear all caches
iii. Execute steps 1 to 6 again
iv. Compare the number of queries per page
6/9/2012 SLIDE 33
Visualization of data: spreadsheets
PRESENTER: GAETANO GIUNTA
6/9/2012 SLIDE 34
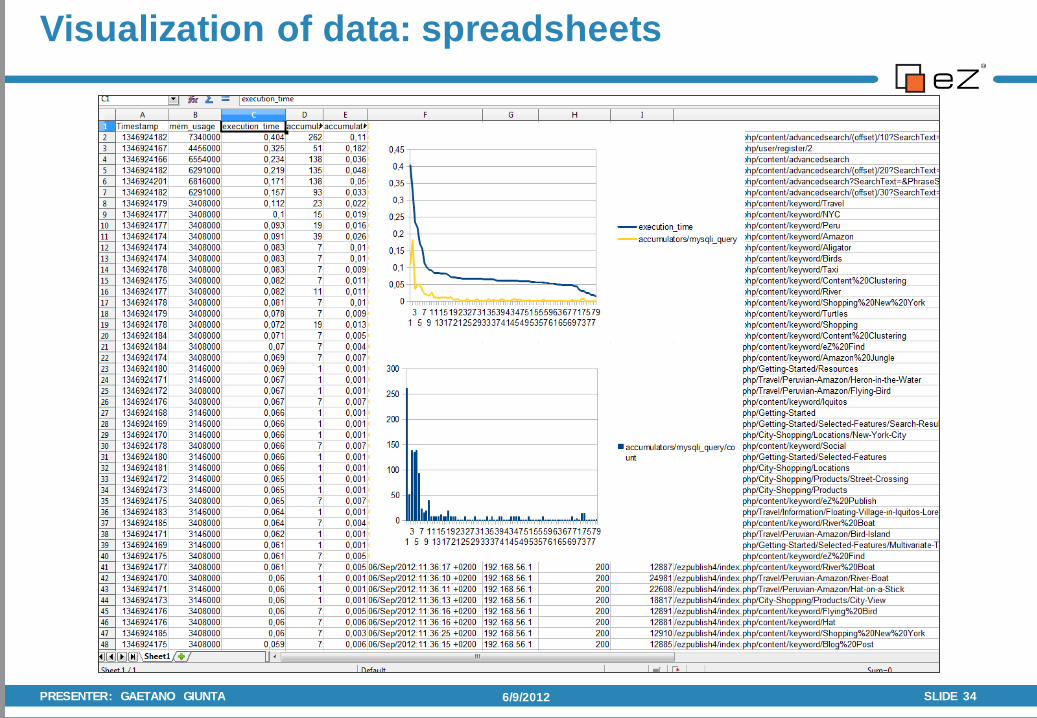
Visualization of data: spreadsheets
PRESENTER: GAETANO GIUNTA

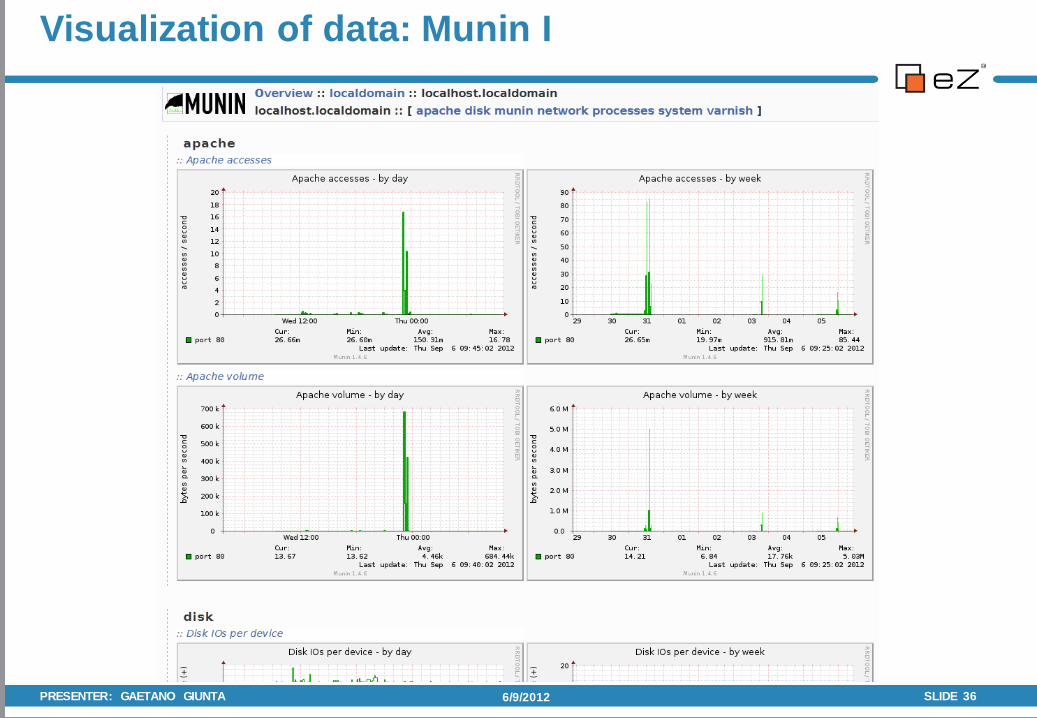
• Munin is an open source monitoring tool
• It generates daily and weekly graphs for collected data
• It collects a lot of data from the operating system
• It comes with a wide set of plugins for existing software, such as Apache
and MySql
• Creating plugins for new software is relatively easy
• Agent-based architecture: a munin “master” server can collect and display
data from multiple “node” servers
• For our scenario, the webserver acts as both master and node
• Master: runs a cronjob that generates reports by querying nodes and stores
them in /var/cache/munin; the reports are made available via Apache
• Slave: runs a daemon: munin-node, listening on port 4949
6/9/2012 PRESENTER: GAETANO GIUNTA SLIDE 35
Visualization of data: Munin I http://www.munin-monitoring.org/
Visualization of data: Munin I
6/9/2012 PRESENTER: GAETANO GIUNTA SLIDE 36
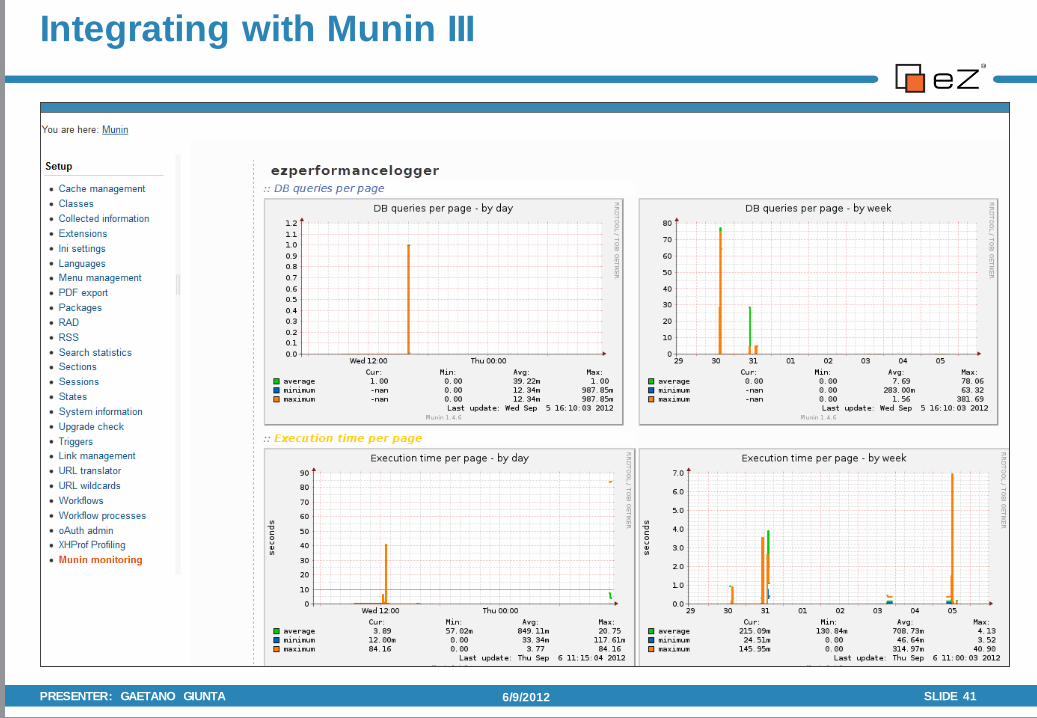
• The default interval for collecting data is 5 minutes (it should be more flexible in
version 2)
• All ezperformancelogger KPIs can be shown in a Munin graph
• By default, the “per page” value of the PKI is shown
• In every graph, the Average, Maximum and Minimum value are shown
• Via eZ Publish settings, appearance of those graphs can be tuned
• Note: the timestamp of the last time the munin plugin has collected data from
ezperformancelogger for any specific KPI is stored in var/<vardir>/log
6/9/2012 SLIDE 37
Visualization of data: Munin II Integration of eZ Performance Logger
PRESENTER: GAETANO GIUNTA
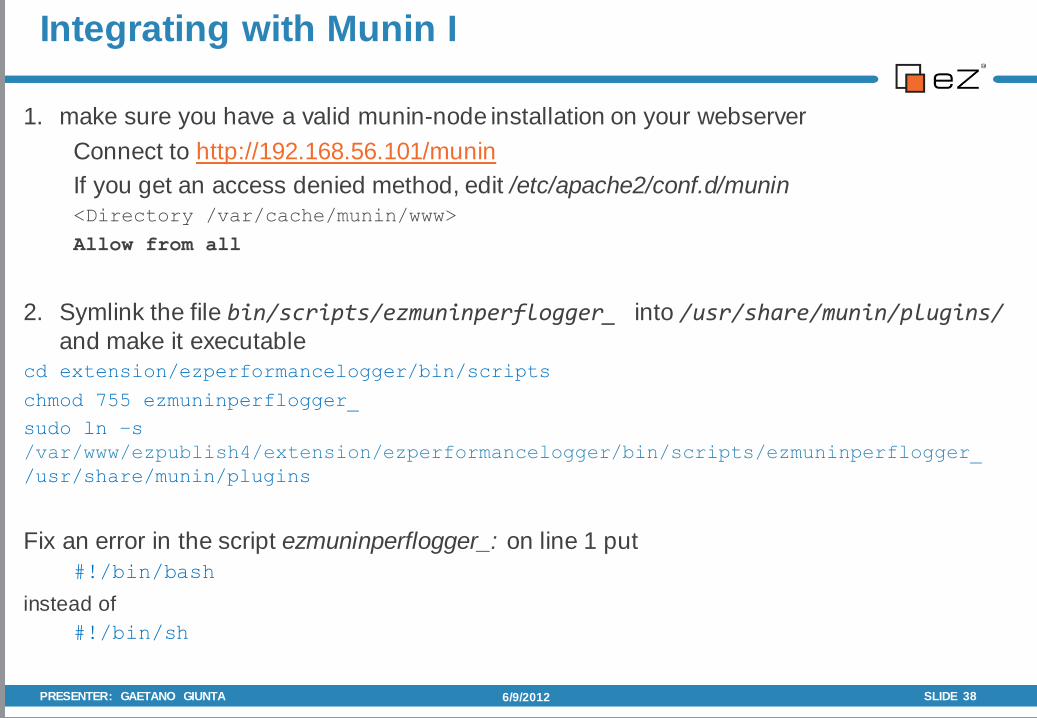
1. make sure you have a valid munin-node installation on your webserver
Connect to http://192.168.56.101/munin
If you get an access denied method, edit /etc/apache2/conf.d/munin <Directory /var/cache/munin/www>
Allow from all
2. Symlink the file bin/scripts/ezmuninperflogger_ into /usr/share/munin/plugins/ and make it executable
cd extension/ezperformancelogger/bin/scripts
chmod 755 ezmuninperflogger_
sudo ln –s
/var/www/ezpublish4/extension/ezperformancelogger/bin/scripts/ezmuninperflogger_
/usr/share/munin/plugins
Fix an error in the script ezmuninperflogger_: on line 1 put
#!/bin/bash
instead of
#!/bin/sh
6/9/2012 SLIDE 38
Integrating with Munin I
PRESENTER: GAETANO GIUNTA
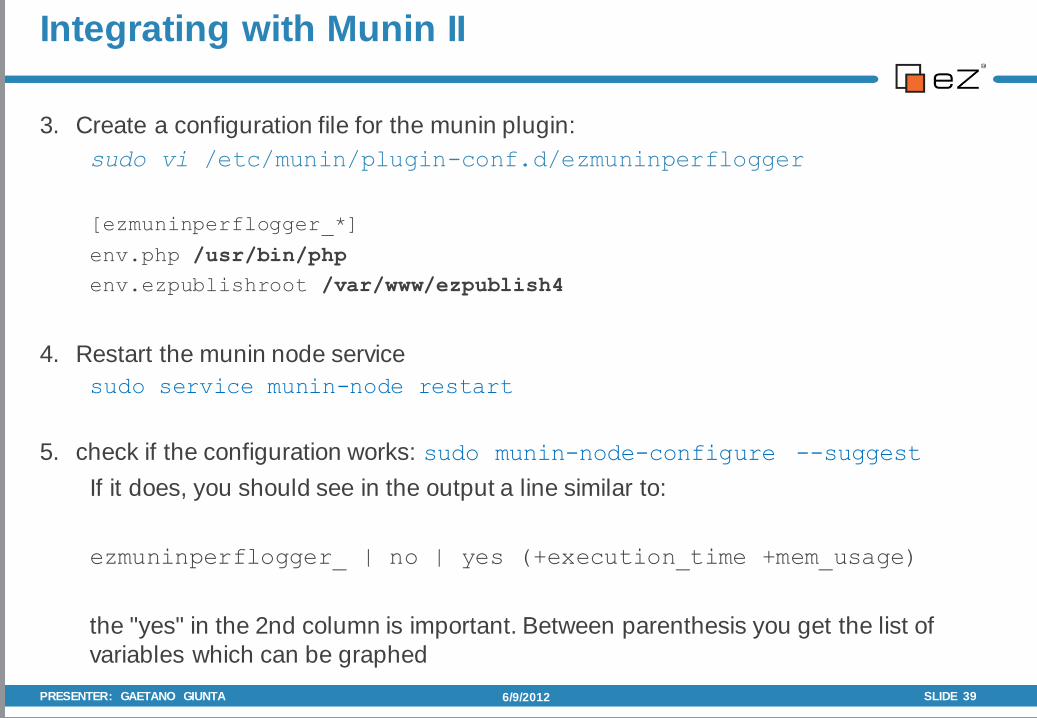
3. Create a configuration file for the munin plugin:
sudo vi /etc/munin/plugin-conf.d/ezmuninperflogger
[ezmuninperflogger_*]
env.php /usr/bin/php
env.ezpublishroot /var/www/ezpublish4
4. Restart the munin node service
sudo service munin-node restart
5. check if the configuration works: sudo munin-node-configure --suggest
If it does, you should see in the output a line similar to:
ezmuninperflogger_ | no | yes (+execution_time +mem_usage)
the "yes" in the 2nd column is important. Between parenthesis you get the list of
variables which can be graphed
6/9/2012 SLIDE 39
Integrating with Munin II
PRESENTER: GAETANO GIUNTA
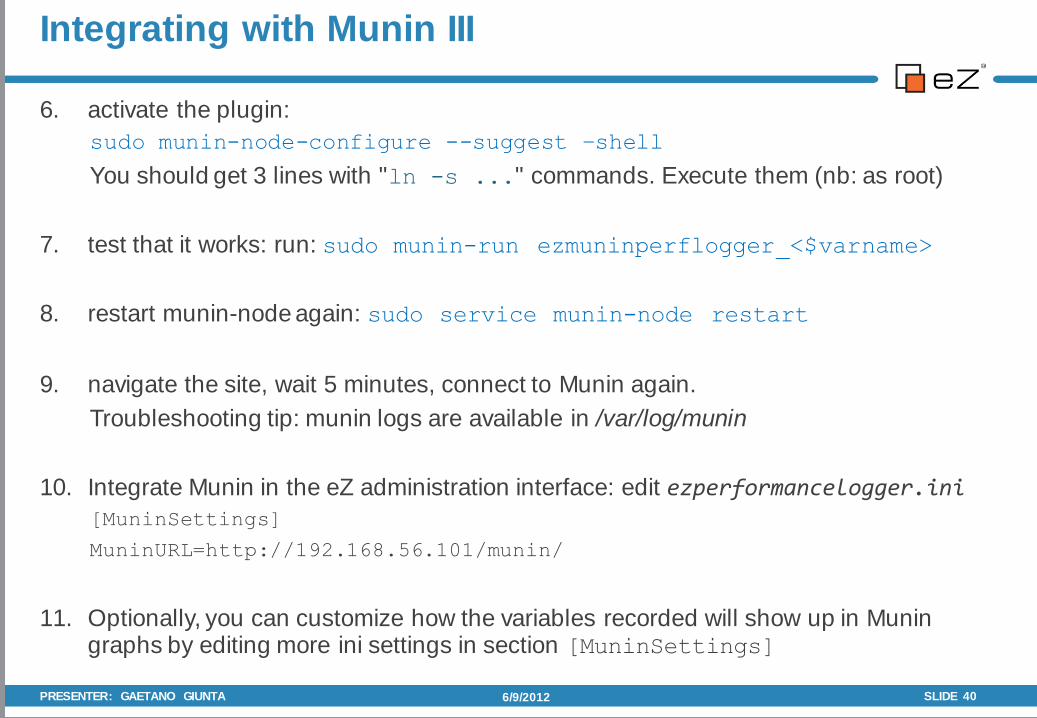
6. activate the plugin:
sudo munin-node-configure --suggest –shell
You should get 3 lines with "ln -s ..." commands. Execute them (nb: as root)
7. test that it works: run: sudo munin-run ezmuninperflogger_<$varname>
8. restart munin-node again: sudo service munin-node restart
9. navigate the site, wait 5 minutes, connect to Munin again.
Troubleshooting tip: munin logs are available in /var/log/munin
10. Integrate Munin in the eZ administration interface: edit ezperformancelogger.ini
[MuninSettings]
MuninURL=http://192.168.56.101/munin/
11. Optionally, you can customize how the variables recorded will show up in Munin graphs by editing more ini settings in section [MuninSettings]
6/9/2012 SLIDE 40
Integrating with Munin III
PRESENTER: GAETANO GIUNTA
6/9/2012 SLIDE 41
Integrating with Munin III
PRESENTER: GAETANO GIUNTA
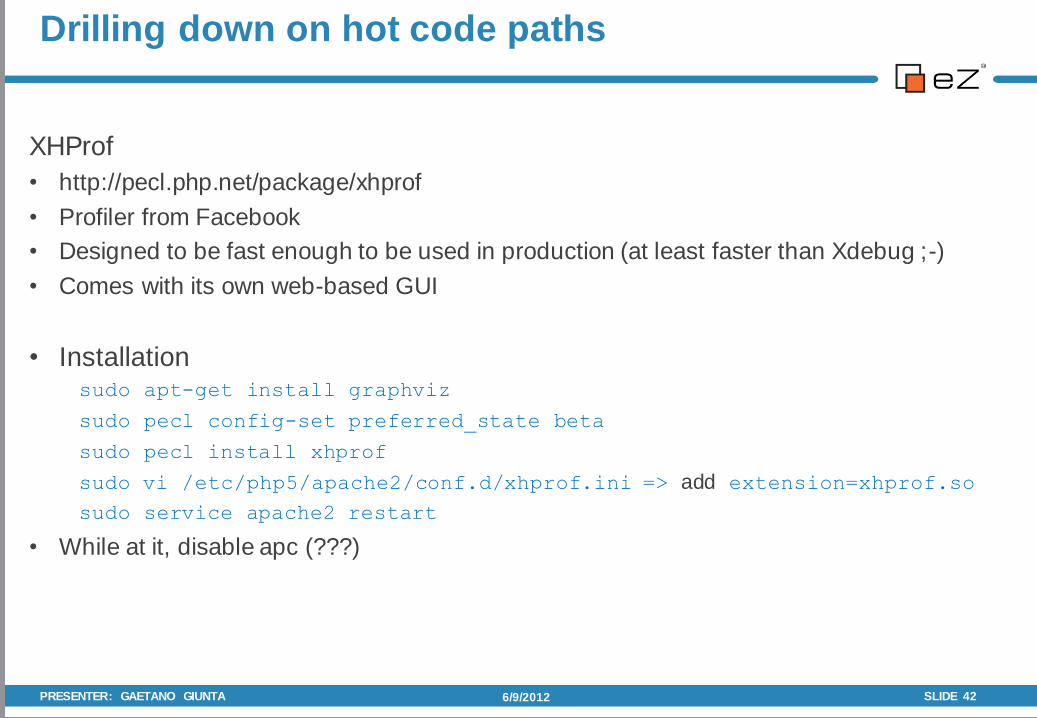
XHProf
• http://pecl.php.net/package/xhprof
• Profiler from Facebook
• Designed to be fast enough to be used in production (at least faster than Xdebug ;-)
• Comes with its own web-based GUI
• Installation sudo apt-get install graphviz
sudo pecl config-set preferred_state beta
sudo pecl install xhprof
sudo vi /etc/php5/apache2/conf.d/xhprof.ini => add extension=xhprof.so
sudo service apache2 restart
• While at it, disable apc (???)
6/9/2012 PRESENTER: GAETANO GIUNTA SLIDE 42
Drilling down on hot code paths
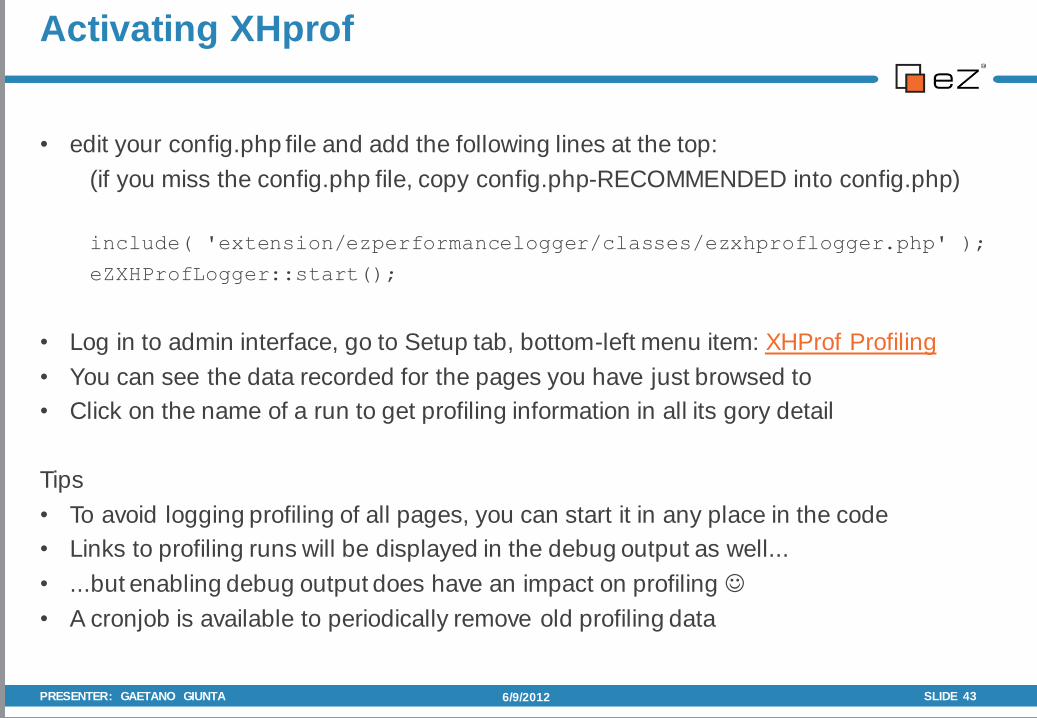
• edit your config.php file and add the following lines at the top:
(if you miss the config.php file, copy config.php-RECOMMENDED into config.php)
include( 'extension/ezperformancelogger/classes/ezxhproflogger.php' );
eZXHProfLogger::start();
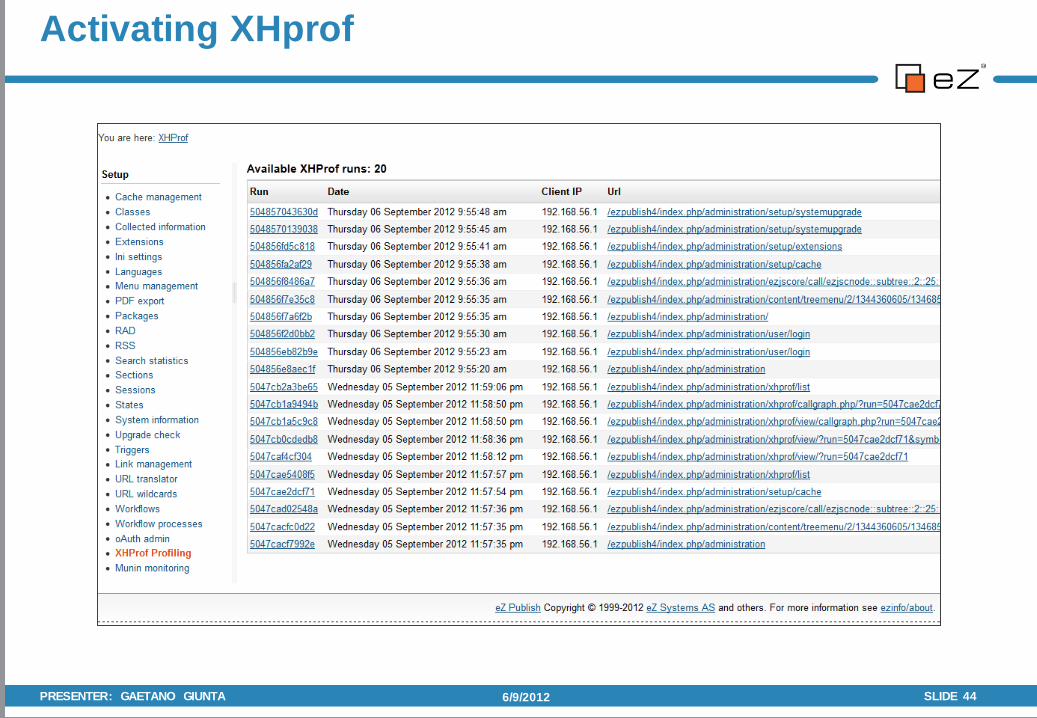
• Log in to admin interface, go to Setup tab, bottom-left menu item: XHProf Profiling
• You can see the data recorded for the pages you have just browsed to
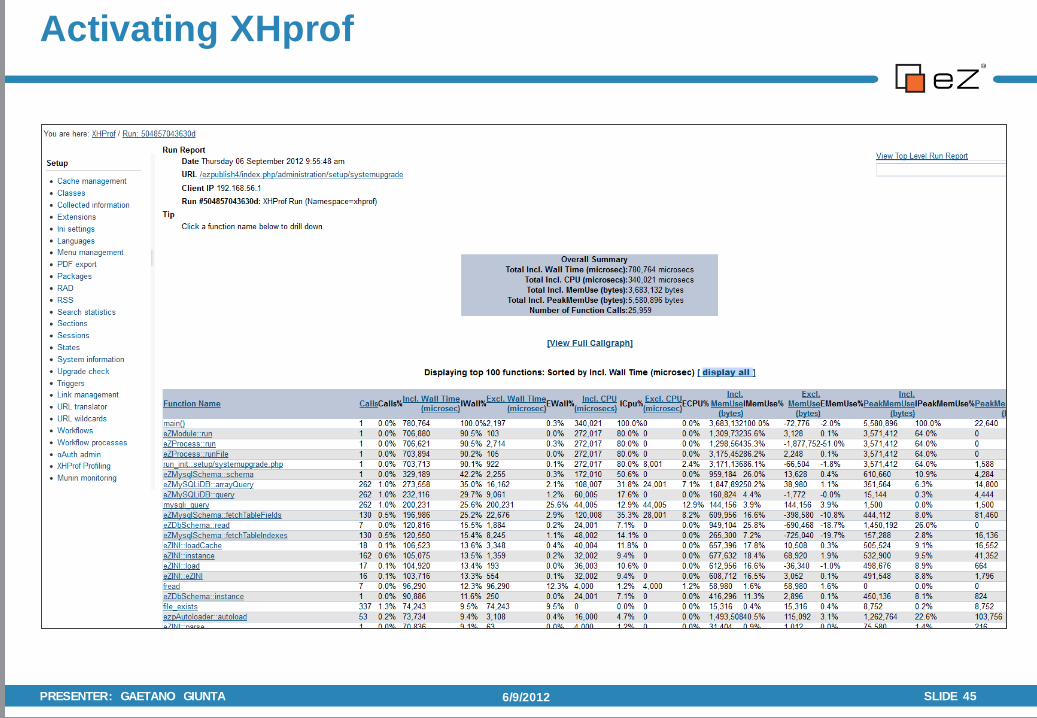
• Click on the name of a run to get profiling information in all its gory detail
Tips
• To avoid logging profiling of all pages, you can start it in any place in the code
• Links to profiling runs will be displayed in the debug output as well...
• ...but enabling debug output does have an impact on profiling
• A cronjob is available to periodically remove old profiling data
6/9/2012 PRESENTER: GAETANO GIUNTA SLIDE 43
Activating XHprof
6/9/2012 PRESENTER: GAETANO GIUNTA SLIDE 44
Activating XHprof
Activating XHprof
6/9/2012 PRESENTER: GAETANO GIUNTA SLIDE 45
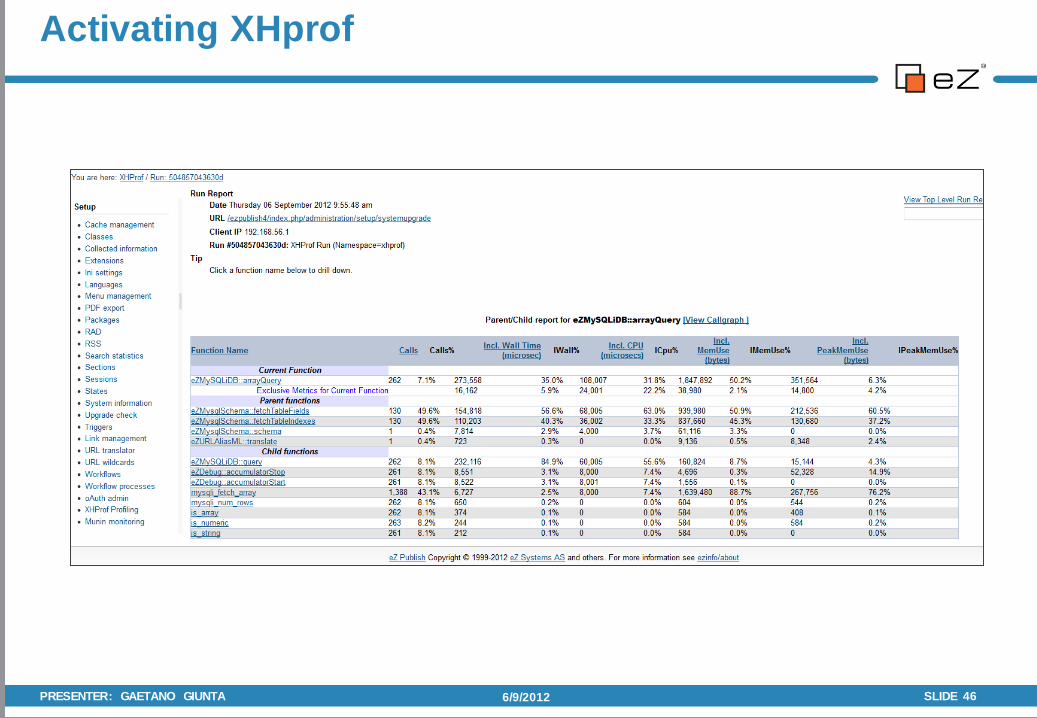
Activating XHprof
6/9/2012 PRESENTER: GAETANO GIUNTA SLIDE 46
Thanks for participating!
These slides https://dl.dropbox.com/u/520168/eZ%20Performance%20Measurement.pdf
Source code, command snippets https://gist.github.com/gggeek (look for gists numbered 1 to 9)
About me
Consultant for eZ Systems since 2007 [email protected]
@gggeek http://share.ez.no/blogs/gaetano-giunta
http://projects.ez.no/users/community/gaetano_giunta
With helpful support from Yannick Modah Gouez! ( [email protected] )
* = I hope you were not offended by jokes about developers and sysadmins.
I consider myself a devop: someone incarnating the worst aspects of both ;-)
6/9/2012 PRESENTER: GAETANO GIUNTA SLIDE 47
Questions?