Embed Size (px)
DESCRIPTION
This compendium is a collection of the most recent statistics and market data publicly available on the Internet, online ads marketing, e-commerce and related digital media. The report is a one-stop shop for Internet stats to help you quickly track down the latest data. The report draws inputs from our own internal database along with the other third party sources, credited throughout the document in the acknowledgements at the back of this guide. For the ease of use all numbers in this compendium are given in INR as well as in USD. If there is data that you feel is inaccurate or incorrectly presented then please get in touch with Vikram Bhardwaj, eStatsIndia.com: [email protected] or call at mobile: +91 9810474007. Likewise, if you would like to contribute data or any research then please feel free to contact us.
Citation preview
qwertyuiopasdfghjklzxcvbnmqwertyuiopasdfghjklzxcvbnmqwertyuiopasdfghjklzxcvbnmqwertyuiopasdfghjklzxcvbnmqwertyuiopasdfghjklzxcvbnmqwertyuiopasdfghjklzxcvbnmqwertyuiopasdfghjklzxcvbnmqwertyuiopasdfghjklzxcvbnmqwertyuiopasdfghjklzxcvbnmqwertyuiopasdfghjklzxcvbnmqwertyuiopasdfghjklzxcvbnmqwertyuiopasdfghjklzxcvbnmqwertyuiopasdfghjklzxcvbnmqwertyuiopasdfghjklzxcvbnmqwertyuiopasdfghjklzxcvbnmqwertyuiopasdfghjklzxcvbnmqwertyuiopasdfghjklzxcvbnmqwertyuiopasdfghjklzxcvbnmrtyuiopasdfghjklzxcvbnmqwertyuiopasdfghjklzxcvbnmqwertyuiopasdfghjklzxcvbnmqwertyuiopasdfghjklzxcvbnmqwertyuiopasdfghjklzxcvbnmqwertyuiopasdfghjklzxcvbnmqwertyuiopasdfghjkl
INDIA INTERNET STATISTICS COMPENDIUM 2010
Published
January 2011
www.eStatsIndia.com
India Internet Statistics Compendium 2010 2
Table of Contents
About this report ..................................................................................................................................... 2 About eStatsIndia.com ............................................................................................................................. 3 1. Internet Penetration ............................................................................................................................ 4
1.1. Total PC Installed Base at the End of Dec. 2010 .............................................................................. 4 1.2. Internet Penetration ...................................................................................................................... 4
Table1: Internet Adoption Landscape in India Dec. 2010 .................................................................. 4 1.3. Market Share of leading ISPs ......................................................................................................... 5
Table2: Internet Subscriber Base & Market share of top 10 ISPs end of June 2010 ............................ 5 2. Mobile Subscribers ............................................................................................................................... 6
2.1. All-India Wire line market share of major operators end of June 2010 ........................................... 6 Table3: All India Wire line market share and subscriber of major operators ..................................... 6
2.2. All-India Wireless market share of major operators end of June 2010 ............................................ 6 Table4: All India Wireless market share and subscriber of major operators ...................................... 6
3. Trends in Teledensity 2008-10 .............................................................................................................. 7 3.1. Urban Tele density ........................................................................................................................ 7 3.2. Rural Tele density .......................................................................................................................... 7
4. ARPU .................................................................................................................................................... 8 Table5: Average Revenue per User (ARPU) and Minutes of Usage (MOU) QE Jun-10 ............................. 8
Table6: Blended ARPU GSM Prepaid and Postpaid (`per month) QE Jun-10 ........................................... 8 Table7: Blended ARPU CDMA Prepaid and Postpaid (‘ per month) QE Jun-10 ........................................ 9
5. Mobile VAS ........................................................................................................................................ 10 5.1. Break-ups of revenue sharing among Mobile VAS operators ........................................................ 10 5.2. Market Revenue 2010 ................................................................................................................. 10 5.3. Rate of Growth 2010 ................................................................................................................... 10 5.4. Break-ups of Mobile Value Added Services .................................................................................. 10
Table8: Mobile VAS Revenue Contribution in India-By Services 2010 .............................................. 10 5.5. Mobile Services Revenue Market Growth Rates ........................................................................... 10
Table9: Mobile Services Revenue Market Growth Rates 2009-2013 ............................................... 10 6. India’s Top 10 Telecom Operators ...................................................................................................... 11
Table10: Access Services-Service Provider wise Gross Revenue (in Cr.) As on June 2010...................... 11 7. Online Gaming Market ....................................................................................................................... 12
7.1. Subscription Revenue 2010 ......................................................................................................... 12 7.2. Market Size Gaming Market 2010 ................................................................................................ 12 7.3. Online Gaming Market Sizing in India (Revenue Terms) 2009-2013 .............................................. 12
Table11: Revenue from Online Gaming is set to grow 2009-2013 Outlook ...................................... 12 (In Rs. Crore) ................................................................................................................................. 12
8. Online Ads Market for the Fiscal 2009-10 ........................................................................................... 13 8.1. Online Ads Market Spend Patterns 2010 ...................................................................................... 13
Table12: Indian Advertising Industry 2009-2013 Outlook ............................................................... 13 9. E-Commerce Market .......................................................................................................................... 14
9.1. Total B2C Retail E-commerce Market Size FY2010 in Revenue Terms ........................................... 14 9.2. Total B2B E-commerce Market Size (in terms of transaction volumes) by the end of Dec. 2010 .... 14
10. VoIP in India ..................................................................................................................................... 15 10.1. VoIP Market Segments .............................................................................................................. 15
11. Acknowledgements .......................................................................................................................... 16
About this report
India Internet Statistics Compendium 2010 3
This compendium is a collection of the most recent statistics and market data publicly available on the Internet, online ads marketing, e-commerce and related digital media. The report is a one-stop shop for Internet stats to help you quickly track down the latest data. The report draws inputs from our own internal database along with the other third party sources, credited throughout the document in the acknowledgements at the back of this guide. For the ease of use all numbers in this compendium are given in INR as well as in USD. If there is data that you feel is inaccurate or incorrectly presented then please get in touch with Vikram Bhardwaj, eStatsIndia.com: [email protected] or call at mobile: +91 9810474007. Likewise, if you would like to contribute data or any research then please feel free to contact us.
About eStatsIndia.com EStatsIndia.com is India‟s leading online publisher of Internet industry reports, provides search based services and also consults clients on various aspects of Internet. We are based out of New Delhi, India. We are a competent research team of research professionals who comes from varied industries like IT research and consulting, media, IT, Internet Infrastructure consulting. With an average industry experience base of more than 5 years our aim is to provide the best Internet research, consulting solutions and SADS (Search, Aggregate and Distribution Services) services to our clients. To know more about us, please visit us at: http://www.estatsindia.com/about.asp
India Internet Statistics Compendium 2010 4
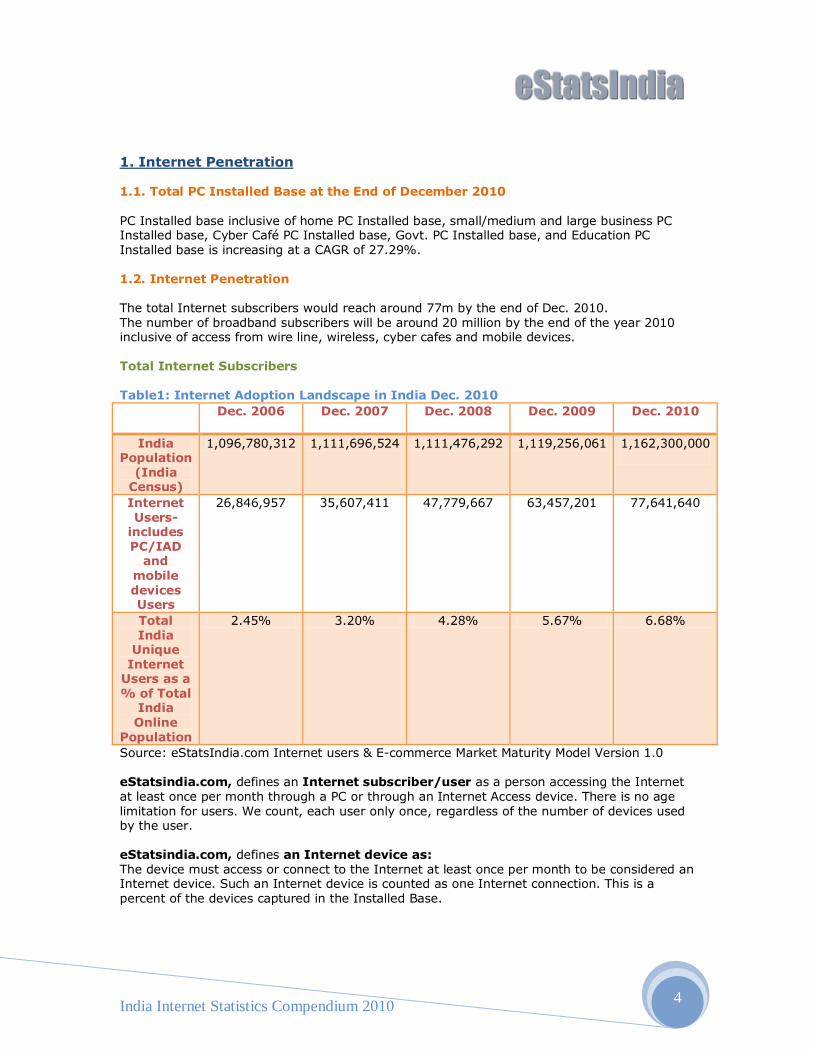
1. Internet Penetration 1.1. Total PC Installed Base at the End of December 2010 PC Installed base inclusive of home PC Installed base, small/medium and large business PC Installed base, Cyber Café PC Installed base, Govt. PC Installed base, and Education PC Installed base is increasing at a CAGR of 27.29%. 1.2. Internet Penetration The total Internet subscribers would reach around 77m by the end of Dec. 2010. The number of broadband subscribers will be around 20 million by the end of the year 2010 inclusive of access from wire line, wireless, cyber cafes and mobile devices. Total Internet Subscribers Table1: Internet Adoption Landscape in India Dec. 2010
Dec. 2006 Dec. 2007 Dec. 2008 Dec. 2009 Dec. 2010
India Population
(India Census)
1,096,780,312 1,111,696,524 1,111,476,292 1,119,256,061 1,162,300,000
Internet Users-
includes PC/IAD
and mobile devices Users
26,846,957 35,607,411 47,779,667 63,457,201 77,641,640
Total India
Unique Internet
Users as a % of Total
India Online
Population
2.45% 3.20% 4.28% 5.67% 6.68%
Source: eStatsIndia.com Internet users & E-commerce Market Maturity Model Version 1.0 eStatsindia.com, defines an Internet subscriber/user as a person accessing the Internet at least once per month through a PC or through an Internet Access device. There is no age limitation for users. We count, each user only once, regardless of the number of devices used by the user. eStatsindia.com, defines an Internet device as: The device must access or connect to the Internet at least once per month to be considered an Internet device. Such an Internet device is counted as one Internet connection. This is a percent of the devices captured in the Installed Base.
India Internet Statistics Compendium 2010 5
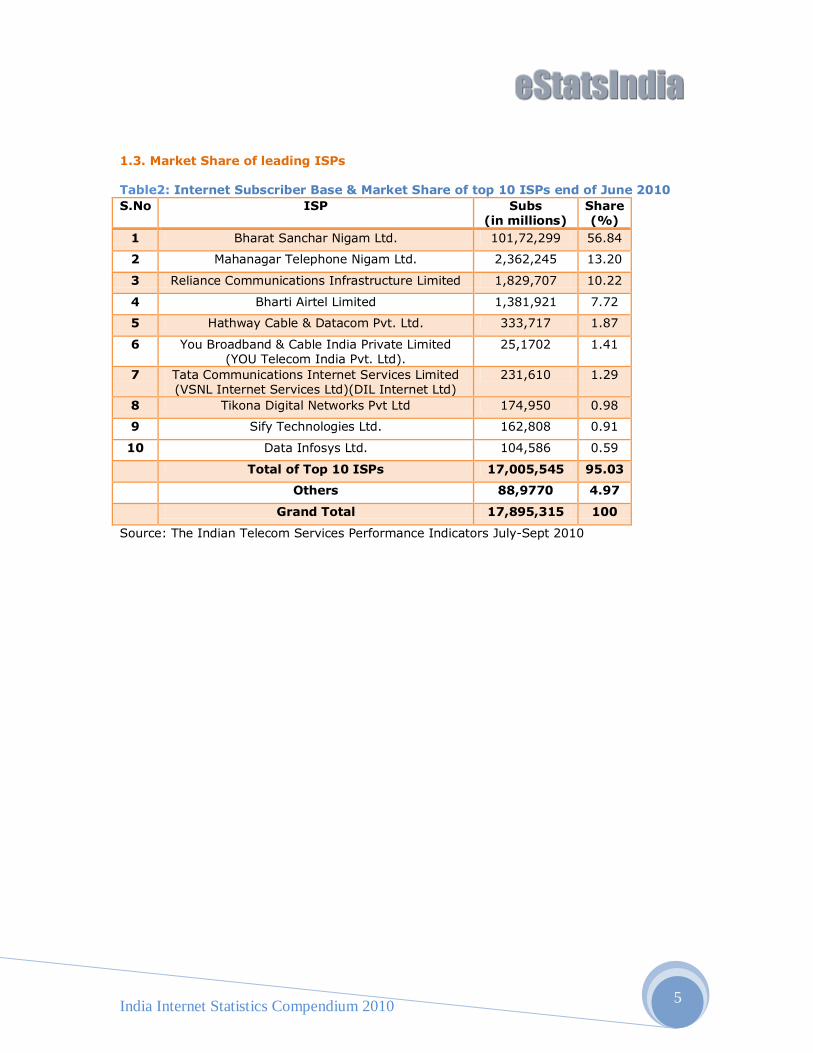
1.3. Market Share of leading ISPs Table2: Internet Subscriber Base & Market Share of top 10 ISPs end of June 2010
S.No ISP Subs (in millions)
Share (%)
1 Bharat Sanchar Nigam Ltd. 101,72,299 56.84
2 Mahanagar Telephone Nigam Ltd. 2,362,245 13.20
3 Reliance Communications Infrastructure Limited 1,829,707 10.22
4 Bharti Airtel Limited 1,381,921 7.72
5 Hathway Cable & Datacom Pvt. Ltd. 333,717 1.87
6 You Broadband & Cable India Private Limited (YOU Telecom India Pvt. Ltd).
25,1702 1.41
7 Tata Communications Internet Services Limited (VSNL Internet Services Ltd)(DIL Internet Ltd)
231,610 1.29
8 Tikona Digital Networks Pvt Ltd 174,950 0.98
9 Sify Technologies Ltd. 162,808 0.91
10 Data Infosys Ltd. 104,586 0.59
Total of Top 10 ISPs 17,005,545 95.03
Others 88,9770 4.97
Grand Total 17,895,315 100
Source: The Indian Telecom Services Performance Indicators July-Sept 2010
India Internet Statistics Compendium 2010 6
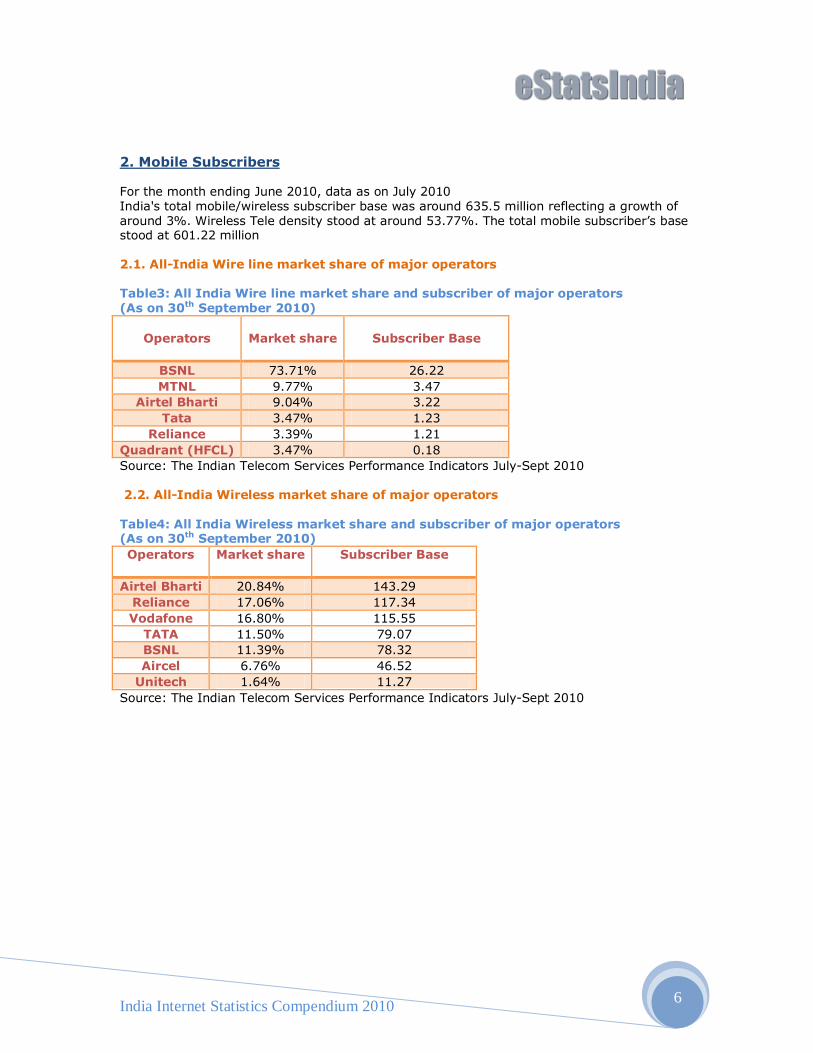
2. Mobile Subscribers For the month ending June 2010, data as on July 2010 India's total mobile/wireless subscriber base was around 635.5 million reflecting a growth of around 3%. Wireless Tele density stood at around 53.77%. The total mobile subscriber‟s base stood at 601.22 million 2.1. All-India Wire line market share of major operators Table3: All India Wire line market share and subscriber of major operators (As on 30th September 2010)
Operators
Market share Subscriber Base
BSNL 73.71% 26.22
MTNL 9.77% 3.47
Airtel Bharti 9.04% 3.22
Tata 3.47% 1.23
Reliance 3.39% 1.21
Quadrant (HFCL) 3.47% 0.18
Source: The Indian Telecom Services Performance Indicators July-Sept 2010 2.2. All-India Wireless market share of major operators Table4: All India Wireless market share and subscriber of major operators (As on 30th September 2010)
Operators
Market share Subscriber Base
Airtel Bharti 20.84% 143.29
Reliance 17.06% 117.34
Vodafone 16.80% 115.55
TATA 11.50% 79.07
BSNL 11.39% 78.32
Aircel 6.76% 46.52
Unitech 1.64% 11.27
Source: The Indian Telecom Services Performance Indicators July-Sept 2010
India Internet Statistics Compendium 2010 7
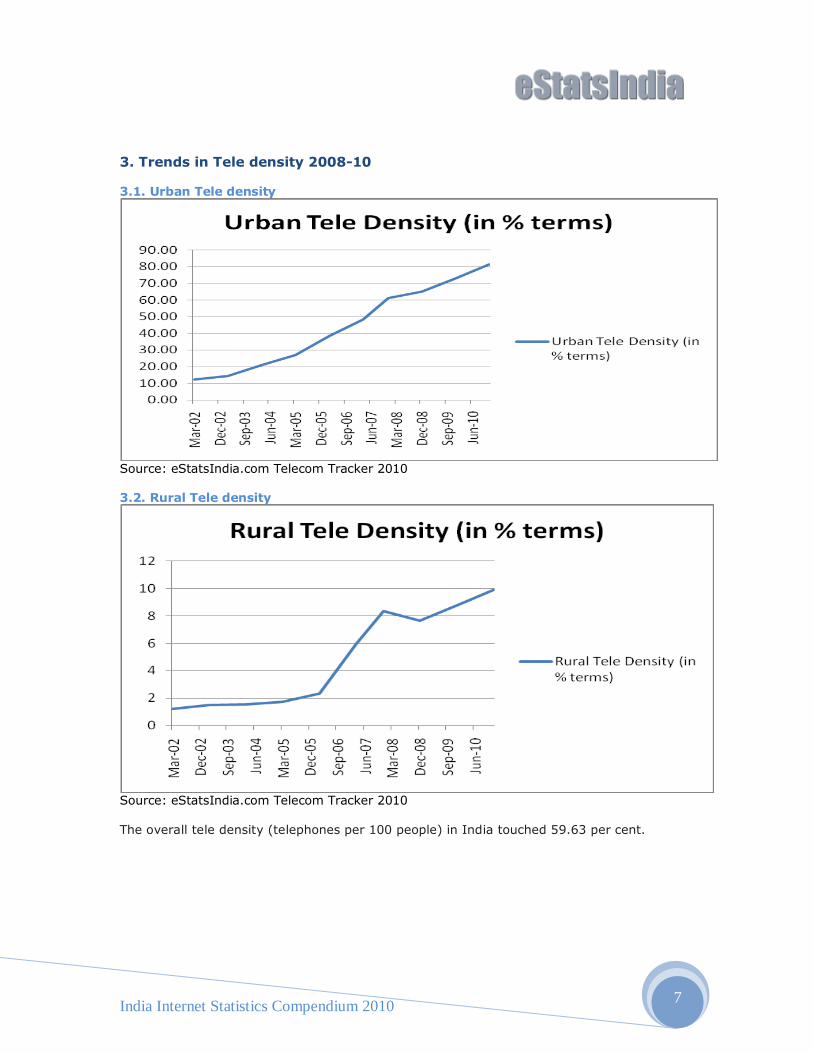
3. Trends in Tele density 2008-10 3.1. Urban Tele density
Source: eStatsIndia.com Telecom Tracker 2010 3.2. Rural Tele density
Source: eStatsIndia.com Telecom Tracker 2010 The overall tele density (telephones per 100 people) in India touched 59.63 per cent.
India Internet Statistics Compendium 2010 8
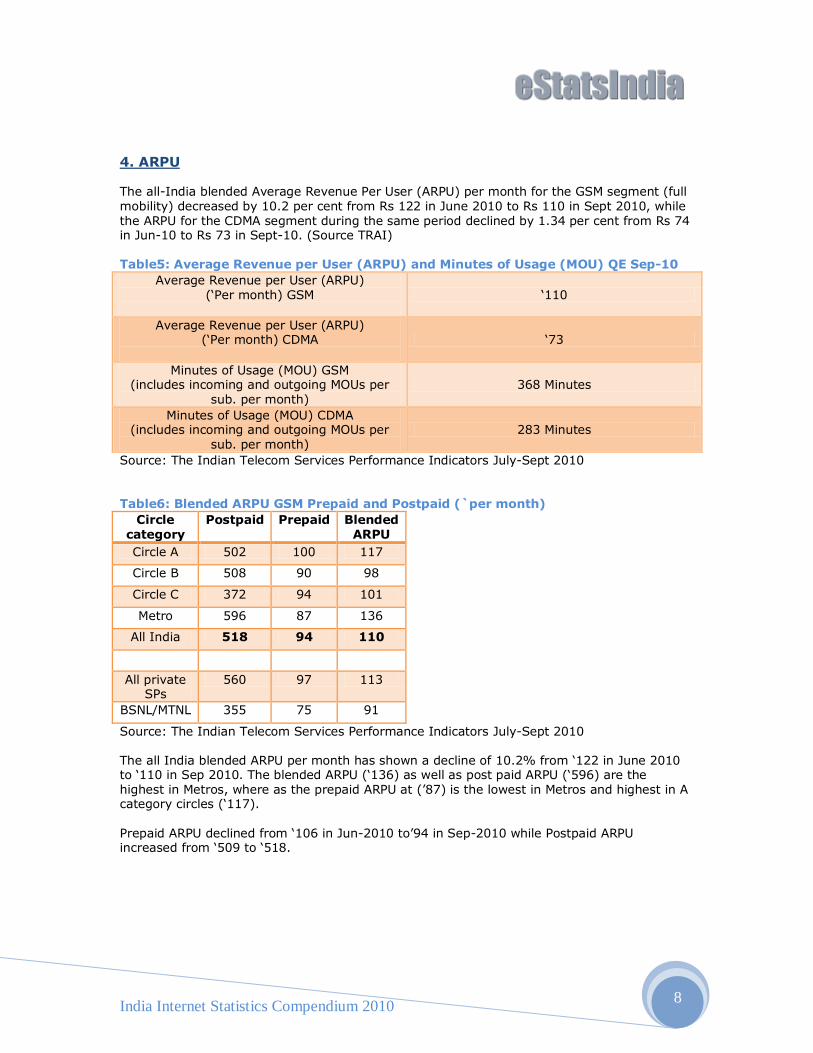
4. ARPU The all-India blended Average Revenue Per User (ARPU) per month for the GSM segment (full mobility) decreased by 10.2 per cent from Rs 122 in June 2010 to Rs 110 in Sept 2010, while the ARPU for the CDMA segment during the same period declined by 1.34 per cent from Rs 74 in Jun-10 to Rs 73 in Sept-10. (Source TRAI) Table5: Average Revenue per User (ARPU) and Minutes of Usage (MOU) QE Sep-10
Average Revenue per User (ARPU) („Per month) GSM
„110
Average Revenue per User (ARPU) („Per month) CDMA
„73
Minutes of Usage (MOU) GSM (includes incoming and outgoing MOUs per
sub. per month) 368 Minutes
Minutes of Usage (MOU) CDMA (includes incoming and outgoing MOUs per
sub. per month) 283 Minutes
Source: The Indian Telecom Services Performance Indicators July-Sept 2010 Table6: Blended ARPU GSM Prepaid and Postpaid (`per month)
Circle category
Postpaid Prepaid Blended ARPU
Circle A 502 100 117
Circle B 508 90 98
Circle C 372 94 101
Metro 596 87 136
All India 518 94 110
All private SPs
560 97 113
BSNL/MTNL 355 75 91
Source: The Indian Telecom Services Performance Indicators July-Sept 2010 The all India blended ARPU per month has shown a decline of 10.2% from „122 in June 2010 to „110 in Sep 2010. The blended ARPU („136) as well as post paid ARPU („596) are the highest in Metros, where as the prepaid ARPU at (‟87) is the lowest in Metros and highest in A category circles („117). Prepaid ARPU declined from „106 in Jun-2010 to‟94 in Sep-2010 while Postpaid ARPU increased from „509 to „518.
India Internet Statistics Compendium 2010 9
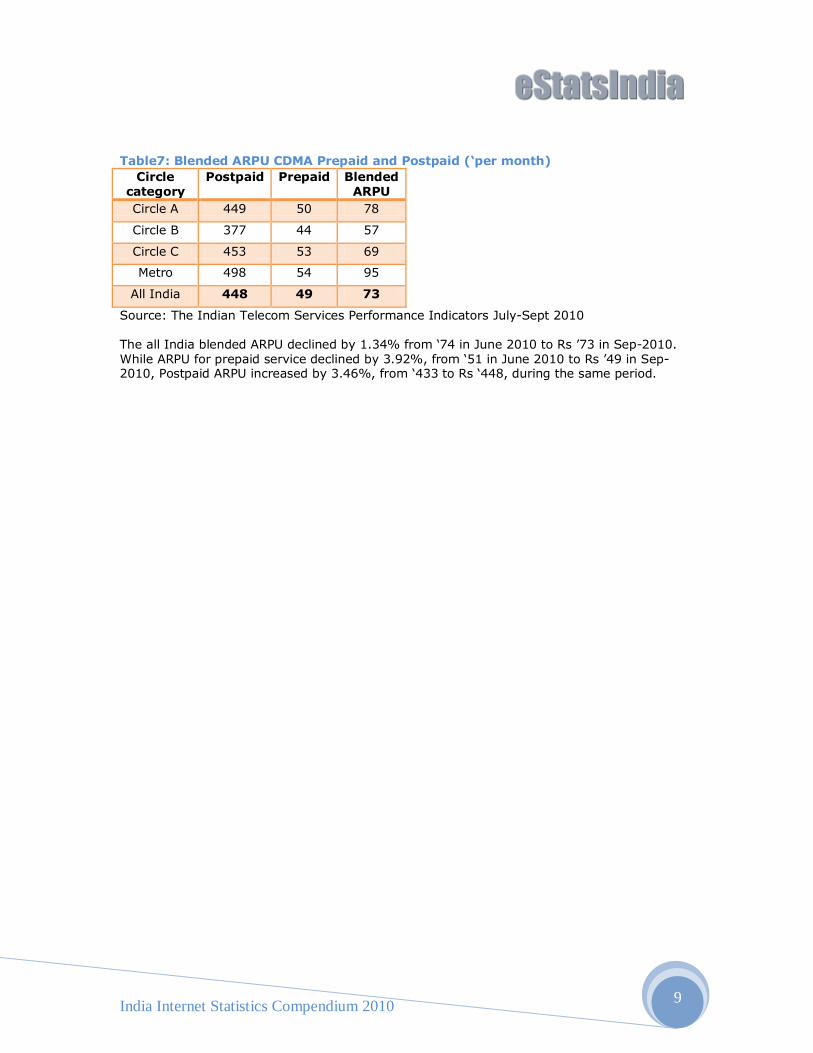
Table7: Blended ARPU CDMA Prepaid and Postpaid (‘per month)
Circle category
Postpaid Prepaid Blended ARPU
Circle A 449 50 78
Circle B 377 44 57
Circle C 453 53 69
Metro 498 54 95
All India 448 49 73
Source: The Indian Telecom Services Performance Indicators July-Sept 2010 The all India blended ARPU declined by 1.34% from „74 in June 2010 to Rs ‟73 in Sep-2010. While ARPU for prepaid service declined by 3.92%, from „51 in June 2010 to Rs ‟49 in Sep-2010, Postpaid ARPU increased by 3.46%, from „433 to Rs „448, during the same period.
India Internet Statistics Compendium 2010 10
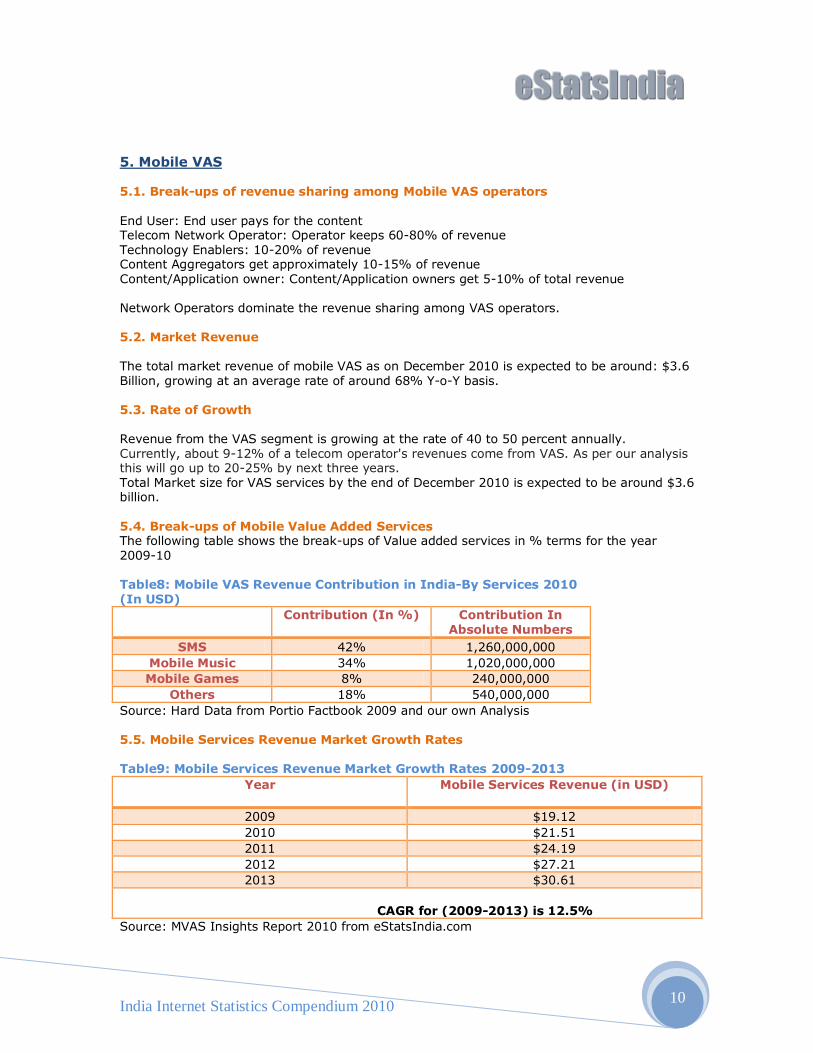
5. Mobile VAS 5.1. Break-ups of revenue sharing among Mobile VAS operators End User: End user pays for the content Telecom Network Operator: Operator keeps 60-80% of revenue Technology Enablers: 10-20% of revenue Content Aggregators get approximately 10-15% of revenue Content/Application owner: Content/Application owners get 5-10% of total revenue Network Operators dominate the revenue sharing among VAS operators. 5.2. Market Revenue The total market revenue of mobile VAS as on December 2010 is expected to be around: $3.6 Billion, growing at an average rate of around 68% Y-o-Y basis. 5.3. Rate of Growth Revenue from the VAS segment is growing at the rate of 40 to 50 percent annually. Currently, about 9-12% of a telecom operator's revenues come from VAS. As per our analysis this will go up to 20-25% by next three years. Total Market size for VAS services by the end of December 2010 is expected to be around $3.6 billion. 5.4. Break-ups of Mobile Value Added Services The following table shows the break-ups of Value added services in % terms for the year 2009-10 Table8: Mobile VAS Revenue Contribution in India-By Services 2010 (In USD)
Contribution (In %) Contribution In Absolute Numbers
SMS 42% 1,260,000,000
Mobile Music 34% 1,020,000,000
Mobile Games 8% 240,000,000
Others 18% 540,000,000
Source: Hard Data from Portio Factbook 2009 and our own Analysis 5.5. Mobile Services Revenue Market Growth Rates Table9: Mobile Services Revenue Market Growth Rates 2009-2013
Year
Mobile Services Revenue (in USD)
2009 $19.12
2010 $21.51
2011 $24.19
2012 $27.21
2013 $30.61
CAGR for (2009-2013) is 12.5%
Source: MVAS Insights Report 2010 from eStatsIndia.com
India Internet Statistics Compendium 2010 11
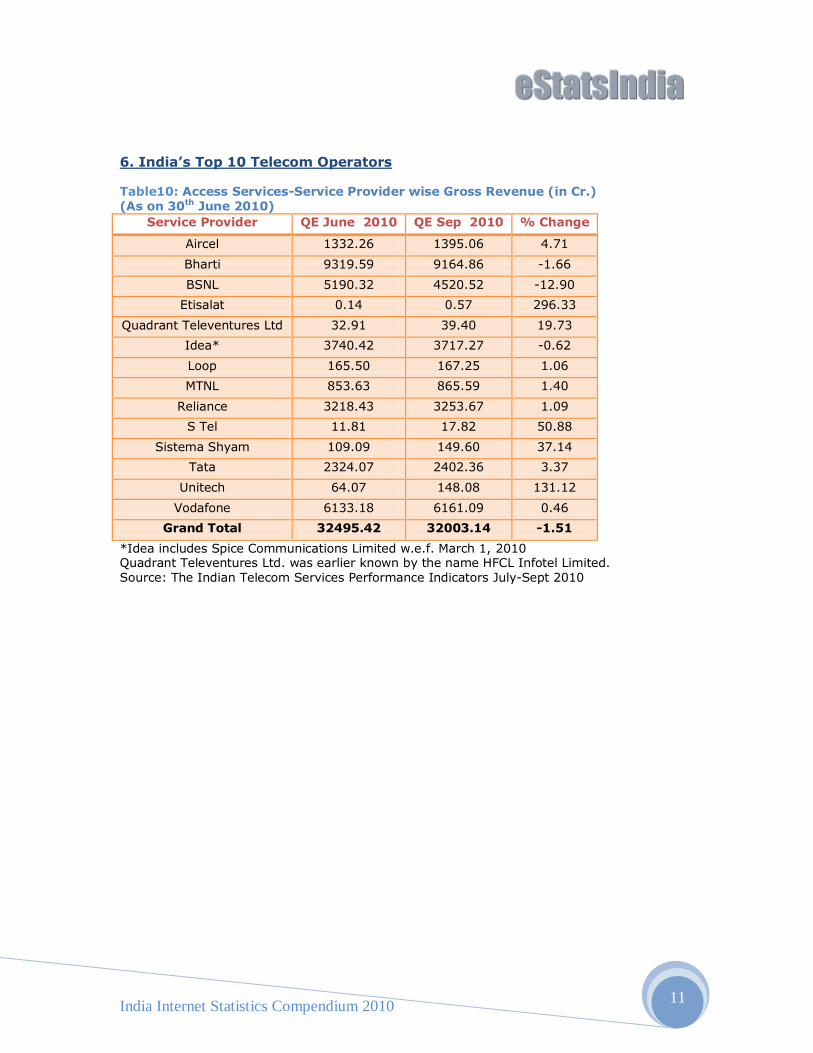
6. India’s Top 10 Telecom Operators Table10: Access Services-Service Provider wise Gross Revenue (in Cr.) (As on 30th June 2010)
Service Provider QE June 2010 QE Sep 2010 % Change
Aircel 1332.26 1395.06 4.71
Bharti 9319.59 9164.86 -1.66
BSNL 5190.32 4520.52 -12.90
Etisalat 0.14 0.57 296.33
Quadrant Televentures Ltd 32.91 39.40 19.73
Idea* 3740.42 3717.27 -0.62
Loop 165.50 167.25 1.06
MTNL 853.63 865.59 1.40
Reliance 3218.43 3253.67 1.09
S Tel 11.81 17.82 50.88
Sistema Shyam 109.09 149.60 37.14
Tata 2324.07 2402.36 3.37
Unitech 64.07 148.08 131.12
Vodafone 6133.18 6161.09 0.46
Grand Total 32495.42 32003.14 -1.51
*Idea includes Spice Communications Limited w.e.f. March 1, 2010 Quadrant Televentures Ltd. was earlier known by the name HFCL Infotel Limited. Source: The Indian Telecom Services Performance Indicators July-Sept 2010
India Internet Statistics Compendium 2010 12
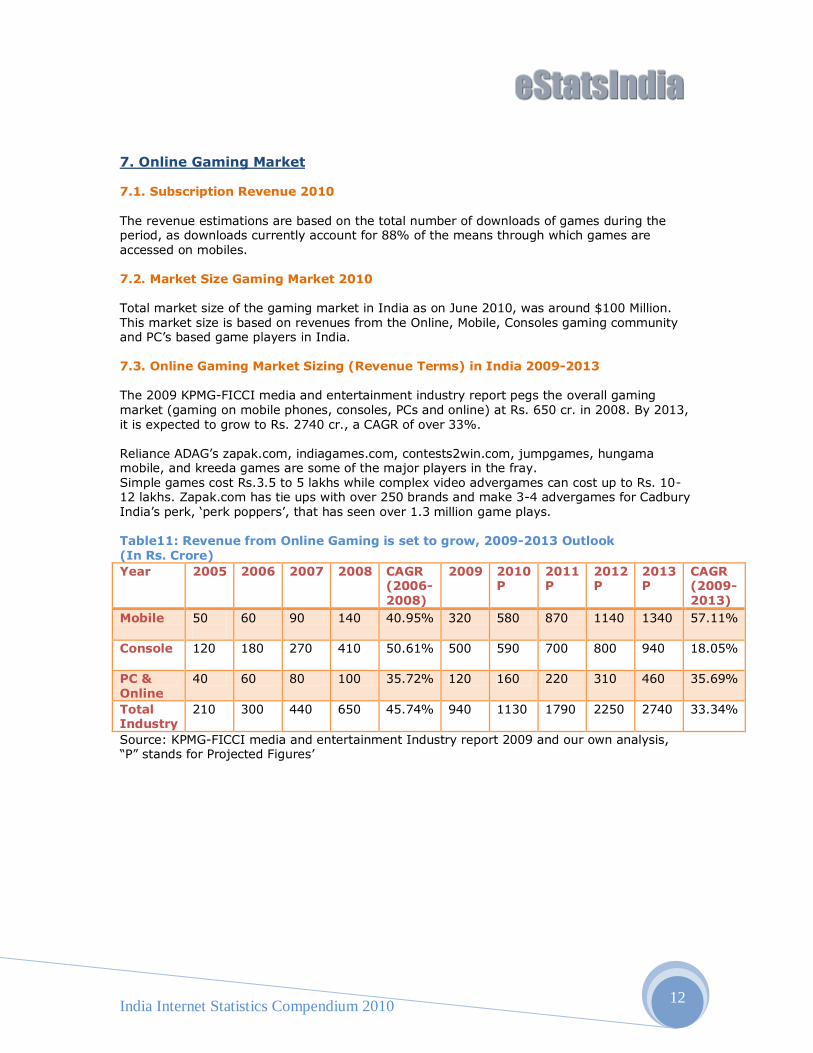
7. Online Gaming Market 7.1. Subscription Revenue 2010 The revenue estimations are based on the total number of downloads of games during the period, as downloads currently account for 88% of the means through which games are accessed on mobiles. 7.2. Market Size Gaming Market 2010 Total market size of the gaming market in India as on June 2010, was around $100 Million. This market size is based on revenues from the Online, Mobile, Consoles gaming community and PC‟s based game players in India. 7.3. Online Gaming Market Sizing (Revenue Terms) in India 2009-2013 The 2009 KPMG-FICCI media and entertainment industry report pegs the overall gaming market (gaming on mobile phones, consoles, PCs and online) at Rs. 650 cr. in 2008. By 2013, it is expected to grow to Rs. 2740 cr., a CAGR of over 33%. Reliance ADAG‟s zapak.com, indiagames.com, contests2win.com, jumpgames, hungama mobile, and kreeda games are some of the major players in the fray. Simple games cost Rs.3.5 to 5 lakhs while complex video advergames can cost up to Rs. 10-12 lakhs. Zapak.com has tie ups with over 250 brands and make 3-4 advergames for Cadbury India‟s perk, „perk poppers‟, that has seen over 1.3 million game plays. Table11: Revenue from Online Gaming is set to grow, 2009-2013 Outlook (In Rs. Crore)
Year 2005 2006 2007 2008 CAGR (2006-2008)
2009 2010 P
2011 P
2012 P
2013 P
CAGR (2009-2013)
Mobile 50
60 90 140 40.95% 320 580 870 1140 1340 57.11%
Console 120
180 270 410 50.61% 500 590 700 800 940 18.05%
PC & Online
40 60 80 100 35.72% 120 160 220 310 460 35.69%
Total Industry
210 300 440 650 45.74% 940 1130 1790 2250 2740 33.34%
Source: KPMG-FICCI media and entertainment Industry report 2009 and our own analysis, “P” stands for Projected Figures‟
India Internet Statistics Compendium 2010 13
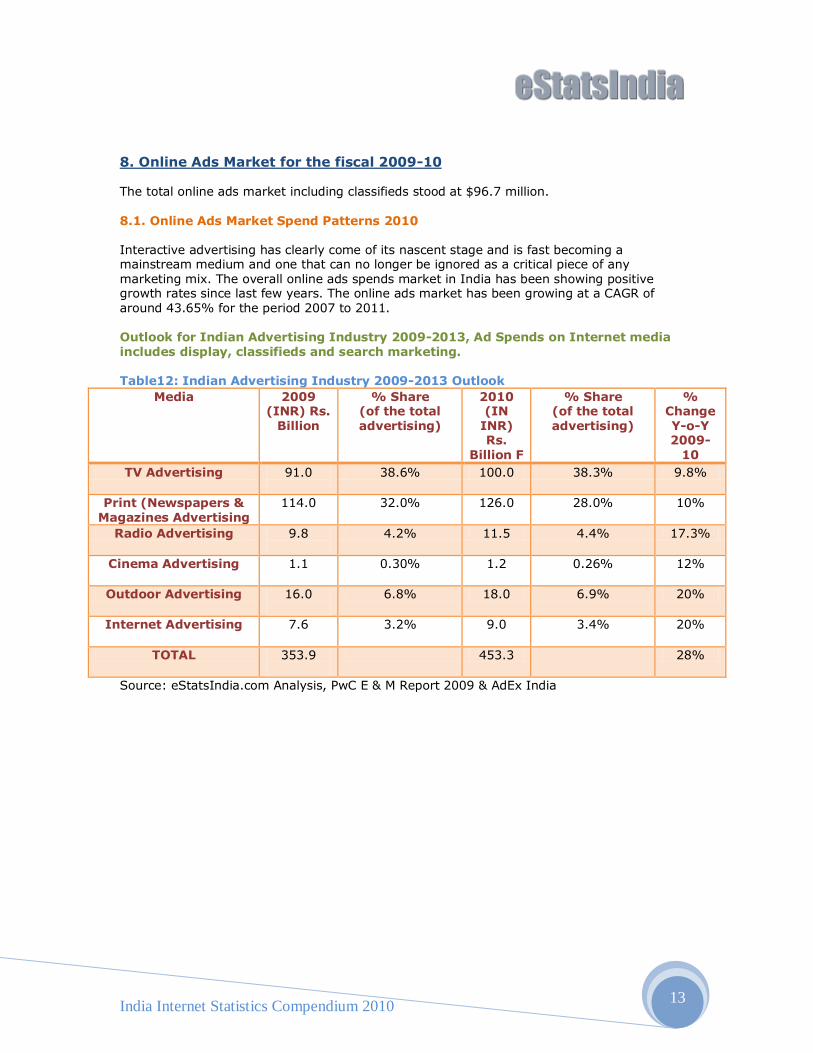
8. Online Ads Market for the fiscal 2009-10 The total online ads market including classifieds stood at $96.7 million. 8.1. Online Ads Market Spend Patterns 2010 Interactive advertising has clearly come of its nascent stage and is fast becoming a mainstream medium and one that can no longer be ignored as a critical piece of any marketing mix. The overall online ads spends market in India has been showing positive growth rates since last few years. The online ads market has been growing at a CAGR of around 43.65% for the period 2007 to 2011. Outlook for Indian Advertising Industry 2009-2013, Ad Spends on Internet media includes display, classifieds and search marketing. Table12: Indian Advertising Industry 2009-2013 Outlook
Source: eStatsIndia.com Analysis, PwC E & M Report 2009 & AdEx India
Media 2009 (INR) Rs.
Billion
% Share (of the total advertising)
2010 (IN
INR) Rs.
Billion F
% Share (of the total advertising)
% Change Y-o-Y 2009-
10
TV Advertising 91.0
38.6% 100.0 38.3% 9.8%
Print (Newspapers & Magazines Advertising
114.0 32.0% 126.0 28.0% 10%
Radio Advertising 9.8
4.2% 11.5 4.4% 17.3%
Cinema Advertising 1.1
0.30% 1.2 0.26% 12%
Outdoor Advertising 16.0
6.8% 18.0 6.9% 20%
Internet Advertising 7.6
3.2% 9.0 3.4% 20%
TOTAL 353.9
453.3 28%
India Internet Statistics Compendium 2010 14
9. E-Commerce Market 9.1. Total B2C Retail E-commerce Market Size FY2010 in Revenue Terms The overall B2C E-commerce market in India grew at a CAGR of 51.27% for the period 2004-2010. 9.2. Total B2B E-commerce Market Size (in terms of transaction volumes) by the end of Dec. 2010 At the current CAGR growth rate of around 34.07% since 2007 onwards, the B2B E-commerce market by the end of Dec 2010 would reach around $2,555 billion or $2.5 Trillion approximately in terms of transaction volumes. B2B E-Marketplaces (horizontal and verticals) constitutes around 40% share of the entire B2B E-commerce market. This translated to around $38,722,120,000, in terms of transaction volumes by the end of December 2009.
India Internet Statistics Compendium 2010 15
10. VoIP in India VoIP services had limited availability in the country in yesteryears, as a result of which the overall progress of the VoIP market in India was quite slow. Although the market as a whole has moved a long way forward since. 10.1. VoIP Market Segments Smaller businesses are already leveraging the benefits of voice traffic over managed IP networks, followed closely by consumers making voice calls over the public Internet. In India the VoIP market can be divided into the following three categories: India has got one of the lowest VoIP rates or tariffs in the world. VoIP Market Size 2009 The IP telephony market in India is likely to grow to Rs. 13,000 Crore or US $3.25 billion by 2009 the market is growing at a CAGR of 119 percent. The VoIP market will be around US $6 billion by the end of the year 2010. Internet Telephony Total Minutes of Usage (MOU) for Internet Telephony has increased from 122.96 million in QE March 2010 to 137.20 million in QE June 2010.
India Internet Statistics Compendium 2010 16
11. Acknowledgements eStatsIndia.com, would like to sincerely thank the following organizations for accessing their information, all the inputs were accessed from the public Internet only. Other information sources have also been used while compiling the Internet compendium. We acknowledge and at the same time thank all such private as well as government organizations for allowing us to aggregate data using their outputs. For all the calculations regarding numbers in the compendium we have used our proprietary Internet & E-commerce Market Model Version 1.0 along with other models. Few of the Information Sources Used: Financial Express Newspaper TRAI COAI AUSPI The Hindu: National Readership Study IDC India IT Research Report/News Briefings Ebusinessforum.com MAIT IT Industry Performance Annual Review Tele.net; May 2009 Voicendata.ciol.com; July 2010 India Infrastructure.com :( Key Statistics Sector Focus: Telecom) Few of the Links Used: http://www.coai.in, Monthly Bulletins http://www.cellular-news.com/story/19988.php http://www.ciol.com http://www.itnewsonline.com http://games.indiatimes.com/articleshow/1497818.cms http://www.kotaku.com/gaming/india/next-online-gaming-center-india-168116.php http://www.expresscomputeronline.com/20050905/market03.shtml http://www.telenity.com/articles/mobile_vas_market_to_touch_$5_billion_mark.php http://www.mobilepundit.com/category/vas/ http://www.blonnet.com/blnus/15081301.htm http://www.varindia.com/Mobility1.asp http://www.convergenceplus.com/jun03%20india%20telecom%2002.html http://www.contentsutra.com http://www.trai.gov.in/WriteReadData/trai/upload/PressReleases/767/August_Press_release.pdf http://www.trai.gov.in/WriteReadData/trai/upload/Reports/52/5octoblerindicatorreporton13oct.pdf Various Press briefs and clippings from DNA, HT, TOI, Hindu Business Line ___________________________________________________________________ If you feel any individual statistics have been inappropriately or inaccurately reproduced, or if you would like to comment and provide your feedback on this compendium, please contact Vikram Bhardwaj, email: [email protected], or call: +91-9810474007


![Compendium [G.Marciani] - Ingegneria di Internet](https://img.pdfslide.net/doc/110x75/577cc6f71a28aba7119fad7b/compendium-gmarciani-ingegneria-di-internet.jpg)