Embed Size (px)
Citation preview
Marcus Alexander, EPRI
Manager, Vehicle Systems Analysis
Net Zero Cities
October 23, 2013
Current and near-term emissions impacts of
plug-in electric vehicles
2© 2013 Electric Power Research Institute, Inc. All rights reserved.
• Background
• Recent emission trends
• Future potential
• Wrap-up
3© 2013 Electric Power Research Institute, Inc. All rights reserved.
• Background
• Recent emission trends
• Future potential
• Wrap-up
4© 2013 Electric Power Research Institute, Inc. All rights reserved.
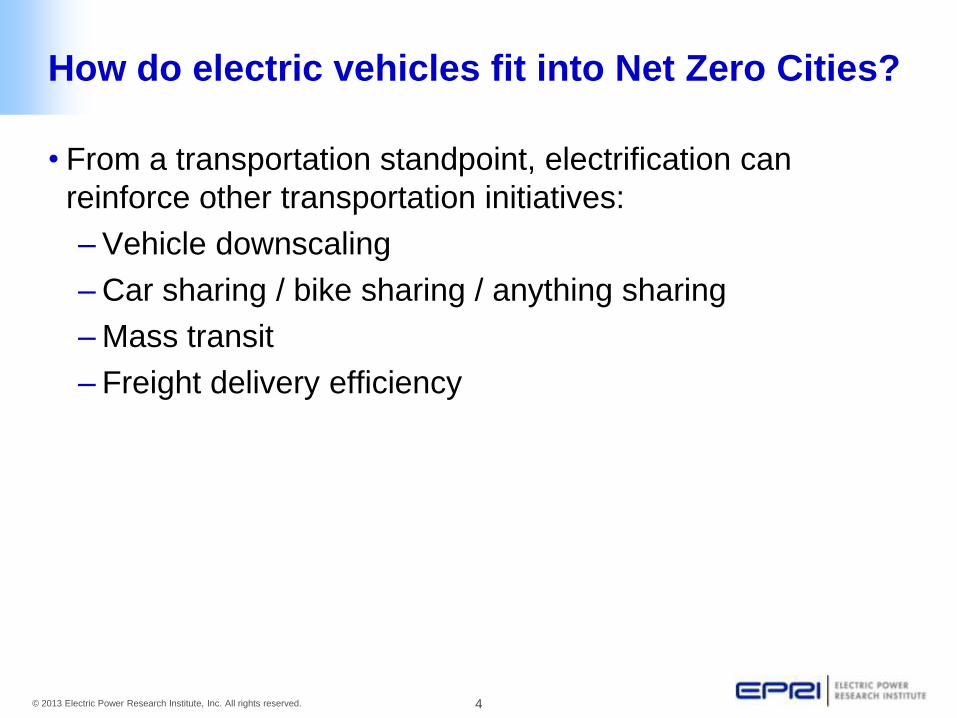
How do electric vehicles fit into Net Zero Cities?
• From a transportation standpoint, electrification can
reinforce other transportation initiatives:
– Vehicle downscaling
– Car sharing / bike sharing / anything sharing
– Mass transit
– Freight delivery efficiency
5© 2013 Electric Power Research Institute, Inc. All rights reserved.
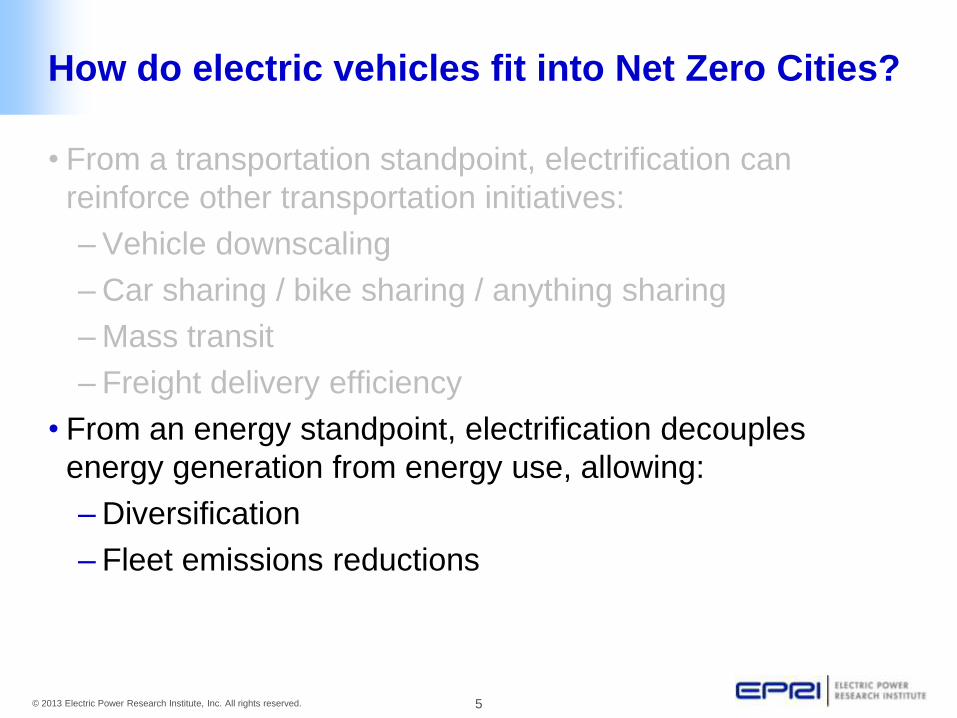
How do electric vehicles fit into Net Zero Cities?
• From a transportation standpoint, electrification can
reinforce other transportation initiatives:
– Vehicle downscaling
– Car sharing / bike sharing / anything sharing
– Mass transit
– Freight delivery efficiency
• From an energy standpoint, electrification decouples
energy generation from energy use, allowing:
– Diversification
– Fleet emissions reductions
6© 2013 Electric Power Research Institute, Inc. All rights reserved.
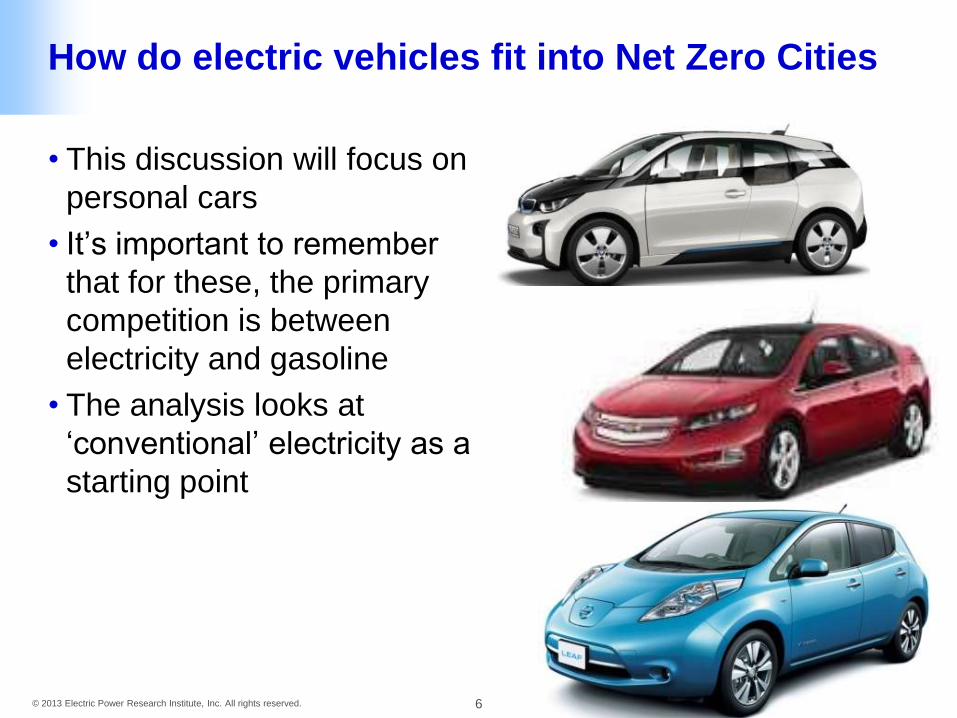
How do electric vehicles fit into Net Zero Cities
• This discussion will focus on
personal cars
• It’s important to remember
that for these, the primary
competition is between
electricity and gasoline
• The analysis looks at
‘conventional’ electricity as a
starting point
7© 2013 Electric Power Research Institute, Inc. All rights reserved.
• Background
• Recent emission trends
• Future potential
• Wrap-up
8© 2013 Electric Power Research Institute, Inc. All rights reserved.
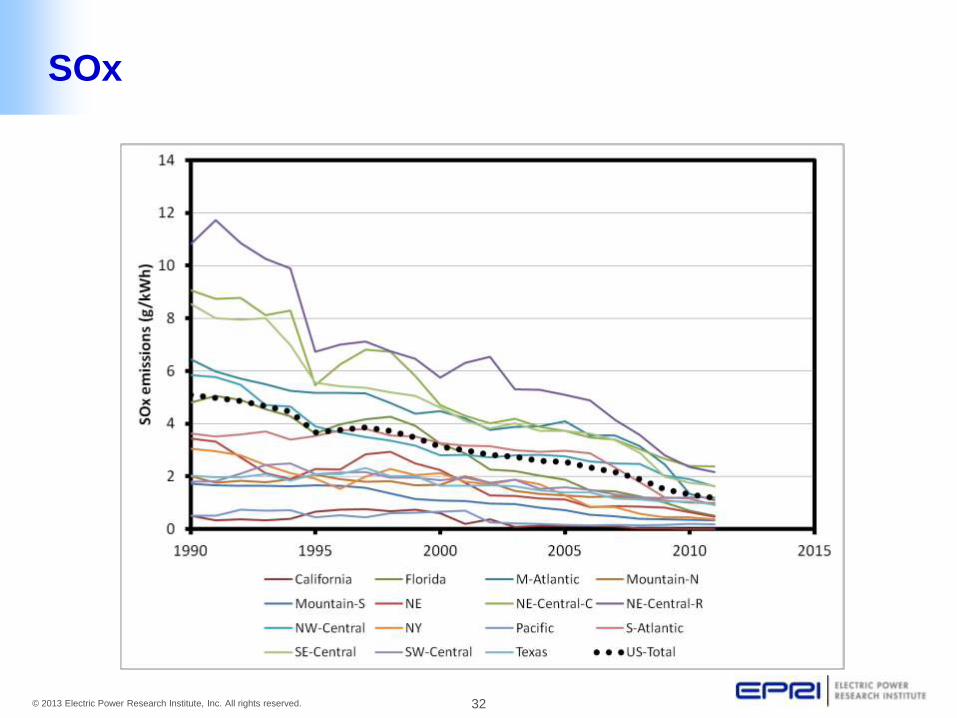
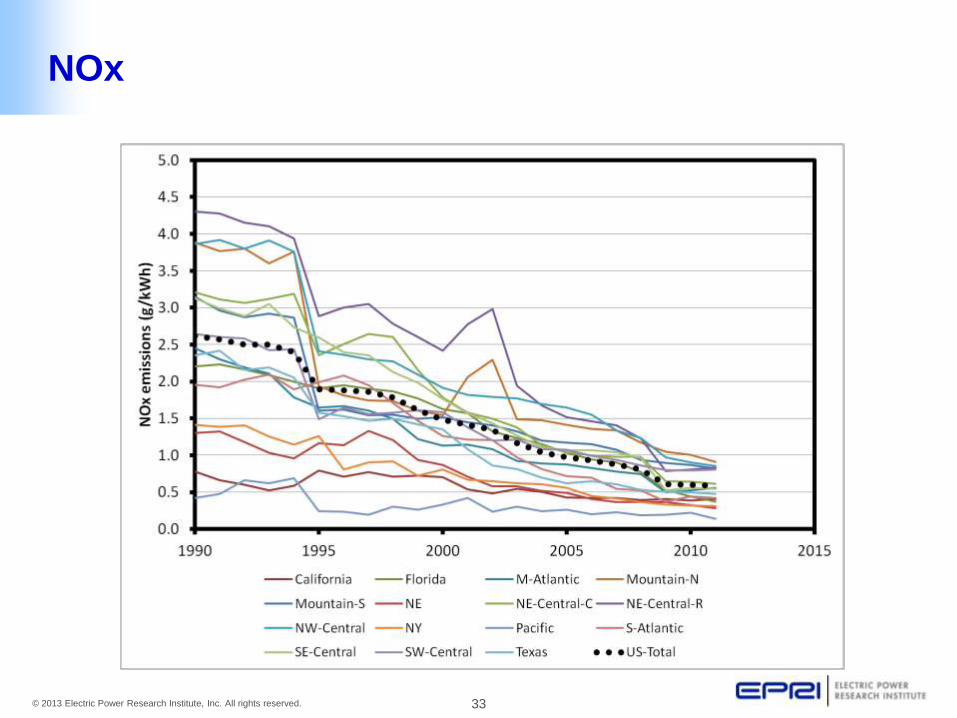
Recent emissions trends
• Grid emissions of criteria pollutants like NOx and SO2 have
decreased rapidly as regulations have tightened.
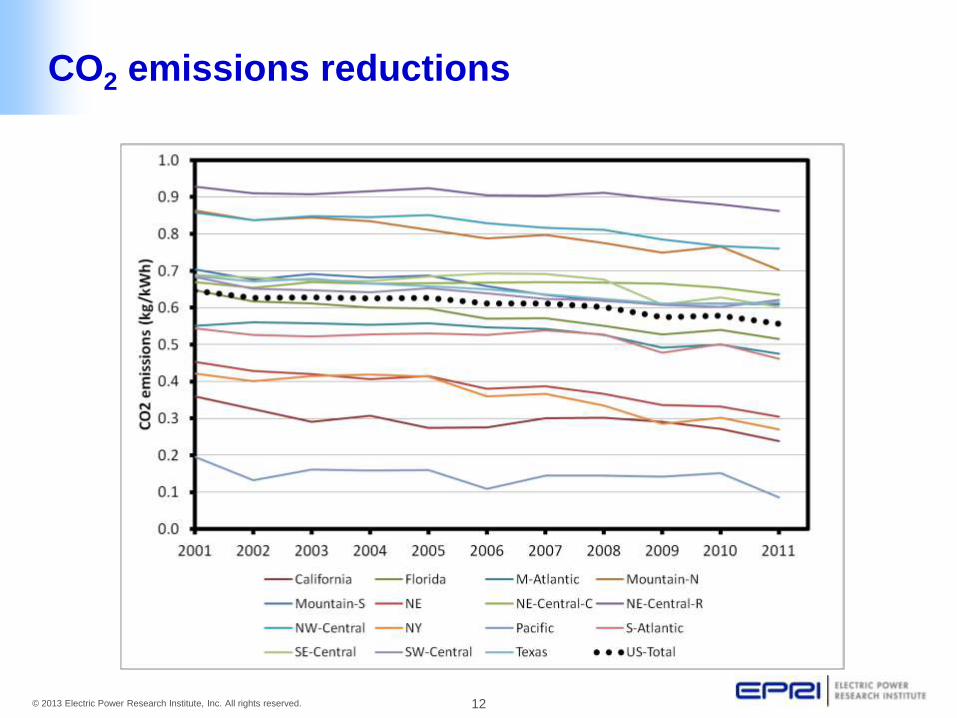
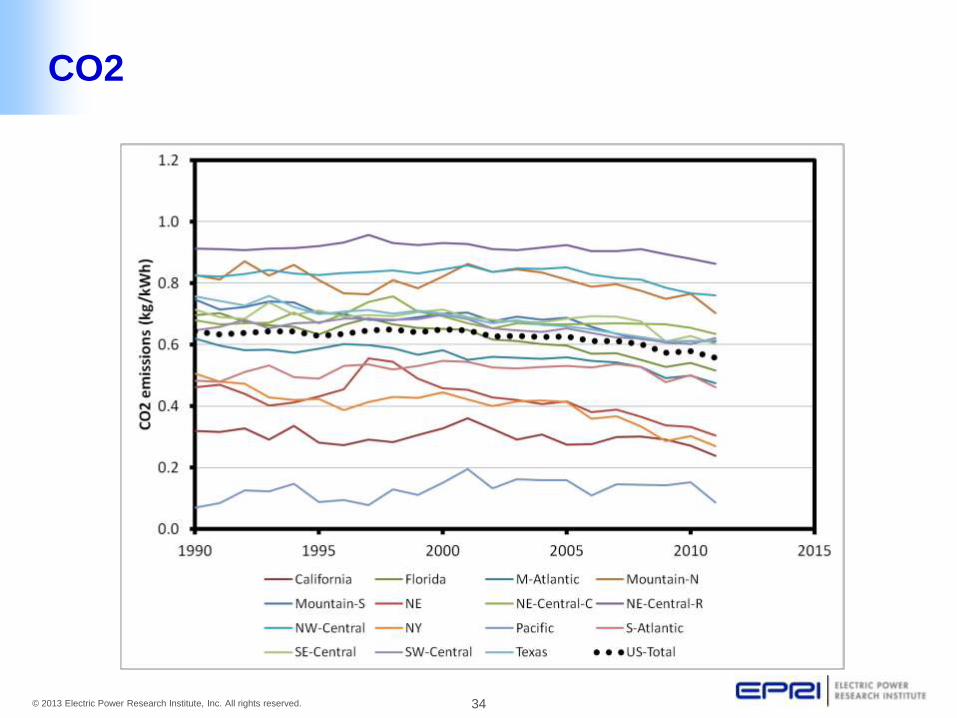
• Grid emissions of CO2 have decreased, but not as rapidly.
• It is unclear what will happen as explicit CO2 regulations
are implemented, but there is significant potential for
reductions.
9© 2013 Electric Power Research Institute, Inc. All rights reserved.
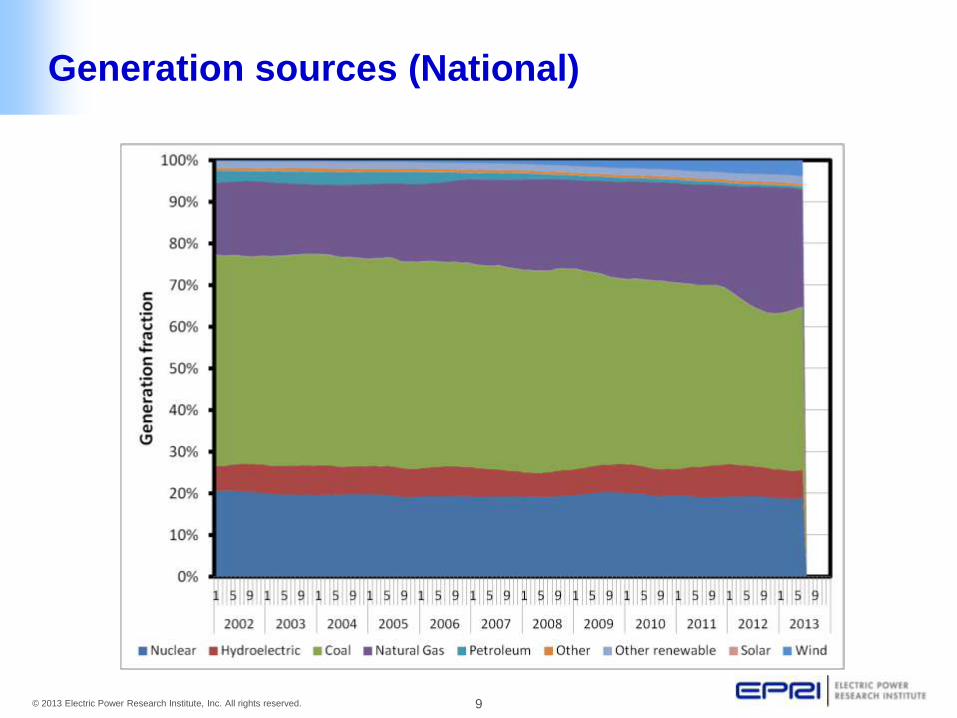
Generation sources (National)
10© 2013 Electric Power Research Institute, Inc. All rights reserved.
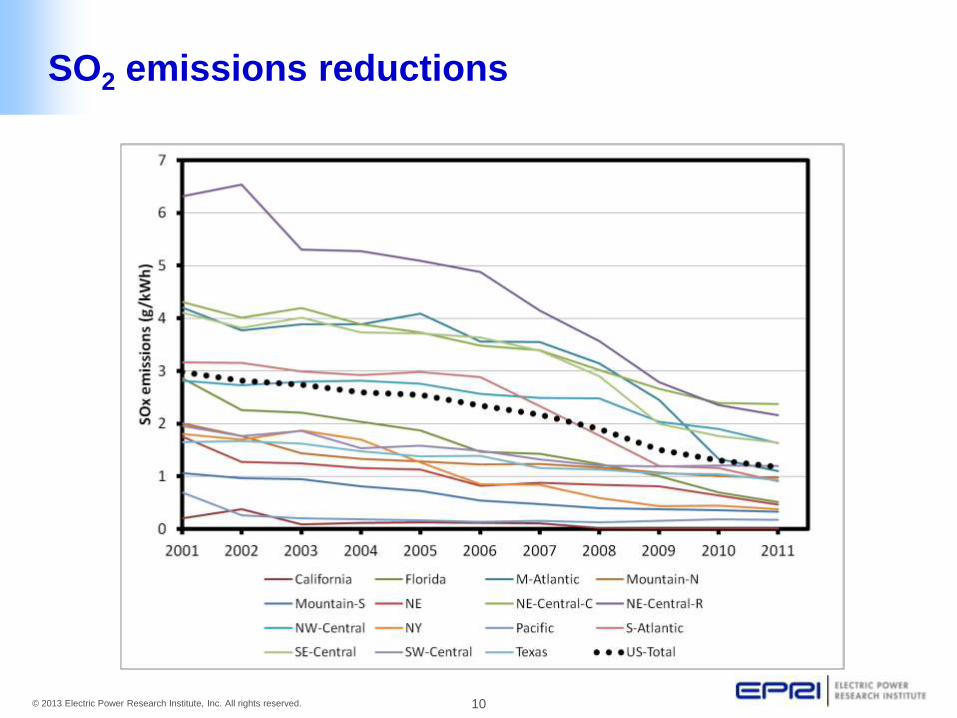
SO2 emissions reductions
11© 2013 Electric Power Research Institute, Inc. All rights reserved.
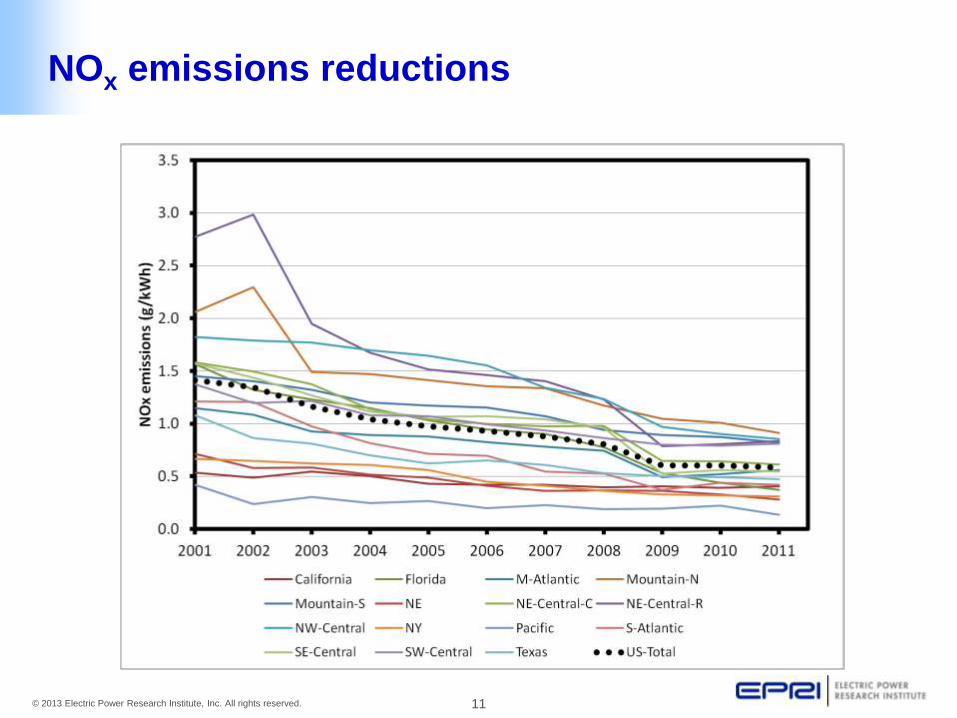
NOx emissions reductions
12© 2013 Electric Power Research Institute, Inc. All rights reserved.
CO2 emissions reductions
13© 2013 Electric Power Research Institute, Inc. All rights reserved.
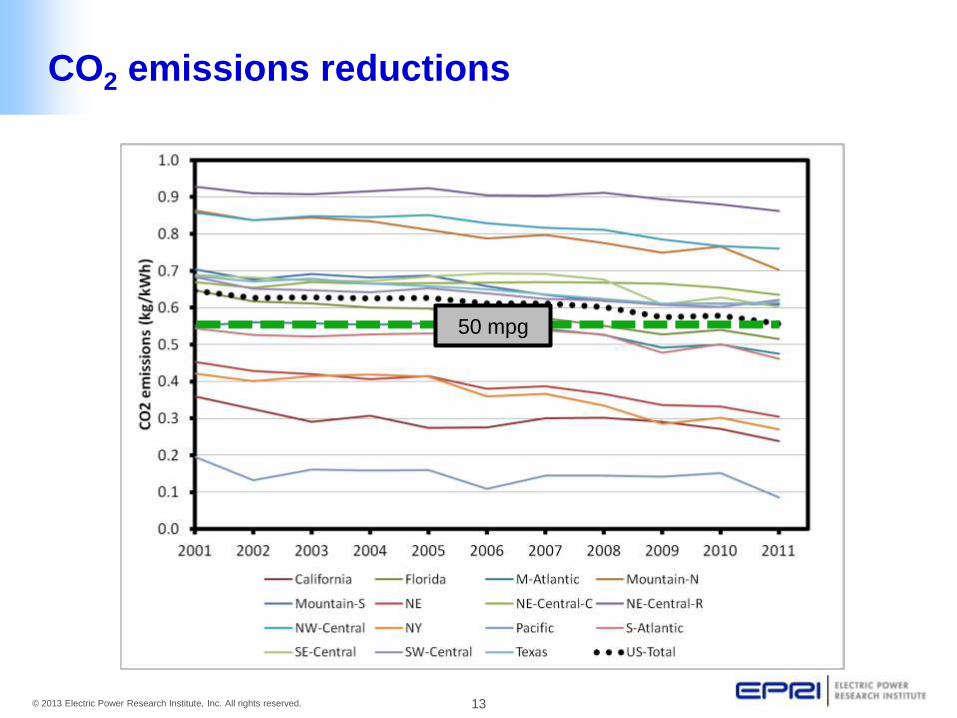
CO2 emissions reductions
50 mpg
14© 2013 Electric Power Research Institute, Inc. All rights reserved.
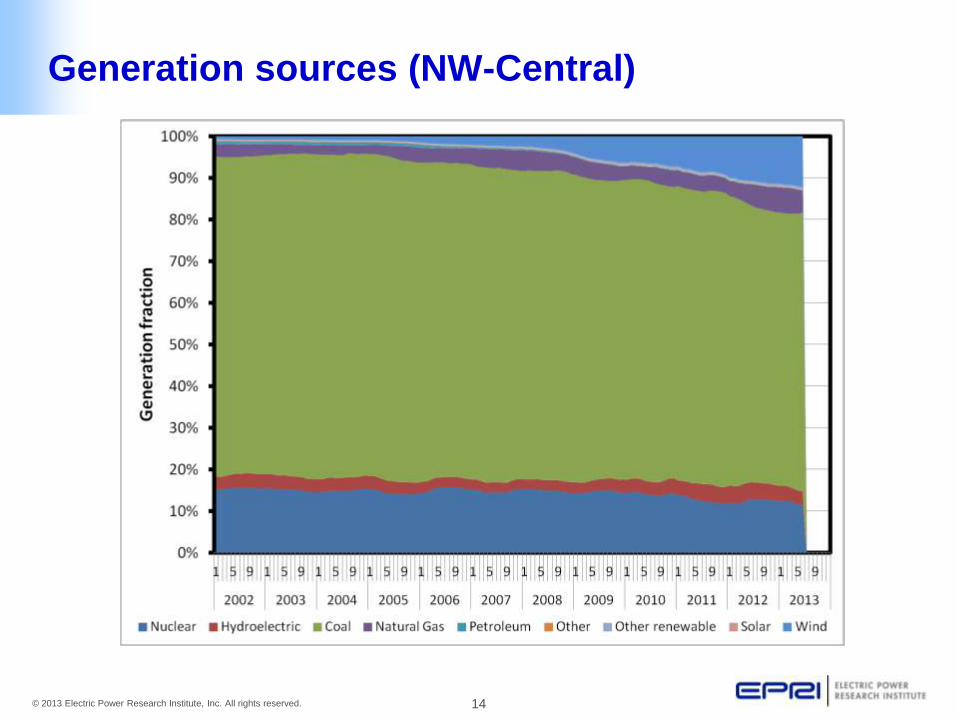
Generation sources (NW-Central)
15© 2013 Electric Power Research Institute, Inc. All rights reserved.
• Background
• Recent emission trends
• Future potential
• Wrap-up
16© 2013 Electric Power Research Institute, Inc. All rights reserved.
Future potential
• Current policy will significantly decrease NOx
emissions, SO2 emissions, and other emissions not
described above.
• CO2 emissions are expected to decrease under current
policy.
• There is the potential for significant CO2 reductions under
different policy scenarios.
17© 2013 Electric Power Research Institute, Inc. All rights reserved.
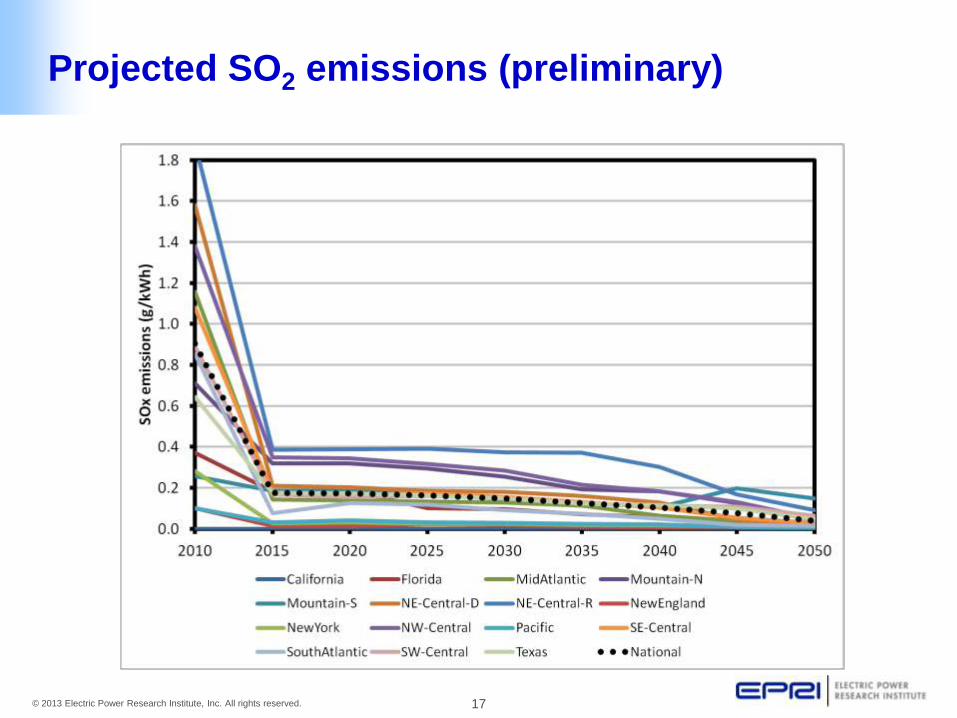
Projected SO2 emissions (preliminary)
18© 2013 Electric Power Research Institute, Inc. All rights reserved.
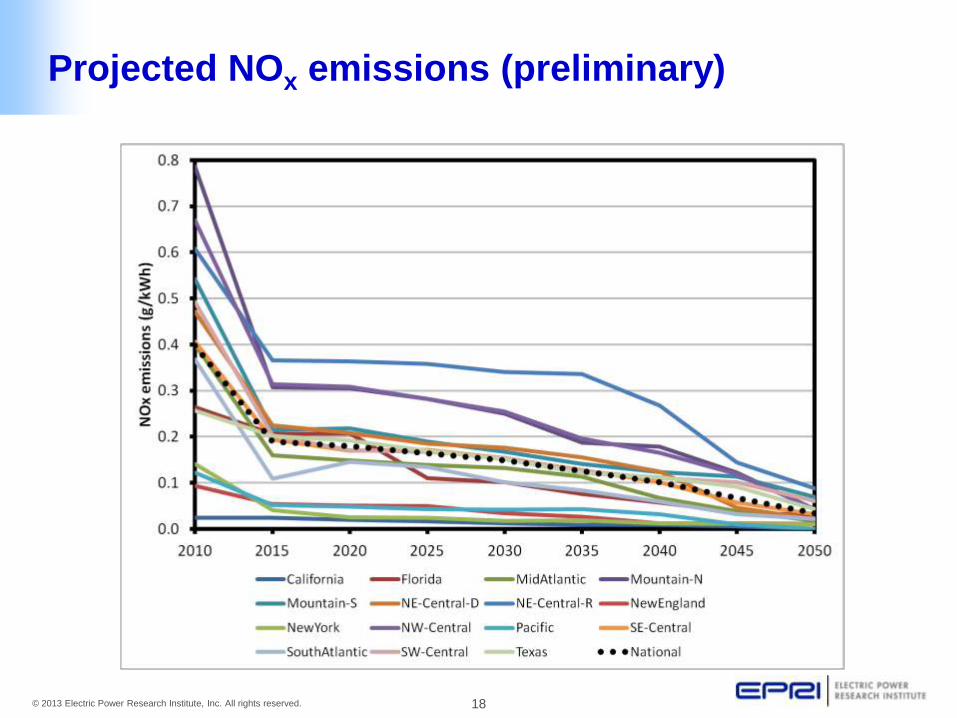
Projected NOx emissions (preliminary)
19© 2013 Electric Power Research Institute, Inc. All rights reserved.
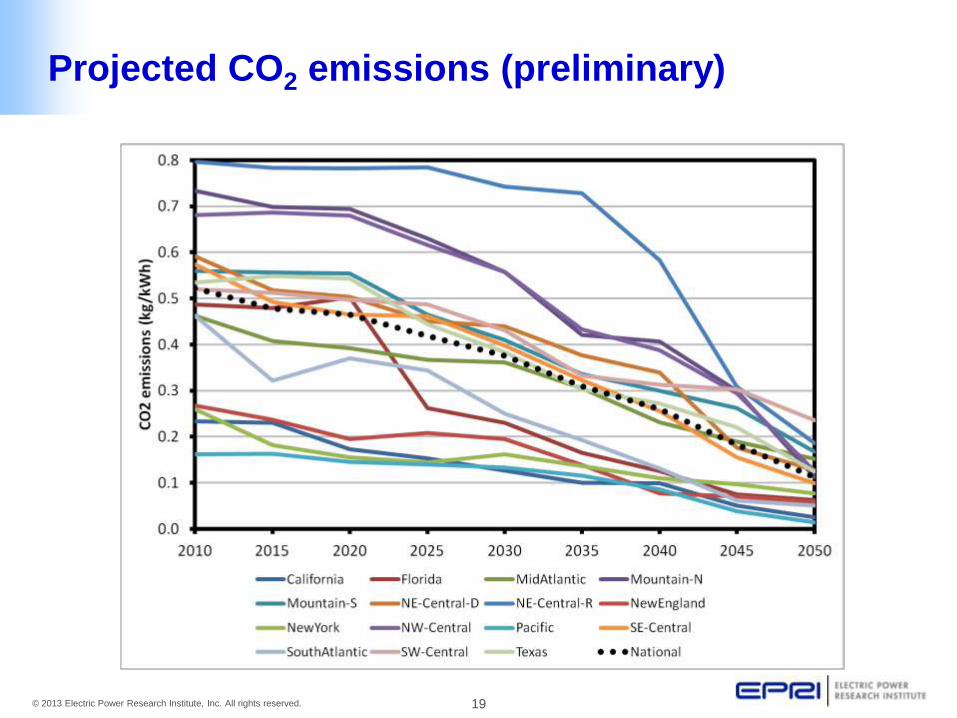
Projected CO2 emissions (preliminary)
20© 2013 Electric Power Research Institute, Inc. All rights reserved.
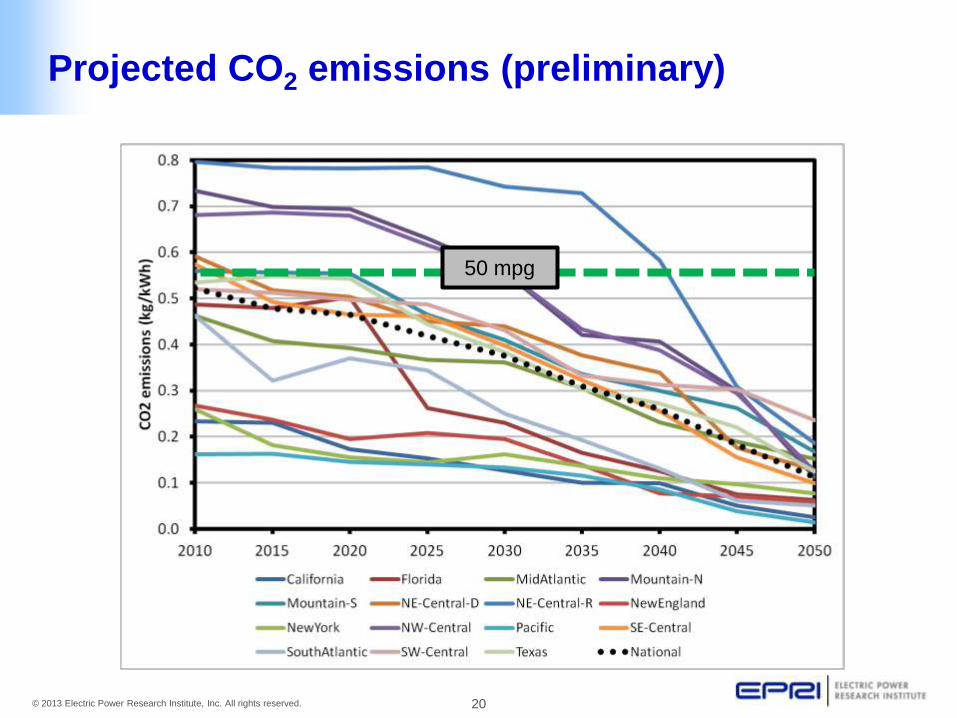
Projected CO2 emissions (preliminary)
50 mpg
21© 2013 Electric Power Research Institute, Inc. All rights reserved.
• Background
• Aggregation levels
• Recent emission trends
• Future potential
• Wrap-up
22© 2013 Electric Power Research Institute, Inc. All rights reserved.
Wrap-up
Marcus Alexander
23© 2013 Electric Power Research Institute, Inc. All rights reserved.
Backup: Non-road applications
24© 2013 Electric Power Research Institute, Inc. All rights reserved.
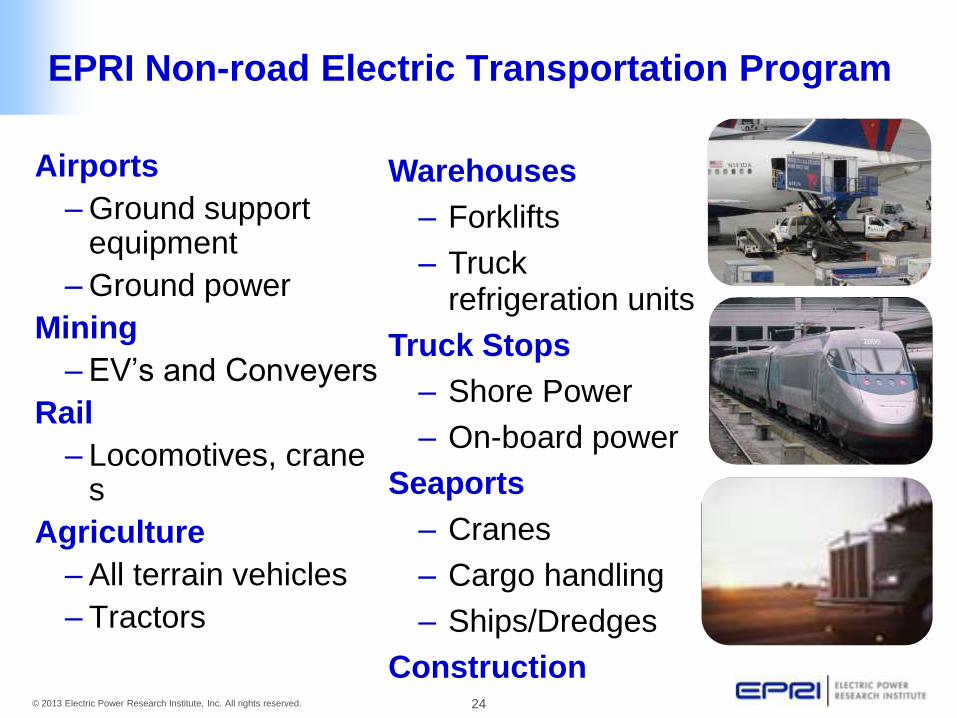
EPRI Non-road Electric Transportation Program
Airports
– Ground support equipment
– Ground power
Mining
– EV’s and Conveyers
Rail
– Locomotives, cranes
Agriculture
– All terrain vehicles
– Tractors
Warehouses
– Forklifts
– Truck refrigeration units
Truck Stops
– Shore Power
– On-board power
Seaports
– Cranes
– Cargo handling
– Ships/Dredges
Construction
25© 2013 Electric Power Research Institute, Inc. All rights reserved.
Backup: Aggregation levels
26© 2013 Electric Power Research Institute, Inc. All rights reserved.
Aggregation levels
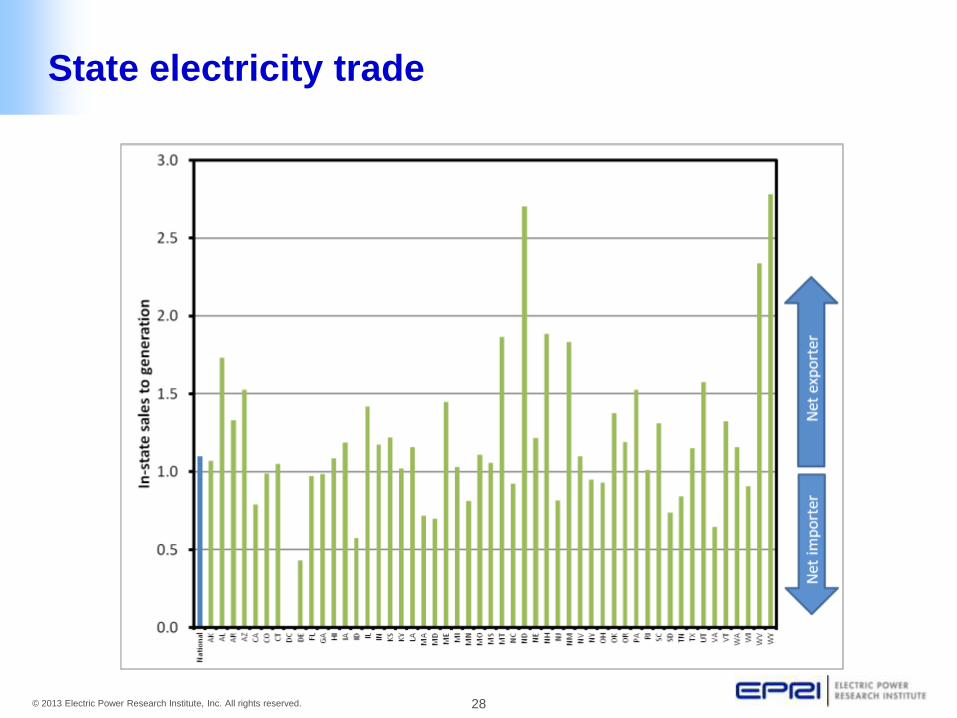
• Looking at statewide emissions doesn’t work well; there is
too much sharing of electricity between states.
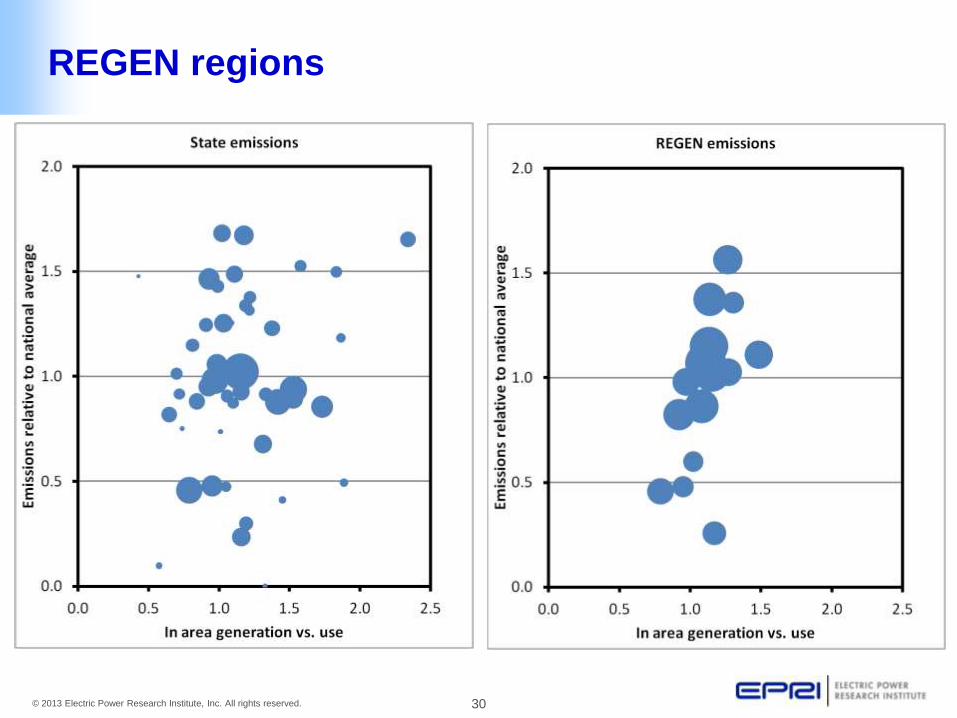
• National emissions are generally the best way to look at
trends, but doesn’t provide regional detail, which can be
quite interesting.
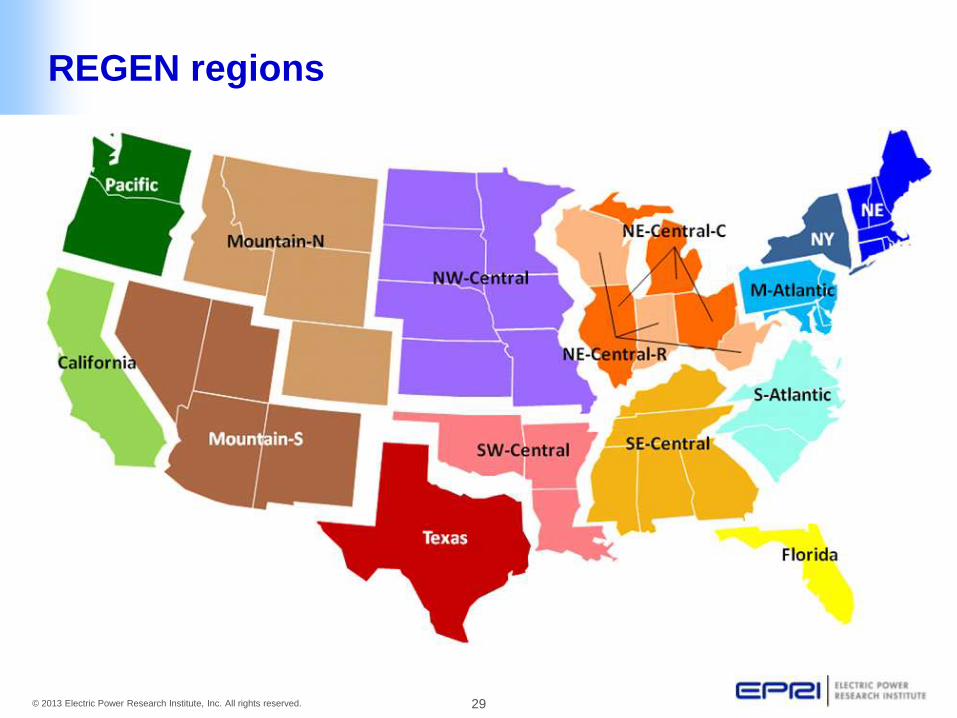
• For its REGEN model, EPRI created a set of region
definitions that group states into blocks that represent
electricity flows
27© 2013 Electric Power Research Institute, Inc. All rights reserved.
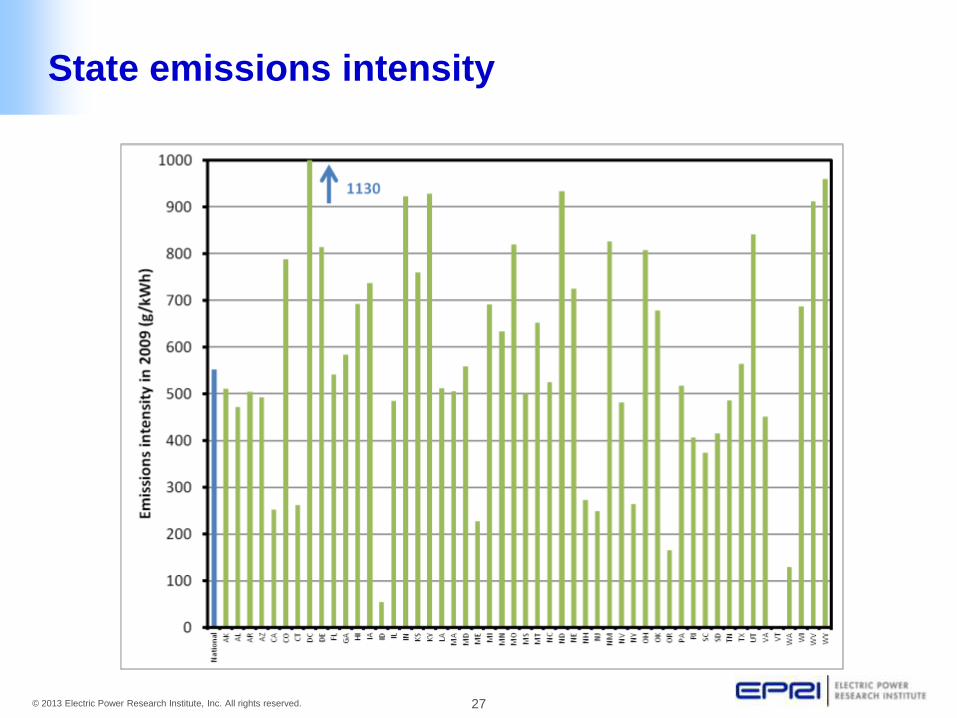
State emissions intensity
28© 2013 Electric Power Research Institute, Inc. All rights reserved.
State electricity trade
29© 2013 Electric Power Research Institute, Inc. All rights reserved.
REGEN regions
30© 2013 Electric Power Research Institute, Inc. All rights reserved.
REGEN regions
31© 2013 Electric Power Research Institute, Inc. All rights reserved.
Backup: 2 decades of emissions
32© 2013 Electric Power Research Institute, Inc. All rights reserved.
SOx
33© 2013 Electric Power Research Institute, Inc. All rights reserved.
NOx
34© 2013 Electric Power Research Institute, Inc. All rights reserved.
CO2
35© 2013 Electric Power Research Institute, Inc. All rights reserved.
Backup: Net emissions and air
quality changes (from 2007
study)
36© 2013 Electric Power Research Institute, Inc. All rights reserved.
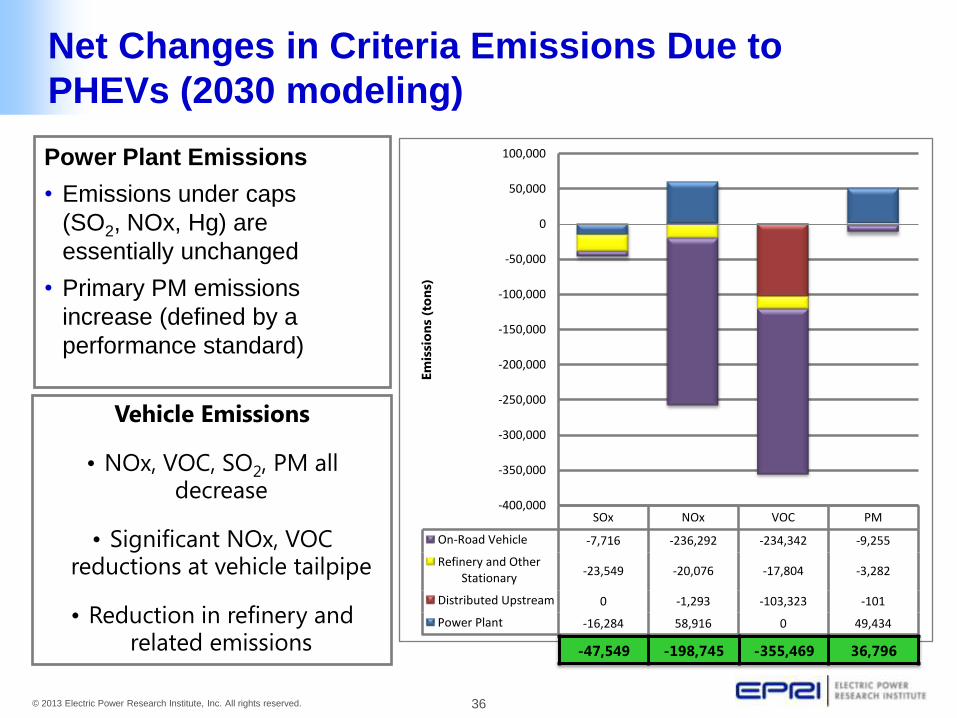
Net Changes in Criteria Emissions Due to
PHEVs (2030 modeling)
Power Plant Emissions
• Emissions under caps
(SO2, NOx, Hg) are
essentially unchanged
• Primary PM emissions
increase (defined by a
performance standard)
Vehicle Emissions
• NOx, VOC, SO2, PM all decrease
• Significant NOx, VOC reductions at vehicle tailpipe
• Reduction in refinery and related emissions
SOx NOx VOC PM
On-Road Vehicle -7,716 -236,292 -234,342 -9,255
Refinery and Other Stationary
-23,549 -20,076 -17,804 -3,282
Distributed Upstream 0 -1,293 -103,323 -101
Power Plant -16,284 58,916 0 49,434
-400,000
-350,000
-300,000
-250,000
-200,000
-150,000
-100,000
-50,000
0
50,000
100,000
Em
issi
on
s (t
on
s)
-47,549 -198,745 -355,469 36,796
37© 2013 Electric Power Research Institute, Inc. All rights reserved.
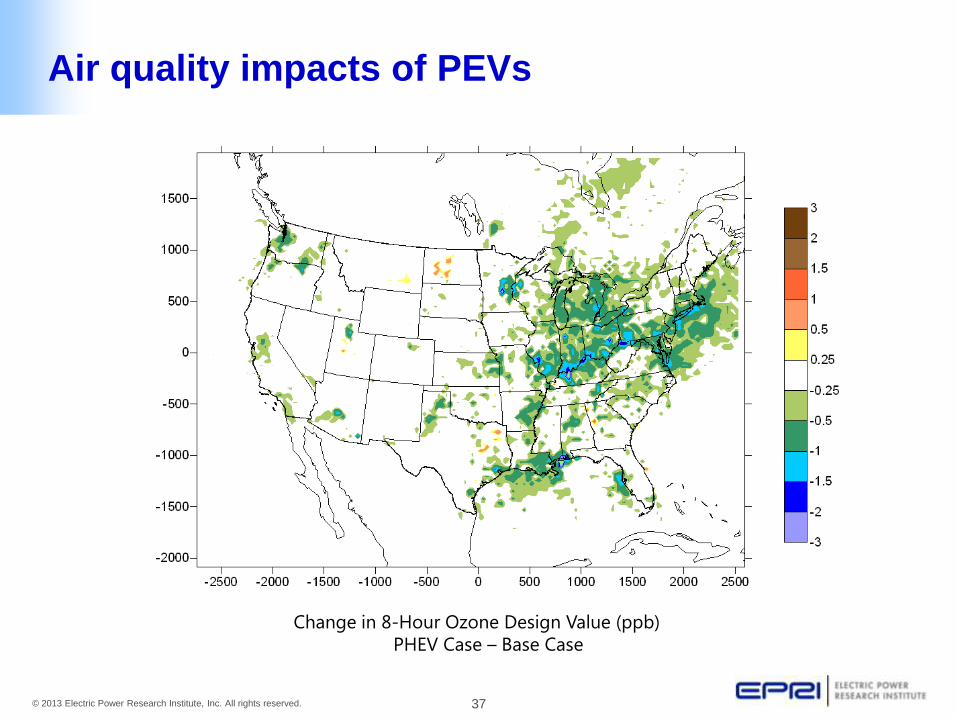
Air quality impacts of PEVs
Change in 8-Hour Ozone Design Value (ppb)
PHEV Case – Base Case
38© 2013 Electric Power Research Institute, Inc. All rights reserved.
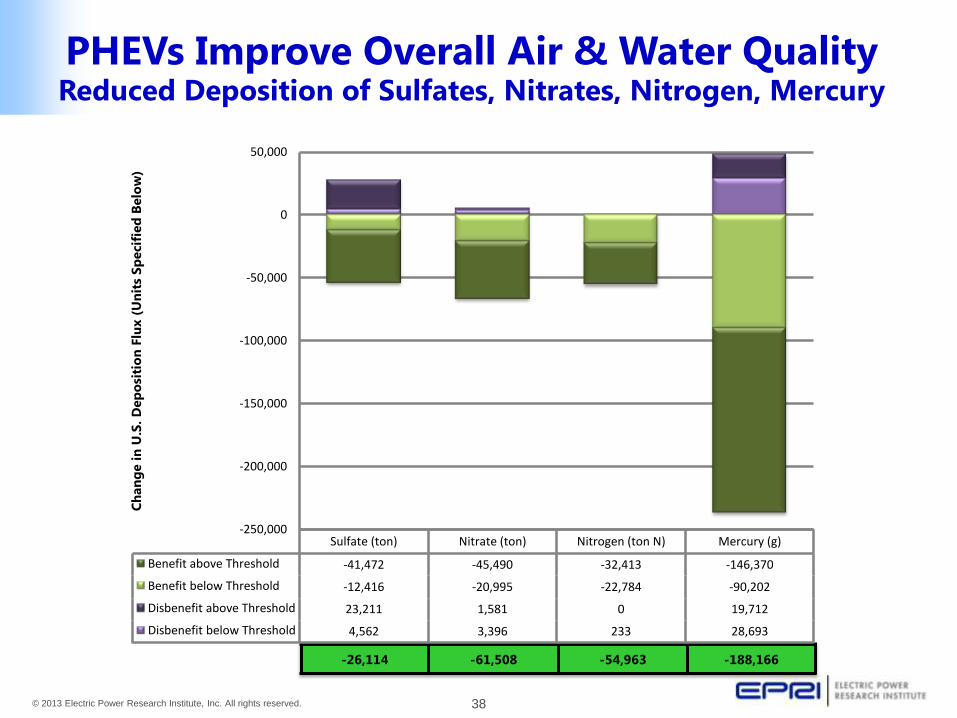
-26,114 -61,508 -54,963 -188,166
PHEVs Improve Overall Air & Water Quality Reduced Deposition of Sulfates, Nitrates, Nitrogen, Mercury
Sulfate (ton) Nitrate (ton) Nitrogen (ton N) Mercury (g)
Benefit above Threshold -41,472 -45,490 -32,413 -146,370
Benefit below Threshold -12,416 -20,995 -22,784 -90,202
Disbenefit above Threshold 23,211 1,581 0 19,712
Disbenefit below Threshold 4,562 3,396 233 28,693
-250,000
-200,000
-150,000
-100,000
-50,000
0
50,000C
han
ge i
n U
.S.
Dep
osi
tio
n F
lux (
Un
its
Sp
ecif
ied
Belo
w)