Embed Size (px)
Citation preview
S H O W M E S O L A R : C L E A N , L O C A L P O W E R F O R M I S S O U R I ’ S E C O N O M Y
M O S E I A 2 0 1 4 A N N U A L C O N F E R E N C E
John Farrell Director of Democratic Energy
February 1, 2014

S H O W M E
"I come from a state that raises corn and cotton and cockleburs and Democrats, and frothy eloquence neither
convinces nor satisfies me. I am from Missouri. You have got to show me."
U.S. Congressman Willard Duncan Vandiver

S H O W M E
A number of miners from the lead districts of southwest Missouri had been imported to take the places of
Colorado mine strikers. The Joplin miners…required frequent instructions. Pit bosses began saying,
"That man is from Missouri. You'll have to show him."

P O T E N T I A L
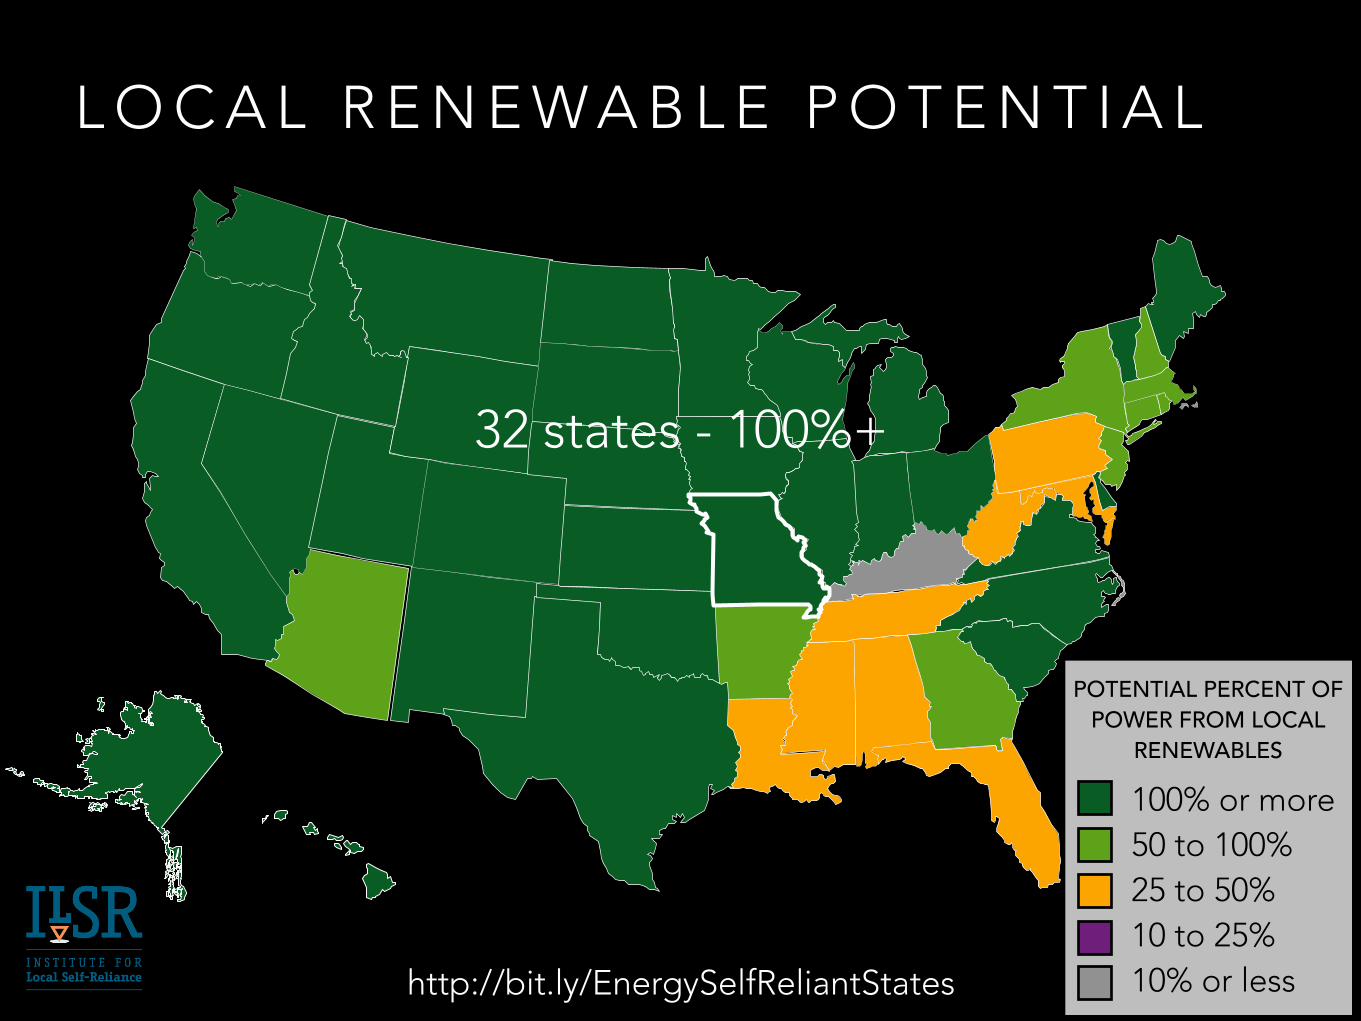
POTENTIAL PERCENT OF POWER FROM LOCAL
RENEWABLES
100% or more 50 to 100% 25 to 50% 10 to 25% 10% or less
L O C A L R E N E W A B L E P O T E N T I A L
32 states - 100%+
http://bit.ly/EnergySelfReliantStates
What percent of Missouri electricity could come from rooftop solar alone?
20%
23%
49%
42%
31%
18%
23%
24%
19%
19%28%
23%
24%
24%
26%
21%
12%
11%52%51%
49%
22%
23%
21%23%
19%
14%
38%41%
26%
35%
28%
19%
25%
21%
25%
24%
20%
22%
19%
23%
17%
23%
18% 20%
15%
24%
21%18%
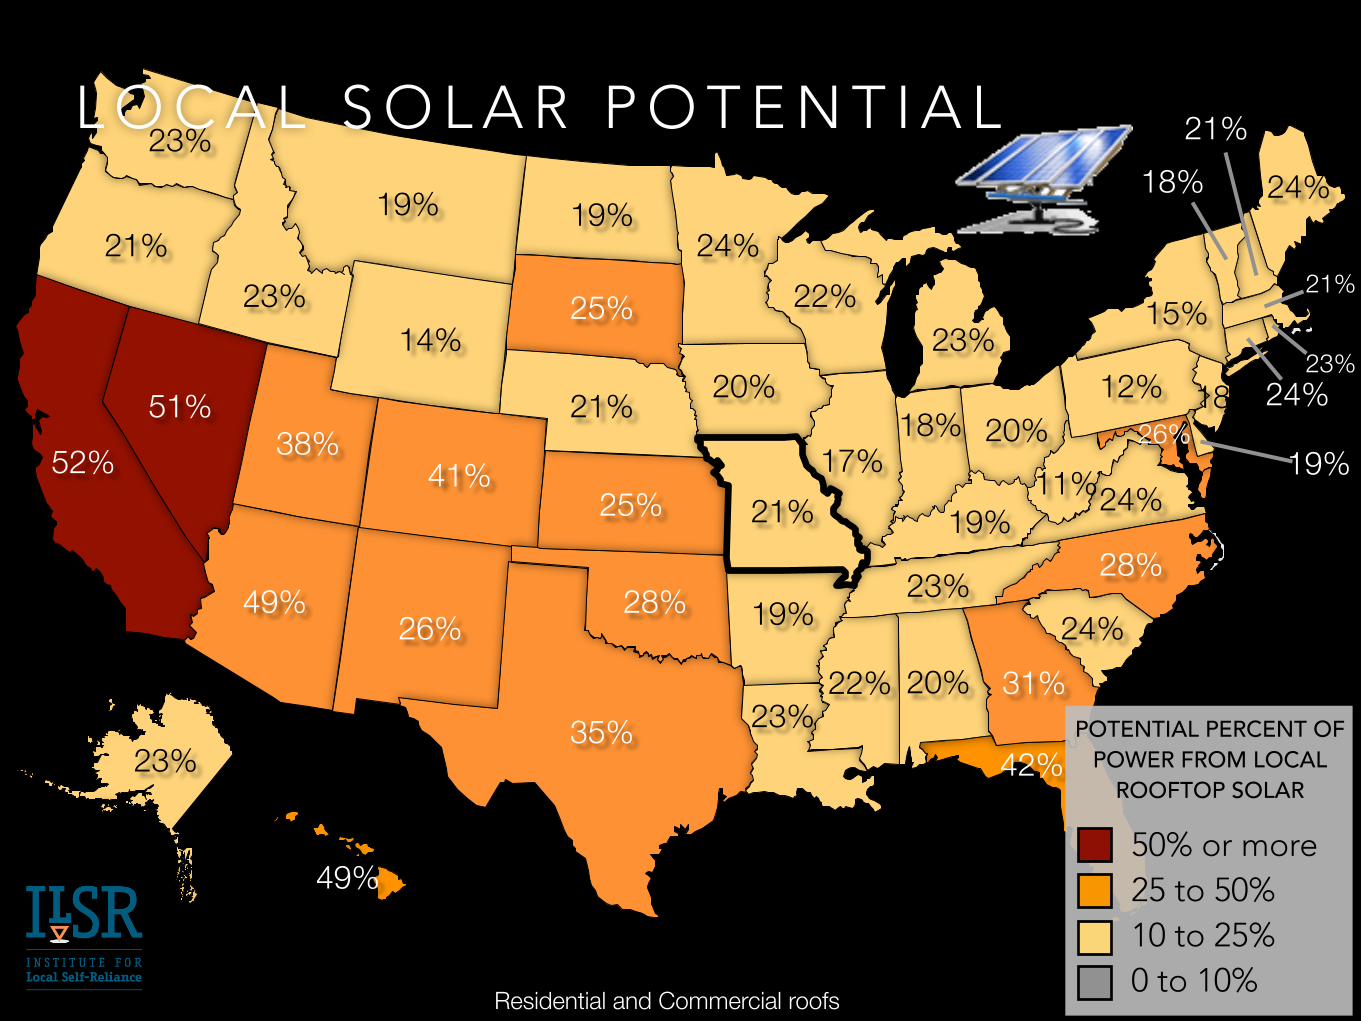
Residential and Commercial roofs
L O C A L S O L A R P O T E N T I A L
POTENTIAL PERCENT OF POWER FROM LOCAL
ROOFTOP SOLAR
50% or more 25 to 50% 10 to 25% 0 to 10%
21%
21%
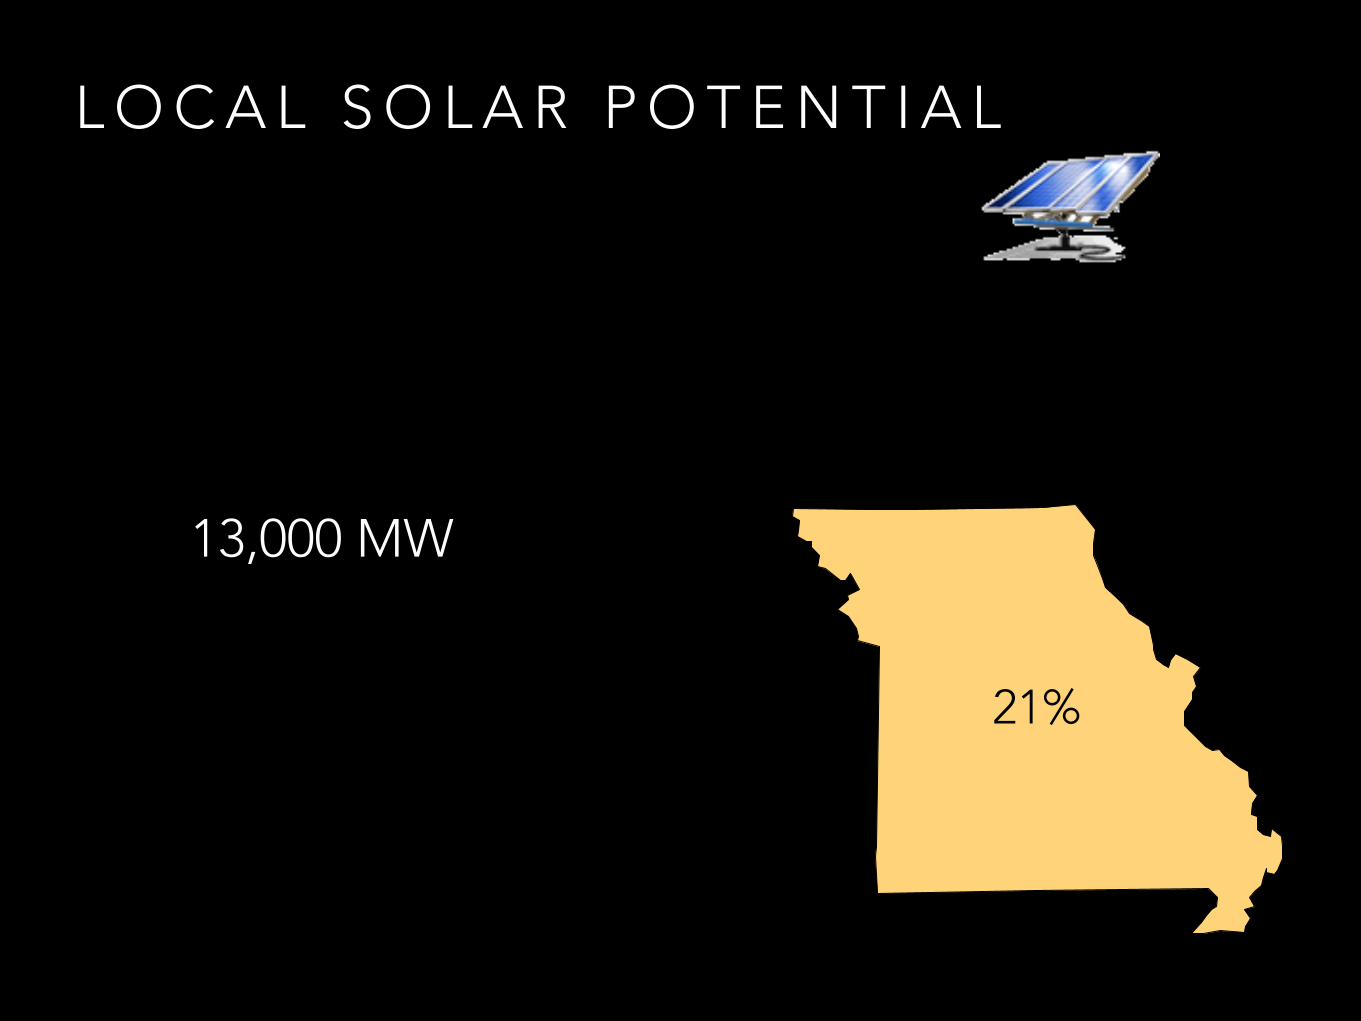
L O C A L S O L A R P O T E N T I A L
13,000 MW
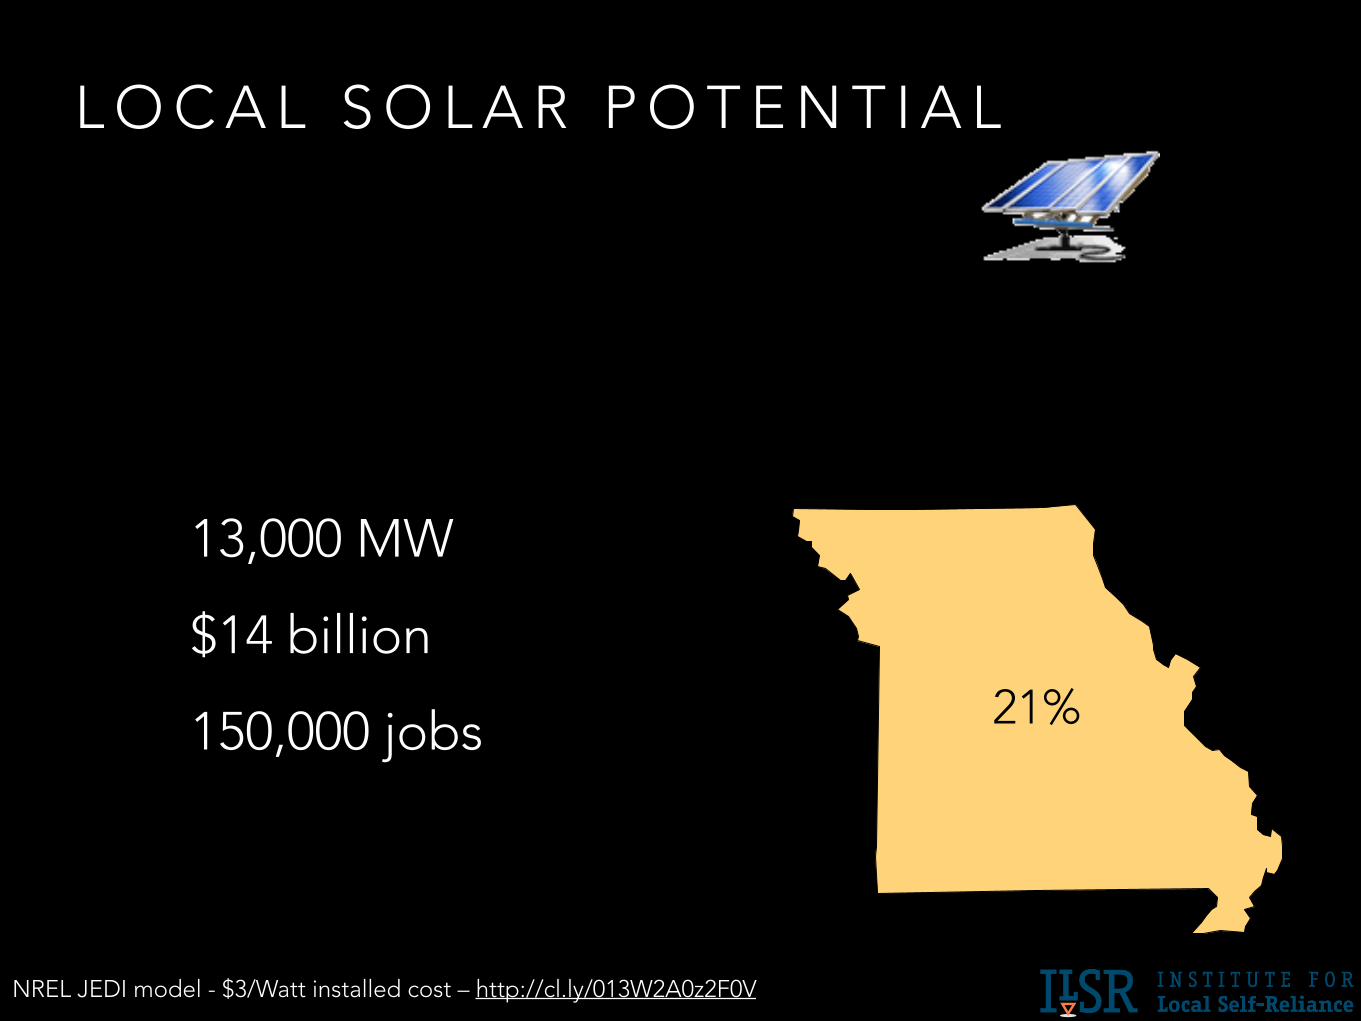
21%
L O C A L S O L A R P O T E N T I A L
13,000 MW
$14 billion
150,000 jobs
NREL JEDI model - $3/Watt installed cost – http://cl.ly/013W2A0z2F0V
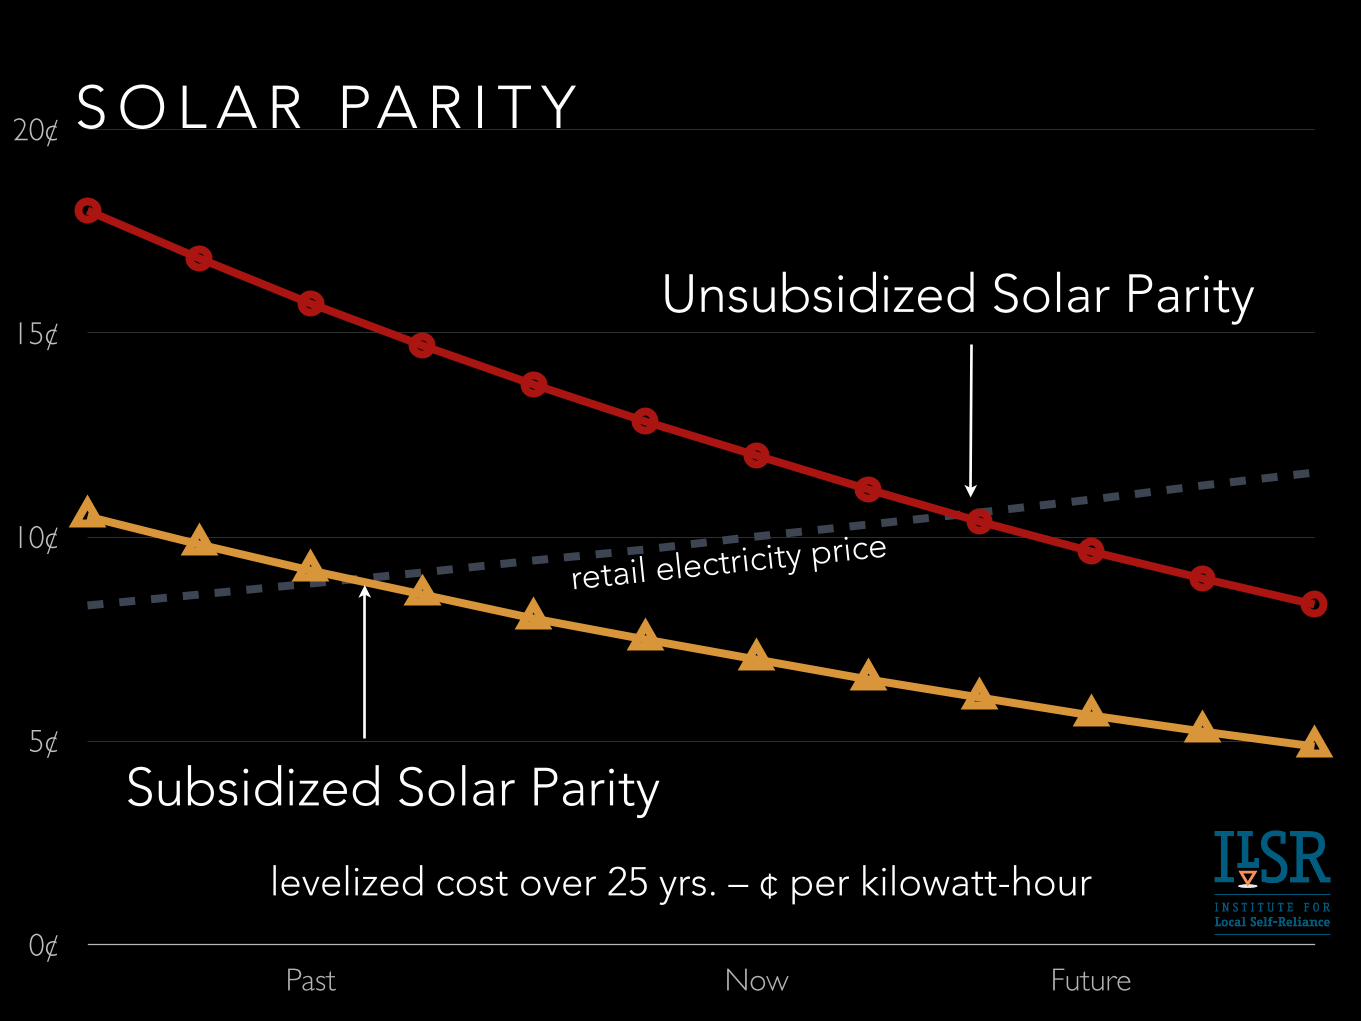
0¢
5¢
10¢
15¢
20¢
Past Now Future
Subsidized Solar Parity
Unsubsidized Solar Parity
S O L A R PA R I T Y
levelized cost over 25 yrs. – ¢ per kilowatt-hour
retail electricity price
How fast are electricity prices rising?
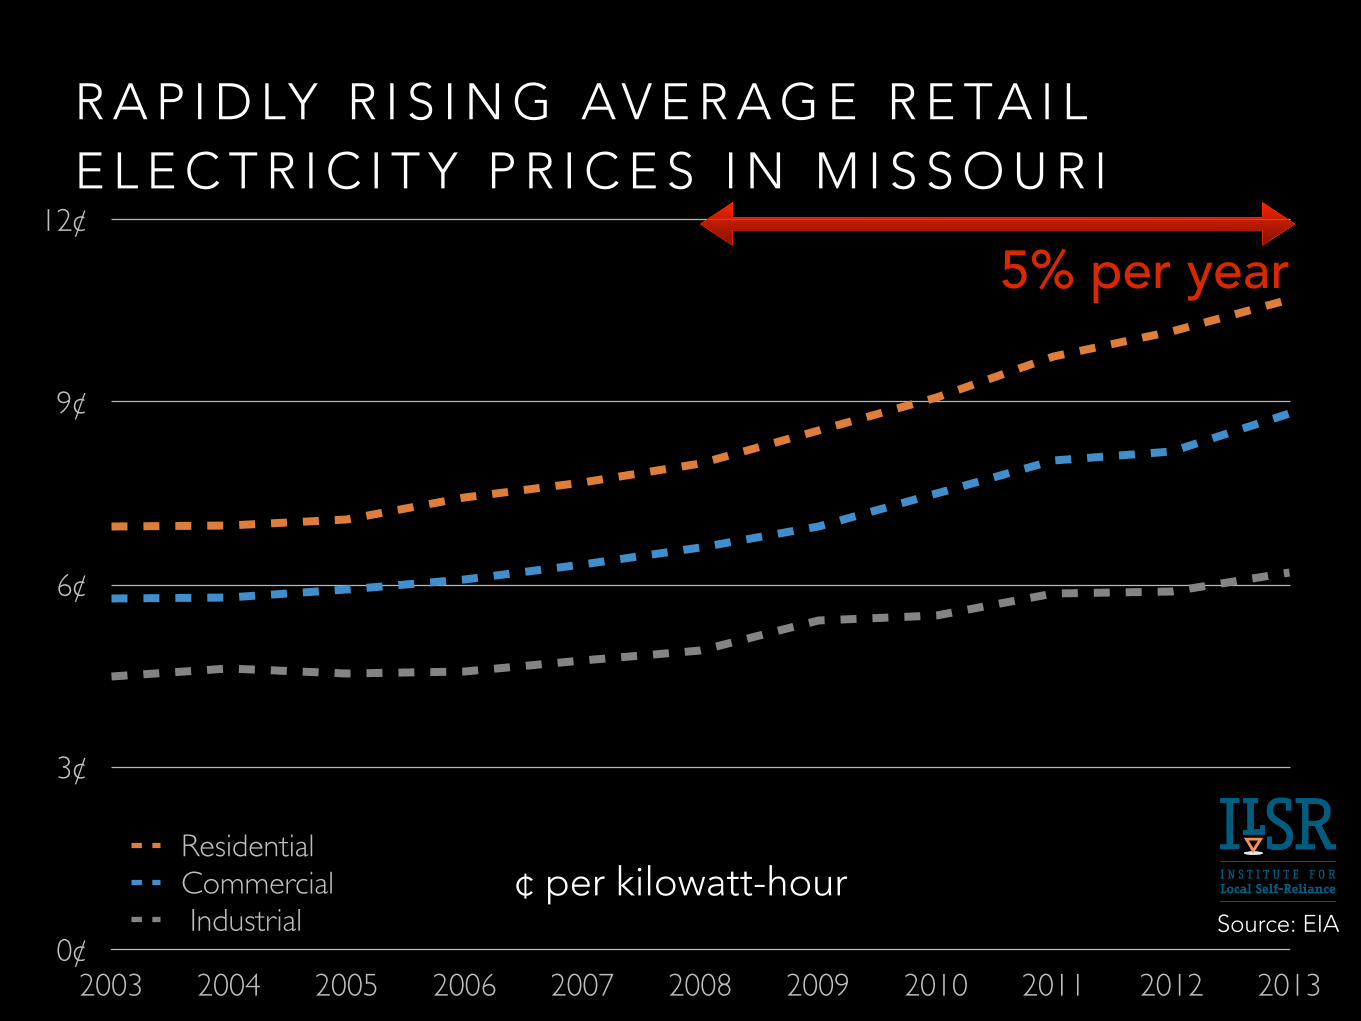
0¢
3¢
6¢
9¢
12¢
2003 2004 2005 2006 2007 2008 2009 2010 2011 2012 2013
ResidentialCommercial Industrial
R A P I D LY R I S I N G AV E R A G E R E TA I L E L E C T R I C I T Y P R I C E S I N M I S S O U R I
¢ per kilowatt-hourSource: EIA
5% per year
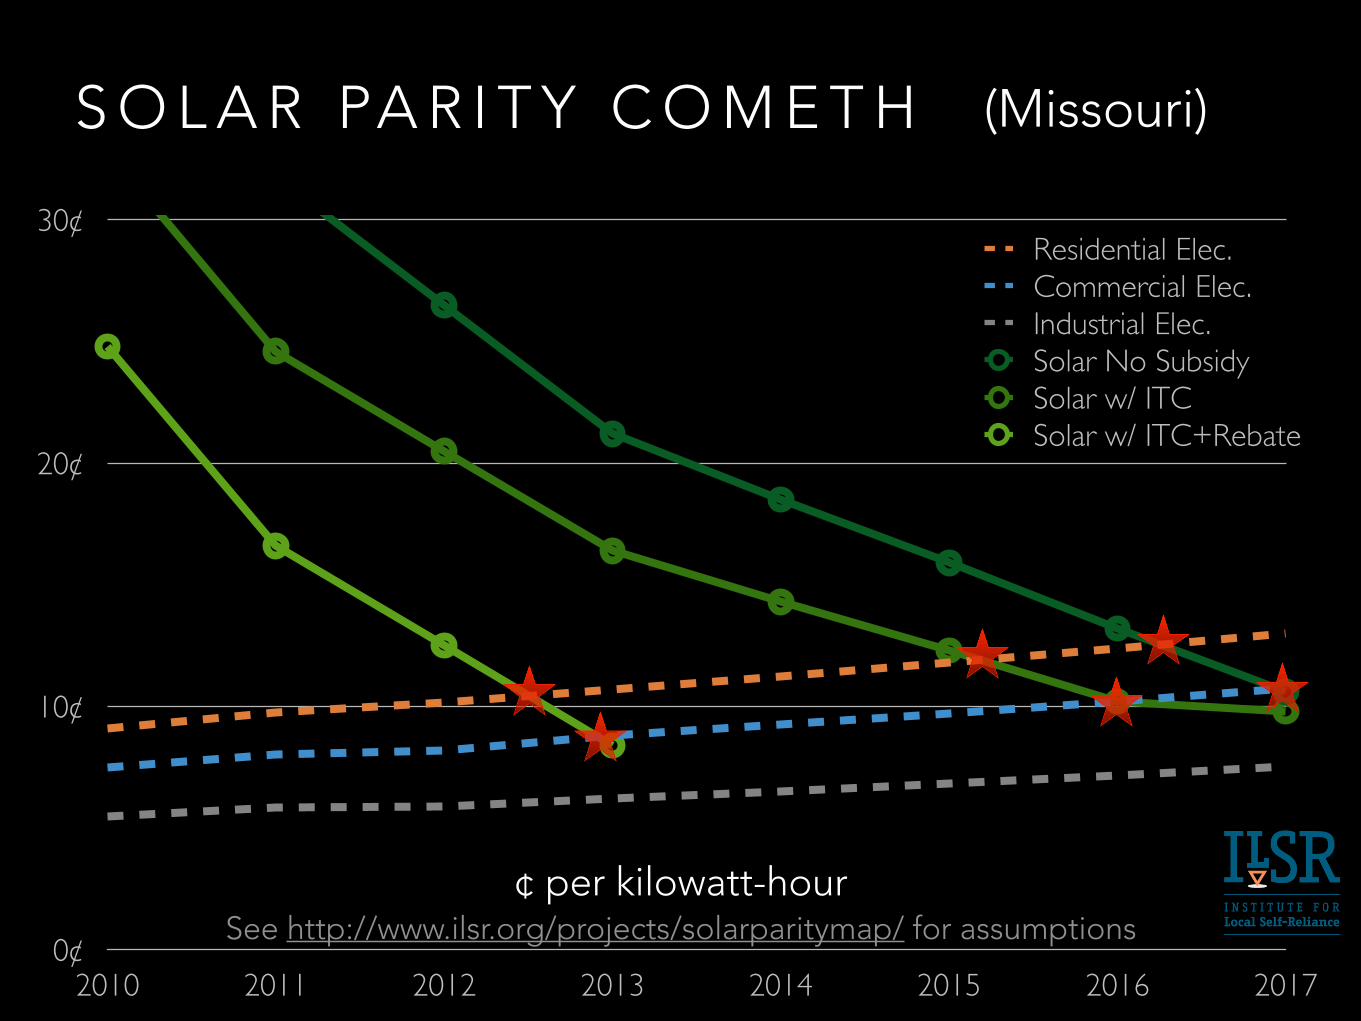
0¢
10¢
20¢
30¢
2010 2011 2012 2013 2014 2015 2016 2017
Residential Elec.Commercial Elec.Industrial Elec.Solar No SubsidySolar w/ ITCSolar w/ ITC+Rebate
S O L A R PA R I T Y C O M E T H
¢ per kilowatt-hour
(Missouri)
See http://www.ilsr.org/projects/solarparitymap/ for assumptions
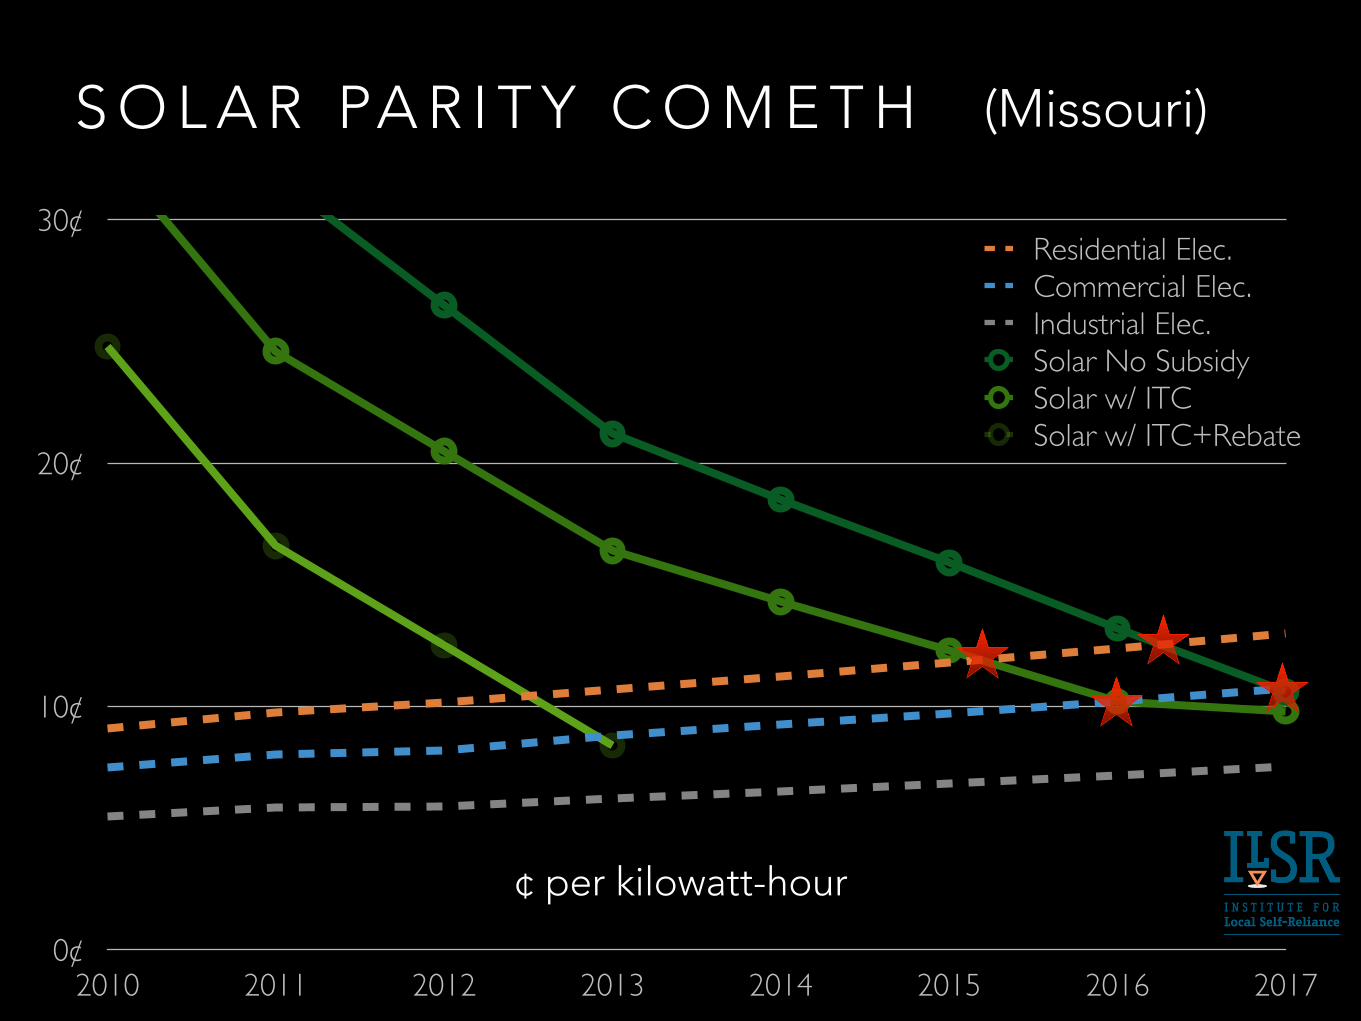
0¢
10¢
20¢
30¢
2010 2011 2012 2013 2014 2015 2016 2017
Residential Elec.Commercial Elec.Industrial Elec.Solar No SubsidySolar w/ ITCSolar w/ ITC+Rebate
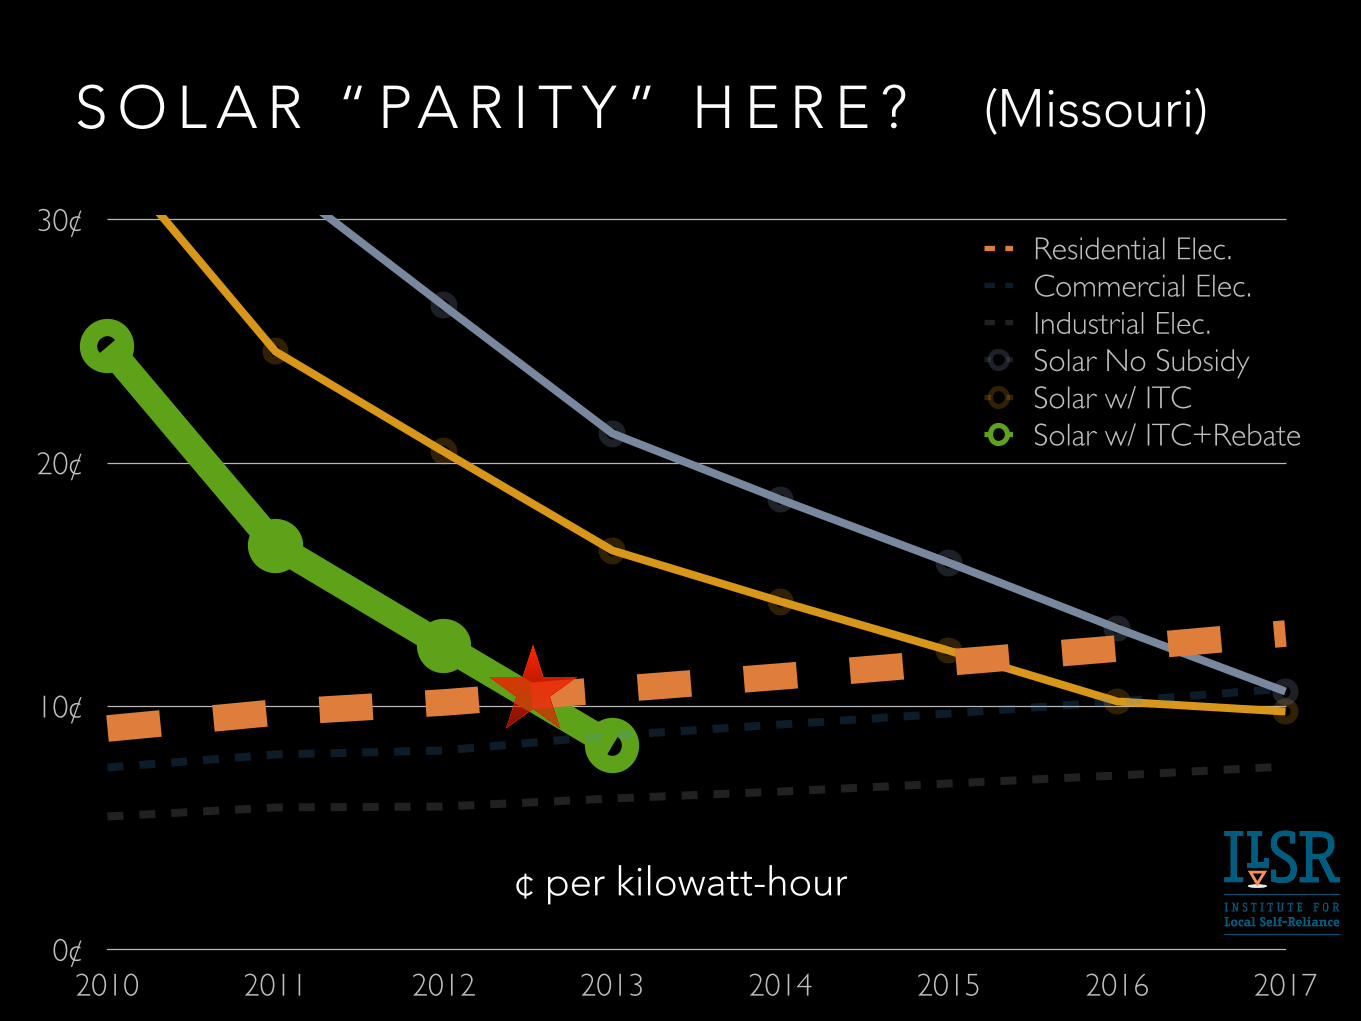
S O L A R “ PA R I T Y ” H E R E ?
¢ per kilowatt-hour
(Missouri)
0¢
10¢
20¢
30¢
2010 2011 2012 2013 2014 2015 2016 2017
Residential Elec.Commercial Elec.Industrial Elec.Solar No SubsidySolar w/ ITCSolar w/ ITC+Rebate
S O L A R PA R I T Y C O M E T H
¢ per kilowatt-hour
(Missouri)
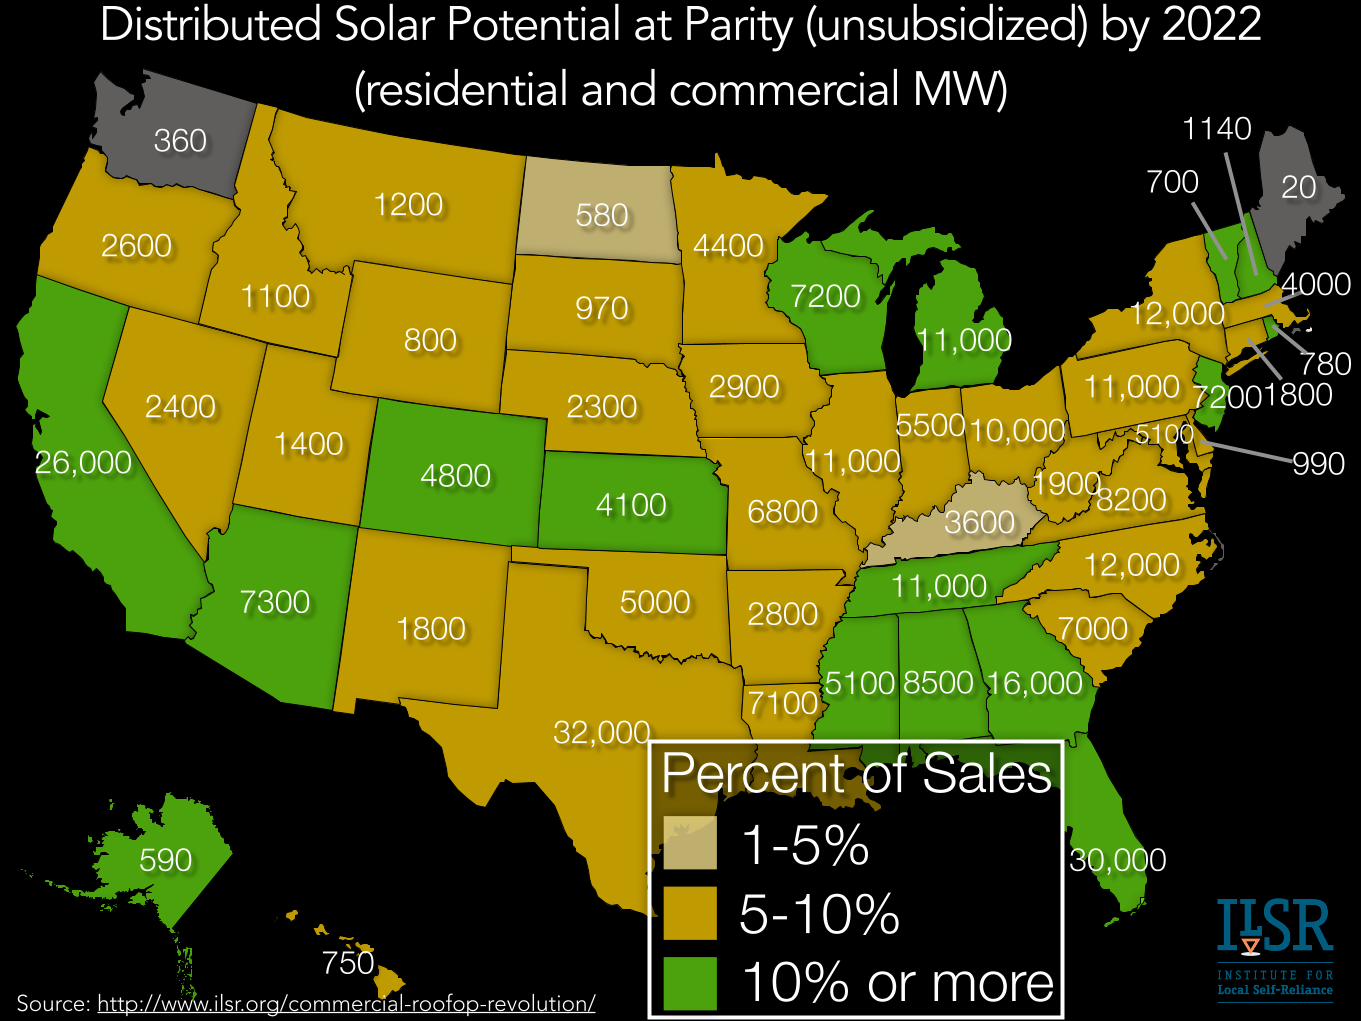
Distributed Solar Potential at Parity (unsubsidized) by 2022 (residential and commercial MW)
8500
590
750
30,000
16,000
7200
11,000
1800
990
360012,000
780
7000
8200
510011,000
190026,0002400
7300
5100
360
26001100
1200
800
14004800
1800
32,000
5000
580
970
2300
4100
4400
2900
7200
6800
2800
7100
11,000
11,000
550010,000
12,000
20
1140700
4000
Percent of Sales1-5%5-10%10% or moreSource: http://www.ilsr.org/commercial-roofop-revolution/

VA L U A B L E
21%
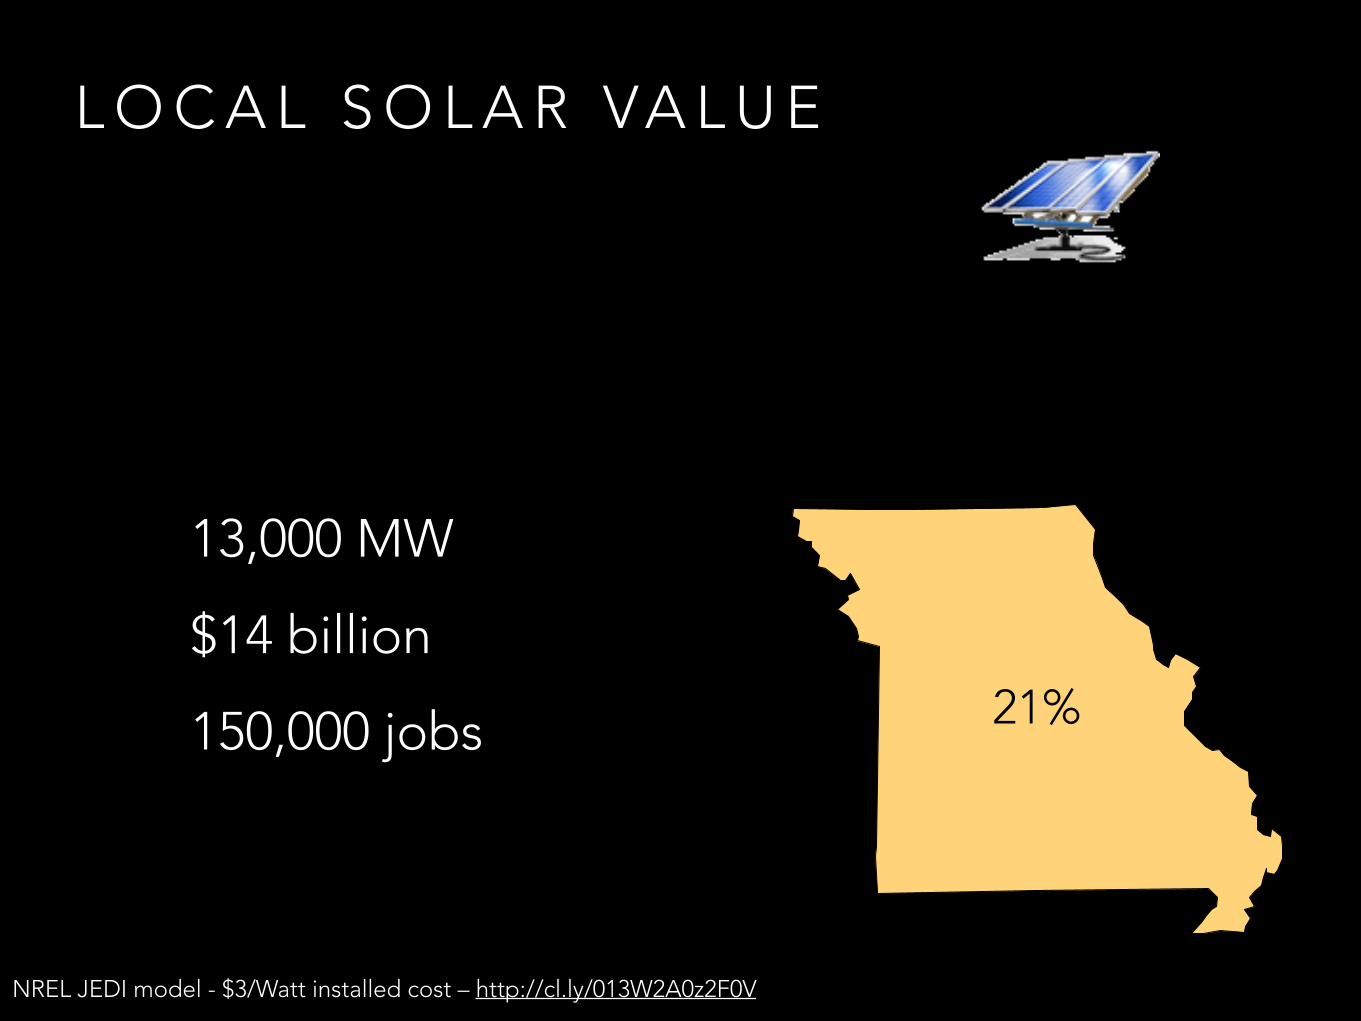
L O C A L S O L A R VA L U E
13,000 MW
$14 billion
150,000 jobs
NREL JEDI model - $3/Watt installed cost – http://cl.ly/013W2A0z2F0V
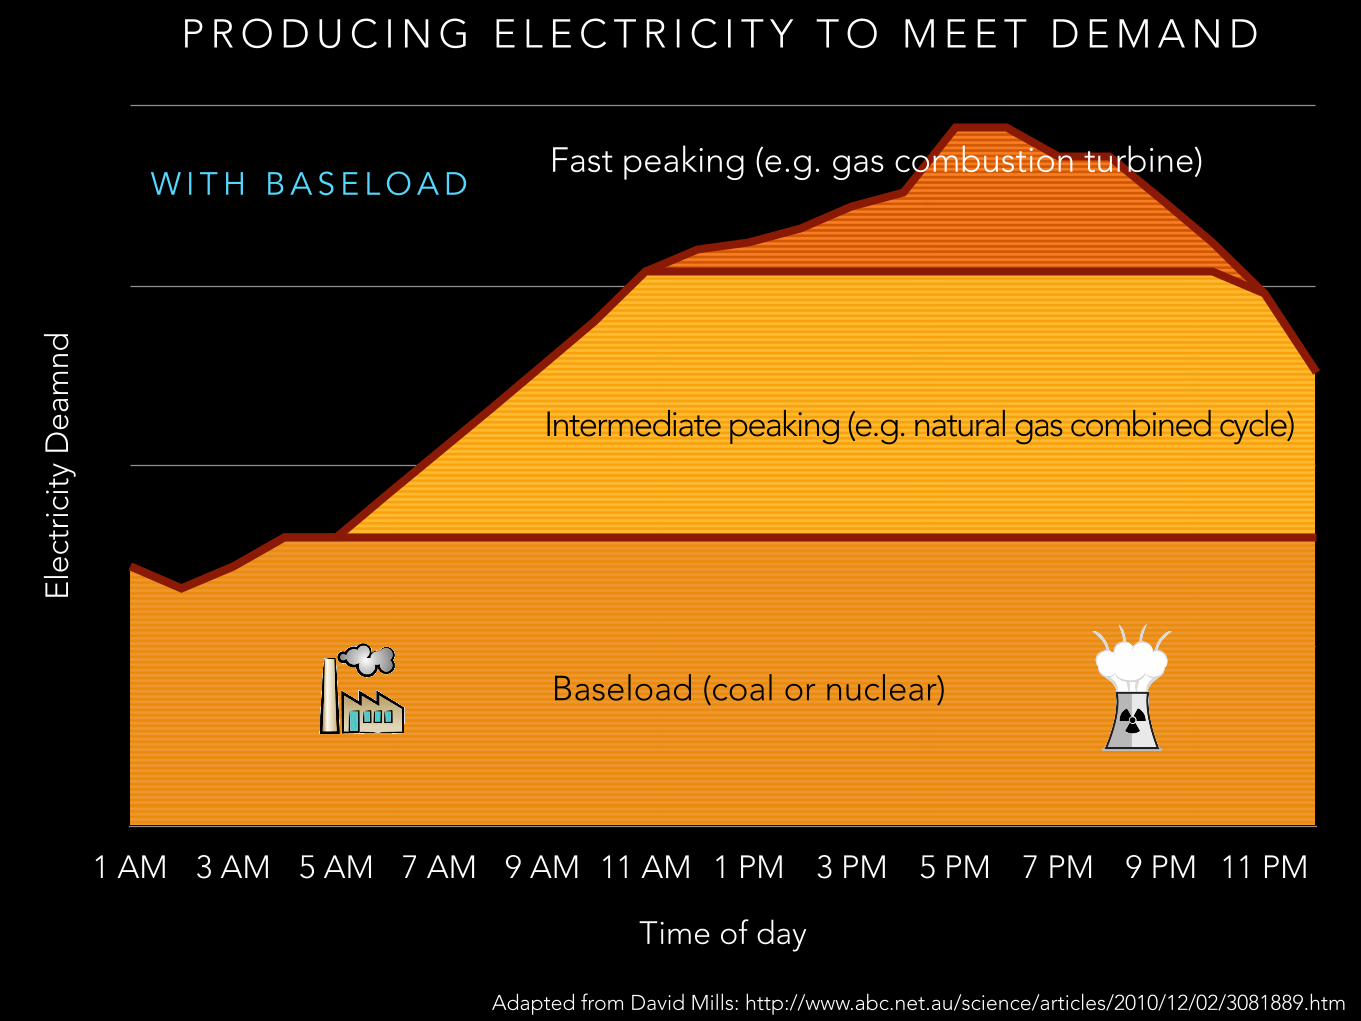
P R O D U C I N G E L E C T R I C I T Y T O M E E T D E M A N DEl
ectr
icity
Dea
mnd
Time of day
1 AM 3 AM 5 AM 7 AM 9 AM 11 AM 1 PM 3 PM 5 PM 7 PM 9 PM 11 PM
Adapted from David Mills: http://www.abc.net.au/science/articles/2010/12/02/3081889.htm
W I T H B A S E L O A D
Baseload (coal or nuclear)
Intermediate peaking (e.g. natural gas combined cycle)
Fast peaking (e.g. gas combustion turbine)
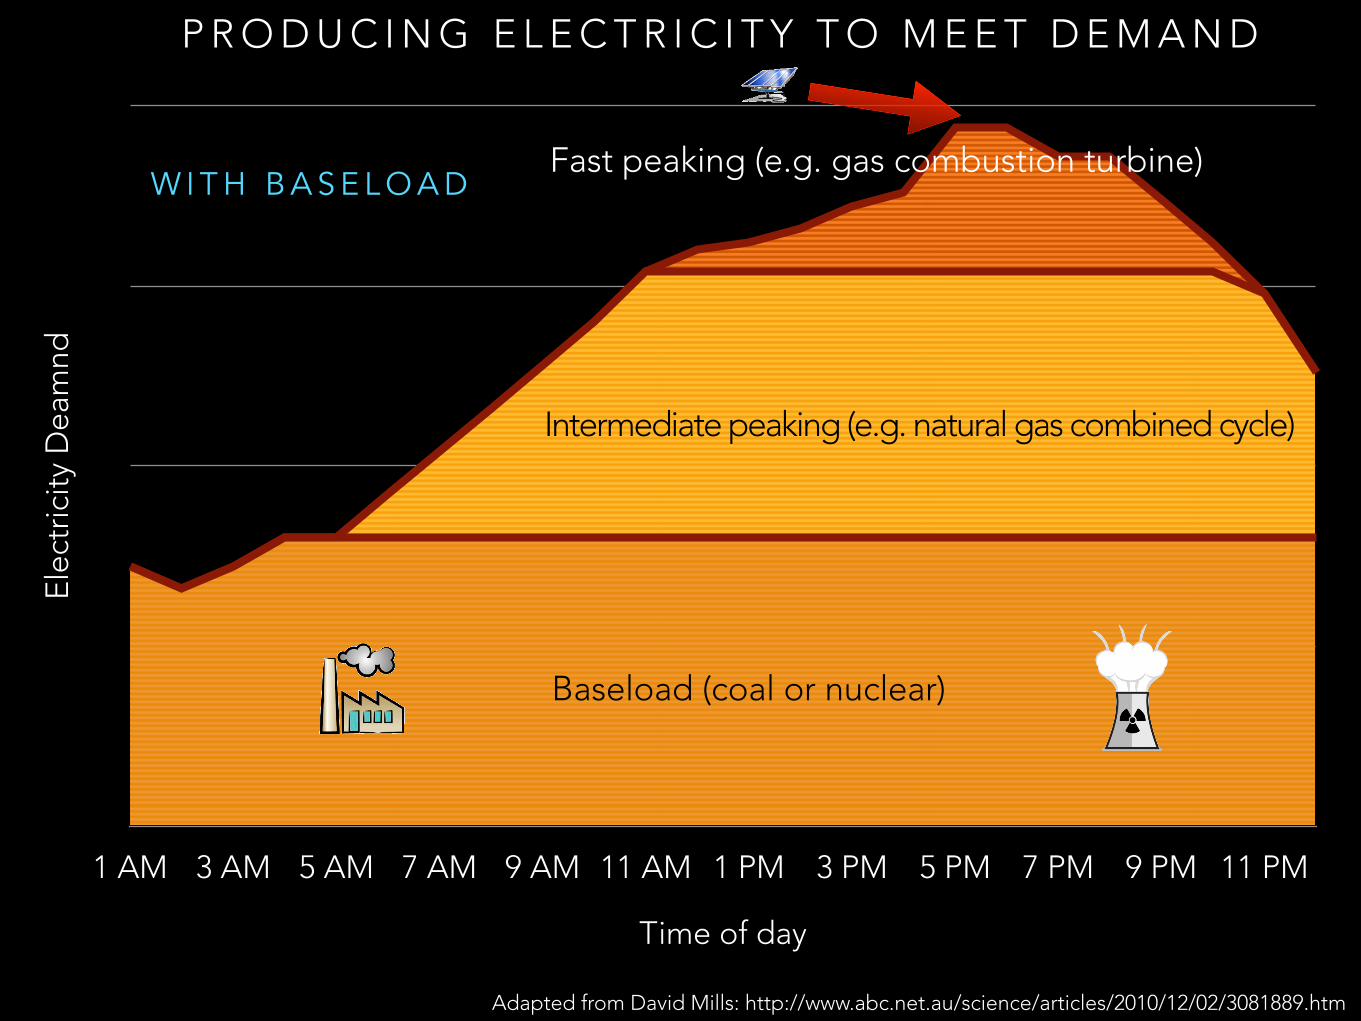
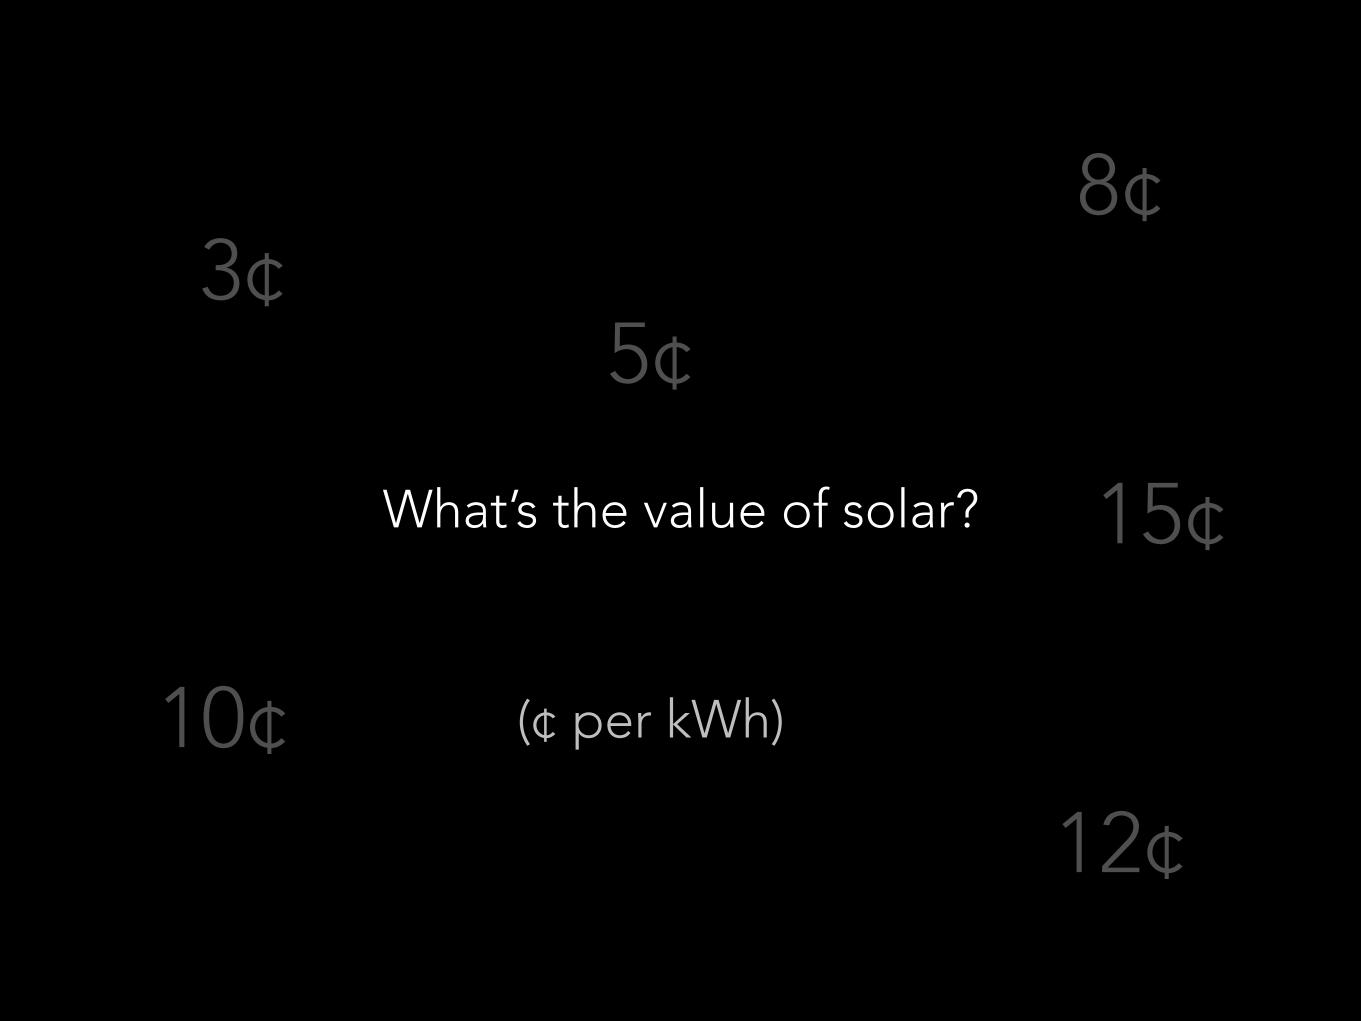
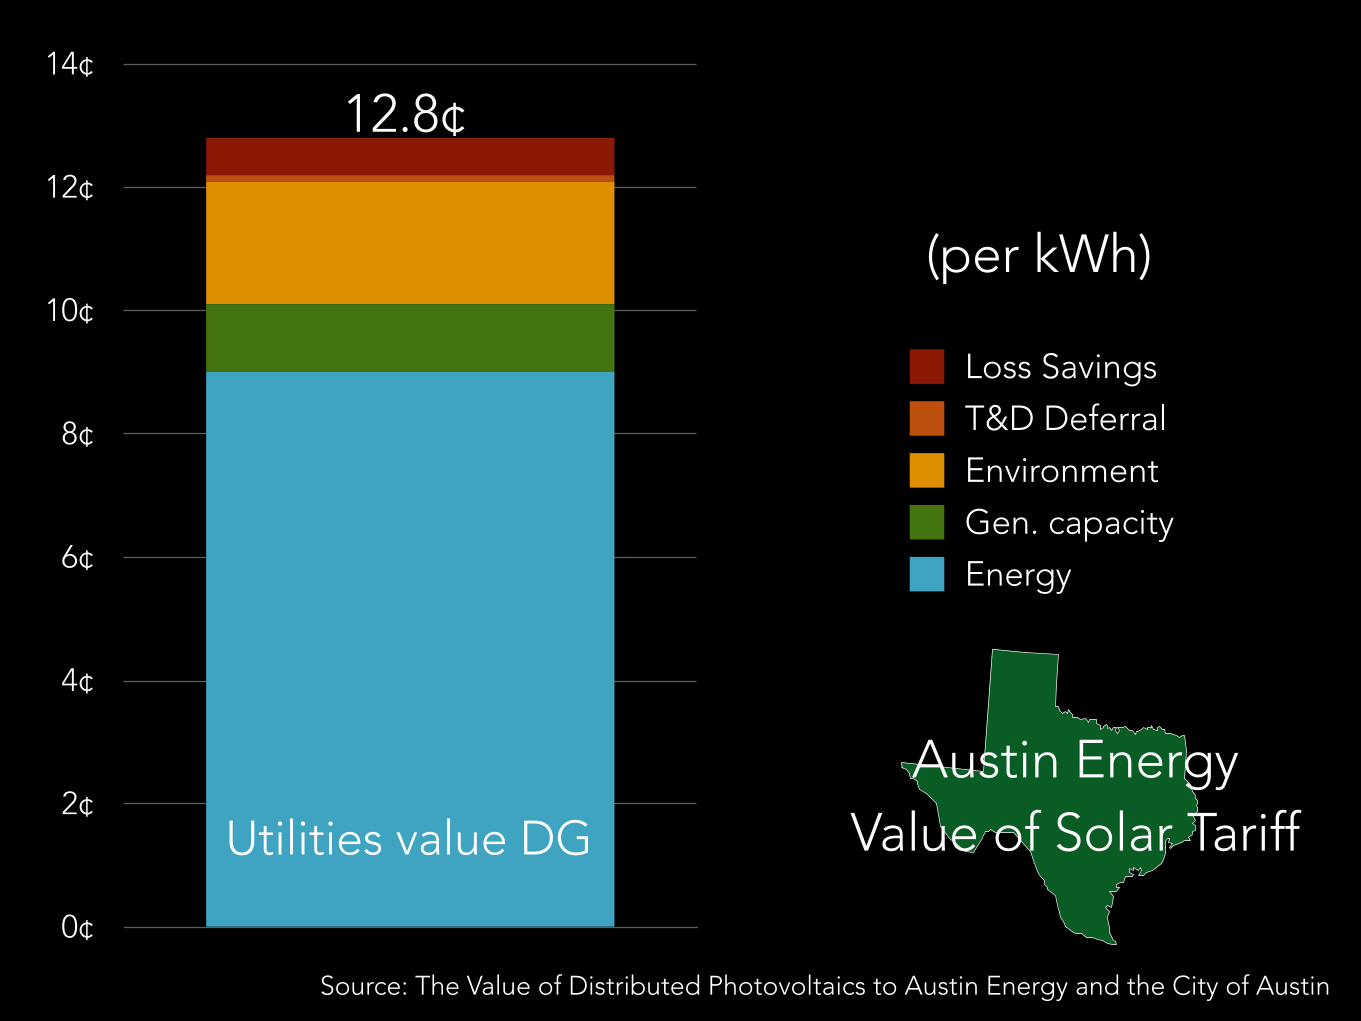
What’s the value of solar?
(¢ per kWh)
3¢5¢
8¢
12¢10¢
15¢
0¢
2¢
4¢
6¢
8¢
10¢
12¢
14¢
Energy
Gen. capacity
Environment
T&D Deferral
Loss Savings
12.8¢
(per kWh)
Source: The Value of Distributed Photovoltaics to Austin Energy and the City of Austin
Utilities value DG
Austin Energy Value of Solar Tariff
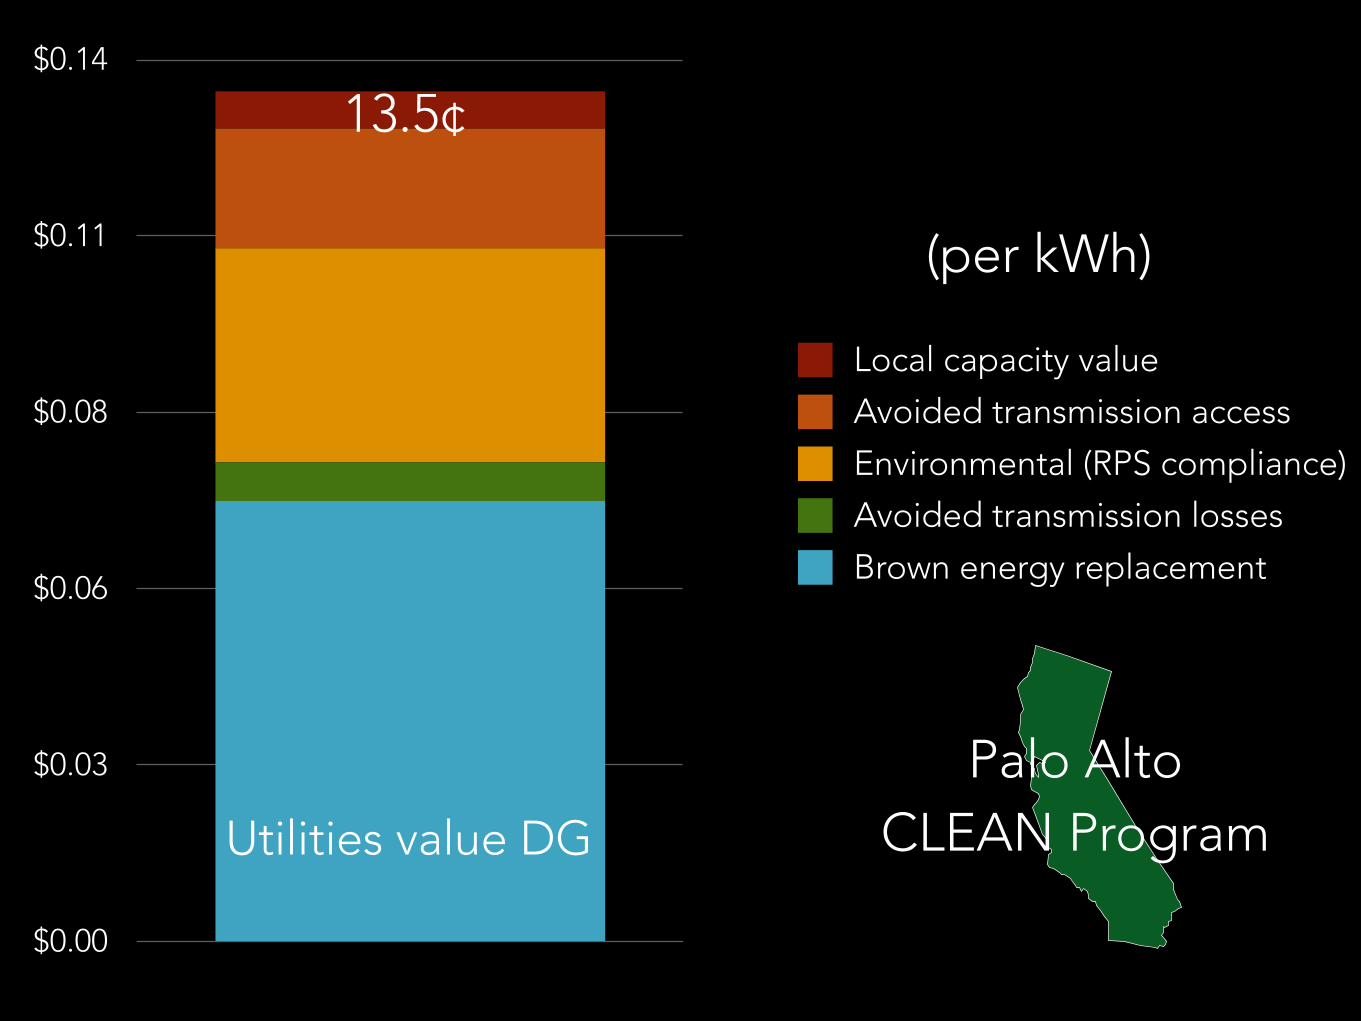
$0.00
$0.03
$0.06
$0.08
$0.11
$0.14
Brown energy replacement
Avoided transmission losses
Environmental (RPS compliance)
Avoided transmission access
Local capacity value
(per kWh)
Palo Alto CLEAN Program Utilities value DG
13.5¢
$0.00
$0.03
$0.06
$0.08
$0.11
$0.14
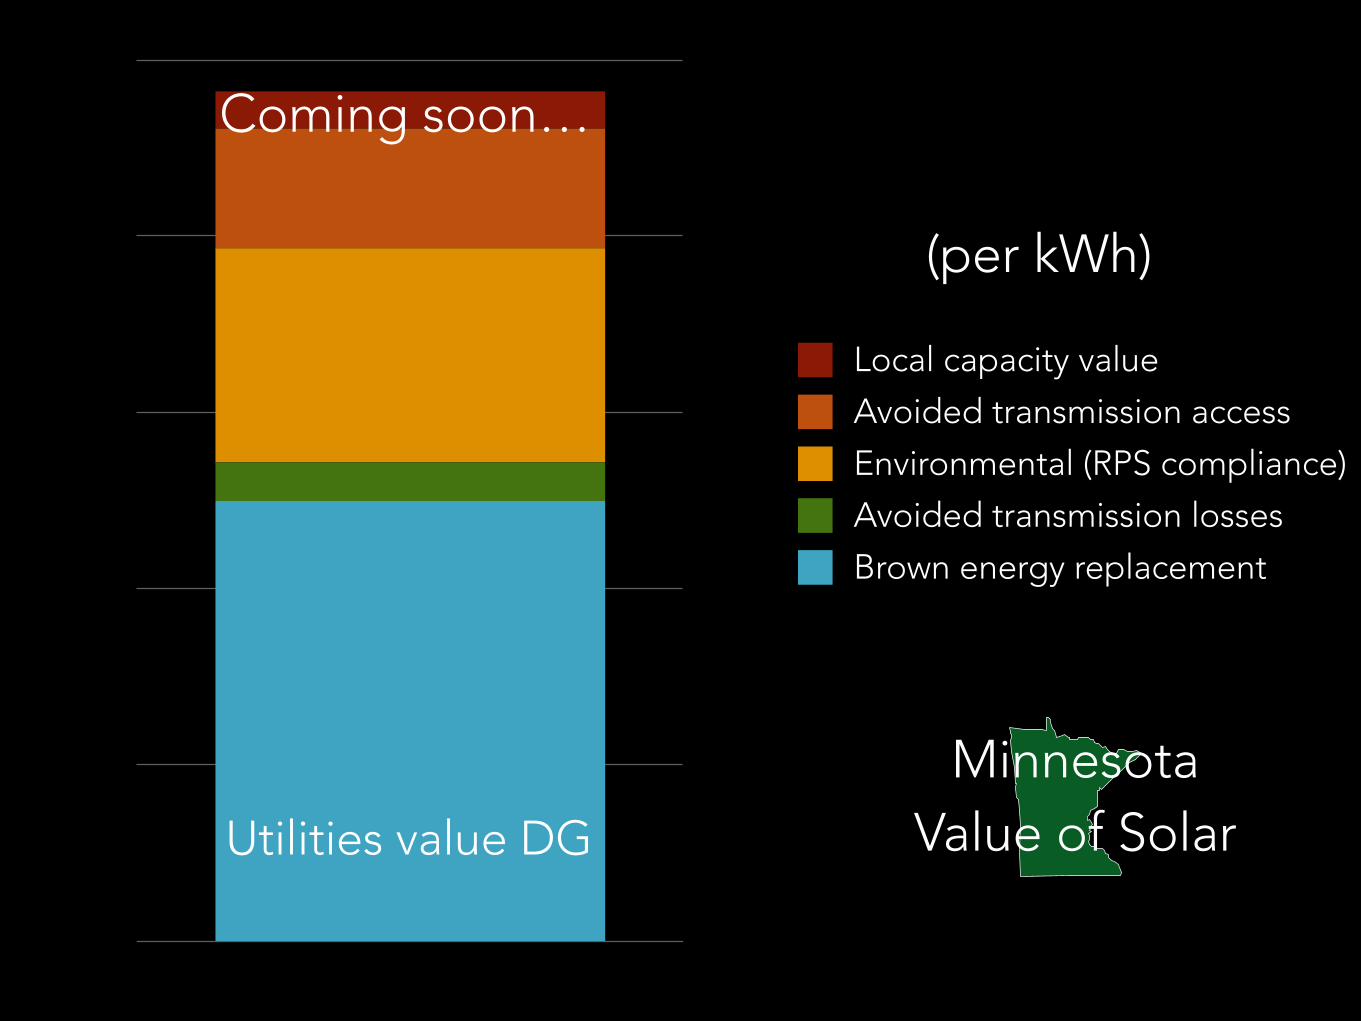
Brown energy replacement
Avoided transmission losses
Environmental (RPS compliance)
Avoided transmission access
Local capacity value
(per kWh)
Minnesota Value of SolarUtilities value DG
Coming soon…
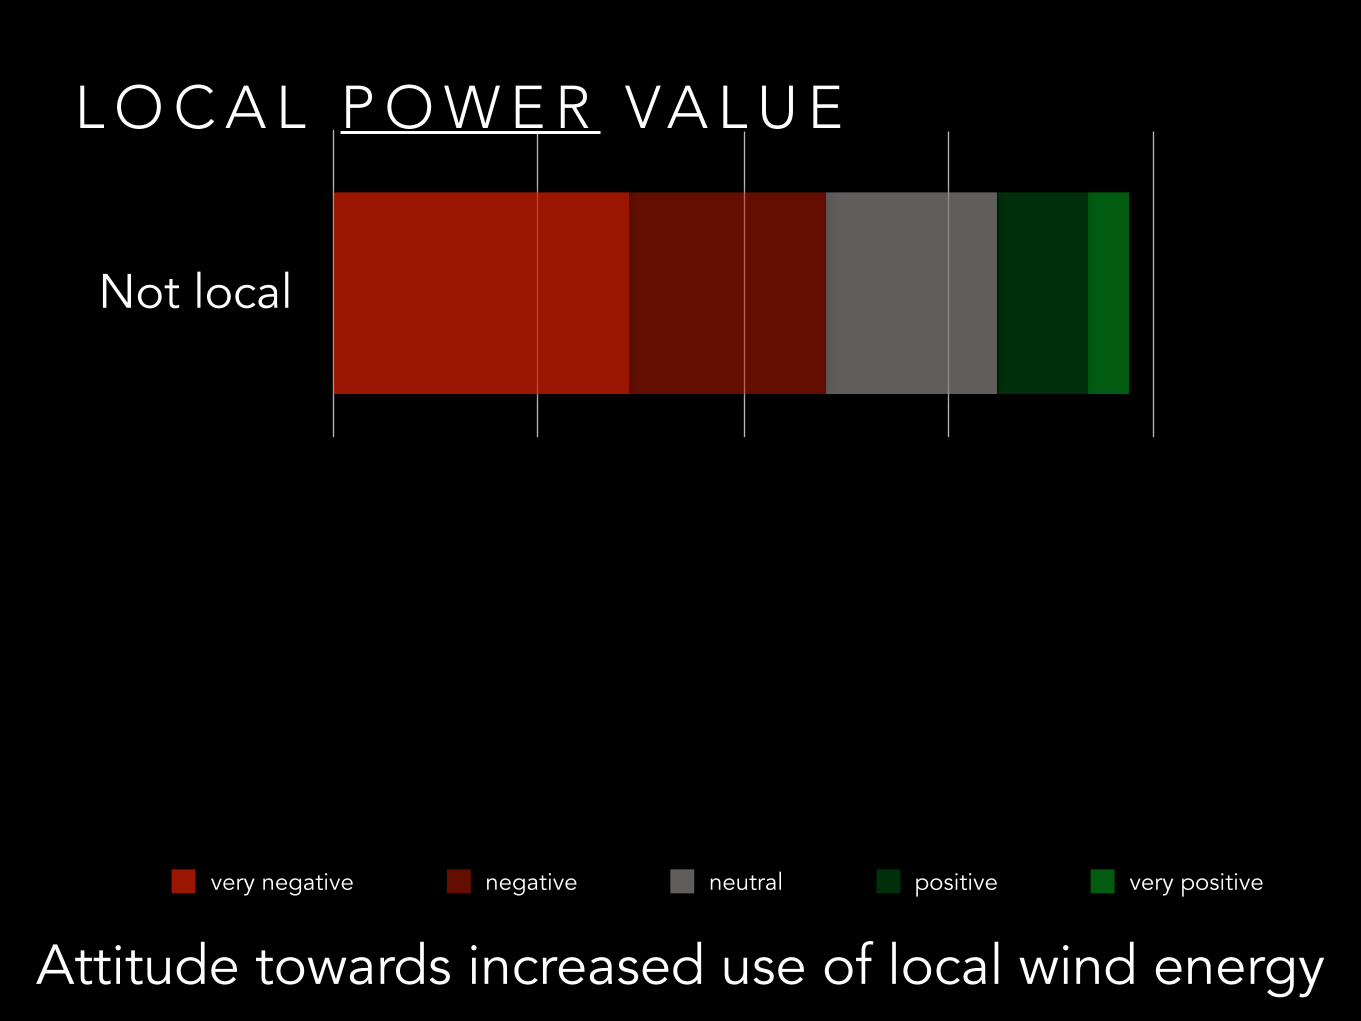
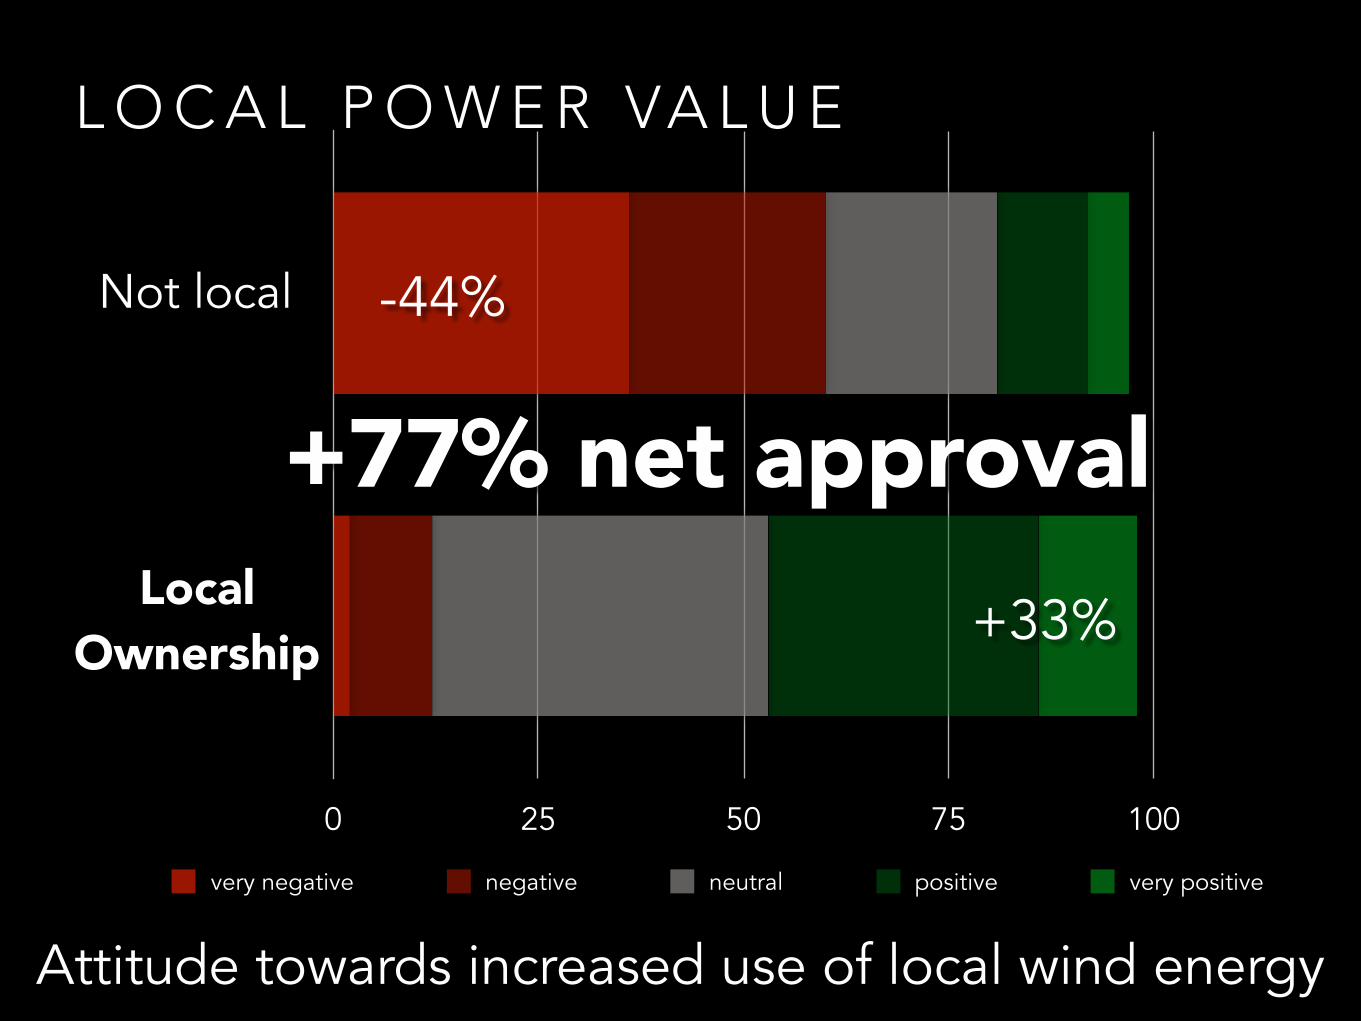
Not local
0 25 50 75 100
very negative negative neutral positive very positive
L O C A L P O W E R VA L U E
Attitude towards increased use of local wind energy
L O C A L P O W E R VA L U E
Attitude towards increased use of local wind energy
Not local
0 25 50 75 100
very negative negative neutral positive very positive
-44%
+33%
+77% net approvalLocal
Ownership
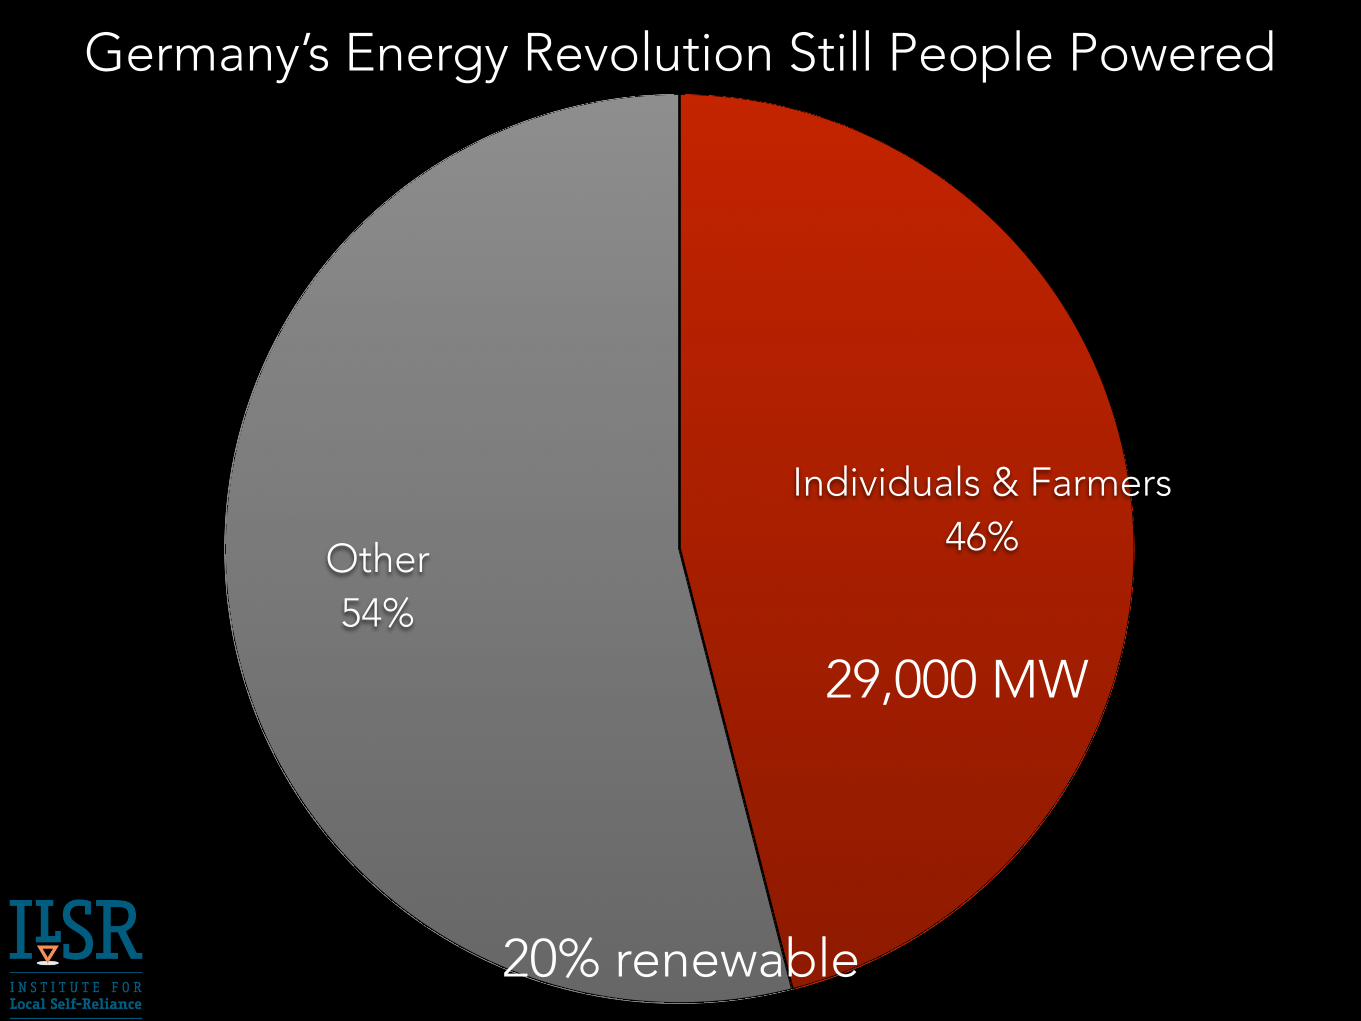
Other 54%
Individuals & Farmers 46%
Germany’s Energy Revolution Still People Powered
29,000 MW
20% renewable
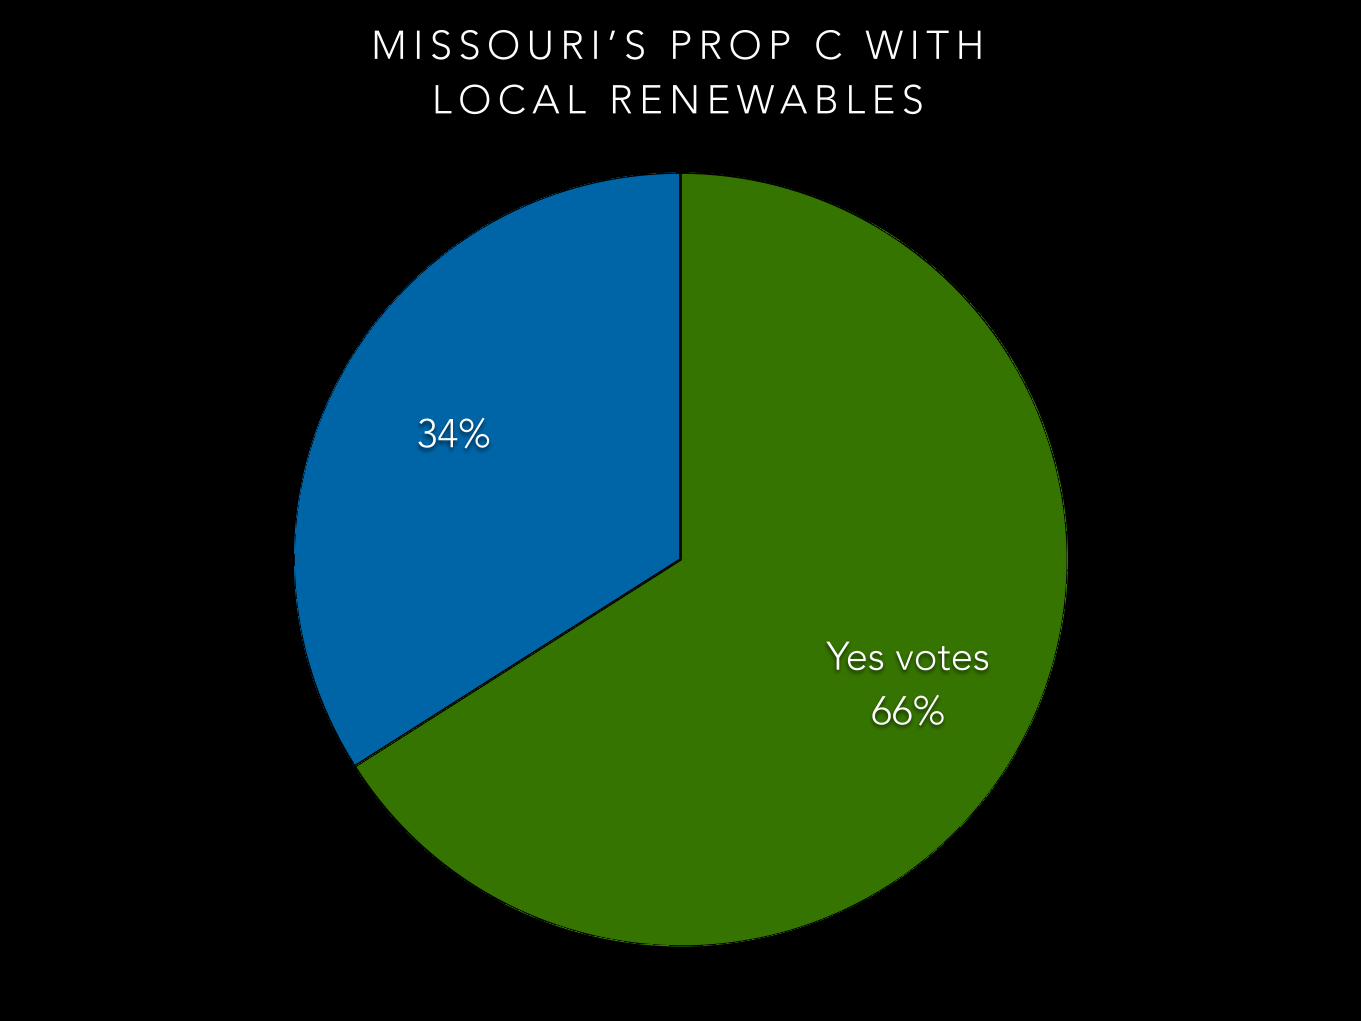
M I S S O U R I ’ S P R O P C W I T H L O C A L R E N E W A B L E S
34%
Yes votes 66%

S U R M O U N TA B L E B A R R I E R S
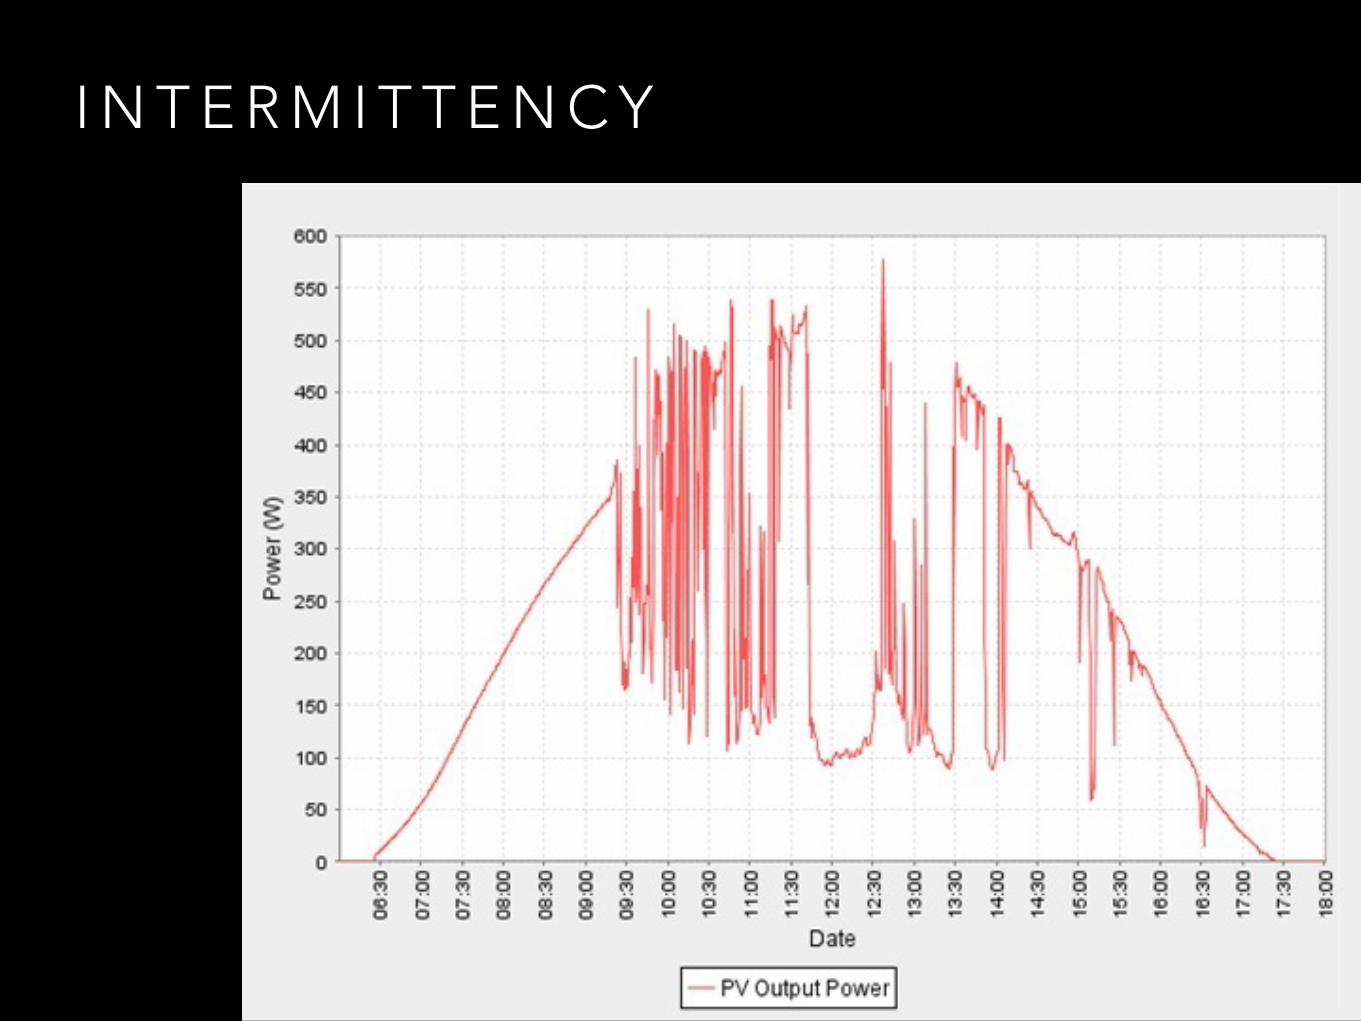
I N T E R M I T T E N C Y
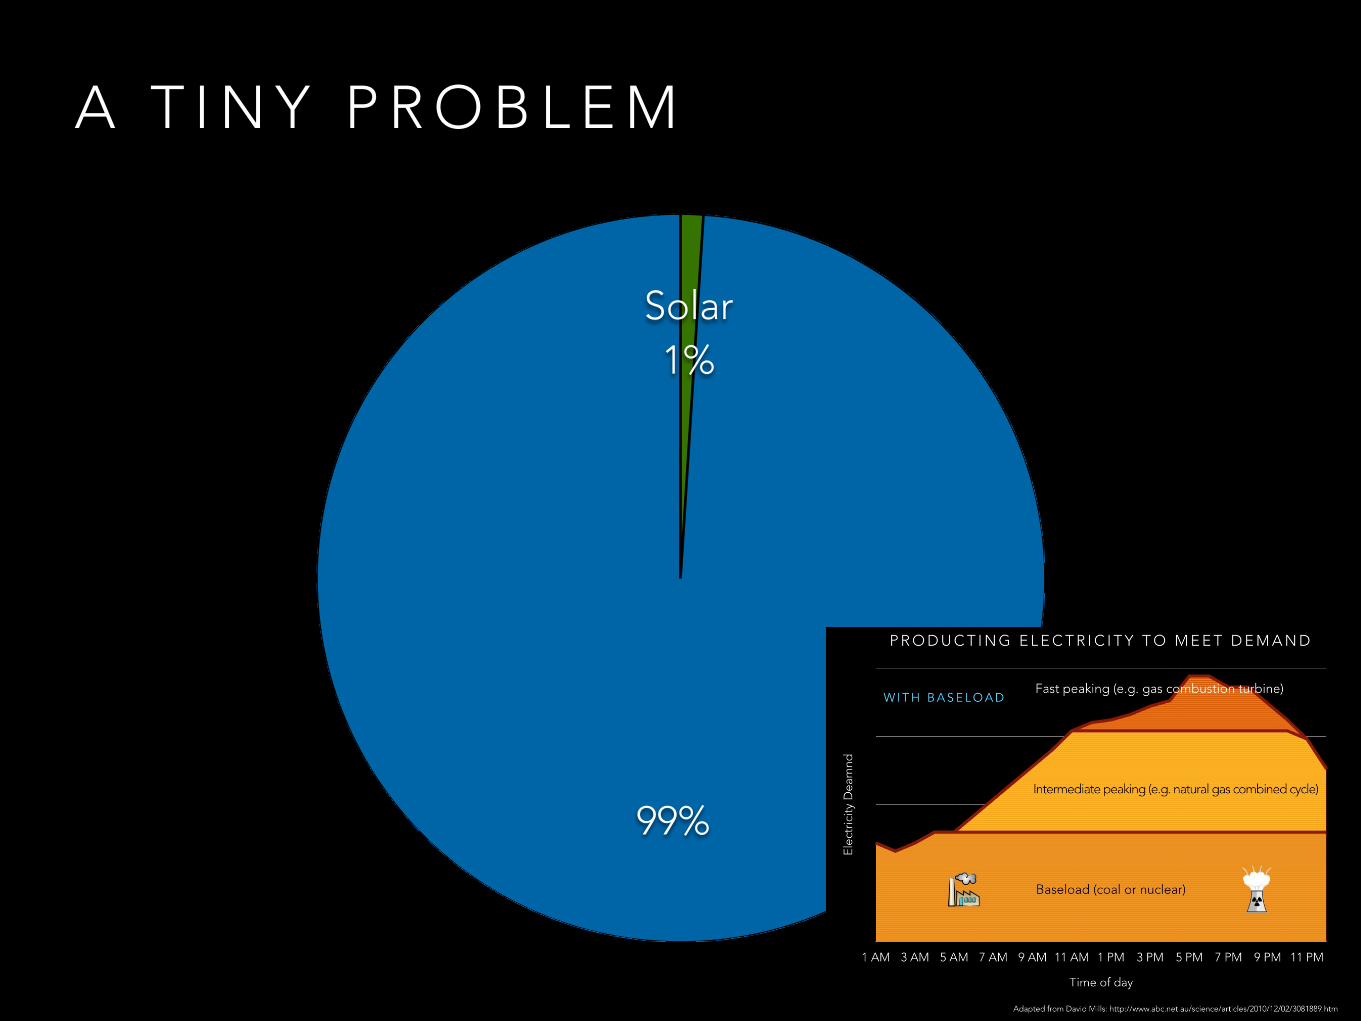
A T I N Y P R O B L E M
99%
Solar 1%
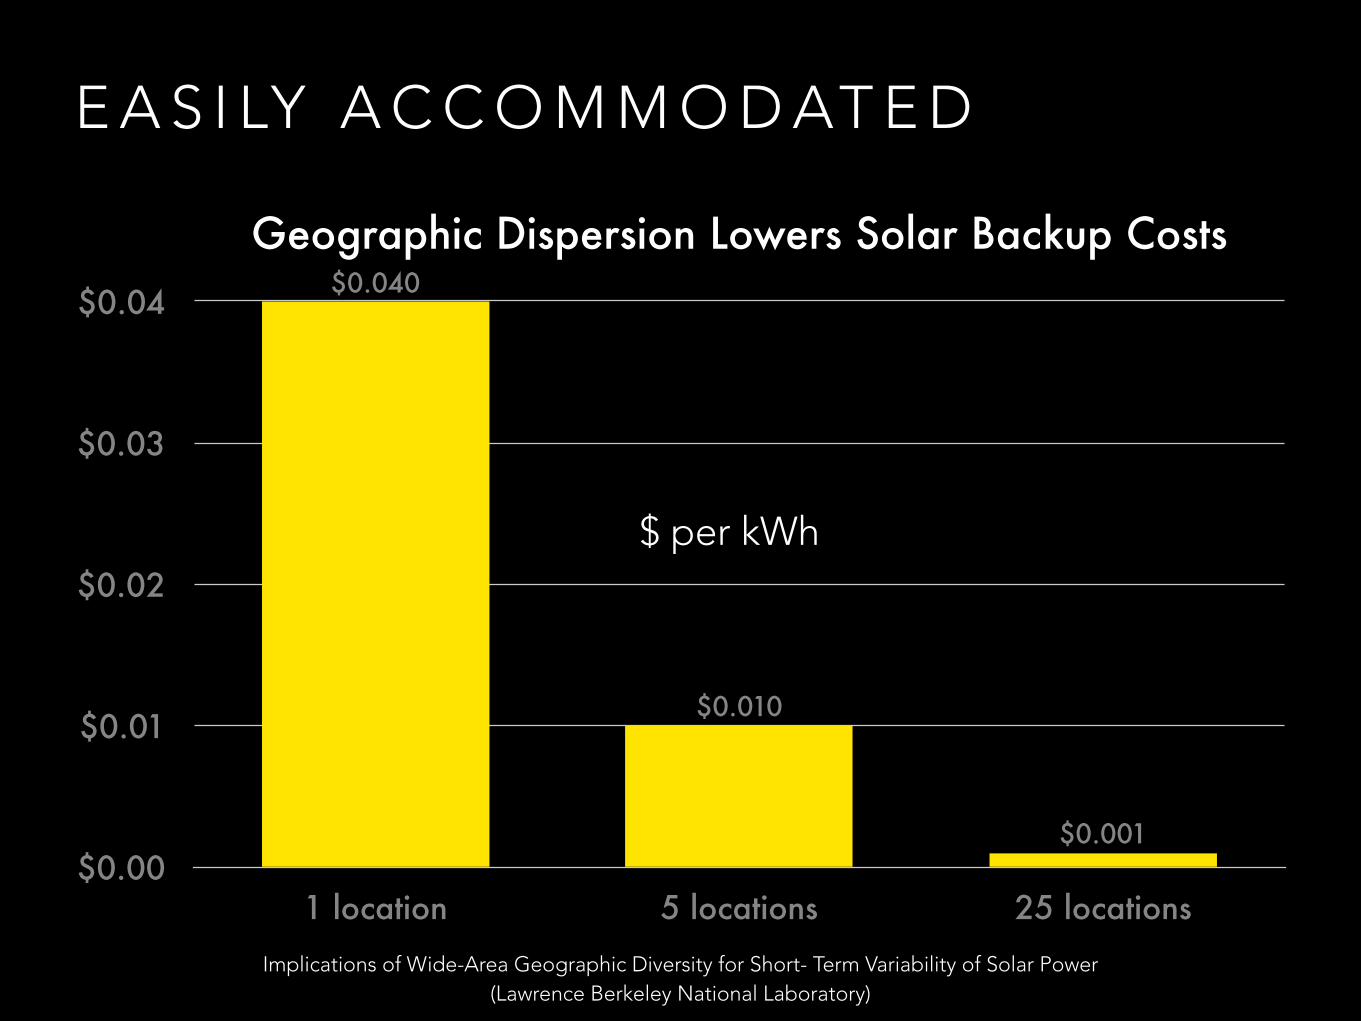
E A S I LY A C C O M M O D AT E D
Geographic Dispersion Lowers Solar Backup Costs
$0.00
$0.01
$0.02
$0.03
$0.04
1 location 5 locations 25 locations
$0.001
$0.010
$0.040
$ per kWh
Implications of Wide-Area Geographic Diversity for Short- Term Variability of Solar Power (Lawrence Berkeley National Laboratory)
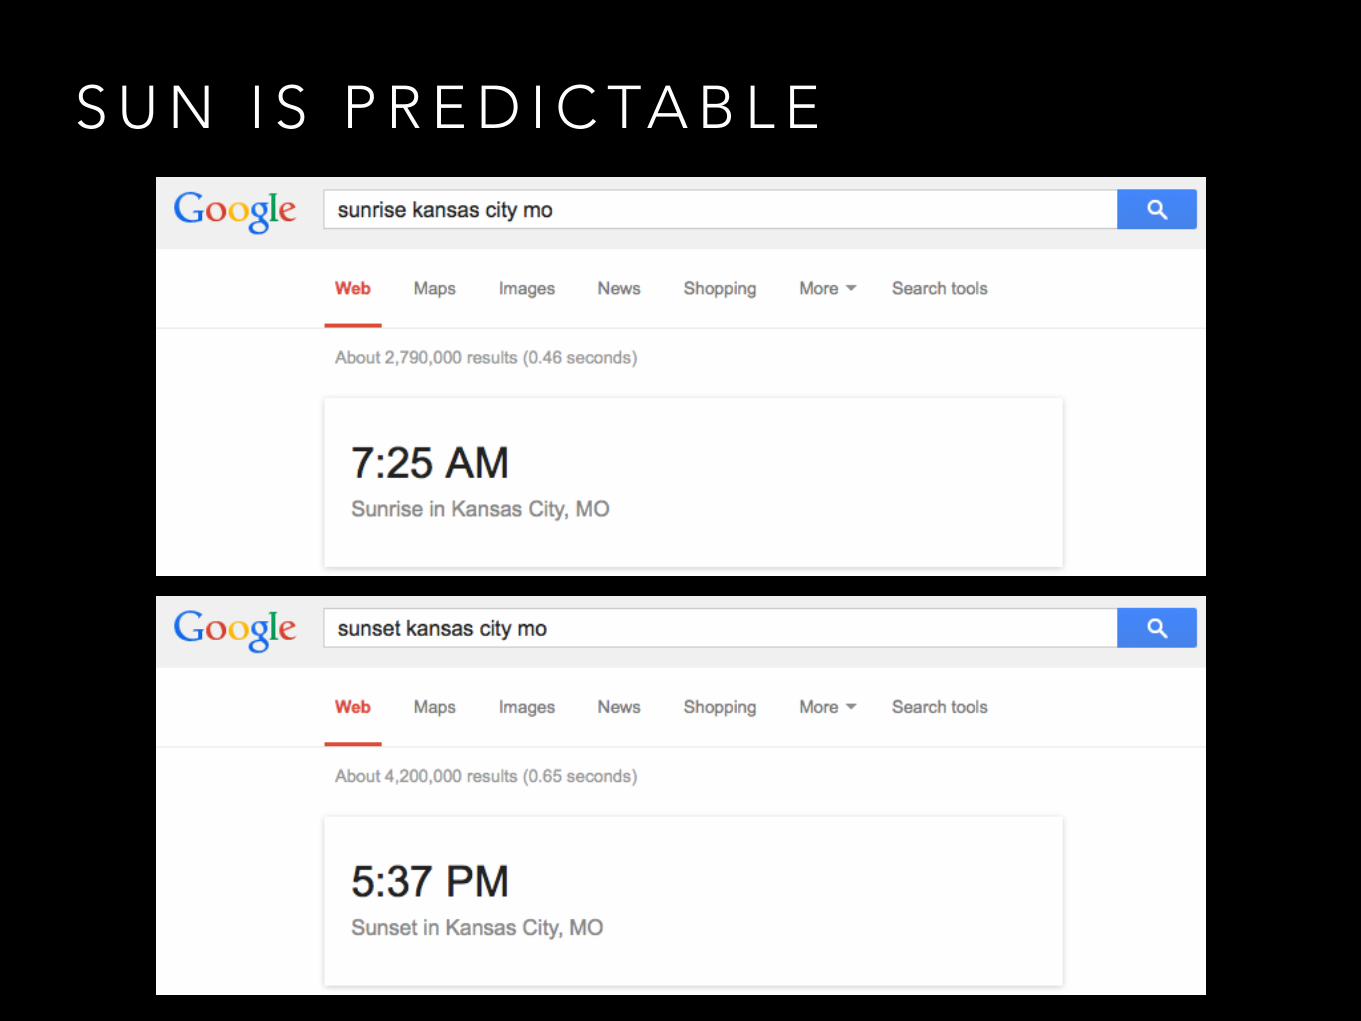
S U N I S P R E D I C TA B L E
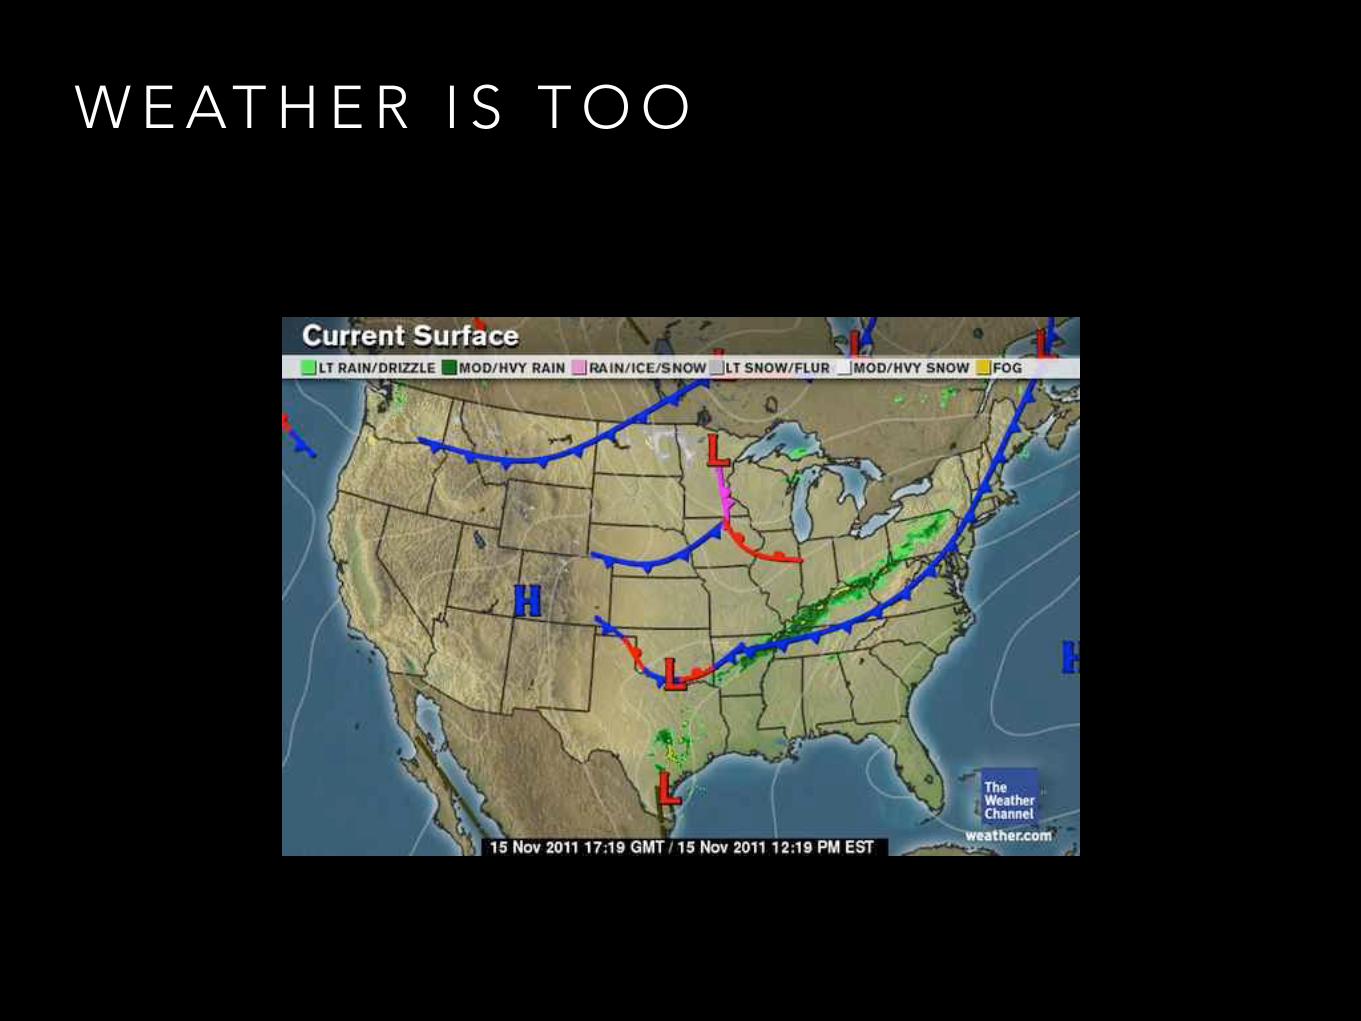
W E AT H E R I S T O O
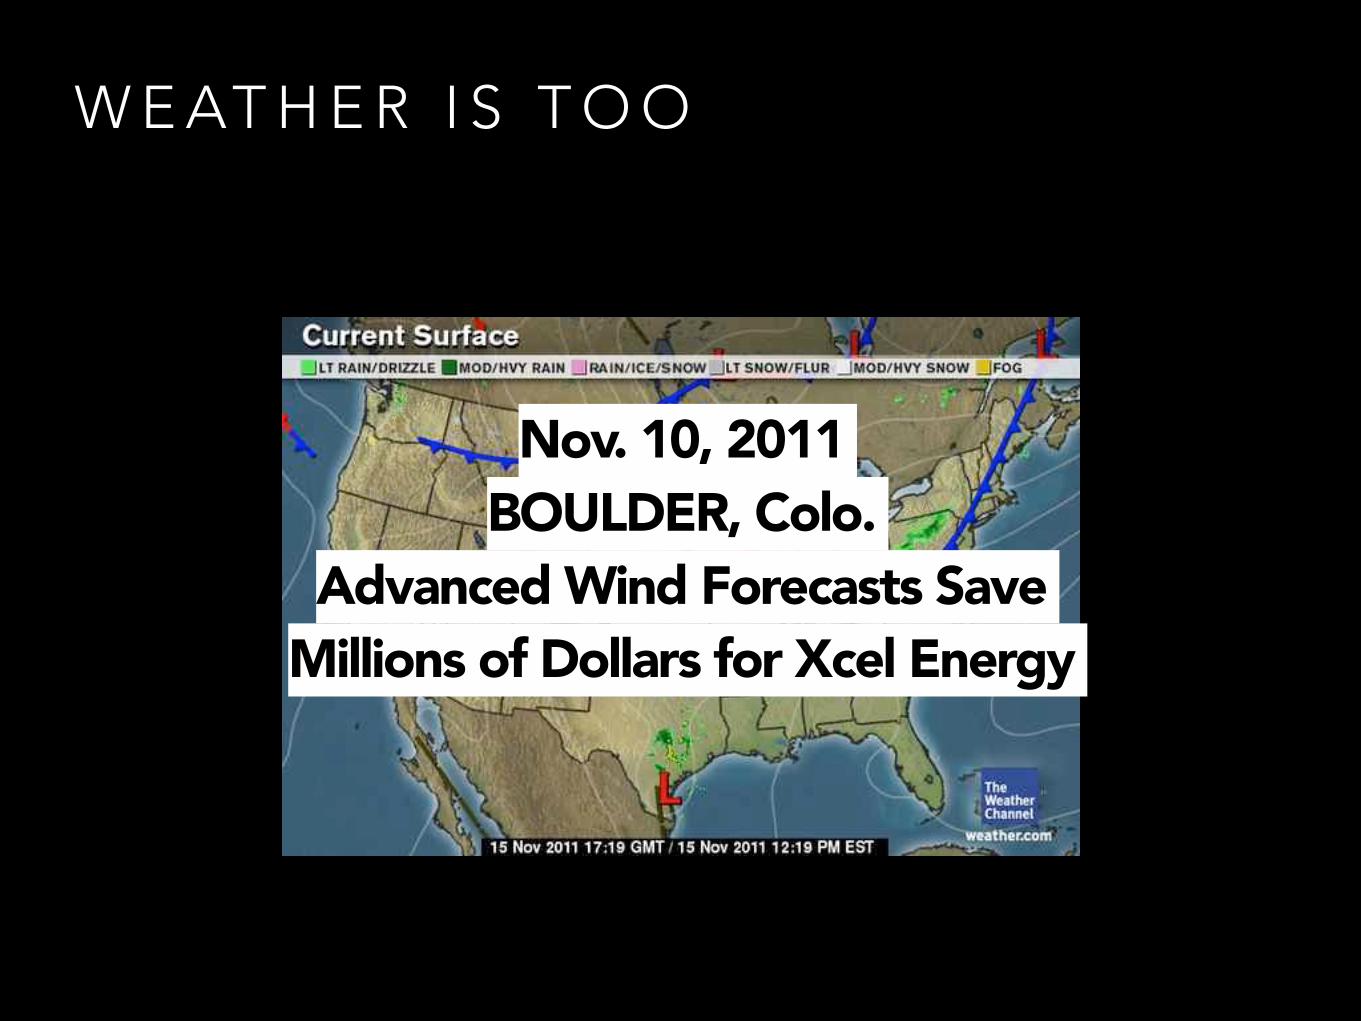
W E AT H E R I S T O O
Nov. 10, 2011 BOULDER, Colo.
Advanced Wind Forecasts Save Millions of Dollars for Xcel Energy

G R E AT O P P O R T U N I T Y
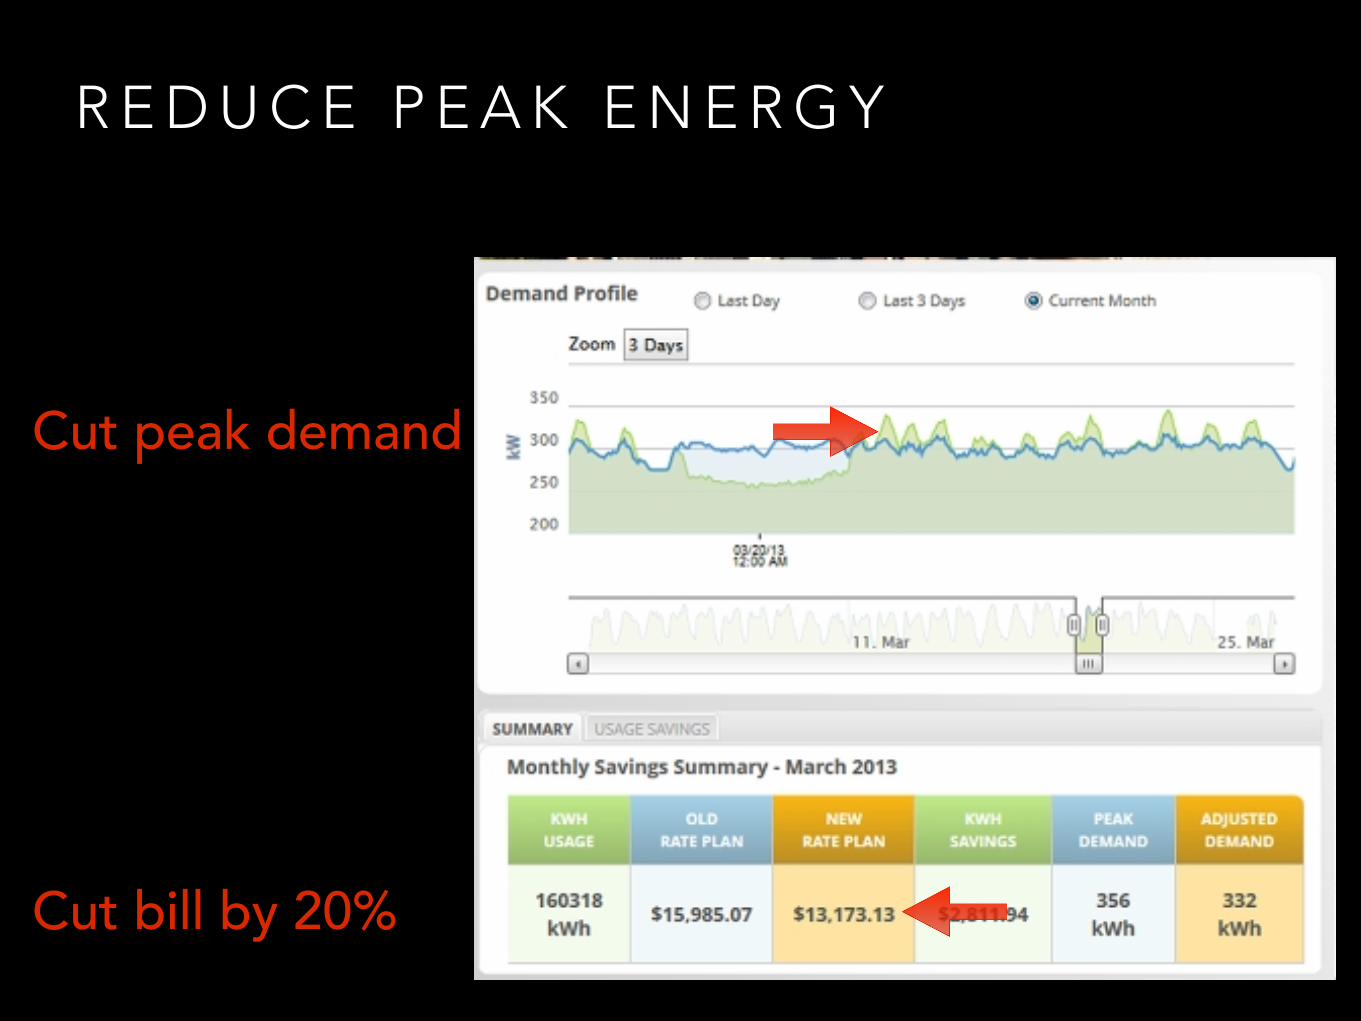
R E D U C E P E A K E N E R G Y
Cut peak demand
Cut bill by 20%

S AV E M O N E Y
VirginiaSolar saves money for
every Habitat house in VA
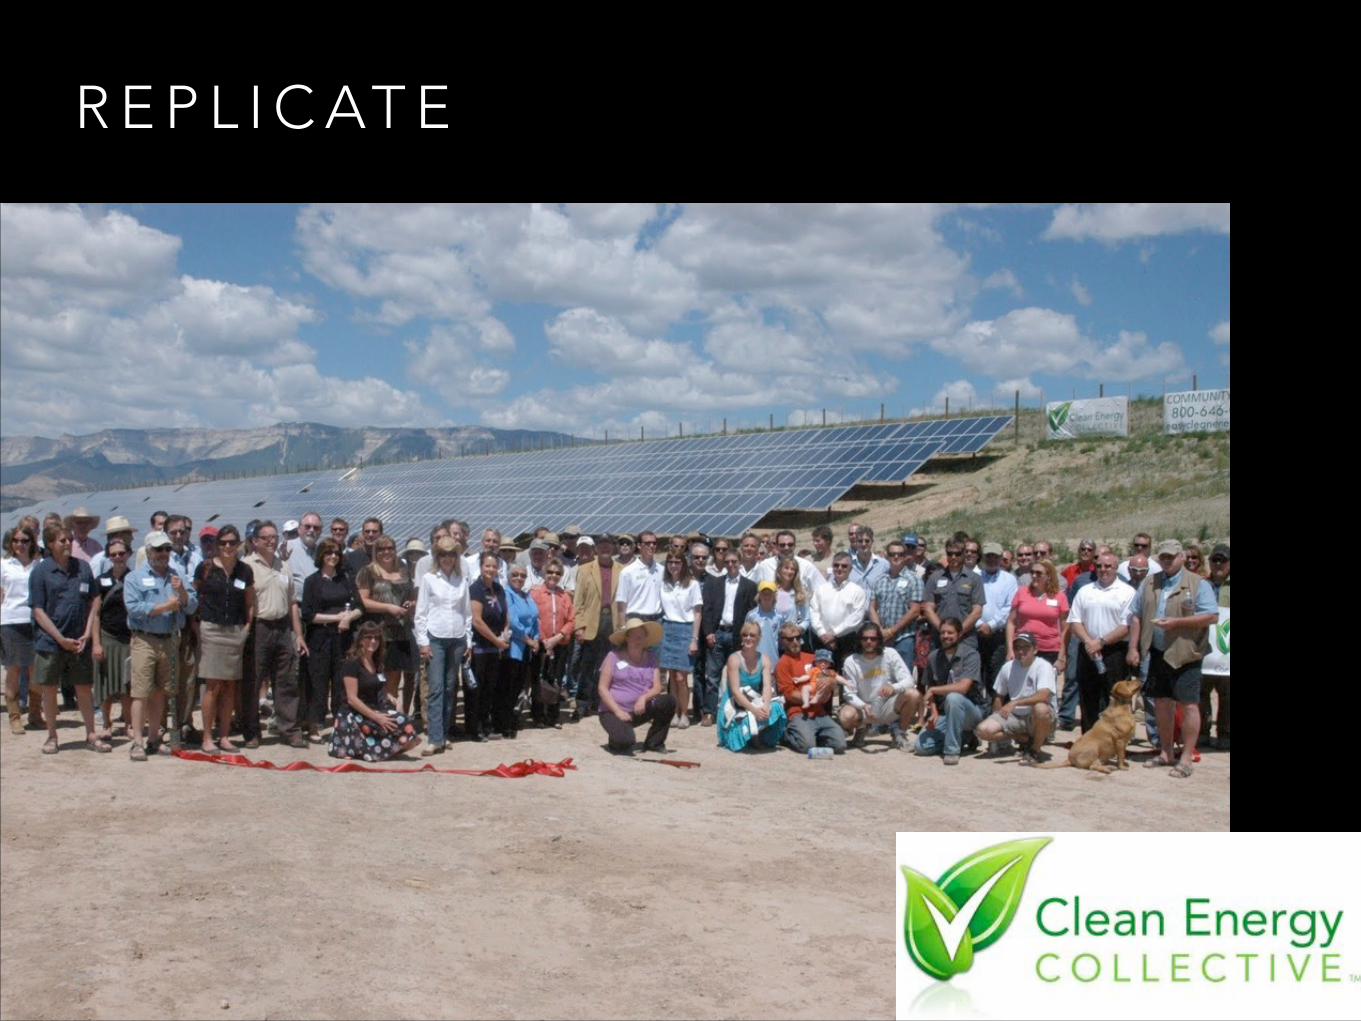
R E P L I C AT E
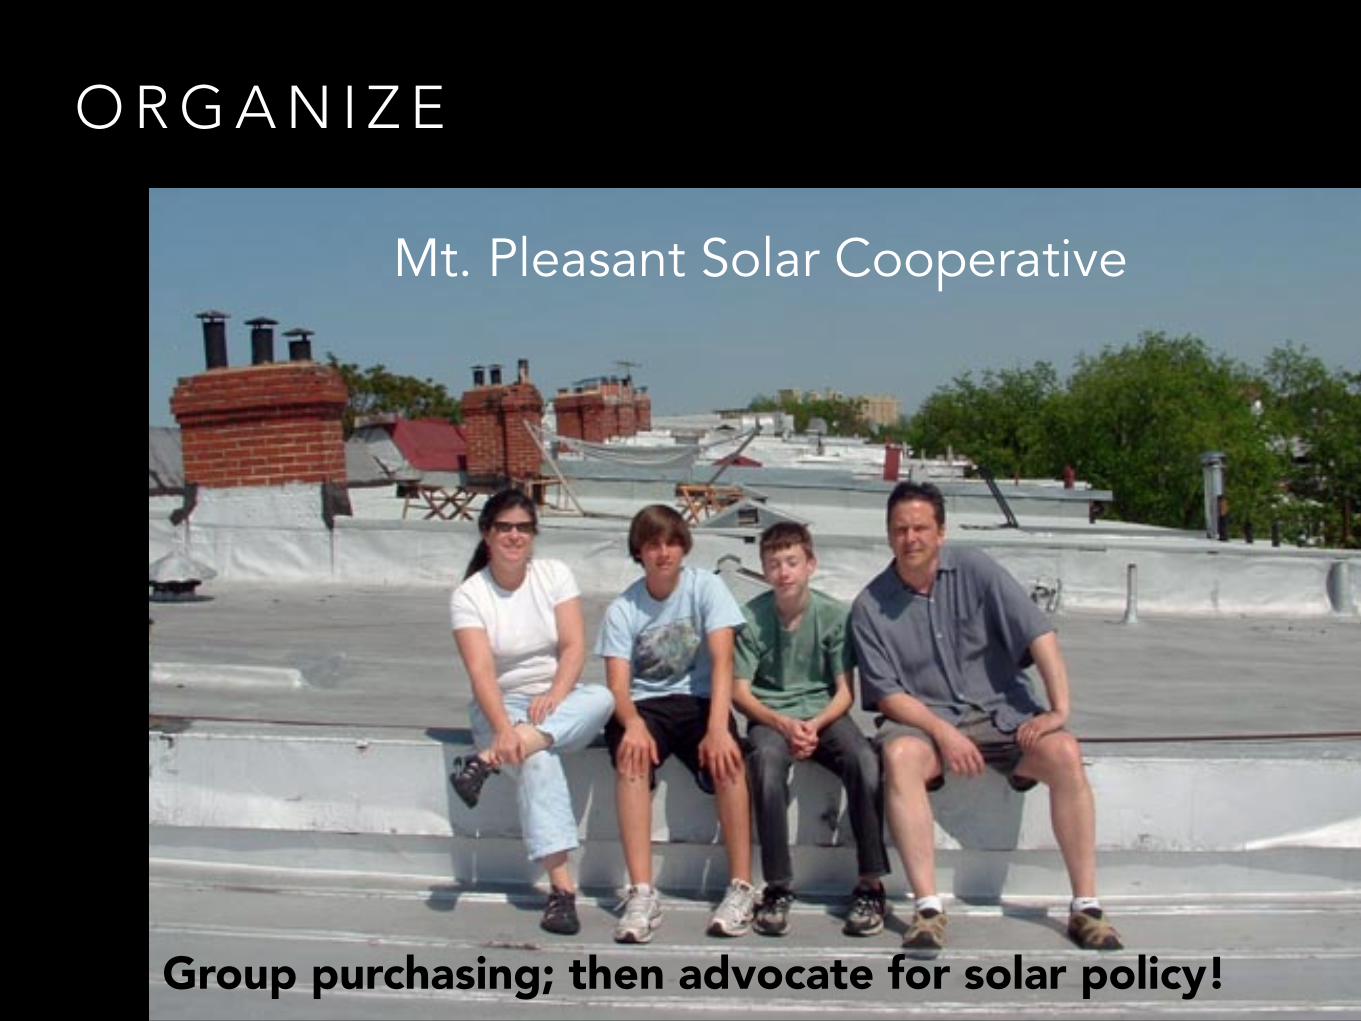
O R G A N I Z E
Group purchasing; then advocate for solar policy!
Mt. Pleasant Solar Cooperative

P O L I C Y
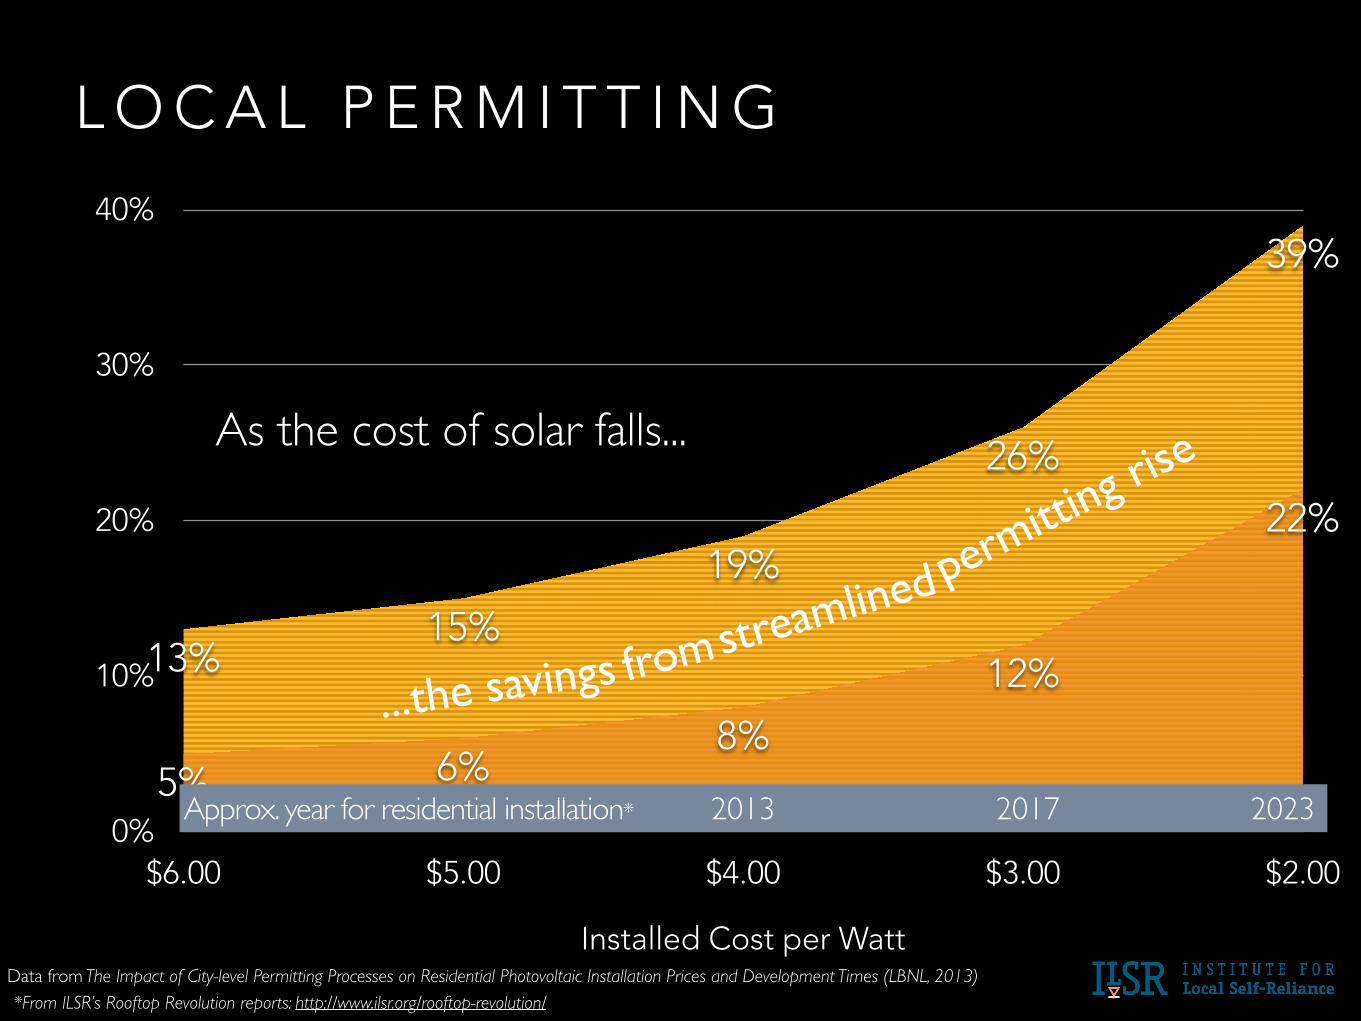
0%
10%
20%
30%
40%
Installed Cost per Watt
$6.00 $5.00 $4.00 $3.00 $2.00
13%15%
19%
26%
39%
5% 6%8%
12%
22%
L O C A L P E R M I T T I N G
Data from The Impact of City-level Permitting Processes on Residential Photovoltaic Installation Prices and Development Times (LBNL, 2013)
...the savings
Approx. year for residential installation* 2013 2017 2023
*From ILSR’s Rooftop Revolution reports: http://www.ilsr.org/rooftop-revolution/
As the cost of solar falls...
from
permitting ri
se
streamlined
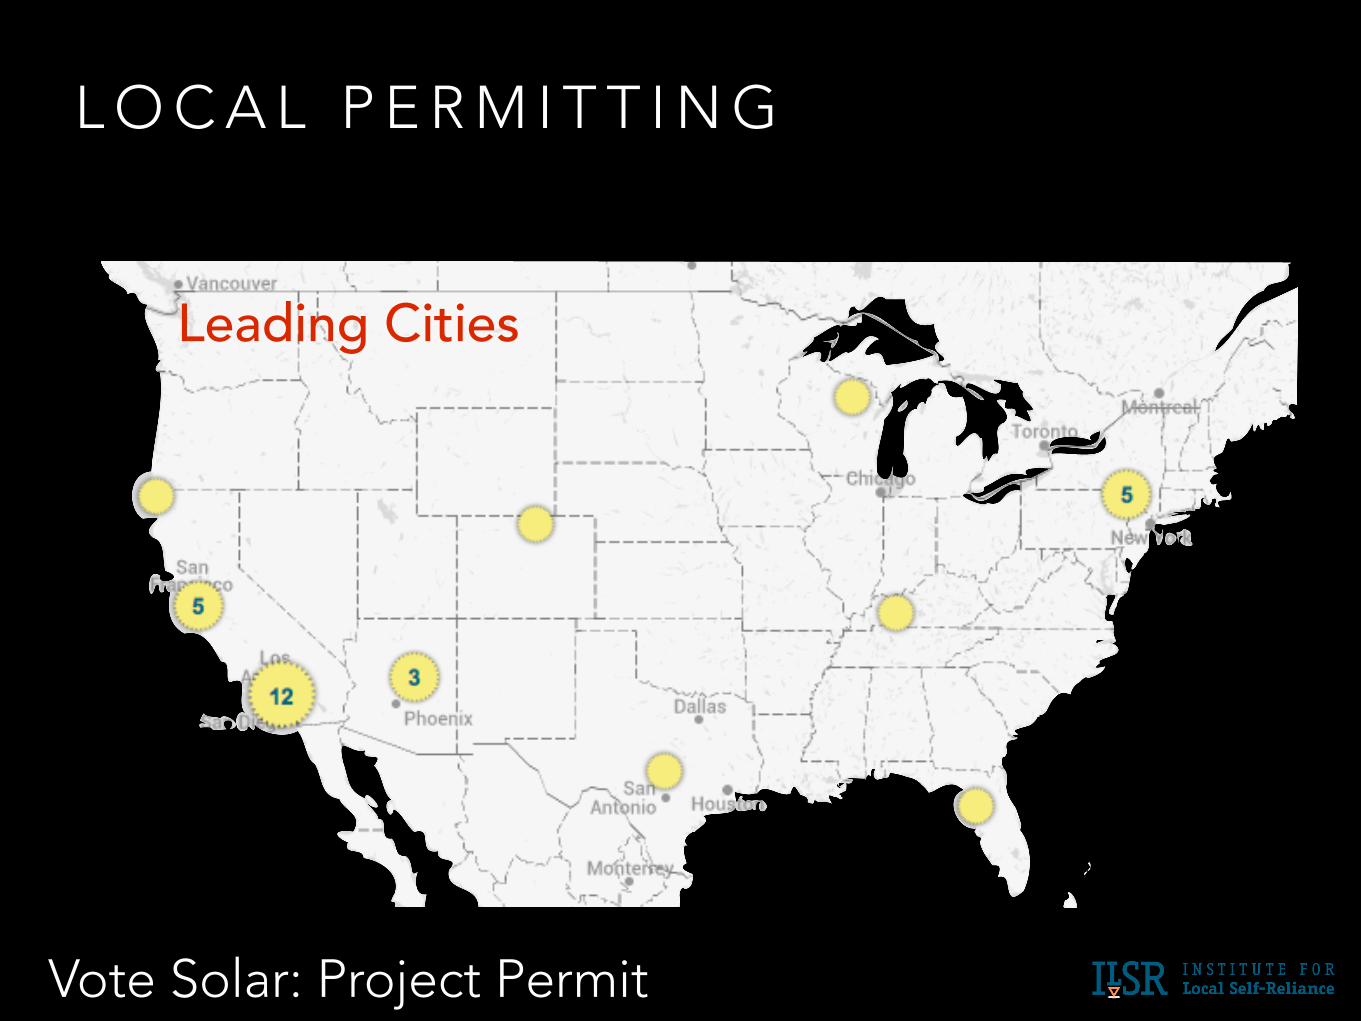
L O C A L P E R M I T T I N G
Leading Cities
Vote Solar: Project Permit
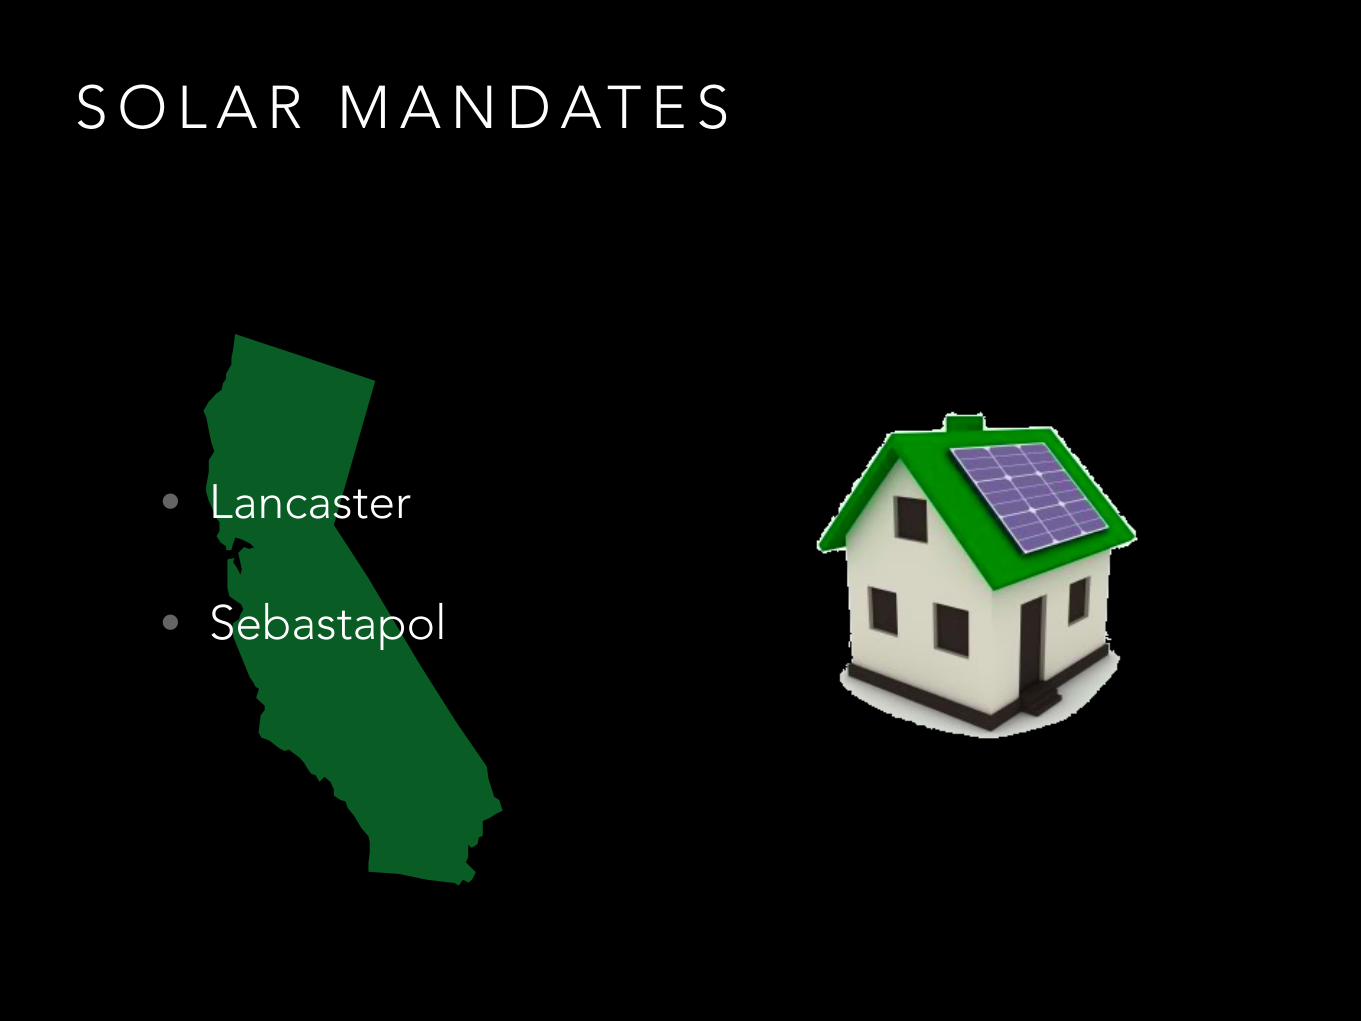
S O L A R M A N D AT E S
• Lancaster
• Sebastapol
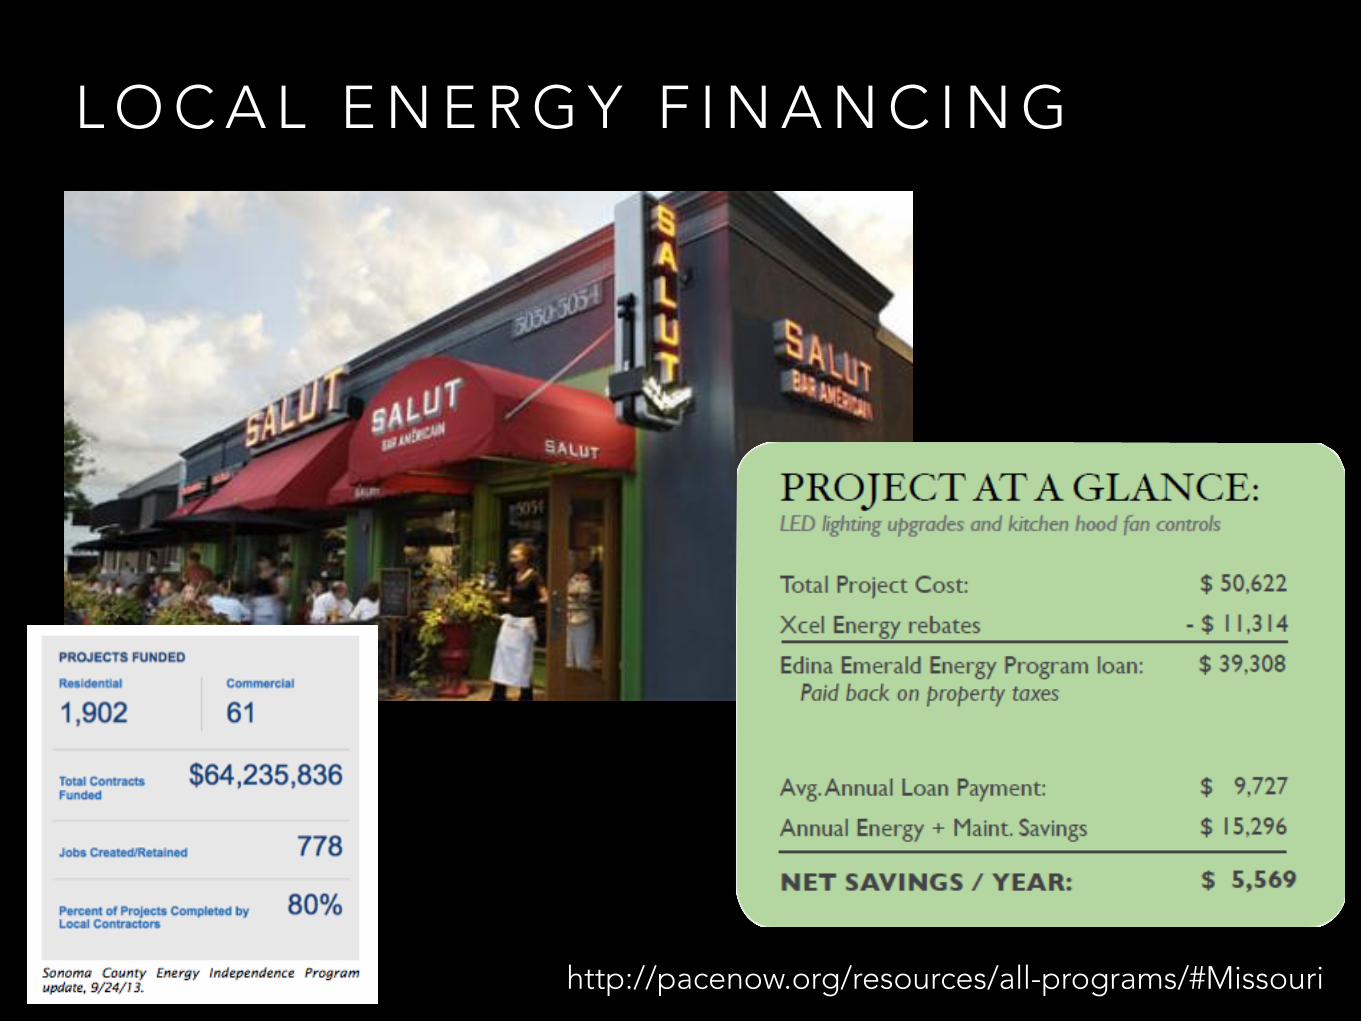
L O C A L E N E R G Y F I N A N C I N G
http://pacenow.org/resources/all-programs/#Missouri

VA L U E O F S O L A R
Karl Rabago
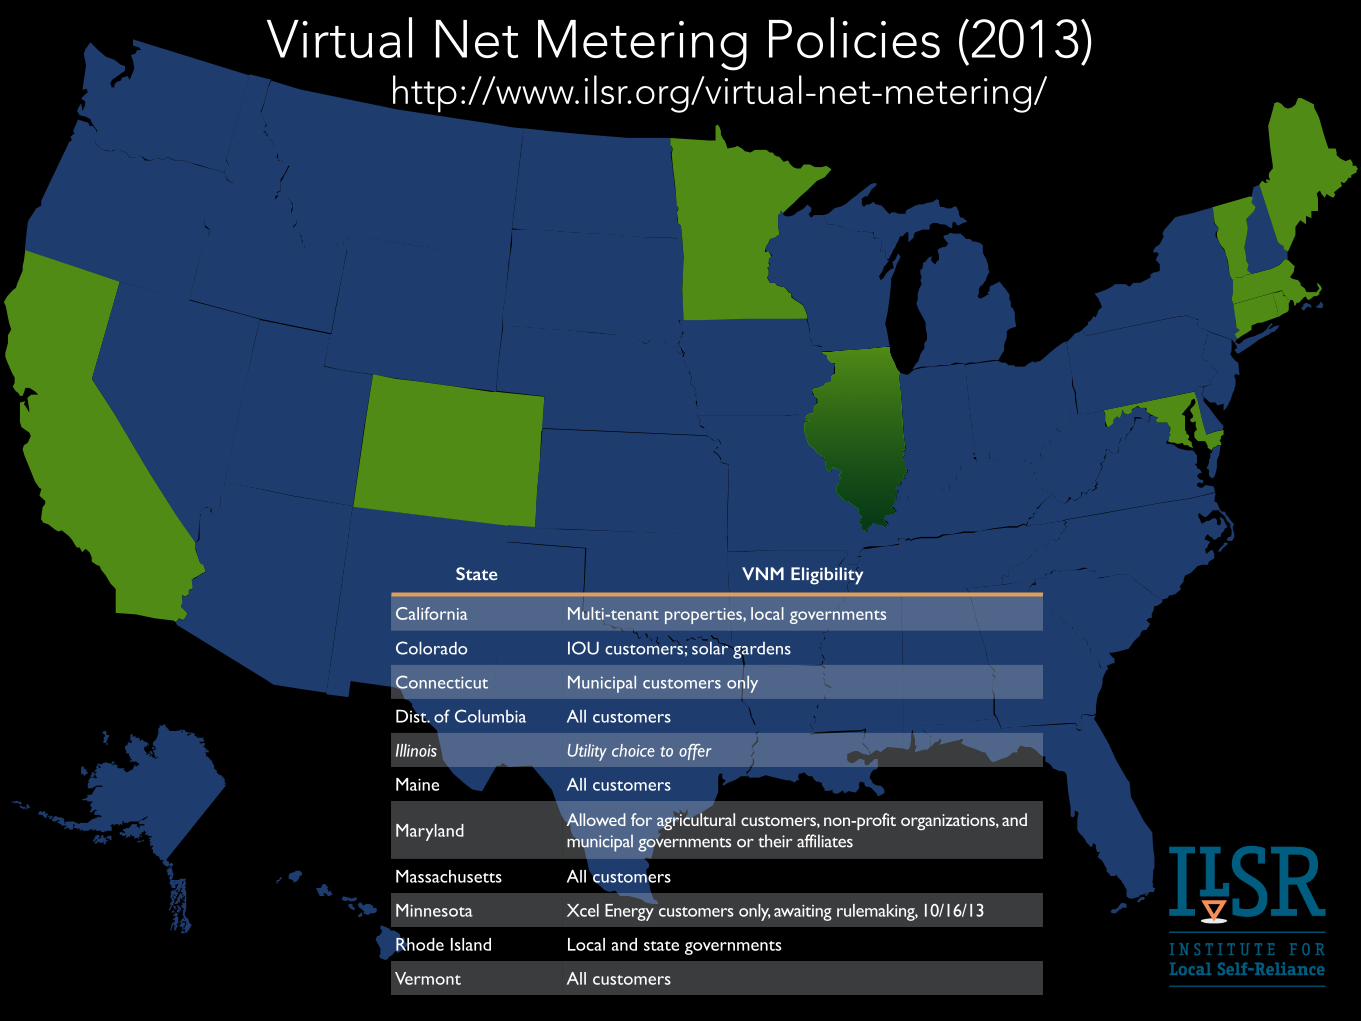
Virtual Net Metering Policies (2013)
State VNM Eligibility
California Multi-tenant properties, local governments
Colorado IOU customers; solar gardens
Connecticut Municipal customers only
Dist. of Columbia All customers
Illinois Utility choice to offer
Maine All customers
Maryland Allowed for agricultural customers, non-profit organizations, and municipal governments or their affiliates
Massachusetts All customers
Minnesota Xcel Energy customers only, awaiting rulemaking, 10/16/13
Rhode Island Local and state governments
Vermont All customers
http://www.ilsr.org/virtual-net-metering/
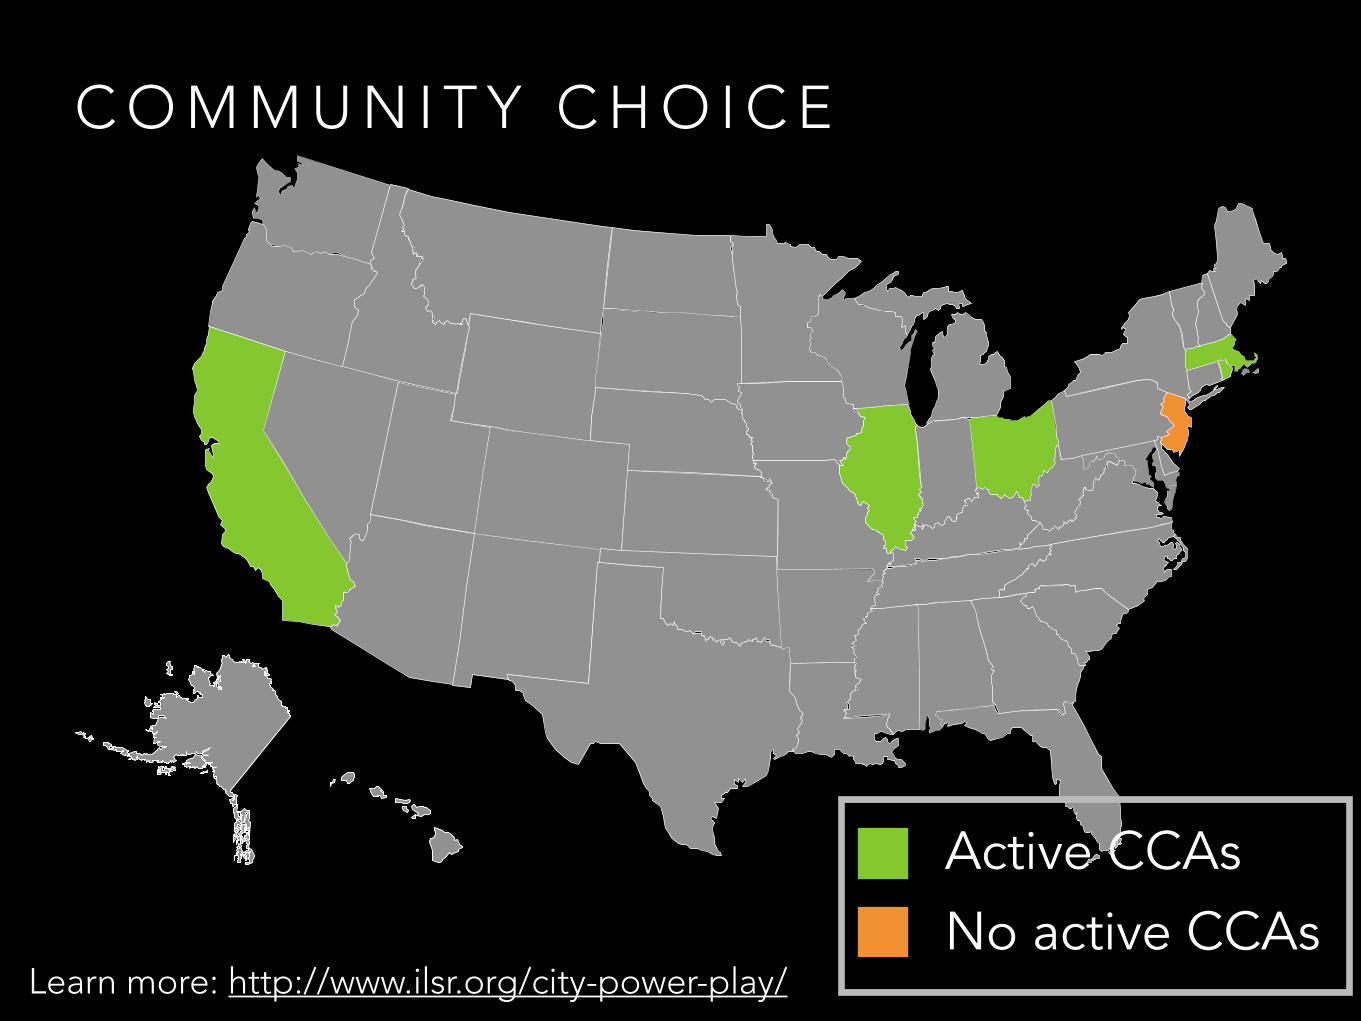
Active CCAs No active CCAs
C O M M U N I T Y C H O I C E
Learn more: http://www.ilsr.org/city-power-play/
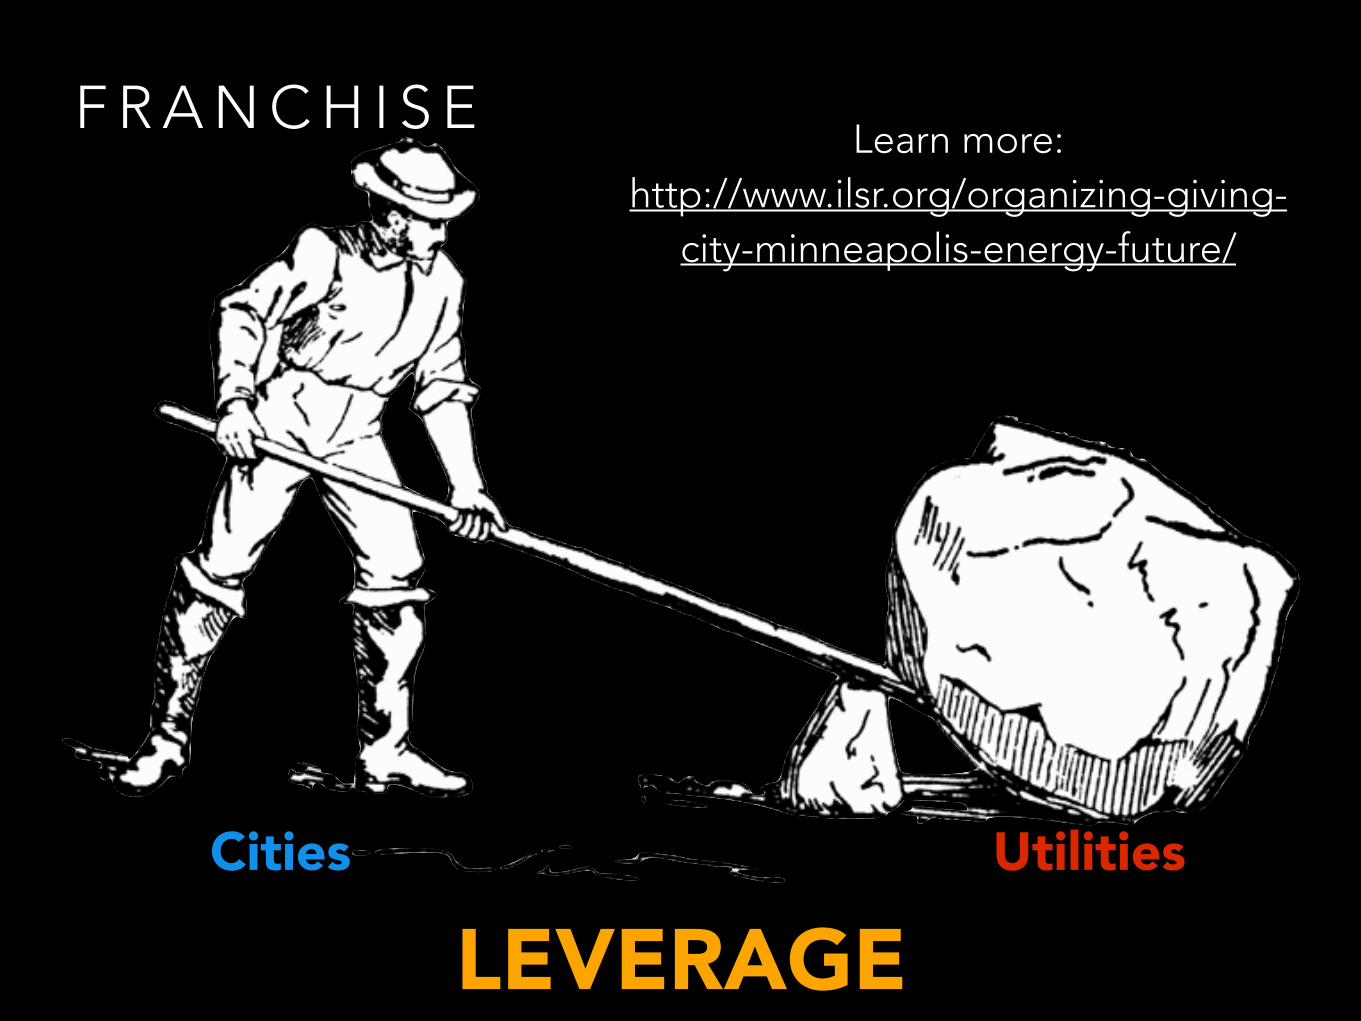
F R A N C H I S E
LEVERAGEUtilitiesCities
Learn more: http://www.ilsr.org/organizing-giving-
city-minneapolis-energy-future/
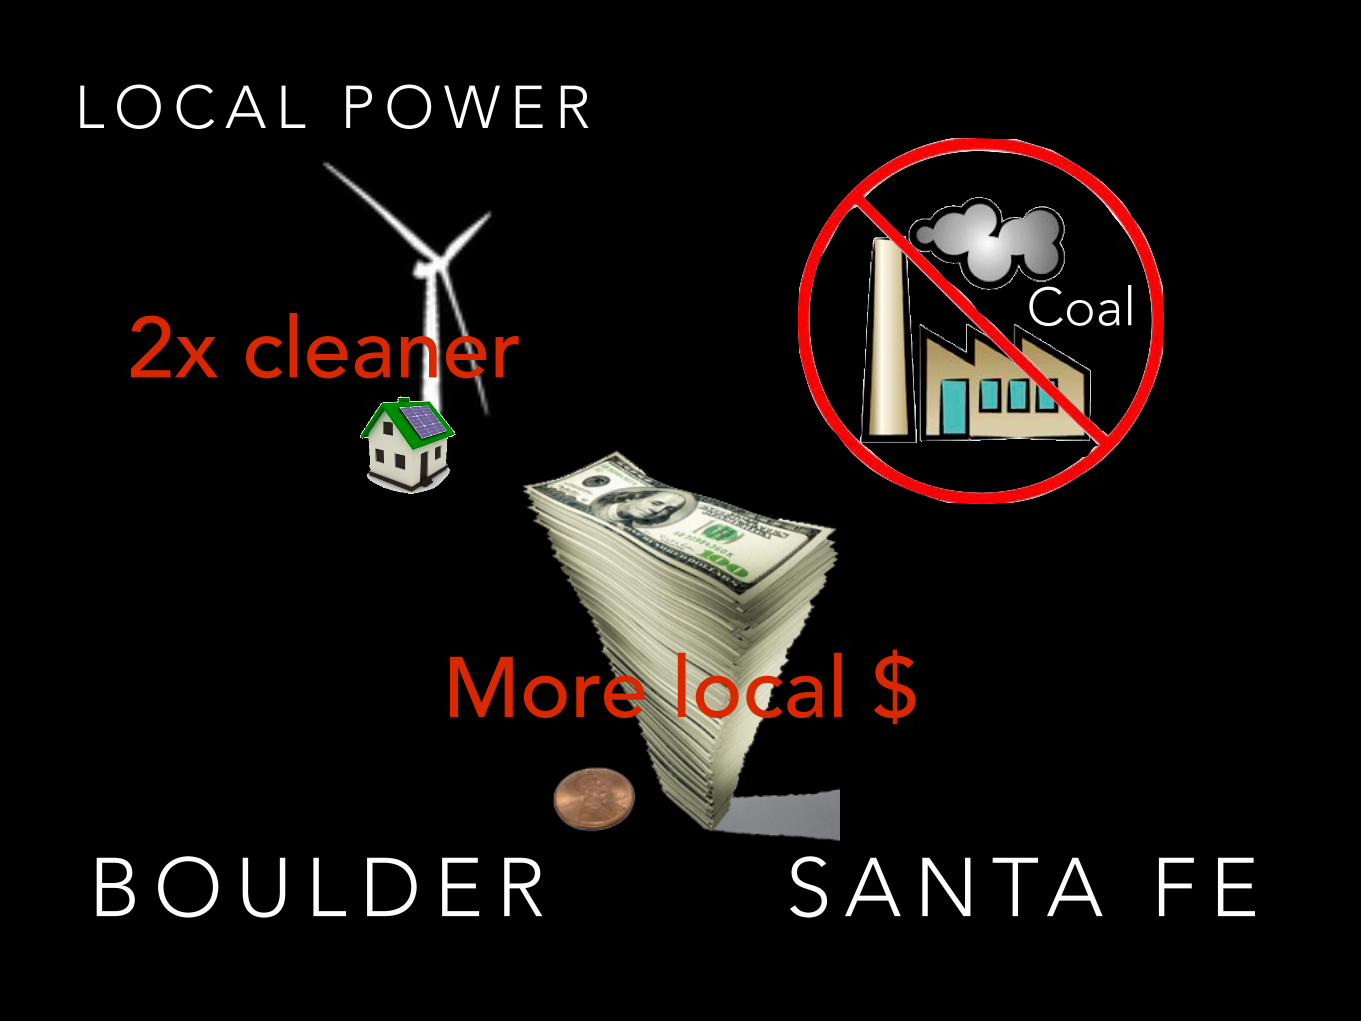
L O C A L P O W E R
S A N TA F EB O U L D E R
2x cleaner Coal
More local $
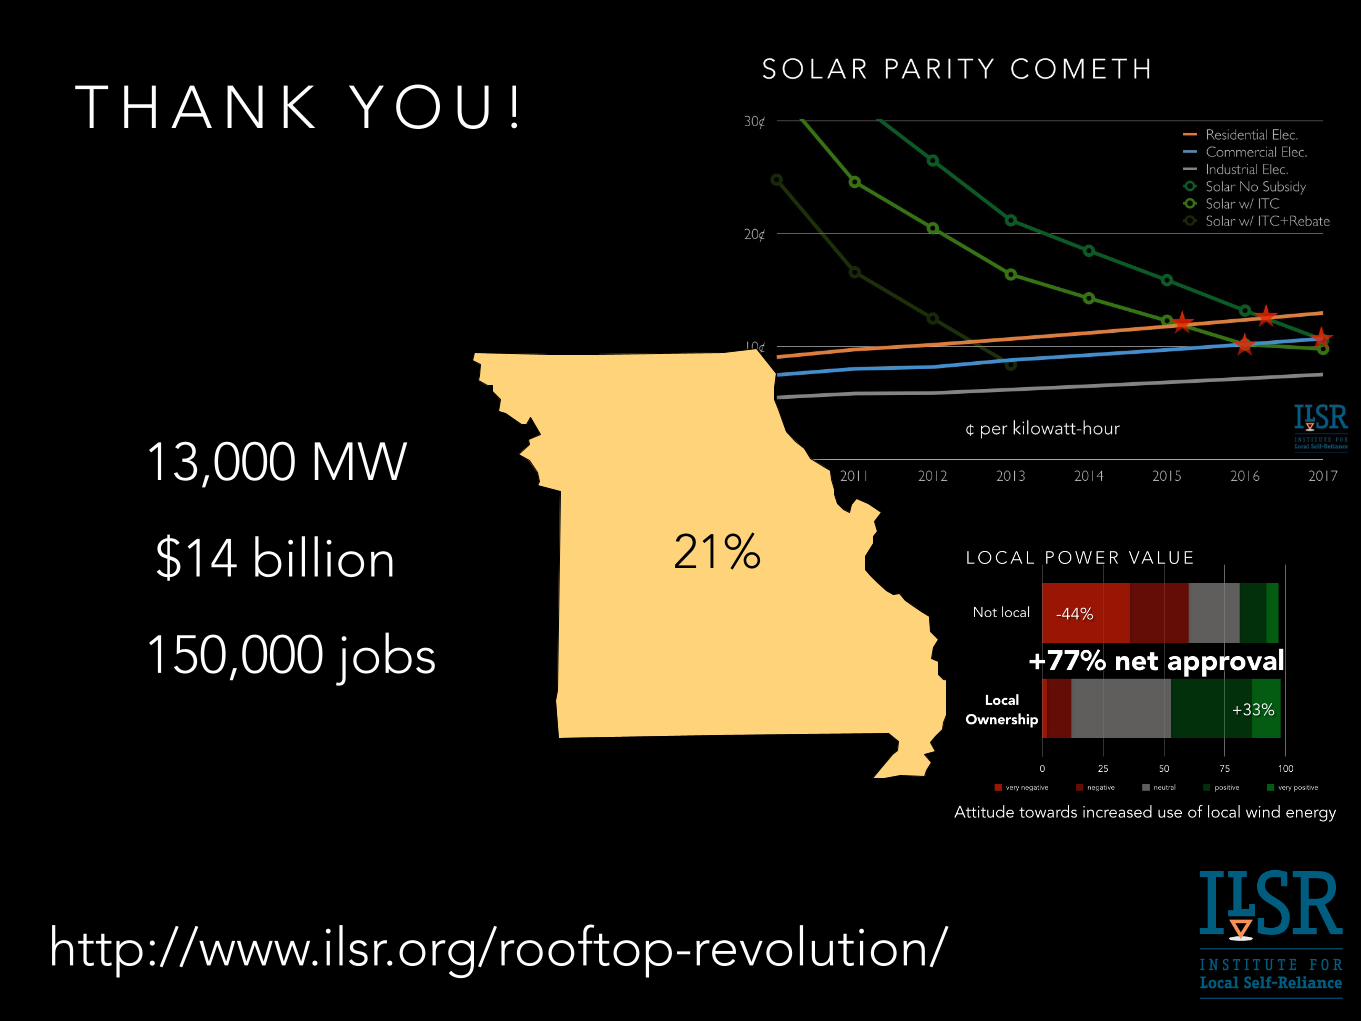
T H A N K Y O U !
21%
13,000 MW
$14 billion
150,000 jobs
http://www.ilsr.org/rooftop-revolution/