Embed Size (px)
Citation preview
Precision dairy farming overseasExperiences and developments from the Netherlands
Henk Hogeveen and Wilma Steeneveld
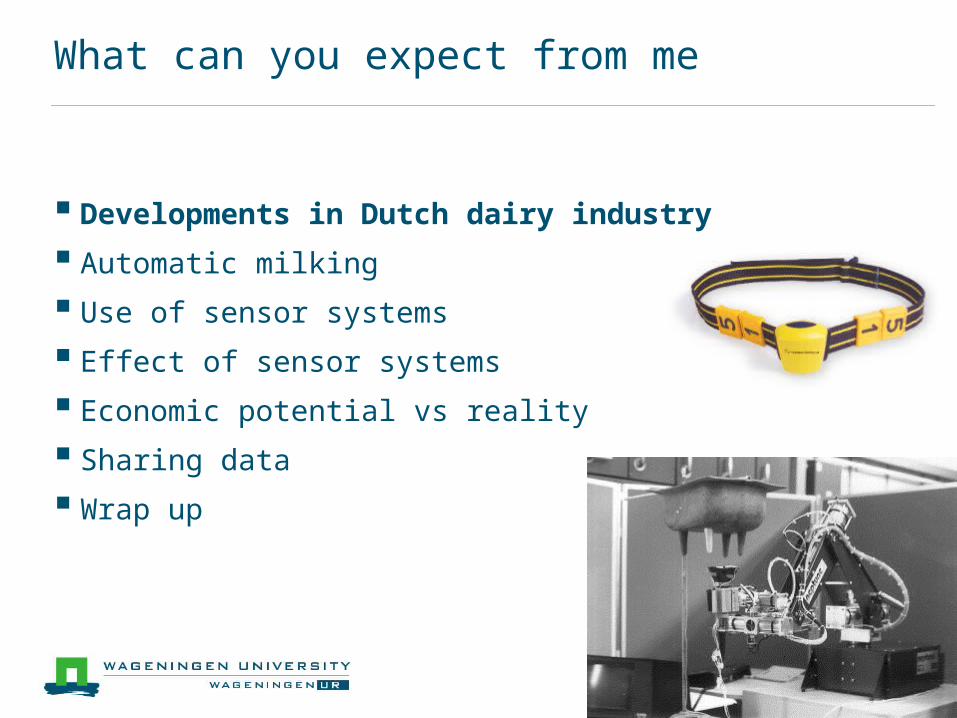
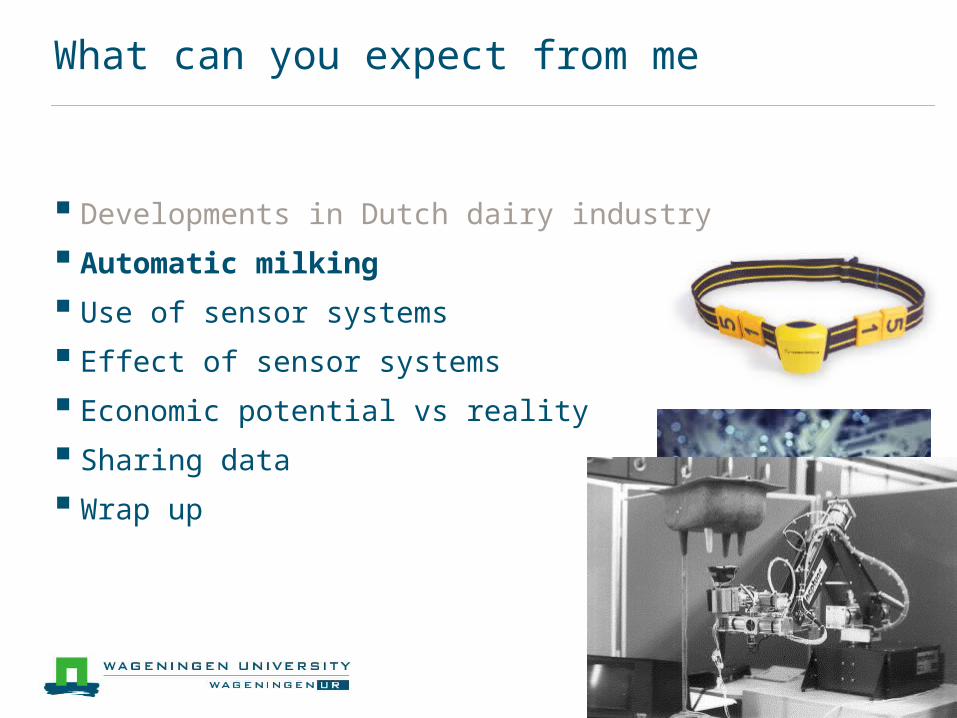
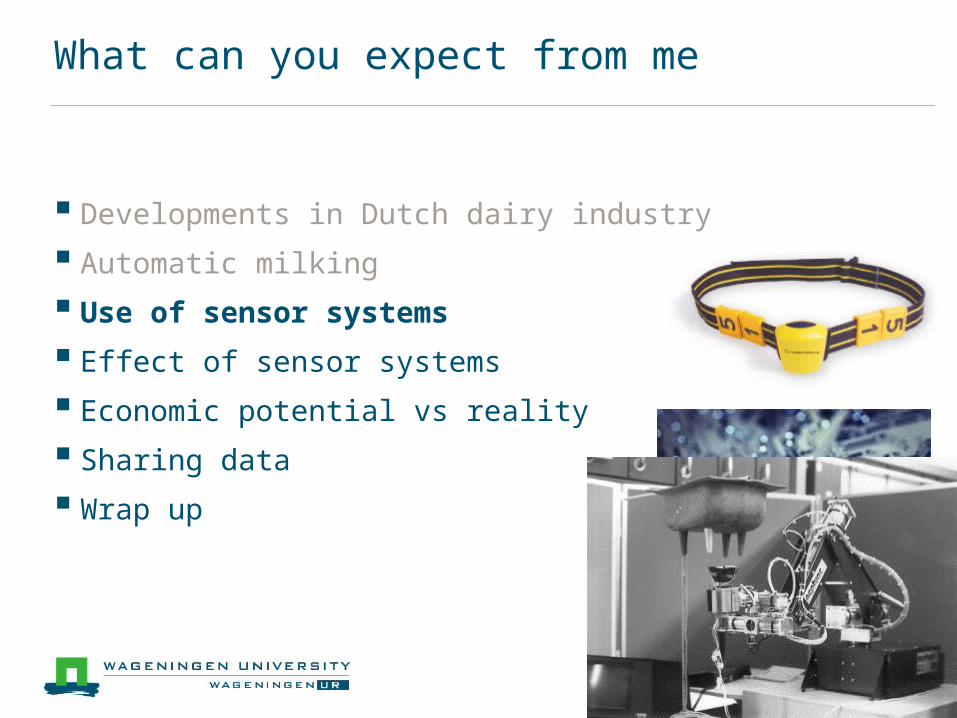
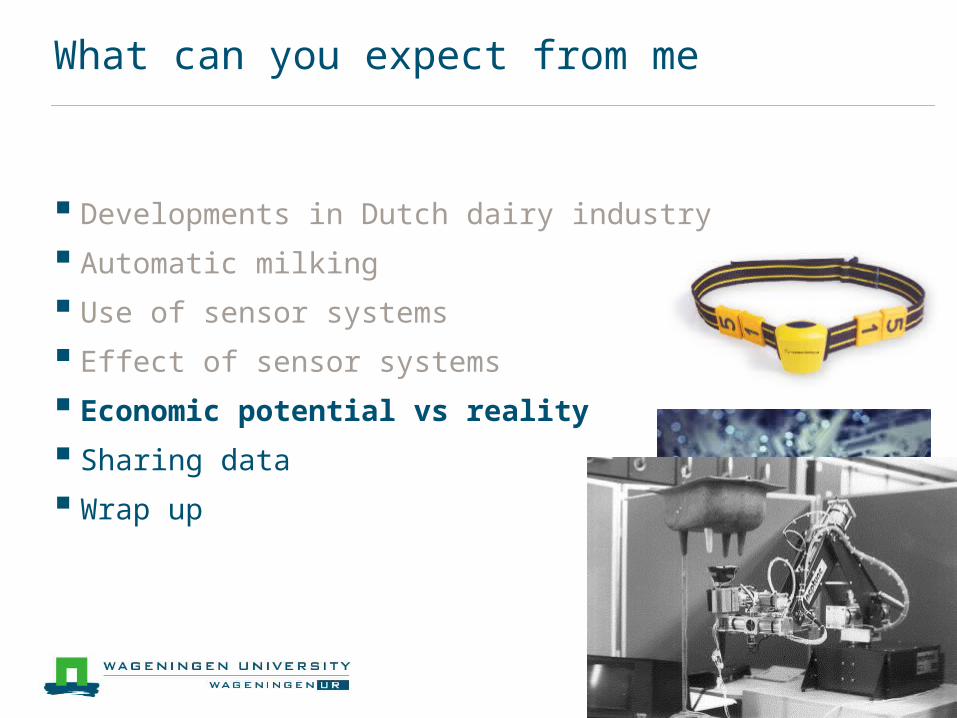
What can you expect from me
Developments in Dutch dairy industry
Automatic milking
Use of sensor systems
Effect of sensor systems
Economic potential vs reality
Sharing data
Wrap up
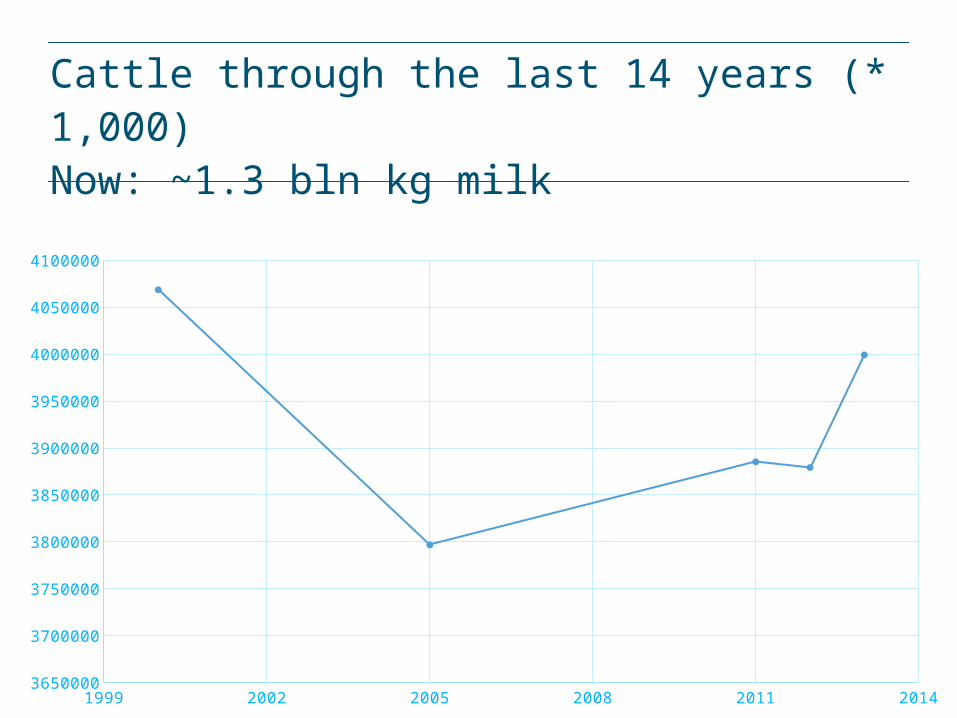
Cattle through the last 14 years (* 1,000)Now: ~1.3 bln kg milk
1999 2002 2005 2008 2011 20143650000
3700000
3750000
3800000
3850000
3900000
3950000
4000000
4050000
4100000
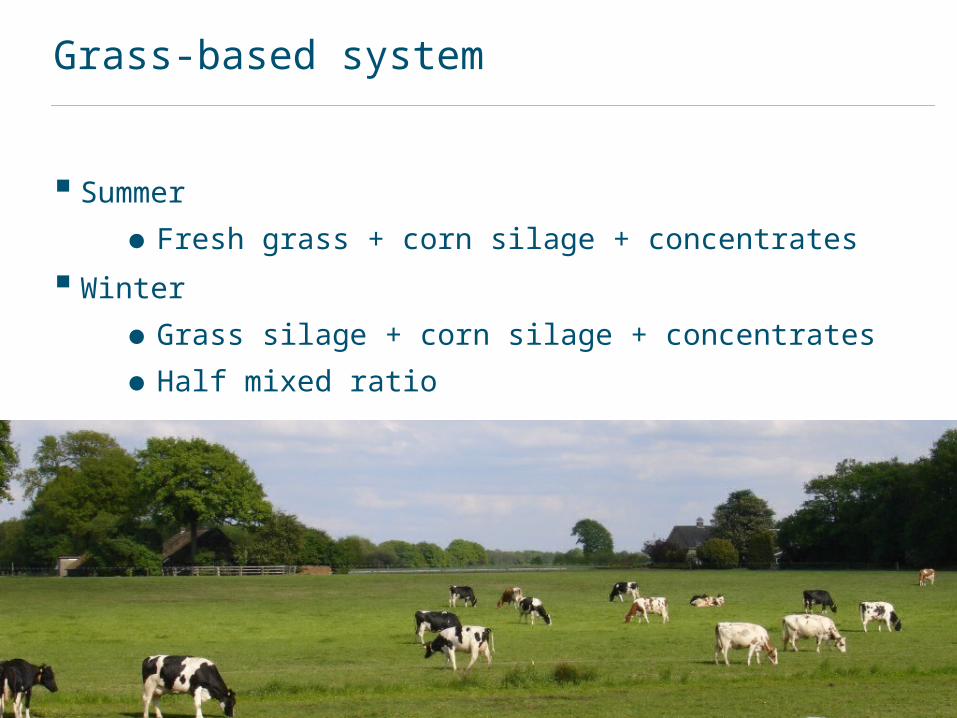
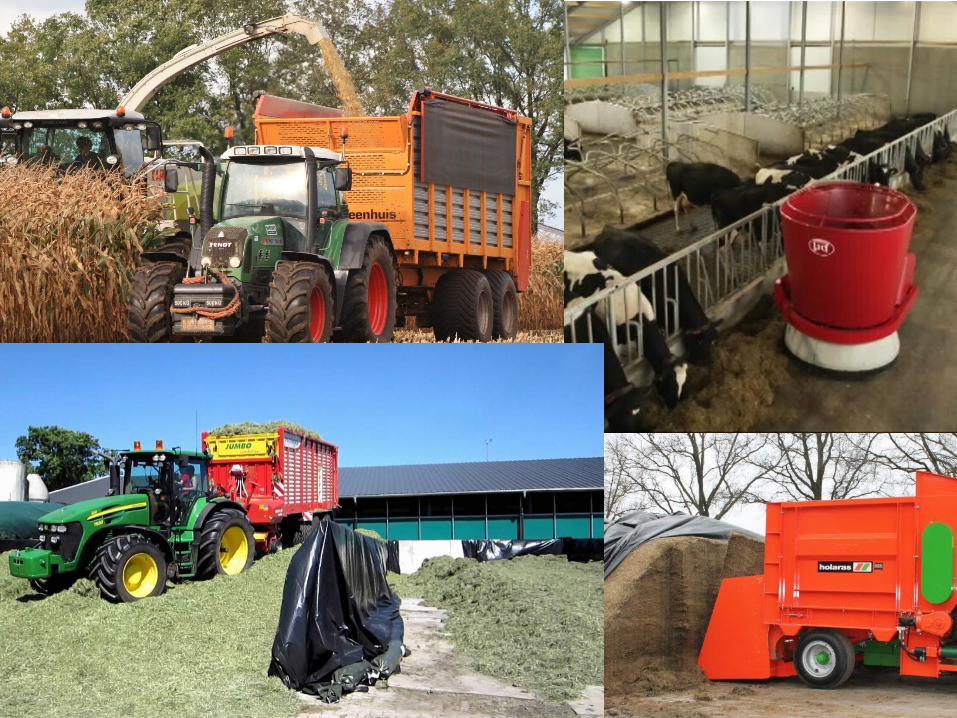
Grass-based system
Summer
●Fresh grass + corn silage + concentrates
Winter
●Grass silage + corn silage + concentrates
●Half mixed ratio
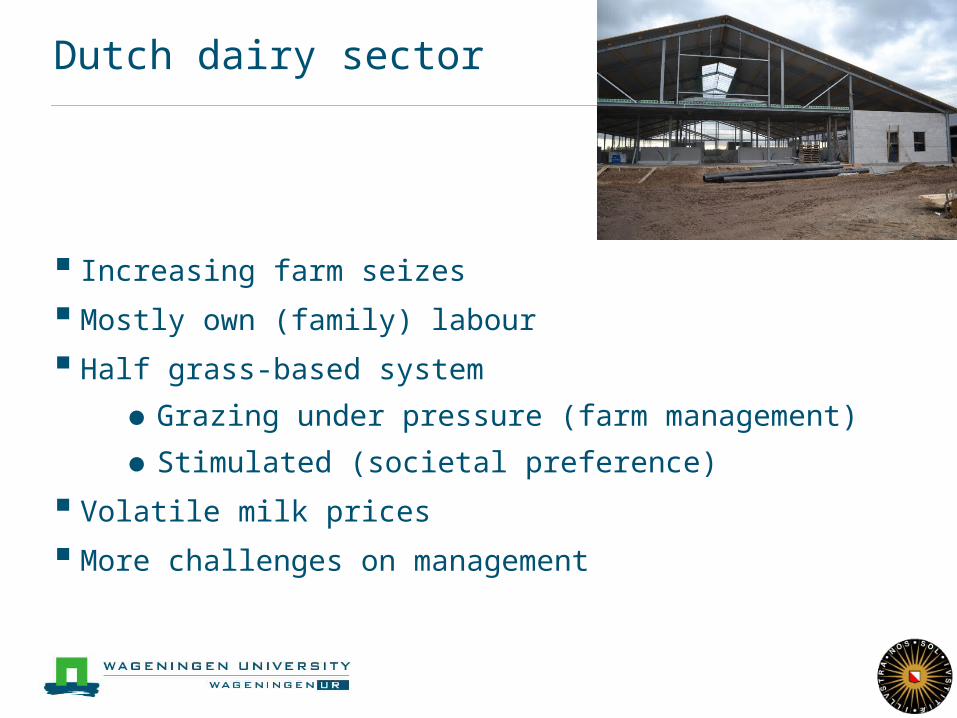
Dutch dairy sector
Increasing farm seizes
Mostly own (family) labour
Half grass-based system
●Grazing under pressure (farm management)
●Stimulated (societal preference)
Volatile milk prices
More challenges on management
and …..
Animal health is becoming more and more important
Stimulated by dairy industry
●Improvement of udder health
●Improvement of claw health
●Improvement of longevity
What can you expect from me
Developments in Dutch dairy industry
Automatic milking
Use of sensor systems
Effect of sensor systems
Economic potential vs reality
Sharing data
Wrap up
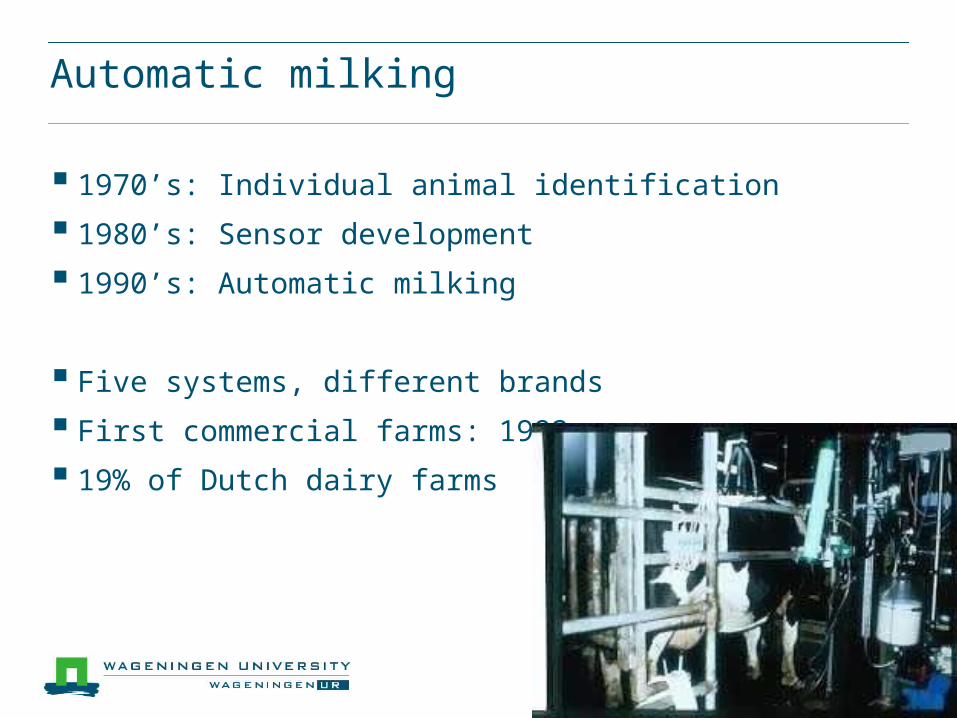
Automatic milking
1970’s: Individual animal identification
1980’s: Sensor development
1990’s: Automatic milking
Five systems, different brands
First commercial farms: 1992
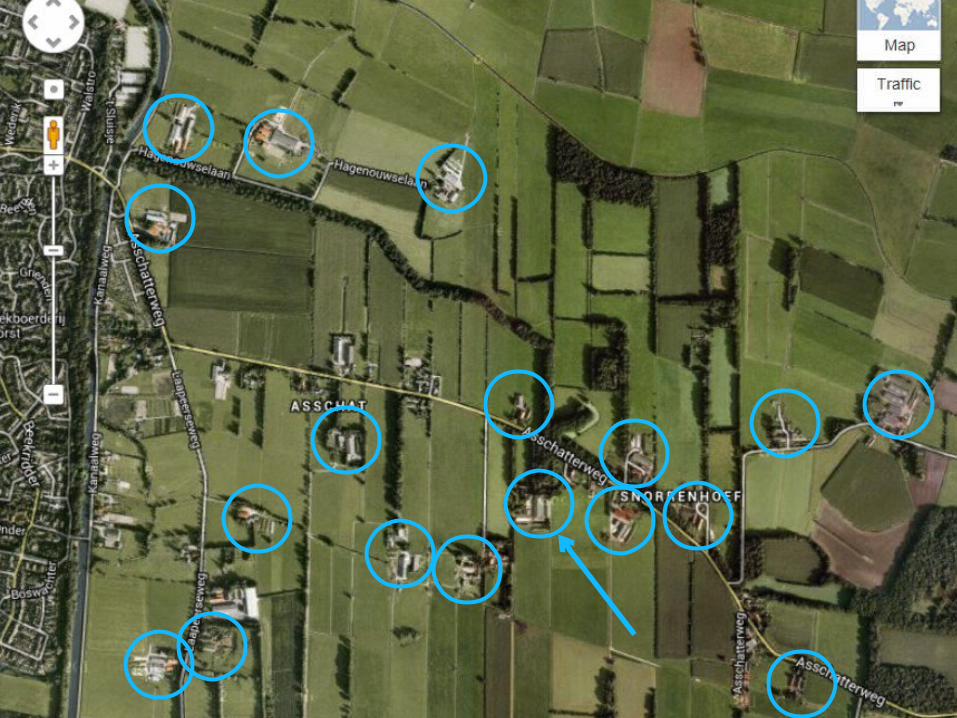
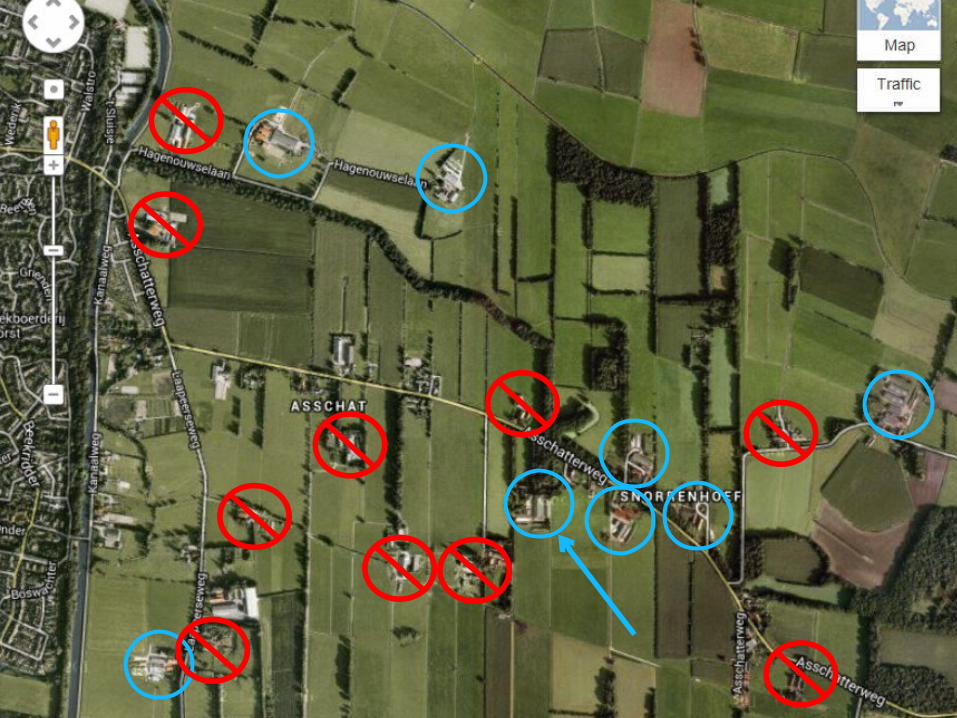
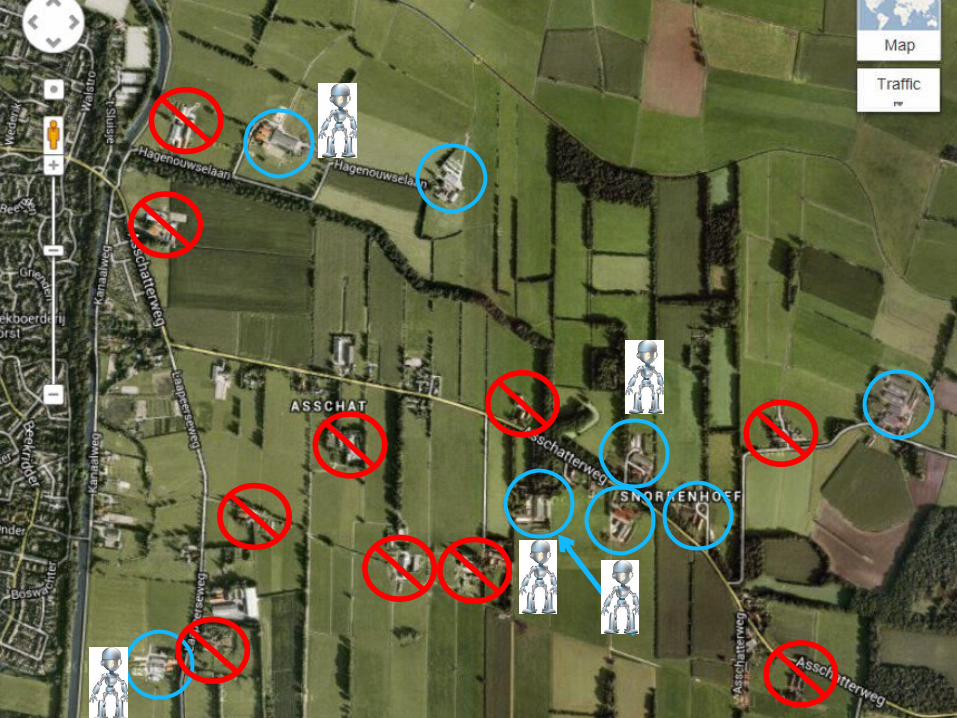
19% of Dutch dairy farms
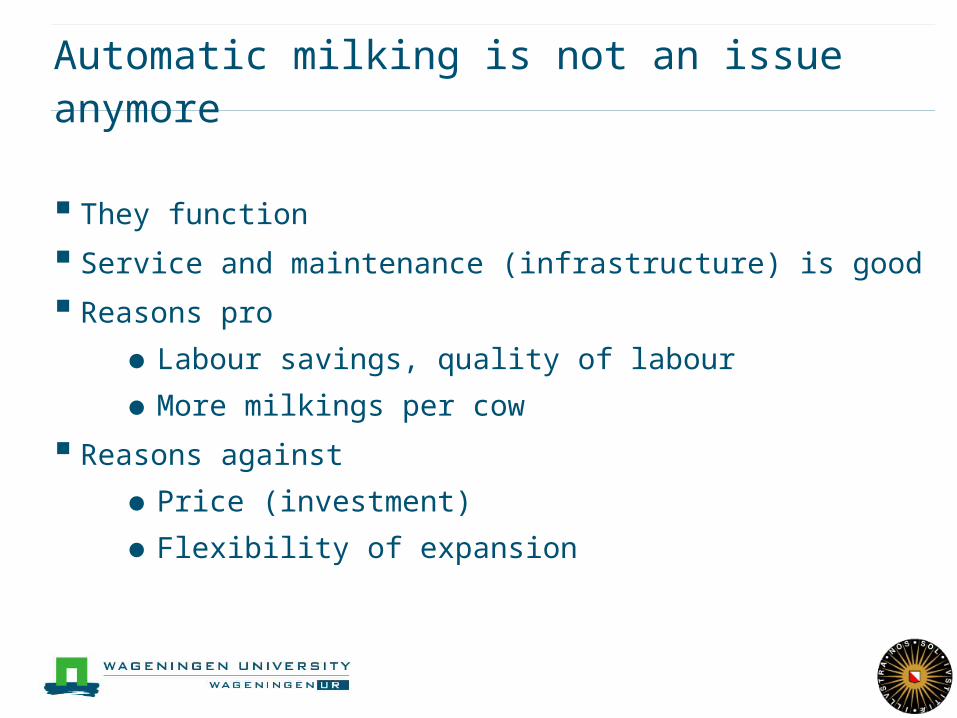
Automatic milking is not an issue anymore
They function
Service and maintenance (infrastructure) is good
Reasons pro
●Labour savings, quality of labour
●More milkings per cow
Reasons against
●Price (investment)
●Flexibility of expansion
What can you expect from me
Developments in Dutch dairy industry
Automatic milking
Use of sensor systems
Effect of sensor systems
Economic potential vs reality
Sharing data
Wrap up
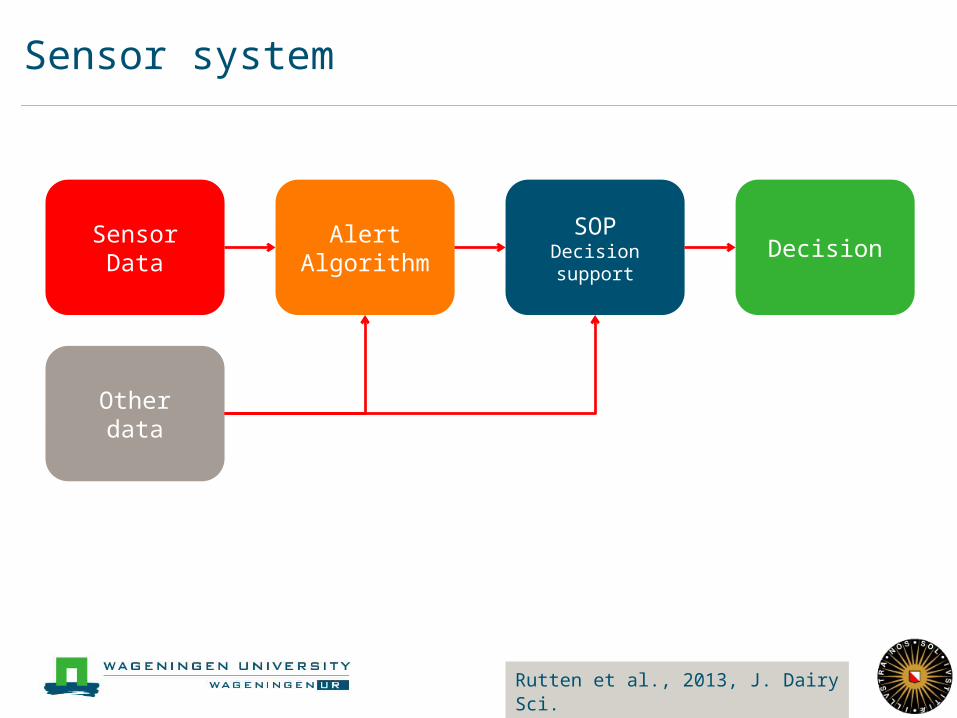
Sensor system
SensorData
AlertAlgorithm
SOPDecision support
Decision
Otherdata
Rutten et al., 2013, J. Dairy Sci.
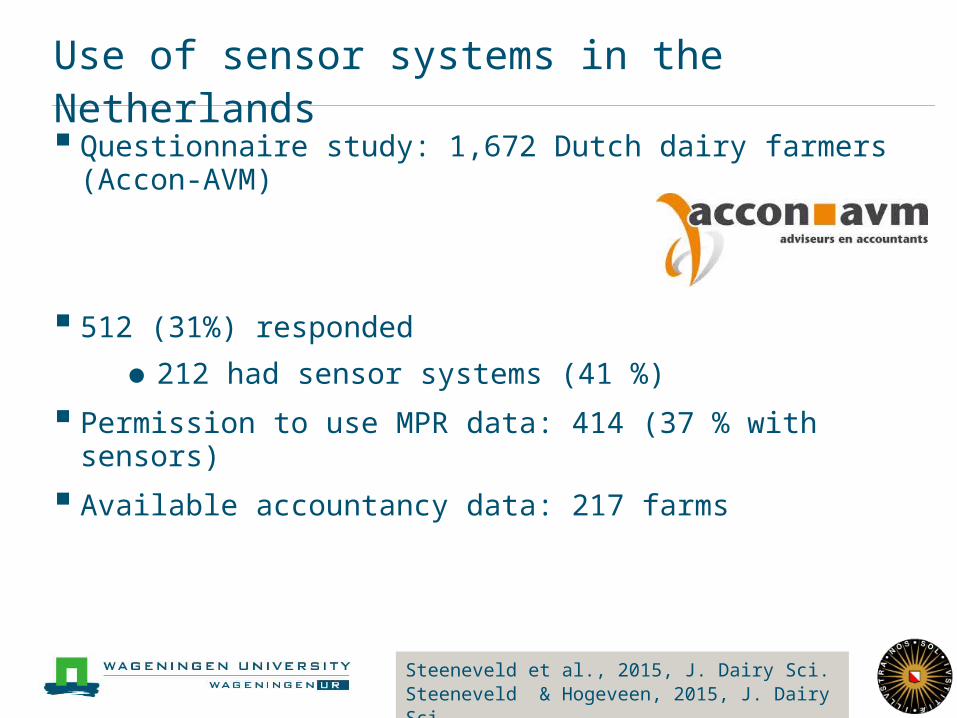
Use of sensor systems in the Netherlands
Questionnaire study: 1,672 Dutch dairy farmers (Accon-AVM)
512 (31%) responded
●212 had sensor systems (41 %)
Permission to use MPR data: 414 (37 % with sensors)
Available accountancy data: 217 farms
Steeneveld et al., 2015, J. Dairy Sci.Steeneveld & Hogeveen, 2015, J. Dairy Sci
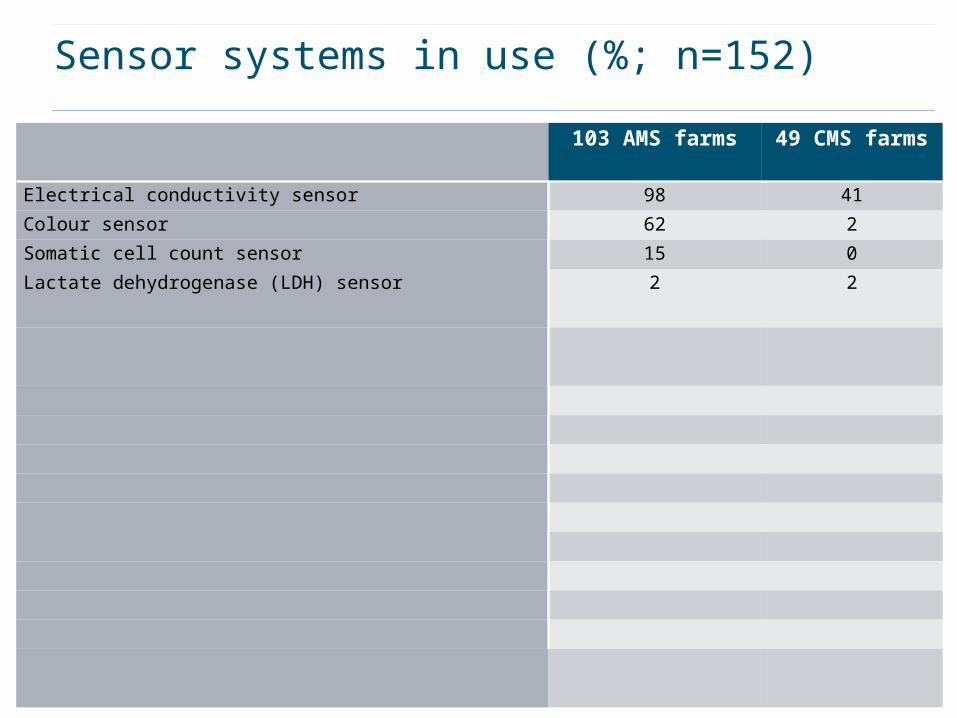
Sensor systems in use (%; n=152)
103 AMS farms 49 CMS farms
Electrical conductivity sensor 98 41
Colour sensor 62 2
Somatic cell count sensor 15 0
Lactate dehydrogenase (LDH) sensor 2 2
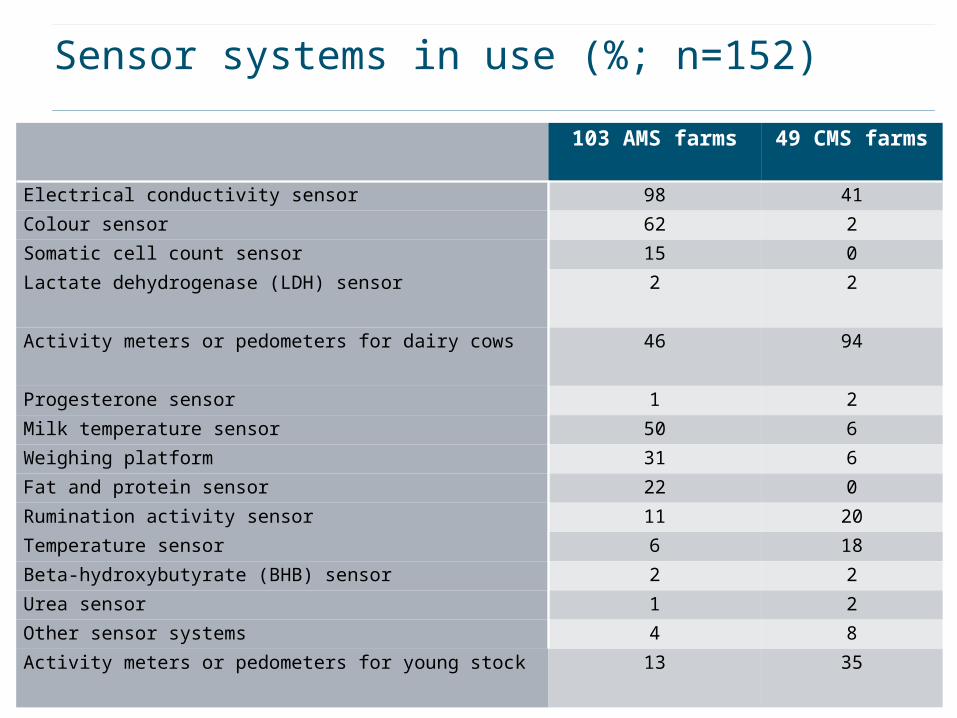
Sensor systems in use (%; n=152)
103 AMS farms 49 CMS farms
Electrical conductivity sensor 98 41
Colour sensor 62 2
Somatic cell count sensor 15 0
Lactate dehydrogenase (LDH) sensor 2 2
Activity meters or pedometers for dairy cows 46 94
Progesterone sensor 1 2
Milk temperature sensor 50 6
Weighing platform 31 6
Fat and protein sensor 22 0
Rumination activity sensor 11 20
Temperature sensor 6 18
Beta-hydroxybutyrate (BHB) sensor 2 2
Urea sensor 1 2
Other sensor systems 4 8
Activity meters or pedometers for young stock 13 35
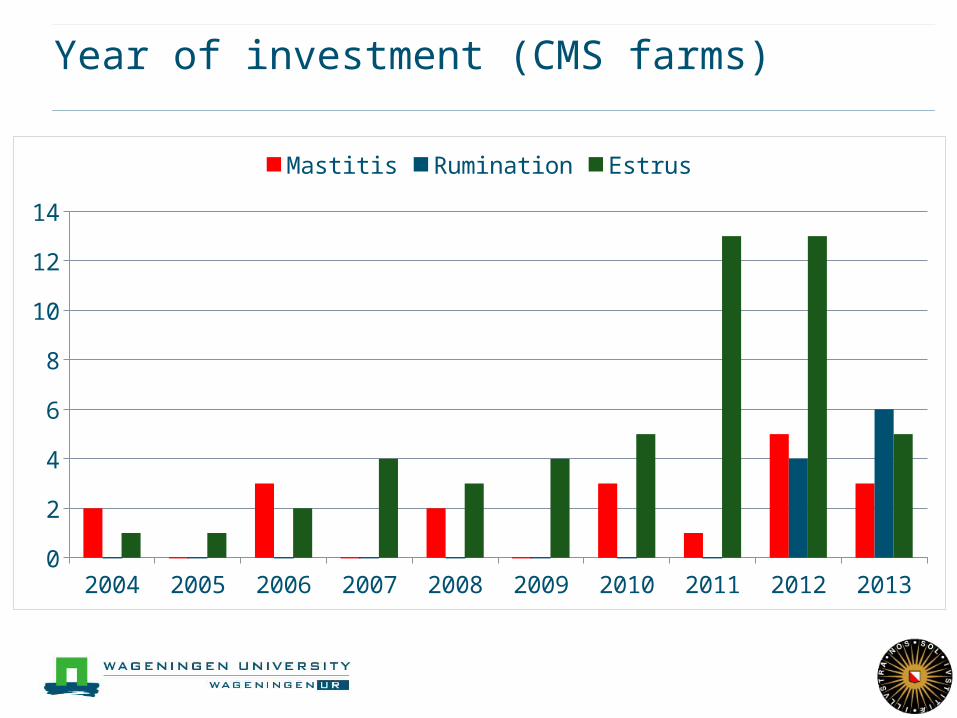
Year of investment (CMS farms)
2004 2005 2006 2007 2008 2009 2010 2011 2012 20130
2
4
6
8
10
12
14
Mastitis Rumination Estrus
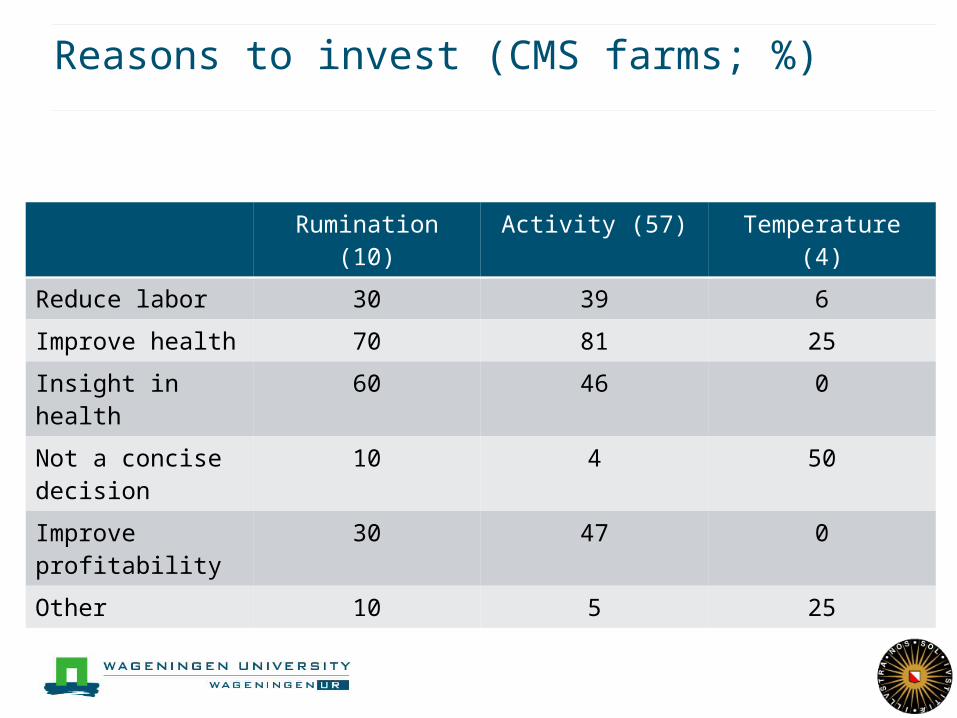
Reasons to invest (CMS farms; %)
Rumination (10) Activity (57) Temperature (4)
Reduce labor 30 39 6
Improve health 70 81 25
Insight in health 60 46 0
Not a concise decision
10 4 50
Improve profitability
30 47 0
Other 10 5 25
What can you expect from me
Developments in Dutch dairy industry
Automatic milking
Use of sensor systems
Effect of sensor systems
Economic potential vs reality
Sharing data
Wrap up
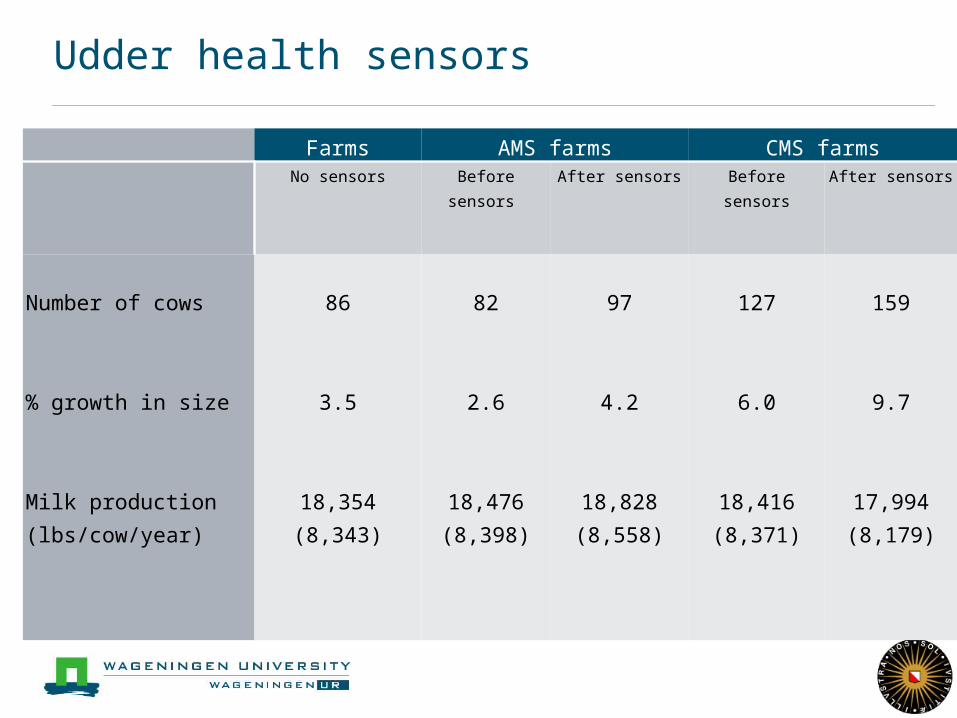
Udder health sensors
Farms AMS farms CMS farms No sensors Before sensors After sensors Before sensors After sensors
Number of cows
% growth in size
Milk production (lbs/cow/year)
86
3.5
18,354(8,343)
82
2.6
18,476(8,398)
97
4.2
18,828(8,558)
127
6.0
18,416(8,371)
159
9.7
17,994(8,179)
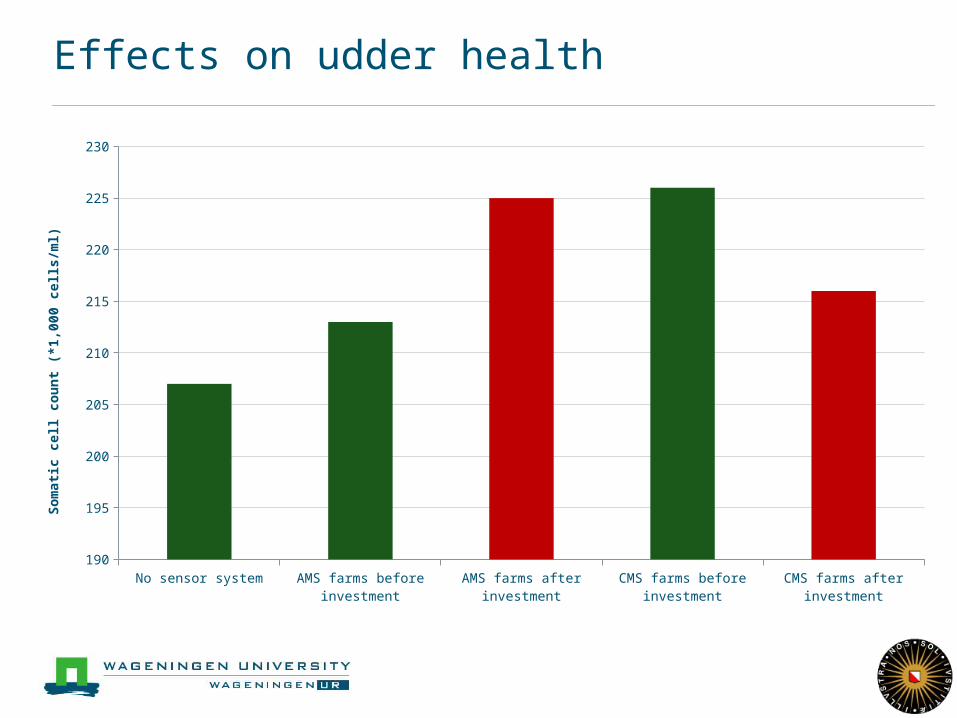
Effects on udder health
No sensor system AMS farms before investment
AMS farms after investment
CMS farms before investment
CMS farms after investment
190
195
200
205
210
215
220
225
230
Som
ati
c c
ell c
ount
(*1,0
00 c
ells/m
l)
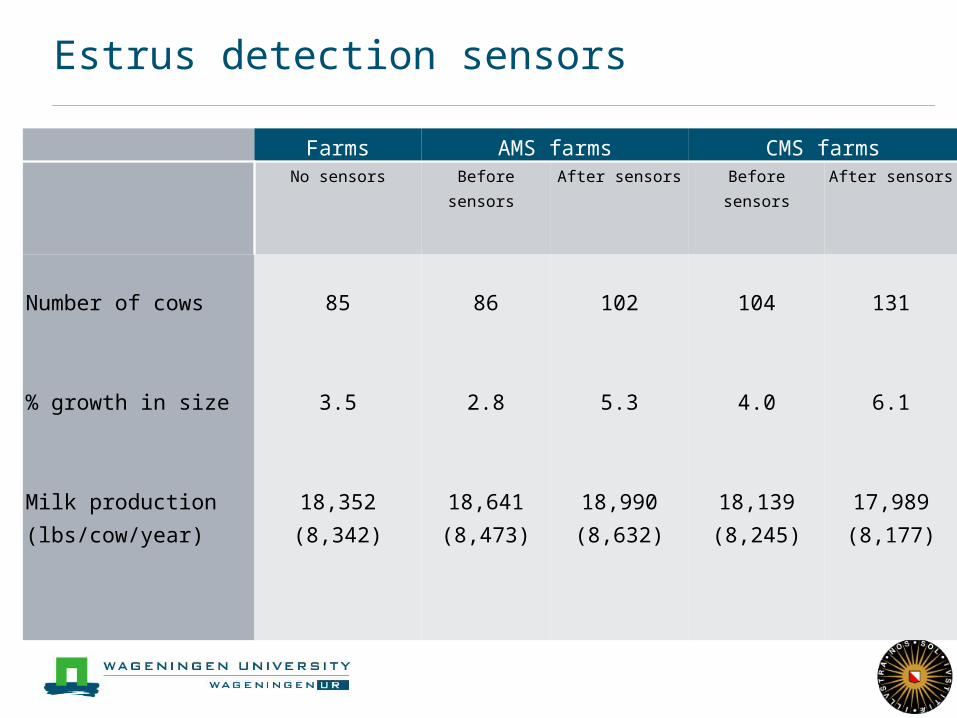
Estrus detection sensors
Farms AMS farms CMS farms No sensors Before sensors After sensors Before sensors After sensors
Number of cows
% growth in size
Milk production (lbs/cow/year)
85
3.5
18,352(8,342)
86
2.8
18,641(8,473)
102
5.3
18,990 (8,632)
104
4.0
18,139(8,245)
131
6.1
17,989(8,177)
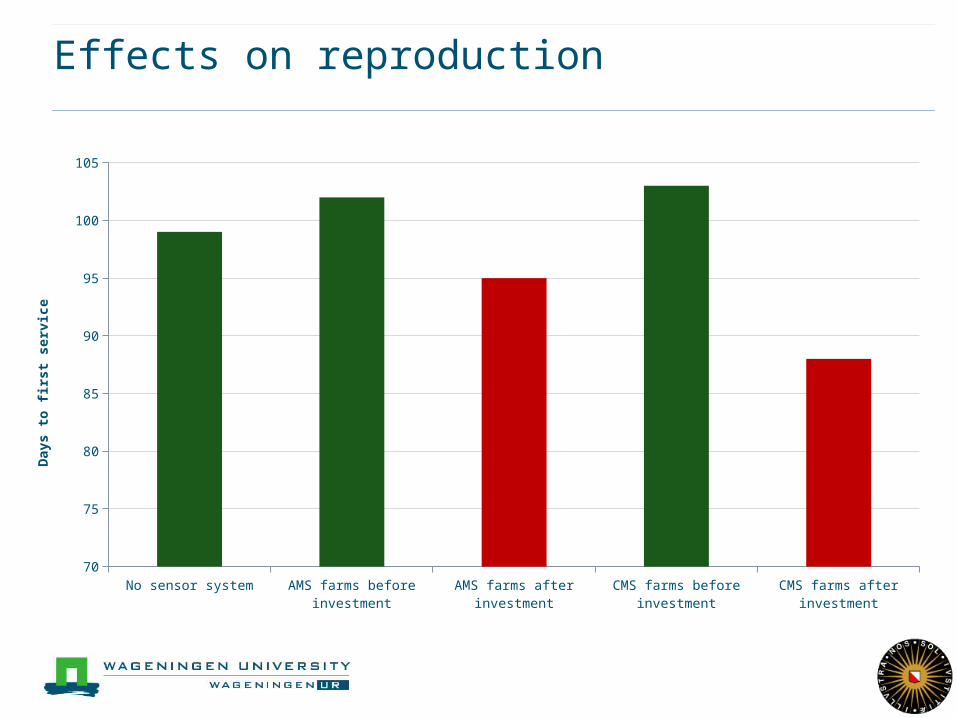
Effects on reproduction
No sensor system AMS farms before investment
AMS farms after investment
CMS farms before investment
CMS farms after investment
70
75
80
85
90
95
100
105
Days t
o fi
rst
serv
ice
What can you expect from me
Developments in Dutch dairy industry
Automatic milking
Use of sensor systems
Effect of sensor systems
Economic potential vs reality
Sharing data
Wrap up
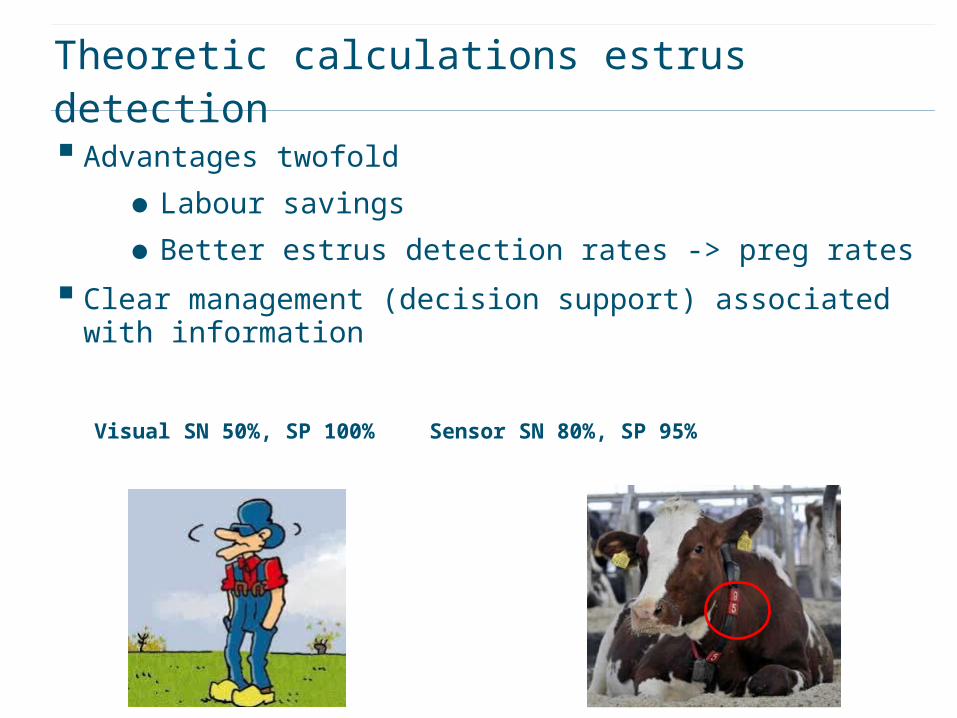
Theoretic calculations estrus detection
Advantages twofold
●Labour savings
●Better estrus detection rates -> preg rates
Clear management (decision support) associated with information
Visual SN 50%, SP 100% Sensor SN 80%, SP 95%
Titelstijl van model bewerken• Klik om de tekststijl van het model
te bewerken– Tweede niveau
• Derde niveau– Vierde niveau
» Vijfde niveau
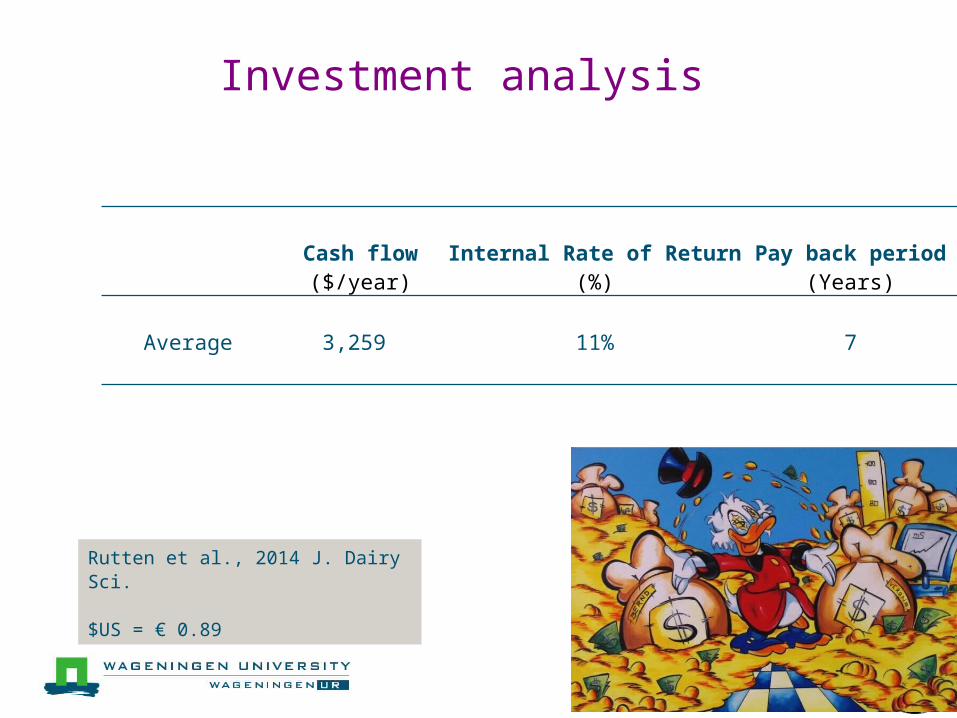
Investment analysis
Cash flow($/year)
Internal Rate of Return(%)
Pay back period(Years)
Average 3,259 11% 7
Rutten et al., 2014 J. Dairy Sci.
$US = € 0.89
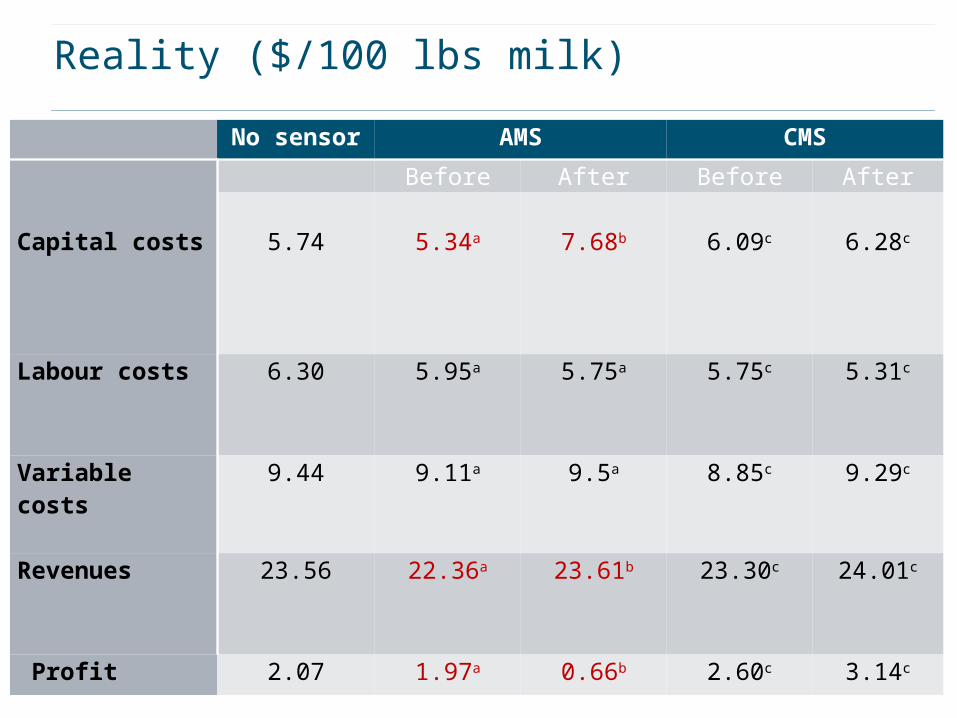
Reality ($/100 lbs milk)
No sensor AMS CMS Before After Before After
Capital costs 5.74 5.34a 7.68b 6.09c 6.28c
Labour costs
6.30 5.95a
5.75a 5.75c
5.31c
Variable costs
9.44 9.11a 9.5a 8.85c 9.29c
Revenues
23.56 22.36a 23.61b 23.30c 24.01c
Profit 2.07 1.97a 0.66b 2.60c 3.14c
What can you expect from me
Developments in Dutch dairy industry
Automatic milking
Use of sensor systems
Effect of sensor systems
Economic potential vs reality
Sharing data
Wrap up
aantallen NL noeme
n
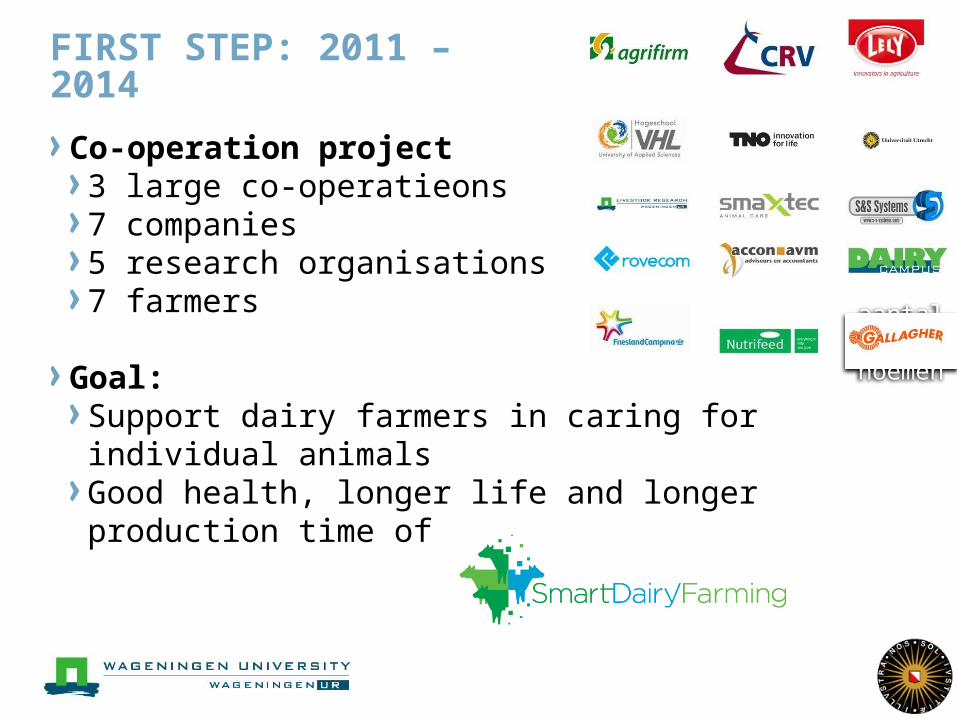
FIRST STEP: 2011 – 2014
Co-operation project3 large co-operatieons7 companies5 research organisations7 farmers
Goal:Support dairy farmers in caring for individual animalsGood health, longer life and longer production time of cows
32
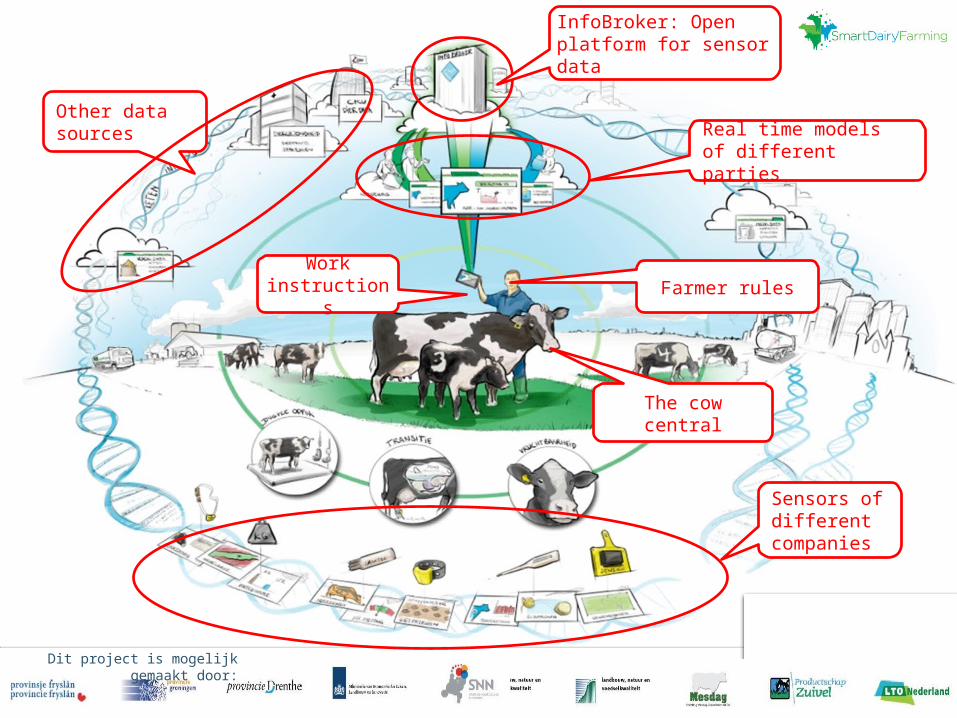
The cow central
Farmer rules
Real time models of different parties
Sensors of different companies
Other data sources
InfoBroker: Open platform for sensor data
Work instructions
Dit project is mogelijk gemaakt door:
What can you expect from me
Developments in Dutch dairy industry
Automatic milking
Use of sensor systems
Effect of sensor systems
Economic potential vs reality
Sharing data
Wrap up
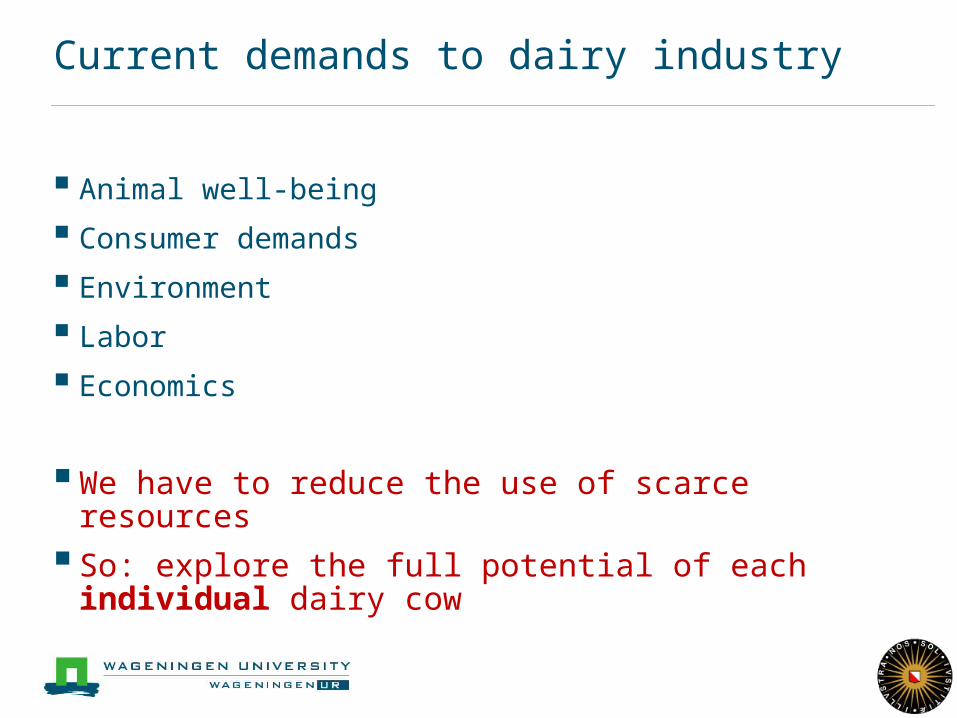
Current demands to dairy industry
Animal well-being
Consumer demands
Environment
Labor
Economics
We have to reduce the use of scarce resources
So: explore the full potential of each individual dairy cow
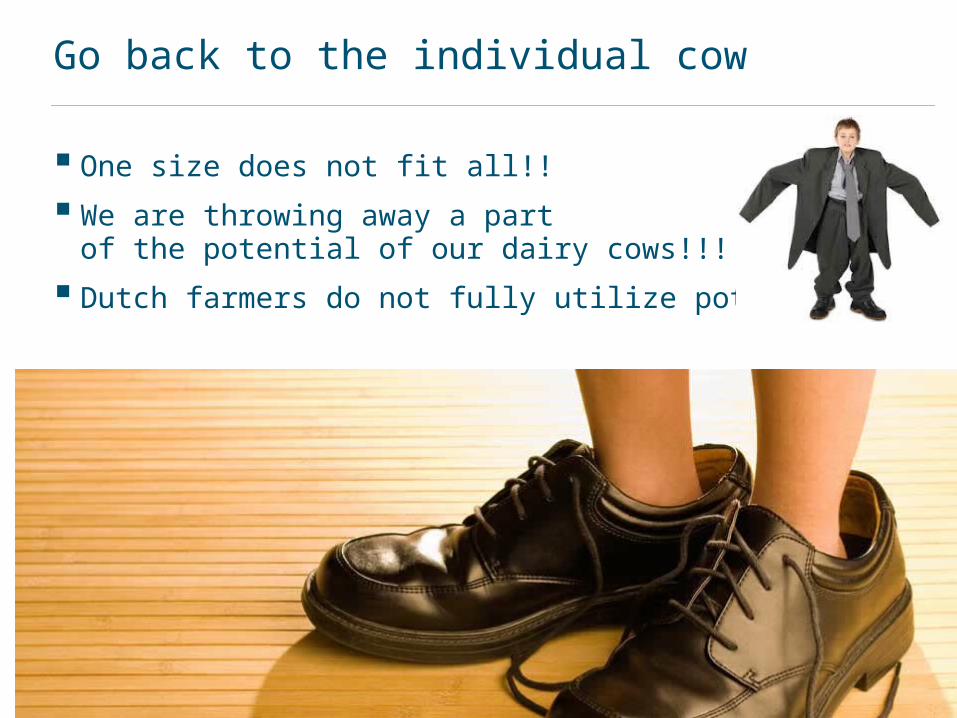
Go back to the individual cow
One size does not fit all!!
We are throwing away a part of the potential of our dairy cows!!!!
Dutch farmers do not fully utilize potential
Thank you for your attention
I wish you a great conference
@henkhogeveen
animal-health-management.blogspot.com
www.slideshare.net/henkhogeveen
Thank you for your attention
Welcome in Leeuwarden 2016