Embed Size (px)
Citation preview

2017 Housing Market Forecast
Connect on the Road Los AngelesOctober 18, 2016
Leslie Appleton-Young Chief Economist & Vice President
2016 Forecast Report Card SFH Resales (000s)
% Change
Median Price ($000s)
% Change
30-Yr FRM
Housing Affordability Index
U.S. Gross Domestic Product
2015 Actual
408.8
6.8%
$474.4
6.2%
3.9%
31%
2.4%
2016 Forecast
433.0
6.3%
$491.3
3.2%
4.5%
27%
2.7%
2016 Projected
407.3
-0.4%
$503.9
6.2%
3.6%
33%
1.5%
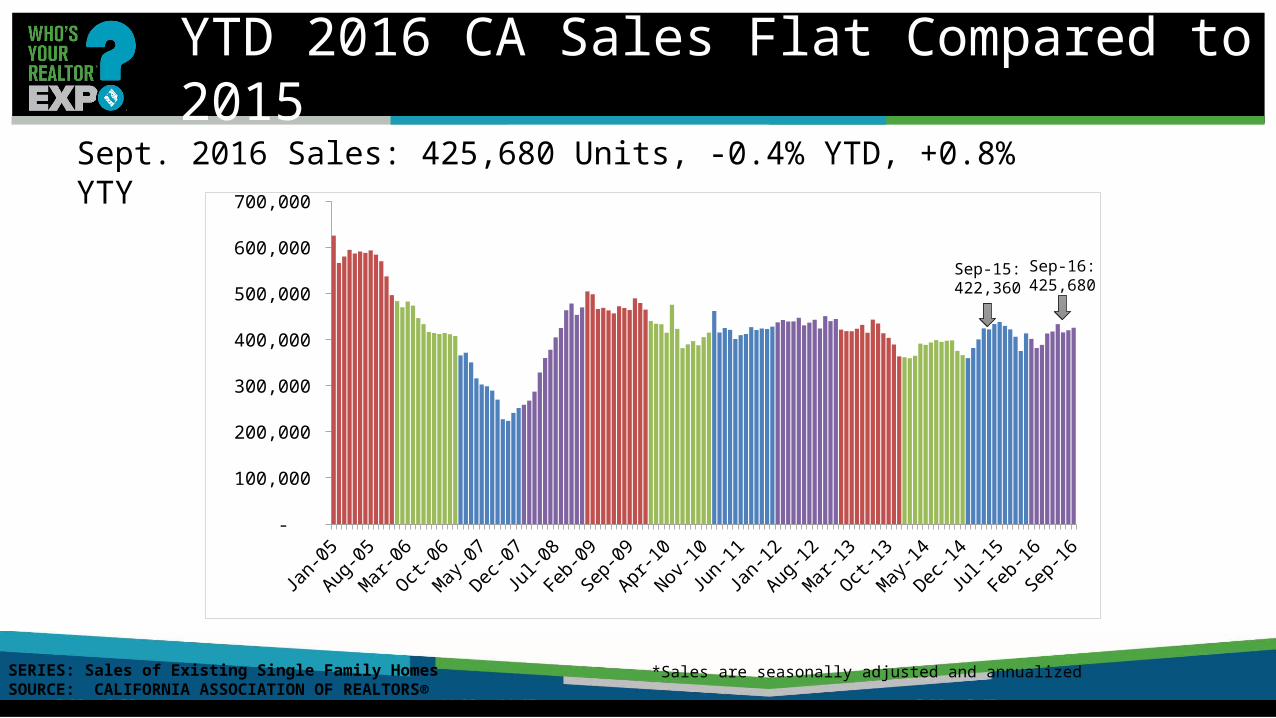
YTD 2016 CA Sales Flat Compared to 2015
Sept. 2016 Sales: 425,680 Units, -0.4% YTD, +0.8% YTY
Jan-05
Sep-0
5
May-06
Jan-07
Sep-0
7
May-08
Jan-09
Sep-0
9
May-10
Jan-11
Sep-1
1
May-12
Jan-13
Sep-1
3
May-14
Jan-15
Sep-1
5
May-16
-
100,000
200,000
300,000
400,000
500,000
600,000
700,000
*Sales are seasonally adjusted and annualized SERIES: Sales of Existing Single Family HomesSOURCE: CALIFORNIA ASSOCIATION OF REALTORS®
Sep-16: 425,680
Sep-15: 422,360
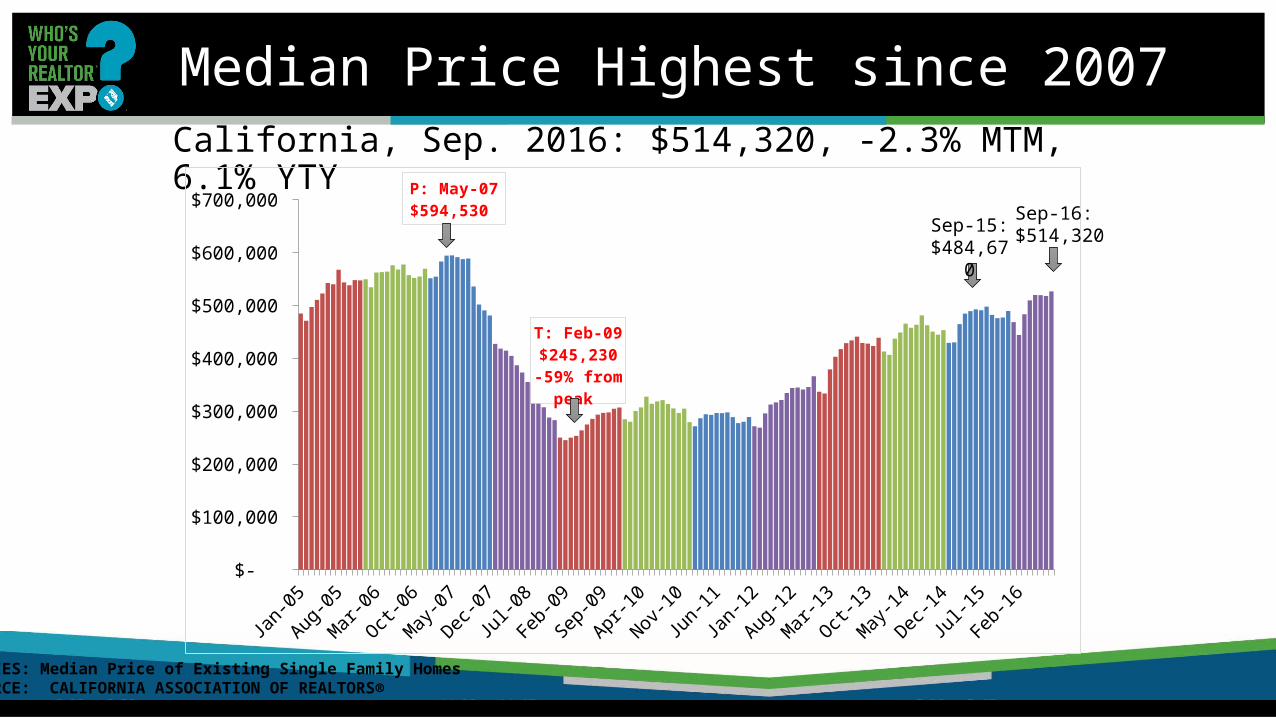
Median Price Highest since 2007California, Sep. 2016: $514,320, -2.3% MTM, 6.1% YTY
Jan-05
Sep-0
5
May-06
Jan-07
Sep-0
7
May-08
Jan-09
Sep-0
9
May-10
Jan-11
Sep-1
1
May-12
Jan-13
Sep-1
3
May-14
Jan-15
Sep-1
5
May-16
$-
$100,000
$200,000
$300,000
$400,000
$500,000
$600,000
$700,000 P: May-07$594,530
T: Feb-09$245,230-59% from
peak
SERIES: Median Price of Existing Single Family HomesSOURCE: CALIFORNIA ASSOCIATION OF REALTORS®
Sep-16: $514,320Sep-15:
$484,670
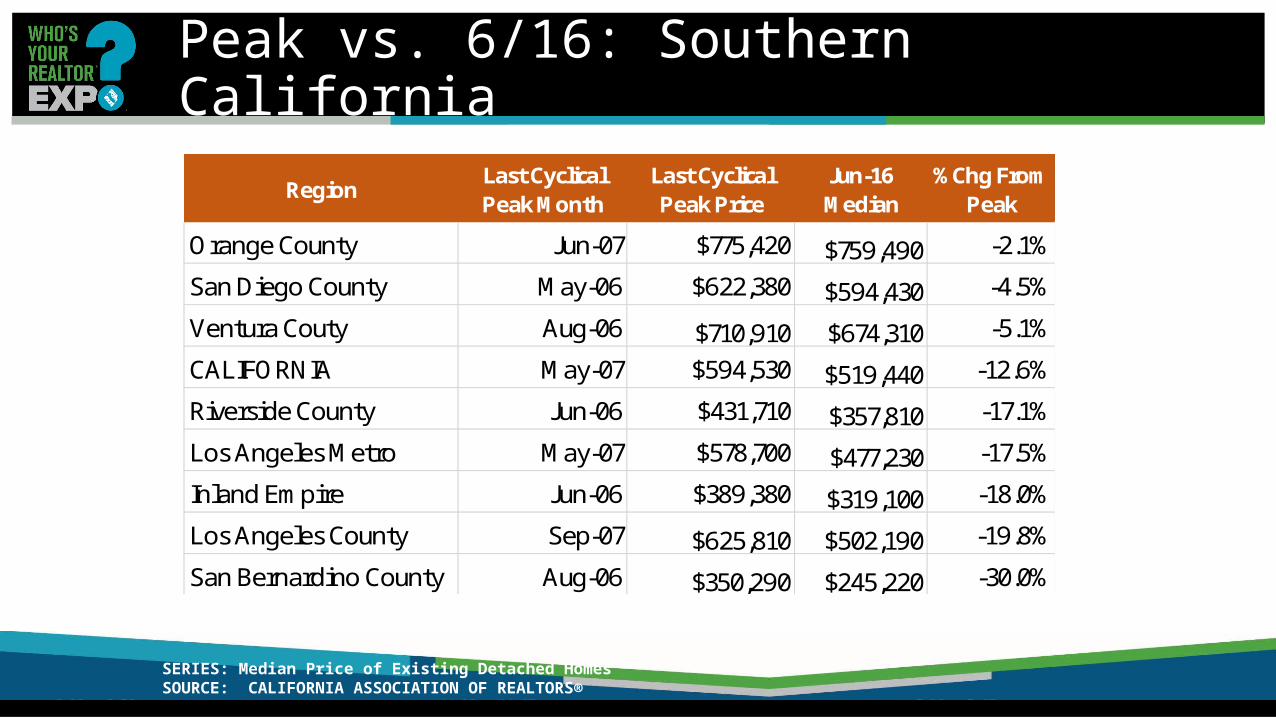
Peak vs. 6/16: Southern California
SERIES: Median Price of Existing Detached HomesSOURCE: CALIFORNIA ASSOCIATION OF REALTORS®
Region Last Cyclical Peak Month
Last Cyclical Peak Price
Jun-16 Median
%Chg From Peak
Orange County Jun-07 $775,420 $759,490 -2.1%San Diego County May-06 $622,380 $594,430 -4.5%Ventura Couty Aug-06 $710,910 $674,310 -5.1%CALIFORNIA May-07 $594,530 $519,440 -12.6%Riverside County Jun-06 $431,710 $357,810 -17.1%Los Angeles Metro May-07 $578,700 $477,230 -17.5%Inland Empire Jun-06 $389,380 $319,100 -18.0%Los Angeles County Sep-07 $625,810 $502,190 -19.8%San Bernardino County Aug-06 $350,290 $245,220 -30.0%
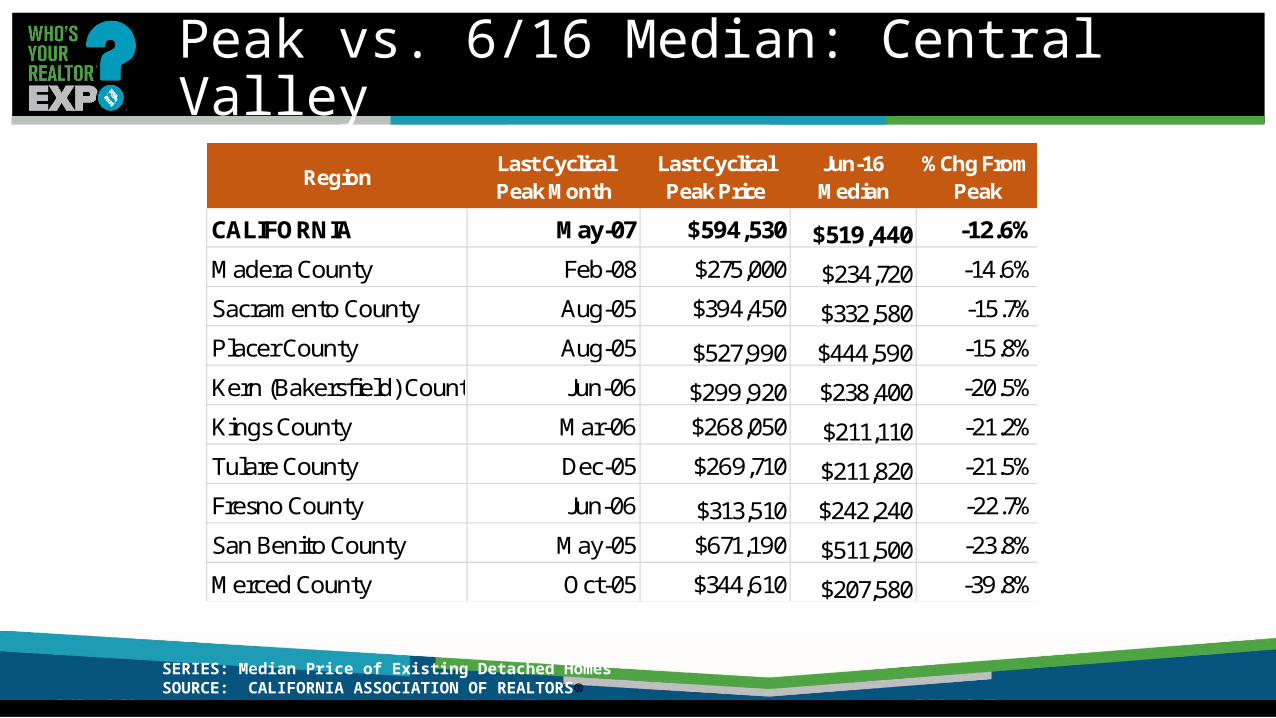
Peak vs. 6/16 Median: Central Valley
SERIES: Median Price of Existing Detached HomesSOURCE: CALIFORNIA ASSOCIATION OF REALTORS®
Region Last Cyclical Peak Month
Last Cyclical Peak Price
Jun-16 Median
%Chg From Peak
CALIFORNIA May-07 $594,530 $519,440 -12.6%Madera County Feb-08 $275,000 $234,720 -14.6%Sacramento County Aug-05 $394,450 $332,580 -15.7%Placer County Aug-05 $527,990 $444,590 -15.8%Kern (Bakersfield) County Jun-06 $299,920 $238,400 -20.5%Kings County Mar-06 $268,050 $211,110 -21.2%Tulare County Dec-05 $269,710 $211,820 -21.5%Fresno County Jun-06 $313,510 $242,240 -22.7%San Benito County May-05 $671,190 $511,500 -23.8%Merced County Oct-05 $344,610 $207,580 -39.8%
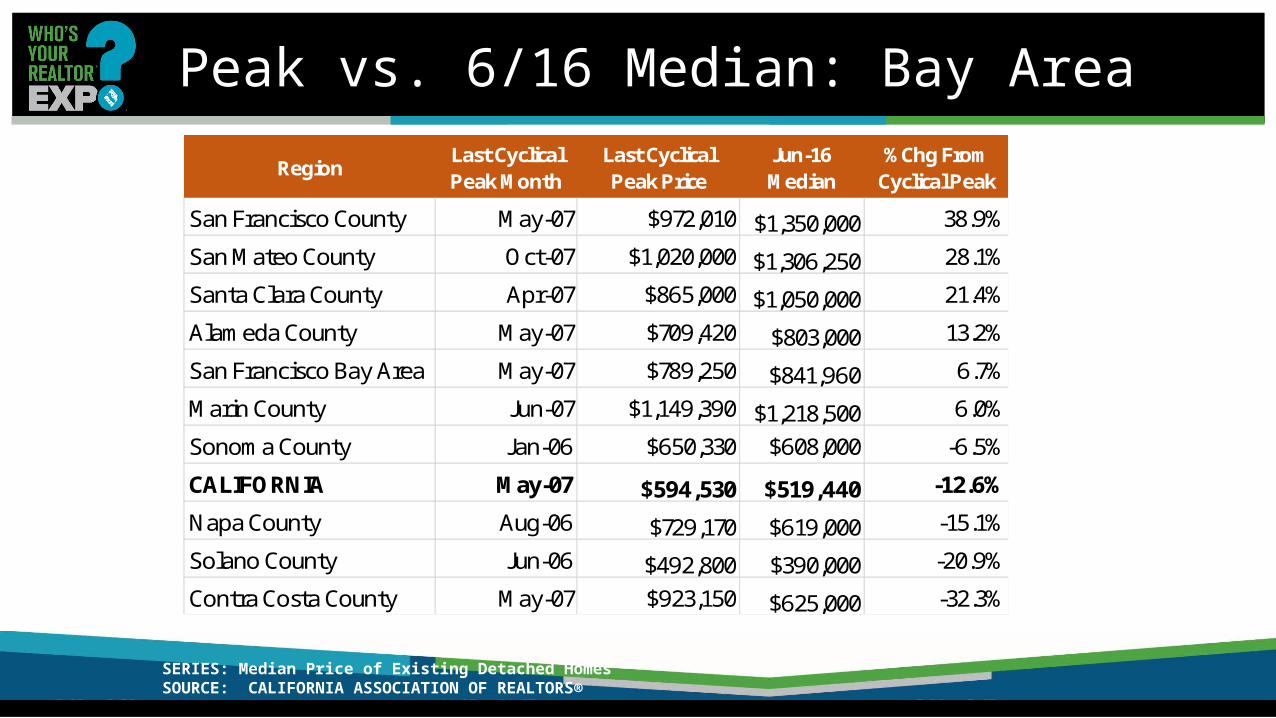
Peak vs. 6/16 Median: Bay Area
SERIES: Median Price of Existing Detached HomesSOURCE: CALIFORNIA ASSOCIATION OF REALTORS®
Region Last Cyclical Peak Month
Last Cyclical Peak Price
Jun-16 Median
%Chg From Cyclical Peak
San Francisco County May-07 $972,010 $1,350,000 38.9%San Mateo County Oct-07 $1,020,000 $1,306,250 28.1%Santa Clara County Apr-07 $865,000 $1,050,000 21.4%Alameda County May-07 $709,420 $803,000 13.2%San Francisco Bay Area May-07 $789,250 $841,960 6.7%Marin County Jun-07 $1,149,390 $1,218,500 6.0%Sonoma County Jan-06 $650,330 $608,000 -6.5%CALIFORNIA May-07 $594,530 $519,440 -12.6%Napa County Aug-06 $729,170 $619,000 -15.1%Solano County Jun-06 $492,800 $390,000 -20.9%Contra Costa County May-07 $923,150 $625,000 -32.3%

Southern CA Regional Housing Markets
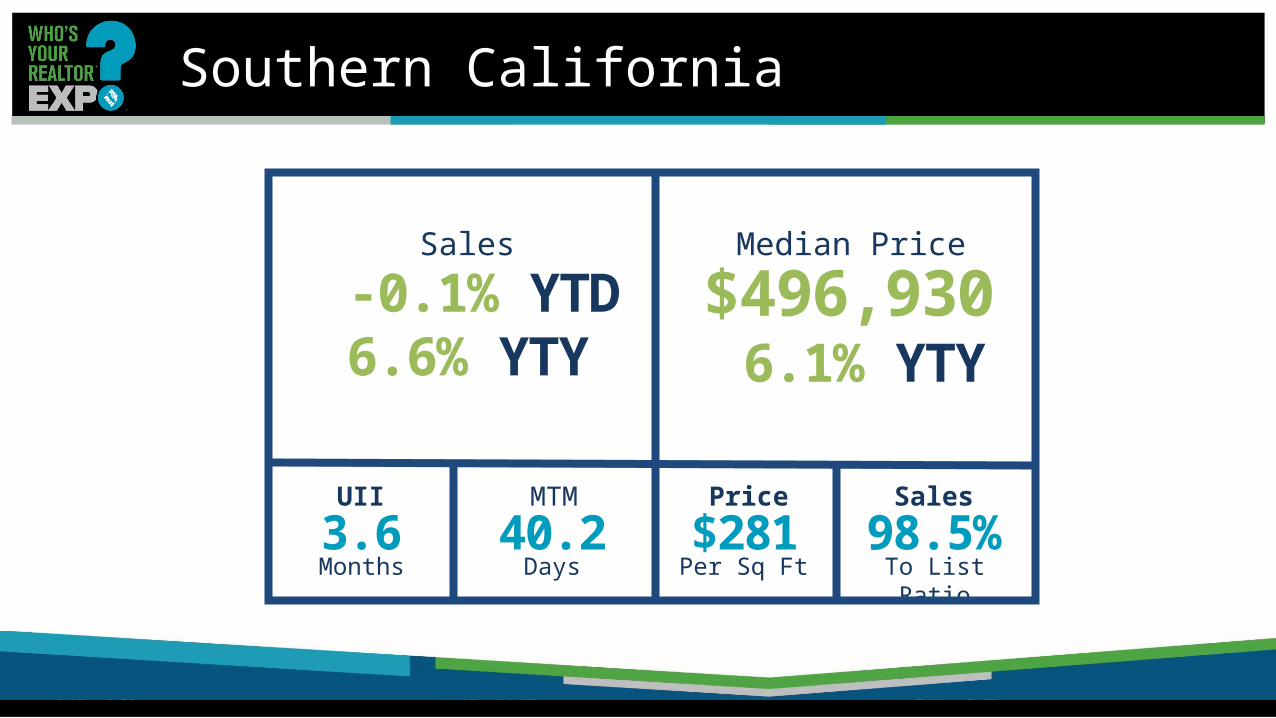
$496,930 6.1% YTY
-0.1% YTD6.6% YTY
3.6 40.2 98.5%$281UII
Months Days
MTM Price
Per Sq Ft
Sales
To List Ratio
Median PriceSales
Southern California
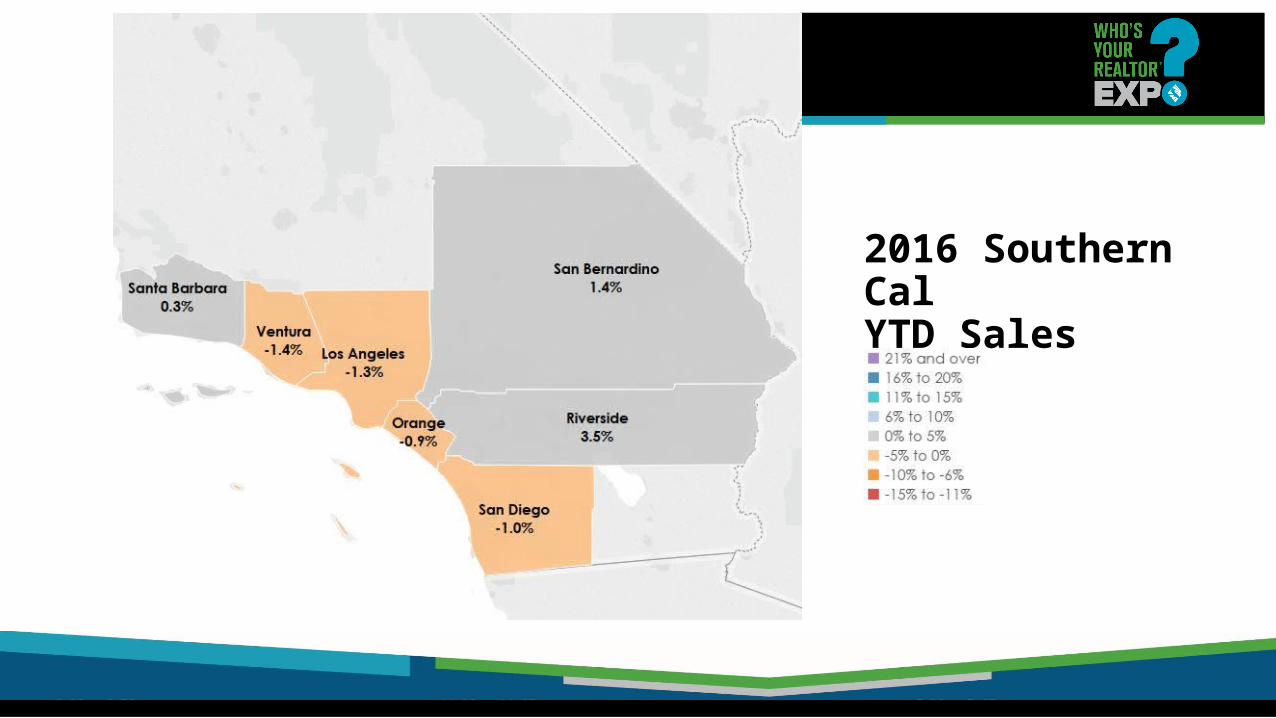
2016 Southern CalYTD Sales

2016 Southern CalMedian Prices YTY
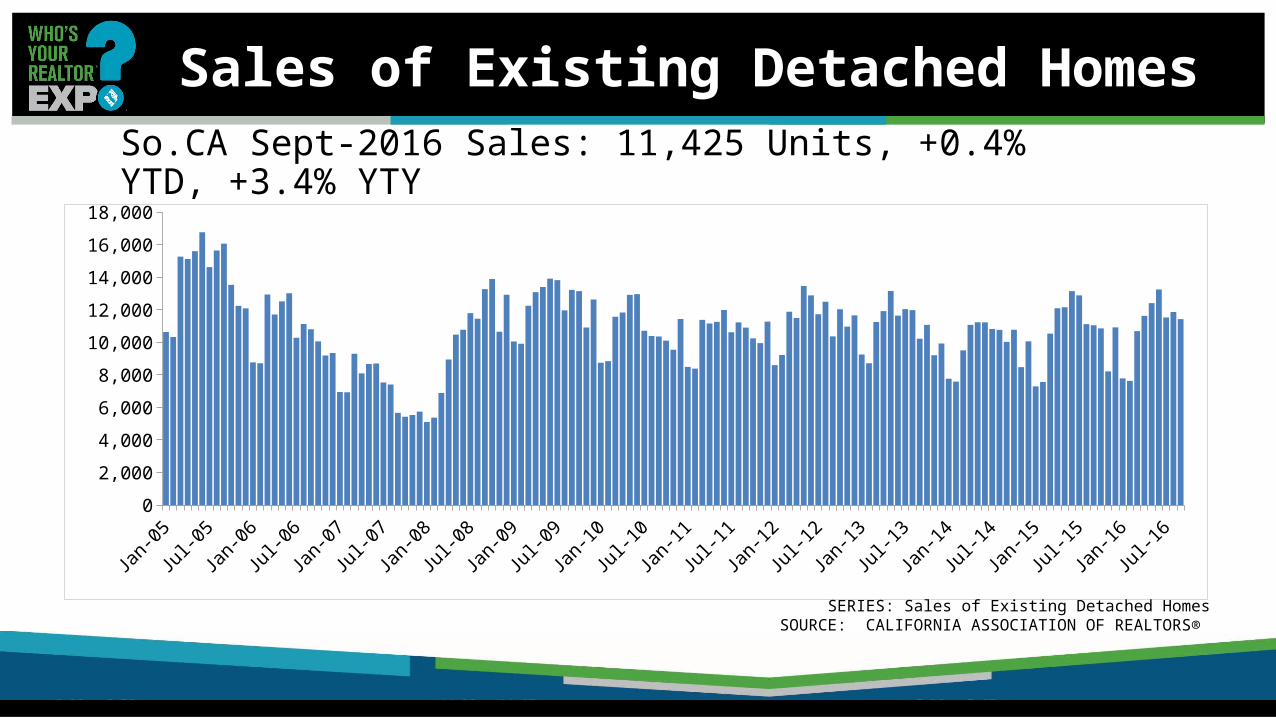
Sales of Existing Detached HomesSo.CA Sept-2016 Sales: 11,425 Units, +0.4% YTD, +3.4% YTY
Jan-05
Jul-05
Jan-06
Jul-06
Jan-07
Jul-07
Jan-08
Jul-08
Jan-09
Jul-09
Jan-10
Jul-10
Jan-11
Jul-11
Jan-12
Jul-12
Jan-13
Jul-13
Jan-14
Jul-14
Jan-15
Jul-15
Jan-16
Jul-16
02,0004,0006,0008,000
10,00012,00014,00016,00018,000
SERIES: Sales of Existing Detached HomesSOURCE: CALIFORNIA ASSOCIATION OF REALTORS®
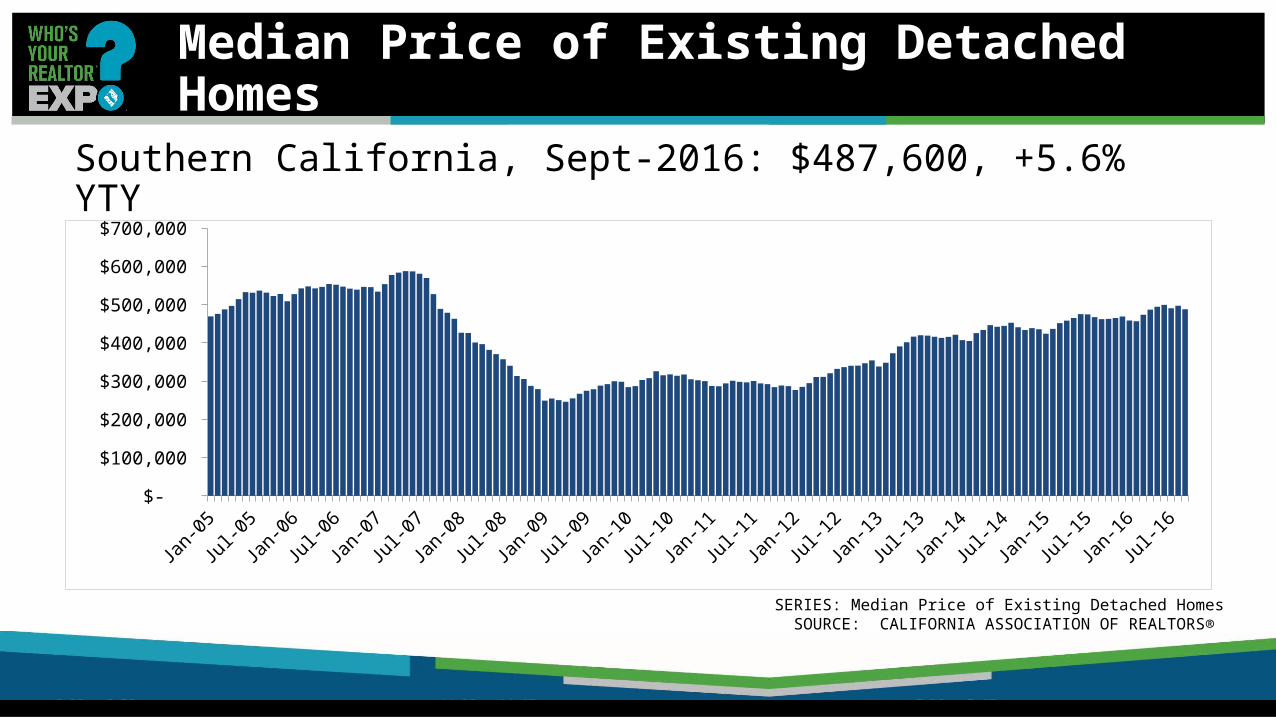
Median Price of Existing Detached Homes
Southern California, Sept-2016: $487,600, +5.6% YTY
Jan-05
Jul-05
Jan-06
Jul-06
Jan-07
Jul-07
Jan-08
Jul-08
Jan-09
Jul-09
Jan-10
Jul-10
Jan-11
Jul-11
Jan-12
Jul-12
Jan-13
Jul-13
Jan-14
Jul-14
Jan-15
Jul-15
Jan-16
Jul-16
$-
$100,000
$200,000
$300,000
$400,000
$500,000
$600,000
$700,000
SERIES: Median Price of Existing Detached HomesSOURCE: CALIFORNIA ASSOCIATION OF REALTORS®
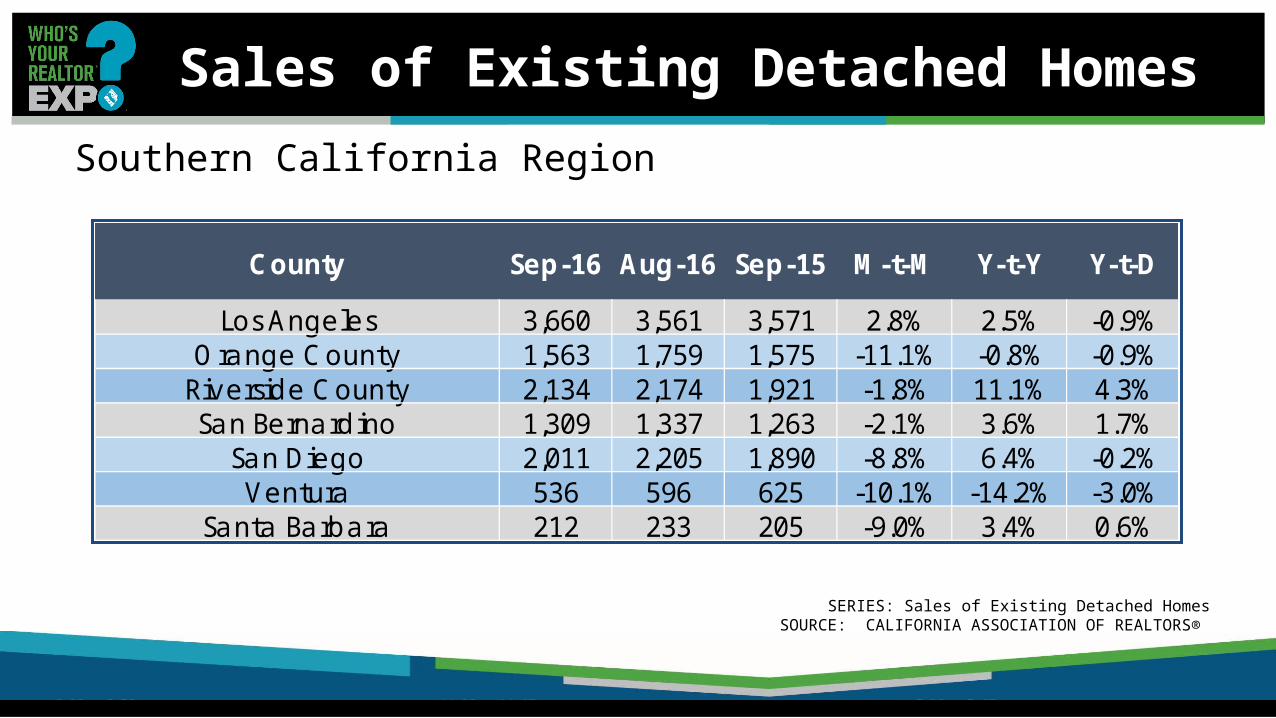
Sales of Existing Detached HomesSouthern California Region
Los Angeles 3,660 3,561 3,571 2.8% 2.5% -0.9%Orange County 1,563 1,759 1,575 -11.1% -0.8% -0.9%
Riverside County 2,134 2,174 1,921 -1.8% 11.1% 4.3%San Bernardino 1,309 1,337 1,263 -2.1% 3.6% 1.7%
San Diego 2,011 2,205 1,890 -8.8% 6.4% -0.2%Ventura 536 596 625 -10.1% -14.2% -3.0%
Santa Barbara 212 233 205 -9.0% 3.4% 0.6%
Y-t-YCounty Sep-16 Aug-16 Sep-15 M-t-M Y-t-D
SERIES: Sales of Existing Detached HomesSOURCE: CALIFORNIA ASSOCIATION OF REALTORS®
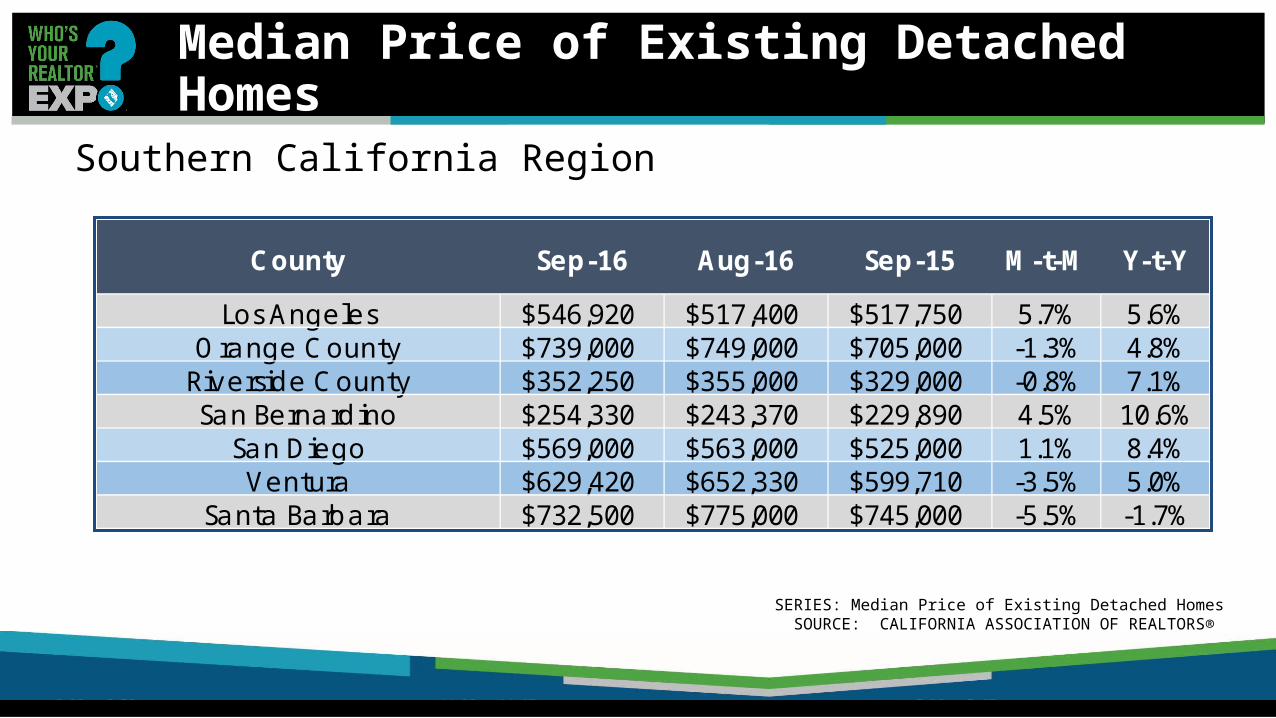
Median Price of Existing Detached Homes
Southern California Region
Los Angeles $546,920 $517,400 $517,750 5.7% 5.6%Orange County $739,000 $749,000 $705,000 -1.3% 4.8%
Riverside County $352,250 $355,000 $329,000 -0.8% 7.1%San Bernardino $254,330 $243,370 $229,890 4.5% 10.6%
San Diego $569,000 $563,000 $525,000 1.1% 8.4%Ventura $629,420 $652,330 $599,710 -3.5% 5.0%
Santa Barbara $732,500 $775,000 $745,000 -5.5% -1.7%
Y-t-YCounty Sep-16 Aug-16 Sep-15 M-t-M
SERIES: Median Price of Existing Detached HomesSOURCE: CALIFORNIA ASSOCIATION OF REALTORS®
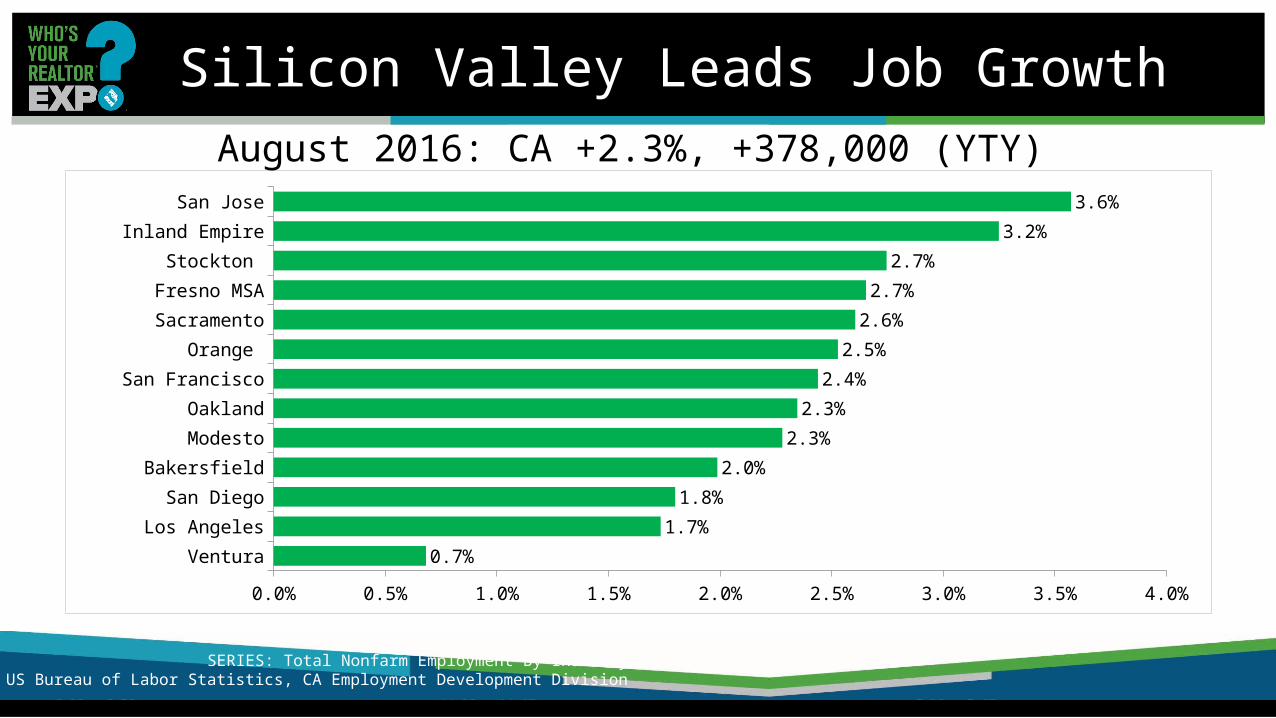
Silicon Valley Leads Job Growth
VenturaLos Angeles
San DiegoBakersfield
ModestoOakland
San FranciscoOrange
SacramentoFresno MSA
Stockton Inland Empire
San Jose
0.0% 0.5% 1.0% 1.5% 2.0% 2.5% 3.0% 3.5% 4.0%0.7%
1.7%1.8%
2.0%2.3%
2.3%2.4%
2.5%2.6%2.7%
2.7%3.2%
3.6%
August 2016: CA +2.3%, +378,000 (YTY)
SERIES: Total Nonfarm Employment By IndustrySOURCE: US Bureau of Labor Statistics, CA Employment Development Division
The “New” Normal
• Lack of supply hinders sales• High-end: discretionary & slowing• Low/Moderate-end: demand continues unabated• Urban coastal CA slowing• Inland and Central and Northern CA growing• Migration patterns mirror housing affordability and jobs• Demographics is Destiny: Boomers aren’t moving, even
when they retire
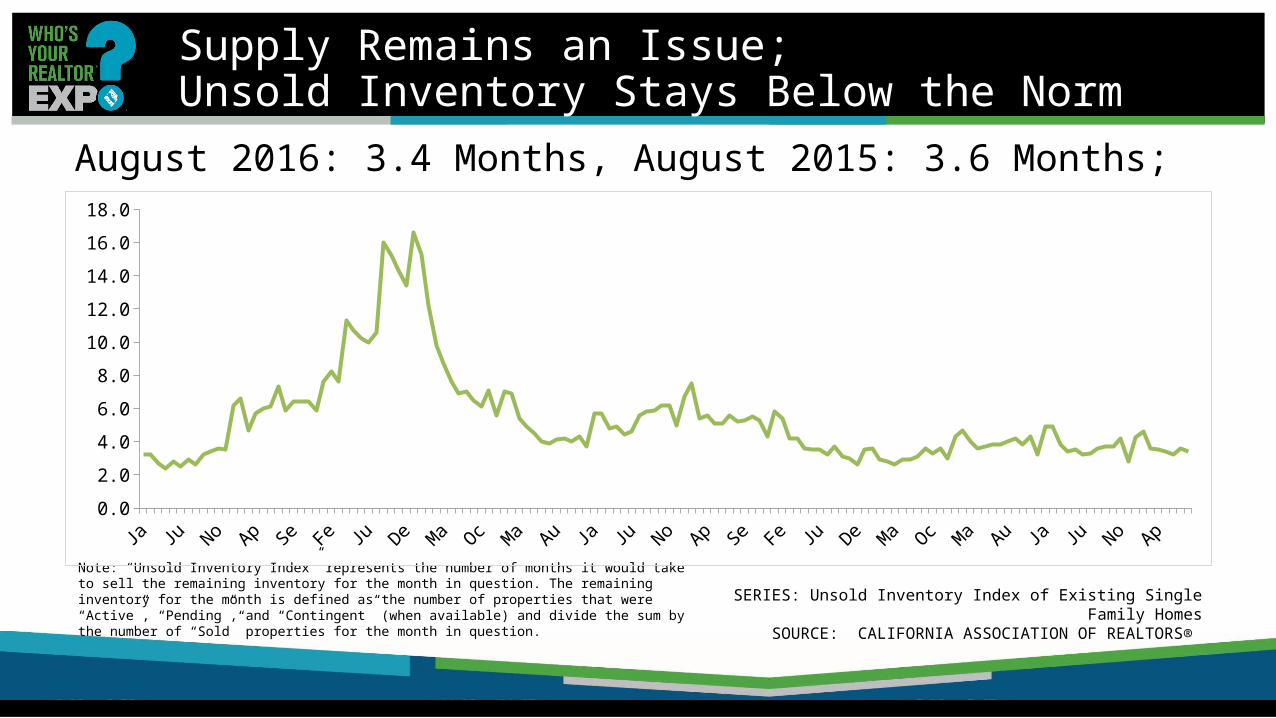
Supply Remains an Issue; Unsold Inventory Stays Below the Norm
August 2016: 3.4 Months, August 2015: 3.6 Months;
Note: “Unsold Inventory Index” represents the number of months it would take to sell the remaining inventory for the month in question. The remaining inventory for the month is defined as the number of properties that were “Active”, “Pending”, and “Contingent” (when available) and divide the sum by the number of “Sold” properties for the month in question.
0.02.04.06.08.0
10.012.014.016.018.0
SERIES: Unsold Inventory Index of Existing Single Family Homes
SOURCE: CALIFORNIA ASSOCIATION OF REALTORS®
Where is the inventory? Long-Time Homeowners are not moving as in the past
Low rate on current mortgage Low property taxesCapital gains hitWhere can I afford to go?Could not qualify for a mortgage todayRemodel and stay
Are we headed for the “European Model” where children inherit the home of their parents?One more thing…Secular decline in marriage
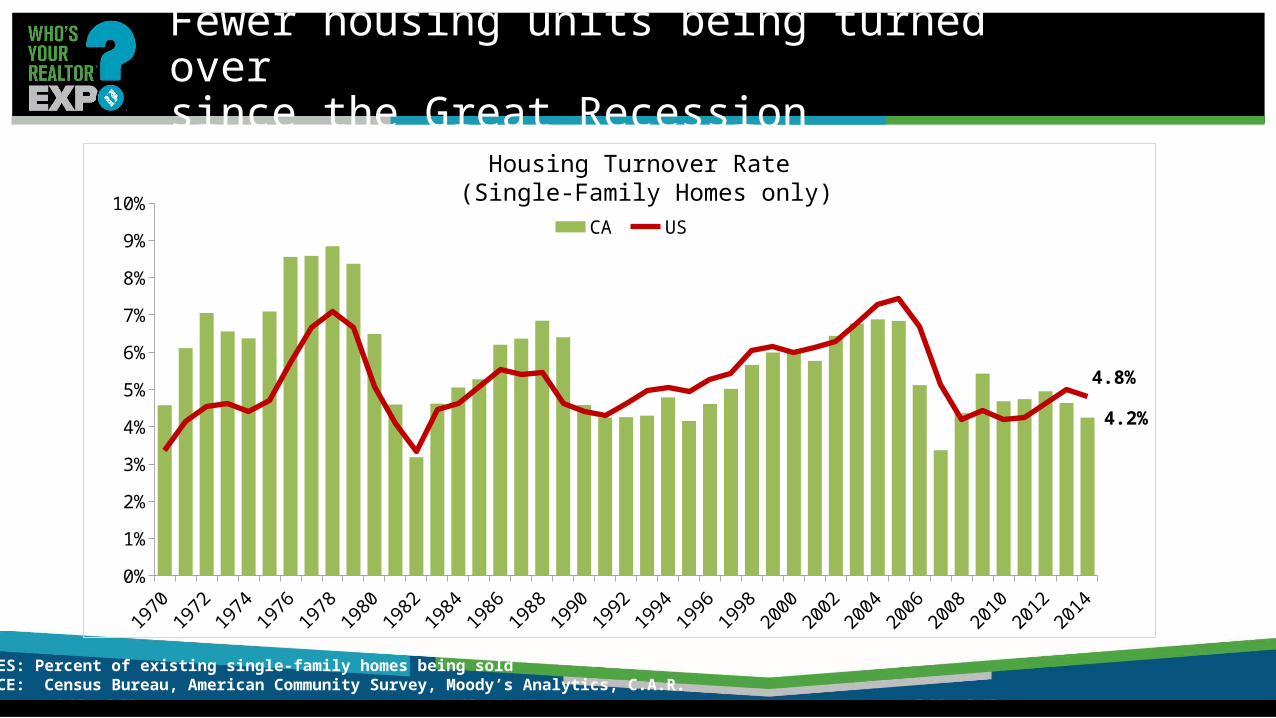
Fewer housing units being turned over since the Great Recession
1970
1972
1974
1976
1978
1980
1982
1984
1986
1988
1990
1992
1994
1996
1998
2000
2002
2004
2006
2008
2010
2012
2014
0%1%2%3%4%5%6%7%8%9%
10%
4.2%
4.8%
CA US
SERIES: Percent of existing single-family homes being sold SOURCE: Census Bureau, American Community Survey, Moody’s Analytics, C.A.R.
Housing Turnover Rate (Single-Family Homes only)
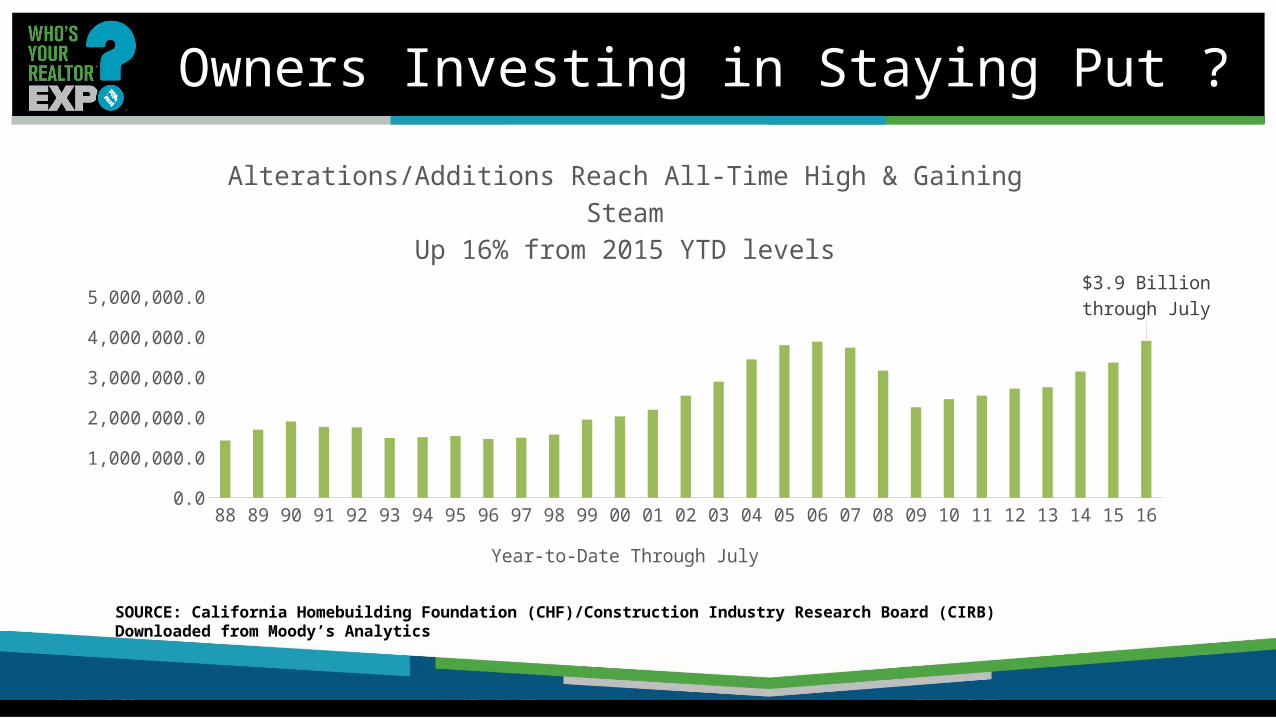
Owners Investing in Staying Put ?
88 89 90 91 92 93 94 95 96 97 98 99 00 01 02 03 04 05 06 07 08 09 10 11 12 13 14 15 160.0500,000.0
1,000,000.01,500,000.02,000,000.02,500,000.03,000,000.03,500,000.04,000,000.04,500,000.0
$3.9 Billionthrough July
Alterations/Additions Reach All-Time High & Gaining SteamUp 16% from 2015 YTD levels
Year-to-Date Through July SOURCE: California Homebuilding Foundation (CHF)/Construction Industry Research Board (CIRB)Downloaded from Moody’s Analytics
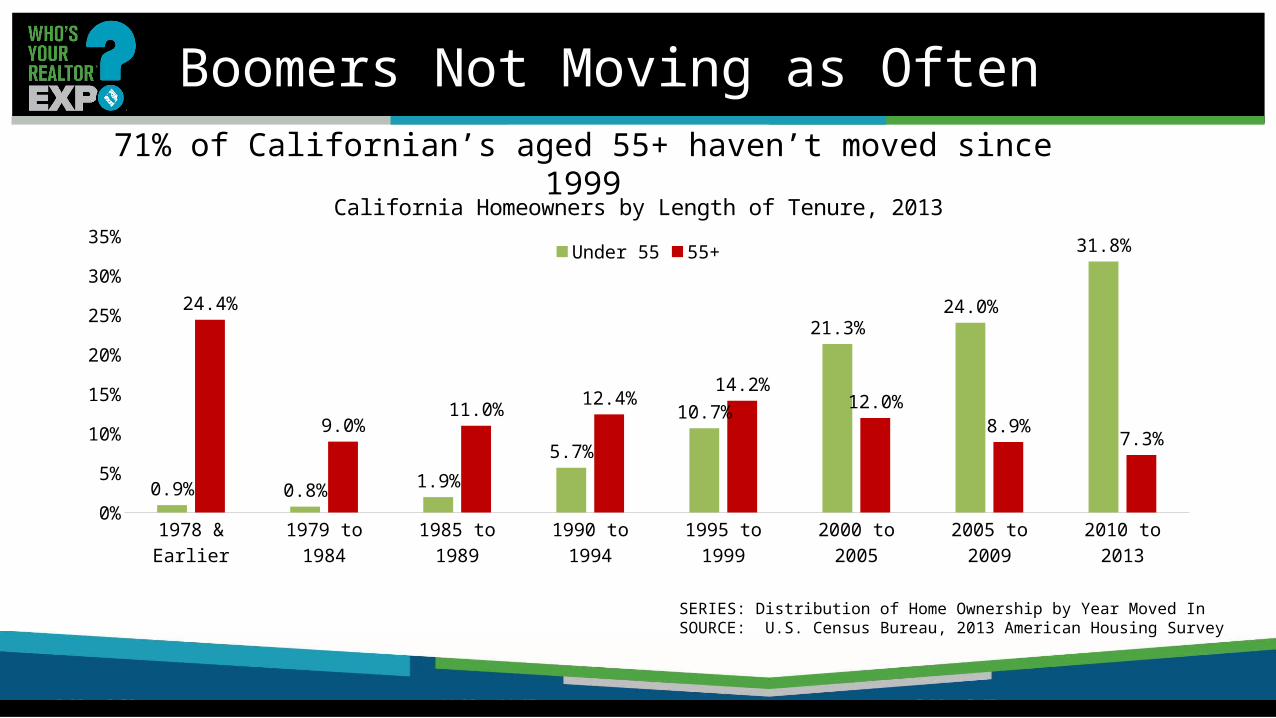
Boomers Not Moving as Often
1978 & Ear-lier
1979 to 1984
1985 to 1989
1990 to 1994
1995 to 1999
2000 to 2005
2005 to 2009
2010 to 2013
0%
5%
10%
15%
20%
25%
30%
35%
0.9% 0.8% 1.9%5.7%
10.7%
21.3%24.0%
31.8%
24.4%
9.0%11.0% 12.4% 14.2%
12.0%8.9% 7.3%
California Homeowners by Length of Tenure, 2013Under 55 55+
SERIES: Distribution of Home Ownership by Year Moved InSOURCE: U.S. Census Bureau, 2013 American Housing Survey
71% of Californian’s aged 55+ haven’t moved since 1999

More Single Family Units Now Rentals
SF Owners SF Renters0
1,000,000
2,000,000
3,000,000
4,000,000
5,000,000
6,000,000
7,000,000
8,000,0006,919,164
1,940,607
6,527,730
2,674,808
2000 2005 2010 2015 SOURCE: U.S. Census Bureau, Annual Social and Economic Supplement (ASEC) to the Current Population Survey (CPS)Downloaded from the National Bureau of Economic Research (NBER)
Potentially between 400,000 and 700,000 SF Rentals that Used to be Owner-Occupied

“Missing” 65,000 New Units Annually
SERIES: California New Housing PermitsSOURCE: Construction Industry Research Board
0
50000
100000
150000
200000
250000
300000
350000
Single Family Multi-Family
Household Growth: 165,000/yr.
2015: 95,822 (42,959 sf, 52,863 mf)2016p: 98,300 total units
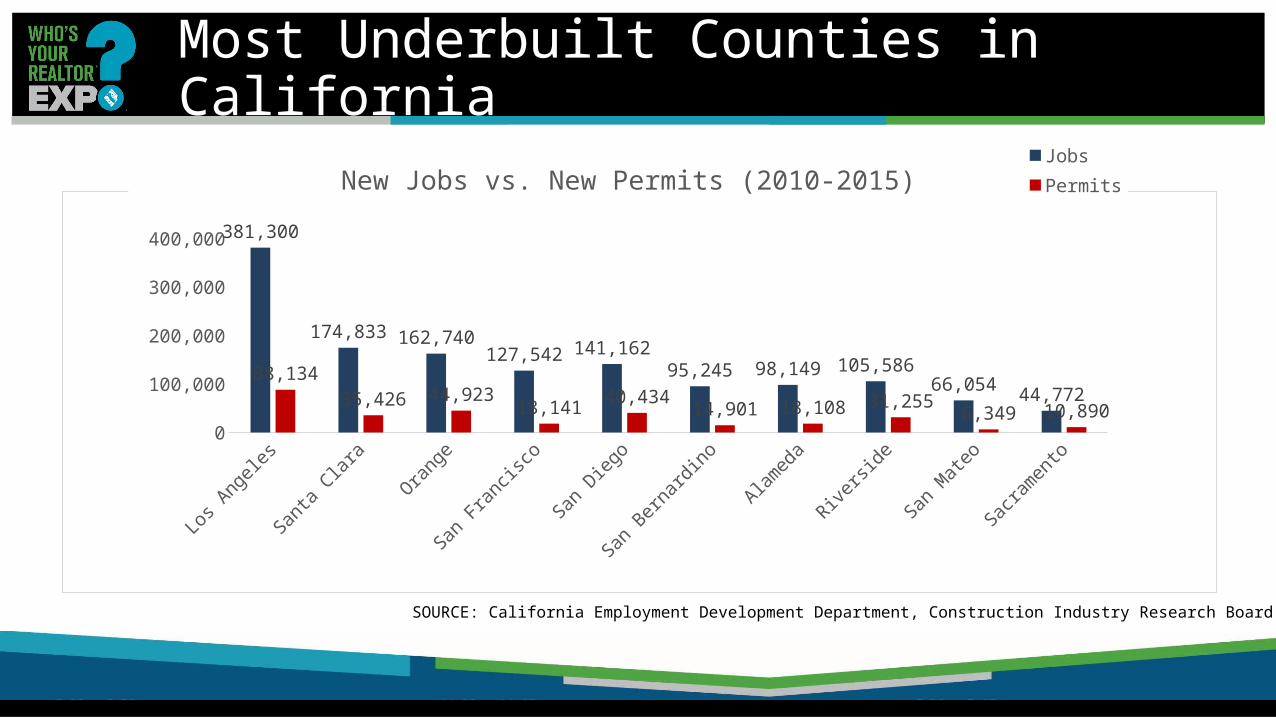
Most Underbuilt Counties in California
Los A
ngele
s
Santa
Clara
Orange
San F
rancis
co
San D
iego
San B
ernard
ino
Alamed
a
Riversi
de
San M
ateo
Sacra
mento
050,000
100,000150,000200,000250,000300,000350,000400,000450,000
381,300
174,833 162,740127,542 141,162
95,245 98,149 105,58666,054 44,772
88,13435,426 44,923 18,141 40,434 14,901 18,108 31,255 6,349 10,890
New Jobs vs. New Permits (2010-2015)JobsPermits
SOURCE: California Employment Development Department, Construction Industry Research Board

2017 Forecast

California Housing Market Outlook
SERIES: CA Housing Market OutlookSOURCE: CALIFORNIA ASSOCIATION OF REALTORS®
2011 2012 2013 2014 2015 2016p 2017f
SFH Resa les (000s) 422.6 439.8 414.9 382.7 408.8 407.3 413.0
% C hange 1.4% 4.1% -5.9% -7.8% 6.8% -0.4% 1.4%M edian Price ($000s) $286.0 $319.3 $407.2 $446.9 $474.4 $503.9 $525.6
% C hange -6.2% 11.6% 27.5% 9.8% 6.2% 6.2% 4.3%Housing A ffordability Index 53% 51% 36% 30% 31% 33% 29%
30-Yr FRM 4.5% 3.7% 4.0% 4.2% 3.9% 3.6% 4.0%

2017 Challenges & Opportunities

Lack of af -fordability,
56%Lack of in-
ventory; 28%
Mortagage rate increase; 10%
Recession, 6%
2017 Challenges
Q2 - What will be the biggest challenge for the housing market in 2017?

2017 Opportunities • Up your game – Always a good option• What business are YOU in?• Educate first time-home buyers – talk to their parents• Become well versed on down payment assistance
programs, debt management and improving credit to turn renters into buyers.
• Don’t give up on international buyers• Stay involved & stay current• Get married!