Embed Size (px)
Citation preview

1
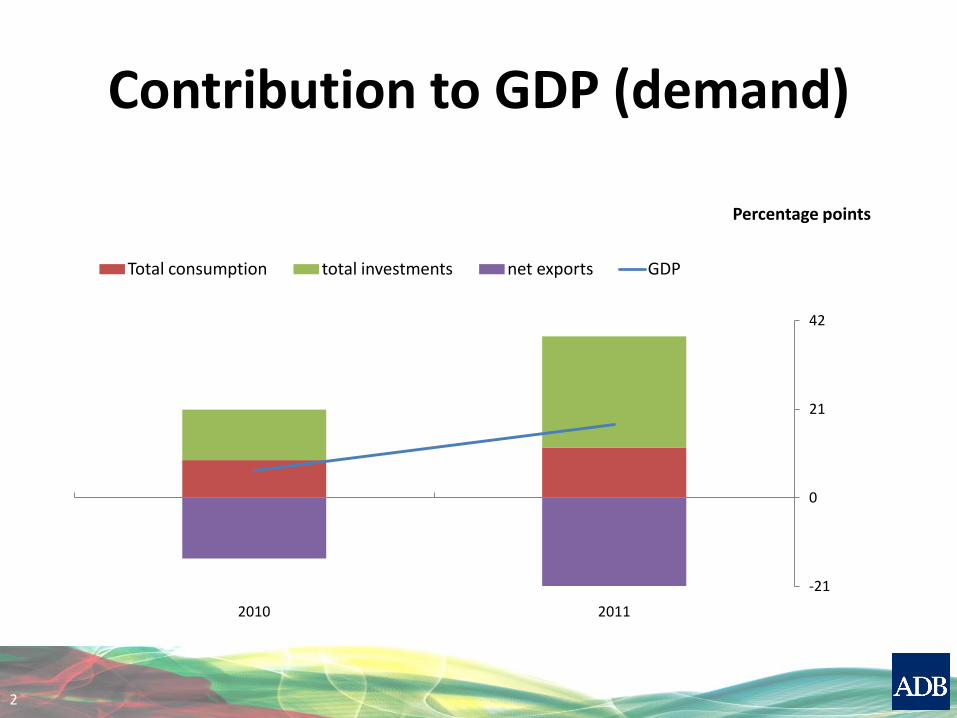
Contribution to GDP (demand)
2
-21
0
21
42
2010 2011
Percentage points
Total consumption total investments net exports GDP
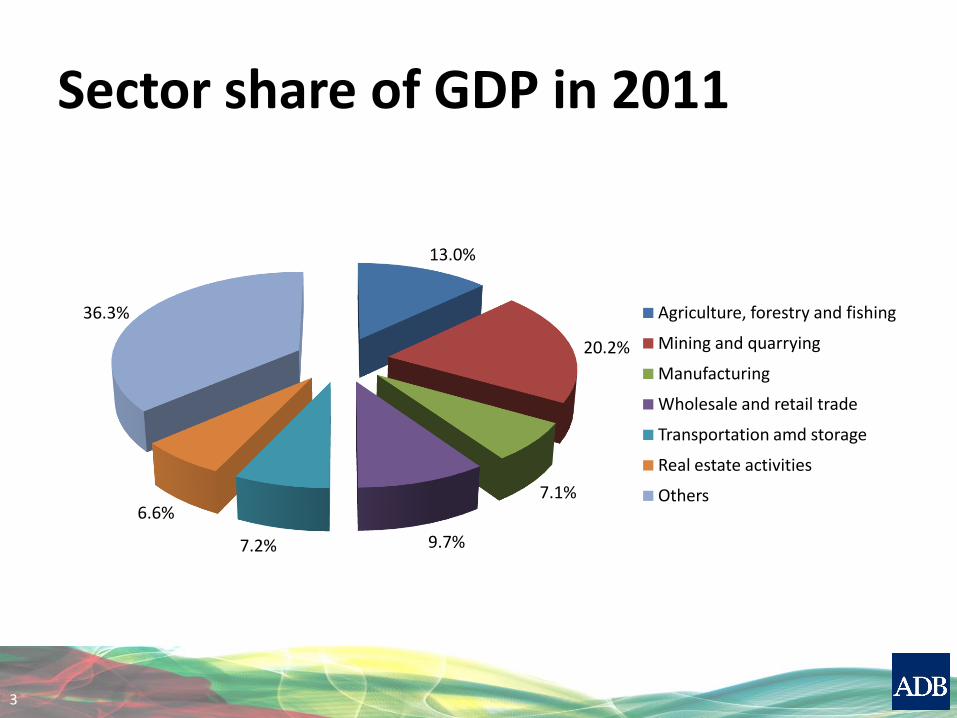
Sector share of GDP in 2011
3
13.0%
20.2%
7.1%
9.7%7.2%
6.6%
36.3% Agriculture, forestry and fishing
Mining and quarrying
Manufacturing
Wholesale and retail trade
Transportation amd storage
Real estate activities
Others
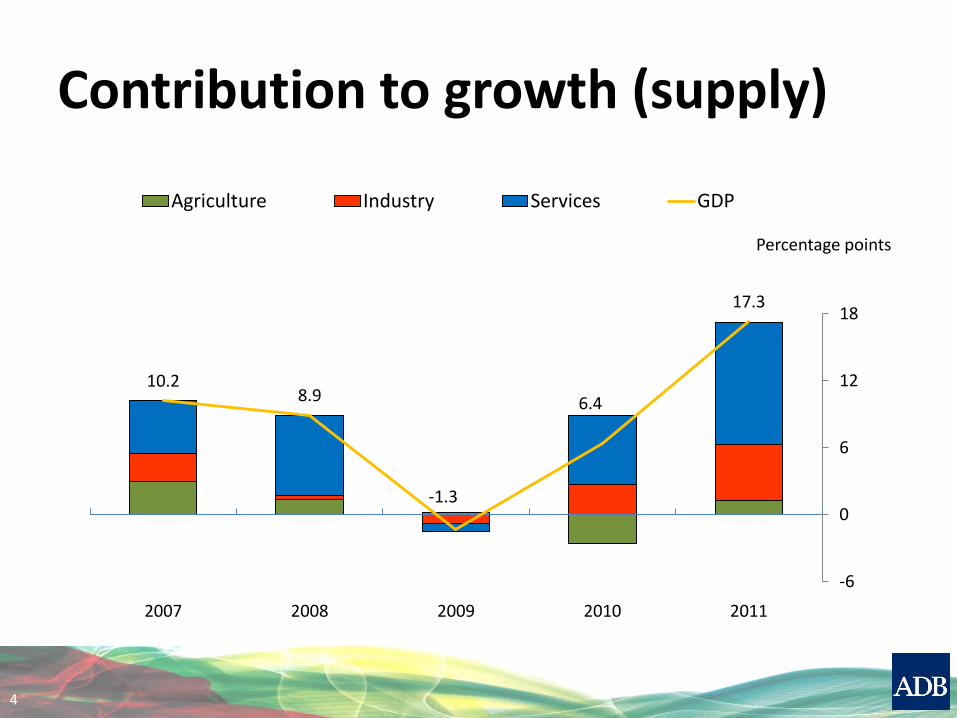
Contribution to growth (supply)
4
10.28.9
-1.3
6.4
17.3
-6
0
6
12
18
2007 2008 2009 2010 2011
Percentage points
Agriculture Industry Services GDP
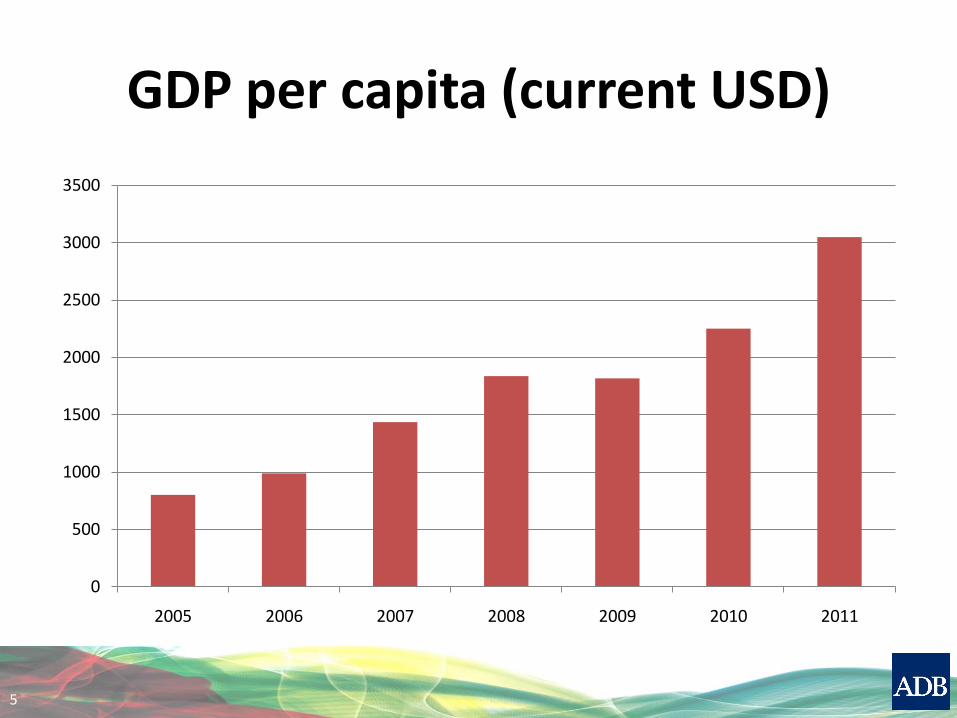
GDP per capita (current USD)
5
0
500
1000
1500
2000
2500
3000
3500
2005 2006 2007 2008 2009 2010 2011
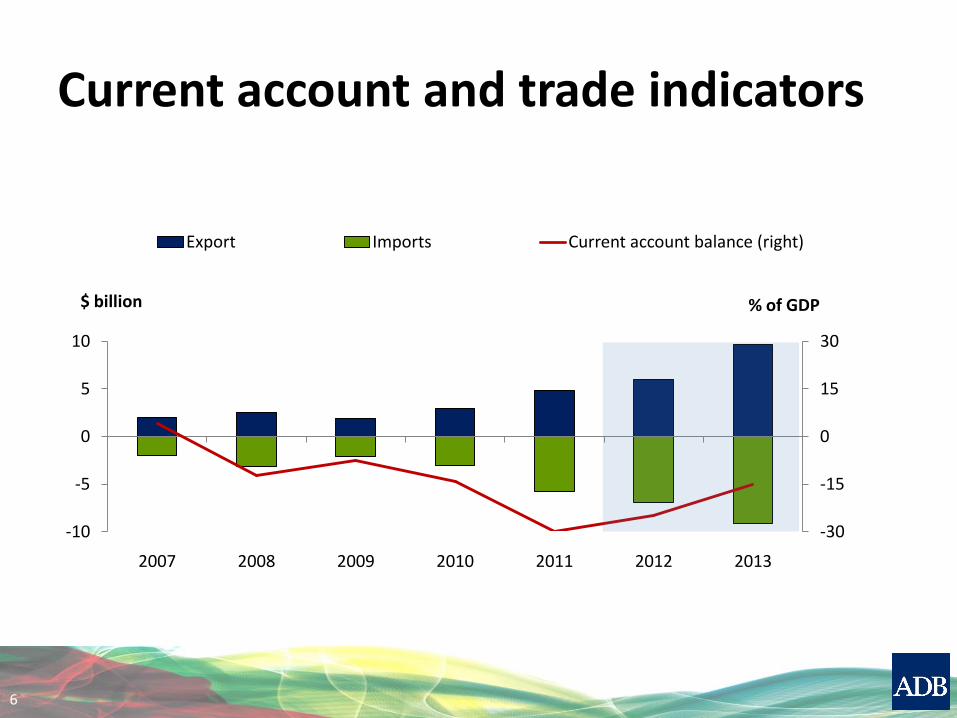
Current account and trade indicators
6
-30
-15
0
15
30
-10
-5
0
5
10
2007 2008 2009 2010 2011 2012 2013
% of GDP$ billion
Export Imports Current account balance (right)
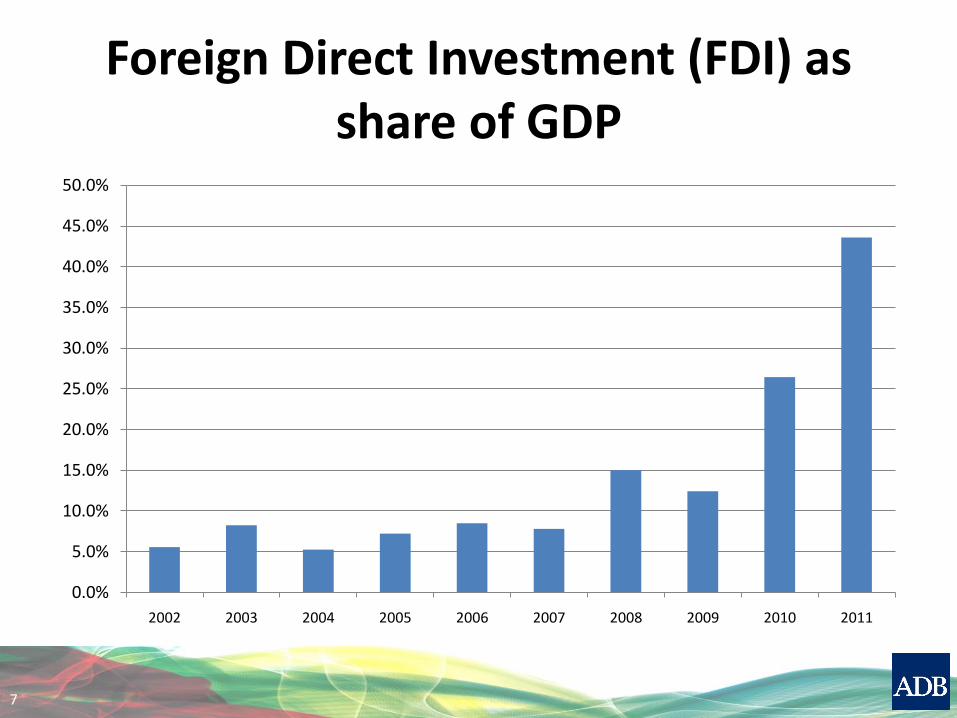
Foreign Direct Investment (FDI) as share of GDP
7
0.0%
5.0%
10.0%
15.0%
20.0%
25.0%
30.0%
35.0%
40.0%
45.0%
50.0%
2002 2003 2004 2005 2006 2007 2008 2009 2010 2011
Mining Economics
• The mining sector in Mongolia creates
– 90% of exports
– 30% of government revenue
– 20% of GDP
– 1.6 % of employment
8
Inequality and Economic Growth
• Inequality can weaken the basis of growth itself by:
– holding back accumulation of human capital;
– undermining social cohesion;
– weakening the quality of governance and institutions; and
– increasing pressure for inefficient populist policies
9
Two important medium-term challenges for Mongolia
• Strengthen economic and political institutions to ensure transparent, accountable and equitable management of natural resource revenue
• Encourage diversification of the economy and create jobs by supporting investment in non-resource sectors
10
Confronting rising inequality in Asia
11
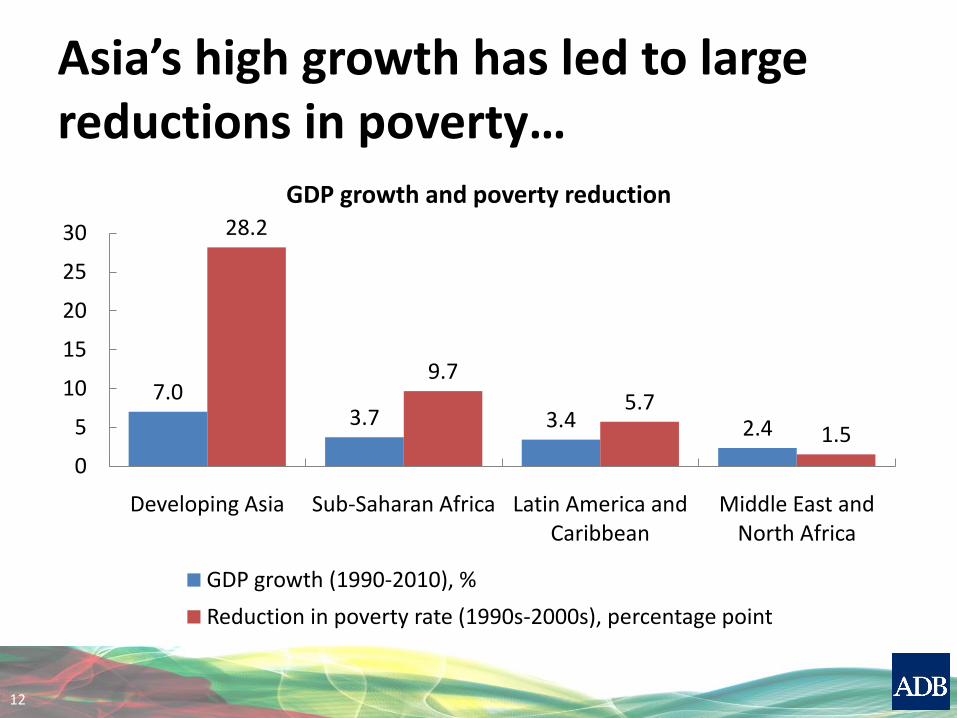
Asia’s high growth has led to large reductions in poverty…
7.03.7 3.4 2.4
28.2
9.7
5.7
1.5
0
5
10
15
20
25
30
Developing Asia Sub-Saharan Africa Latin America and Caribbean
Middle East and North Africa
GDP growth and poverty reduction
GDP growth (1990-2010), %
Reduction in poverty rate (1990s-2000s), percentage point
12
…but was accompanied by rising inequality in many countries
• Inequality increased in countries accounting for more than 80% of Asia’s population
• Gini coefficients worsened from:
– 32 to 43 in the PRC
– 33 to 37 in India
– 29 to 39 in Indonesia
• Taking developing Asia as a single unit, its Ginicoefficient went from 39 to 46
13