Embed Size (px)
Citation preview

27 August, 2015
Alex Stevens, Chief Executive Officer
Paul McCarthy, Chief Financial Officer
FY15 Full YearResults Presentation
For
per
sona
l use
onl
y
Contents
1. Highlights
2. Operational performance
3. Financial performance
4. Strategic priorities
5. Outlook
6. AppendixFor
per
sona
l use
onl
y

1. Highlights
For
per
sona
l use
onl
y

4
1. Details of normalisations in both FY14 and FY15 are included in the appendix of this presentation2. Revenue growth excluding Energy Watch and excluding the adverse impact of lower discount unwind was 13%3. Includes Energy Watch
Summary – diversification benefits delivers strong result
Strong FY15operational result
Key highlights
Health contribution: 59% of all ISU revenue in FY15 vs 70% in FY14
Energy contribution: 18%3 of all ISU revenue in FY15 vs 7% in FY14
Health: Strong volume growth of 10% offset by lower RPS and discount unwind
Revenue mix: Up-front ↑26%, trail ↓15%
Business model: Improved website performance, mobile responsiveness and conversion
Partners: Stronger and more collaborative relationships including NIB and HBF
NIA: $42.1m settlement, new multi-year partnership with GMHBA
FY15 Normalised1
Growth
Normalised1 Reported
Revenue $157.2m ↑15%2 ↑31%
EBIT $25.1m ↑10% ↑124%
NPAT $21.4m ↑17% ↑54%
Operating cash flow $27.5m ↑122% ↑116%
For
per
sona
l use
onl
y

2. Operational Performance
For
per
sona
l use
onl
y

6
FY15 operational performance highlightsSolid progress against key business drivers1,2
Deliberate easing in most verticals to align with capacity
Focus on improvement in quality
Investment in Energy resulted in positive Energy lead growth
Improvement across majority of verticals, particularly Energy
Reflects past investment in people, systems & processes
Home Loans and Broadband re-configuration proceeding well
Growth in sales driven mostly by focus on conversion
Health up 10% on prior year
Energy up significantly
Decrease largely reflective of shift in mix of business
Health 6% down on prior year, with consumers trading down
Energy RPS up significantly
Leads(‘000s)
Conversion(%)
Sales(‘000s)
Revenue Per Sale
($)
Leads(m)
Conversion(%)
Revenue Per Sale(RPS)
Sales Units(000s)
1. The definitions of Leads, Conversion, Sales Units and RPS are detailed in the 2015 Annual Financial Report2. All FY15 metrics include Energy Watch but exclude iSelect Money
FY14 FY15 Change
3.8 3.8 -1%
FY14 FY15 Change
6.6% 9.7% 3.1pp
FY14 FY15 Change
250 362 45%
FY14 FY15 Change
$549 $457 -17%For
per
sona
l use
onl
y

7
FY15 segment performanceHealth & Car Insurance
Health
Sales unit growth well above system growth
Significant improvements in contact penetration and conversion
Adverse product mix due to market trend of consumers trading down:
• RPS -6%
• Decrease in combined-cover policy sales
• Decrease in mid and top hospital cover sales
• Reduced availability of certain product typese.g. mid-range pregnancy
Net revenue growth also impacted by reduced discount unwind
Car
Revenue down due to contract renegotiation in FY14: RPS -22%
Strong conversion performance and volume growth
1. Health revenue and EBITDA in FY15 impacted by lower discount unwind following revaluation of trail commission receivable at 30 June 20142. Excluding the impact of lower discount unwind at June 30 2014, YoY revenue growth would have been -1%
HealthFY15 vs FY14
+13% + 10% -6%
Conversion Sales Units RPS
Segment revenue 104.3 101.0 -3%
Segment EBITDA 32.0 24.4 -24%
Margin 31% 24% -7pp
HAC $m FY14 Change FY15
For
per
sona
l use
onl
y

8
HealthAdverse mix shift in FY15
Initiativescommenced
For
per
sona
l use
onl
y

9
FY15 segment performanceHousehold Utilities and Financial
Energy
iSelect Energy revenue up 147%
Investment in marketing and staffing for future growth
Energy Watch integration progressing smoothly
Emerging businesses
Strong revenue growth across all other verticals including:
• up 20%
• Home Loans up 51%
• Broadband up 65%
1. Operating metrics exclude Energy Watch
Energy1
FY15 vs FY14
+65% + 77% +38%
Conversion Sales Units RPS
Segment revenue 32.4 56.2 74%
Segment EBITDA 1.3 9.5 625%
Margin 4% 17% 13pp
HUF $m FY14 Change FY15
For
per
sona
l use
onl
y

3. Financial Performance
For
per
sona
l use
onl
y

11
Financial performance - summarySolid growth across the board
1. Details of normalisations in both FY14 and FY15 are included in the appendix of this presentation2. Revenue growth excluding Energy Watch and excluding the adverse impact of lower discount unwind was 13%
ReportedNormalised1
Income Statement
$m, YE 30 June
Revenue 136.7 157.2 h 15% 120.4 157.2 31%
EBITDA 29.2 31.1 h 6% 12.1 18.6 54%
EBIT 22.8 25.1 h 10% 5.6 12.6 124%
NPAT 18.3 21.4 h 17% 6.3 9.6 54%
EPS (cents) 7.0 8.2 h 17% 2.4 3.7 54%
Operating cashflow 12.4 27.5 h 122% 11.5 25.0 116%
ChangeFY15FY14 FY15 FY14Change
2
For
per
sona
l use
onl
y

12
P&LSolid revenue, EBIT and NPAT growth
Revenue up 15%
Investment in iMoney equity accounted
Interest income from cash holdings and NIA loan
Normalised NPAT up 17%
Large shift in revenue mix towards up-front continuing
EBIT up 10%
Key observations
1. Details of normalisations in both FY14 and FY15 are included in the appendix of this presentation
Margins reflective of business mix and health revenue
Overhead growth moderate, albeit investments made
Gross profit up 5%
Income Statement Change
$m, YE 30 June FY14 FY15 %
Upfront revenue 99.1 125.2 26%
Trail commission revenue 37.6 32.0 -15%
Revenue 136.7 157.2 15%
Gross profit 63.1 66.3 5%
% revenue 46% 42%
EBITDA 29.2 31.1 6%
% revenue 21% 20%
EBIT 22.8 25.1 10%
% revenue 17% 16%
Interest (Income)/Expense -3.4 -5.8 69%
Loss from Associate 0.0 0.3 n.m.
Tax Expense 7.9 9.2 16%
NPAT 18.3 21.4 17%% revenue 13% 14%
EPS 7.0 8.2 17%
Normalised
For
per
sona
l use
onl
y

13
Cash flowStrong operating cashflow and cash conversion1
Strong growth in operating cash flow due to:
• faster growth in ‘upfront’ health policies
• contribution of newer businesses, notably Energy
• tight operational management
• operating cash flow also positive net of NIA Health advances
Investing cash flow composition:
• ongoing R&D / I.T. related capex
• acquisition of Energy Watch
• investment in iMoney
• NIA advances in line with earned commissions
Key observations
1. Cash conversion = operating cash flow divided by EBITDA2. Details of normalisations in both FY14 and FY15 are included in the appendix of this presentation
2
Cash Flow Statement
$m, YE 30 June FY14 FY15
Operating cashflow 11.5 25.0 116%
Capital expenditure -4.8 -4.4 -10%
Acquistion of subsidiaries 0.0 -9.7 n.m.
Investment in associates 0.0 -4.6 n.m.
Interest income 4.0 5.6 39%
NIA facility advances -17.4 -17.9 3%
Investing cashflow -18.2 -30.9 70%
Finance costs -0.7 -0.1 -81%
Proceeds from share issues 1.6 0.8 -53%
IPO cost payments -3.6 0.0 -100%
Financing cashflow -2.8 0.6 -122%
Net movement in cash -9.4 -5.4 -43%
Normalised operating cashflow 12.4 27.5 122%
Normalised EBITDA 29.2 31.1 6%
Cash conversion 42% 88% 46pp
Change
For
per
sona
l use
onl
y

14
Cash conversionAcceleration in performance
1. Normalised. Details of normalisations in both FY14 and FY15 are included in the appendix of this presentation. FY11 to FY13 indicative only.
Operating cash flow1 ($3.3m) ($0.4m) $4.2m $12.4m $27.5m
EBITDA1 $17.4m $24.1m $25.0m $29.2m $31.1m
-19%
-2%
16%
42%
88%
-20%
0%
20%
40%
60%
80%
100% FY11A FY12A FY13A FY14A FY15A
For
per
sona
l use
onl
y

15
Balance sheetNet cash growth from $71m in June 2015 to $113m in July 2015
Includes goodwill from Energy Watch acquisition
Key observationsBalance Sheet
$m, YE 30 June FY14 FY15
Cash 75.9 70.5 -7%
Receivables 28.0 33.0 18%
Trail commission receivable 99.0 101.6 3%
NIA receivable 32.8 40.7 24%
PP&E 7.7 7.1 -8%
Intangibles 37.5 46.2 23%
Investment in associate 0.0 4.3 n.m.
Other 3.6 3.8 4%
Total assets 284.5 307.2 8%
Payables 18.0 22.1 23%
Provisions 8.7 14.1 62%
Net deferred tax liability 21.5 24.1 12%
Total liabilities 48.2 60.3 25%
Net assets 236.3 246.9 4%
Contributed equity 173.0 173.7 0%
Reserves 7.0 7.2 3%
Retained earnings 56.4 66.0 17%
Equity 236.3 246.9 4%
Change
Cash position strong (further $42.1m received in July)
NIA receivable balance reflective of increased sales
Trail book attrition increasing but provided for
Increase in provisions reflective of tax payable
Increase in net DTL due to use of tax losses
Investment in iMoney equity accounted
For
per
sona
l use
onl
y

16
Strong shift toward
upfront revenue
Attrition in Health book
continues to increase,
but currently adequately
provided for
29%
51%
63%92%
Year end balance
Revenue
Cash receipts
Revaluation adjustment 30 June 2014
$m
Trail book cash conversionCash receipts continue to increase as a % of trail revenue…from 29% to 92%
Key observations
For
per
sona
l use
onl
y

4. Strategic priorities
For
per
sona
l use
onl
y

18
1. Includes Energy Watch
Key achievements in FY15
Improved web and mobile functionality and customer engagement
Investment in R&D and core systems: data warehouse and network infrastructure
Energy vertical successfully established
Capability enhanced to drive other verticals
Strategic partnerships widened and deepened: especially Health and Life insurance
New long term agreements:
Continued investment in brand – quality and depth of engagement
Further development and integration of digital channels
Data mining tools rolling out across all verticals and applied to marketing
Data warehouse upgraded, single customer view established
Technology
BusinessVerticals
Partners
Brand
Data
Contact centre leadership enhanced
More sophisticated people management systems and processesOperations
Best practice data security and compliance regimes introduced
Independent PwC review of unbiased contact centre advice and our health algorithmCompliance
NIA Health loan resolved, iSelect adopted a renewed focus on cash flow and ROIC
Independent Chairman appointed, moved to conventional governance structure Corporate
Executive team reset and category leadership introduced
Employee engagement at all time high, new reward and recognition program launched
People &Culture
For
per
sona
l use
onl
y

19
brand update
Continuedinvestment in brand during FY15
Total marketing investment up 11% versus FY14
• Increased quality of Health ‘above the line’ (ATL) and digital display activity
• Increased Energy ATL and ‘search engine marketing’ (SEM) activity
Spend also now focused on qualitative metrics: trust, consideration and loyalty
Increased sophistication and investment in digital capability
1. Excludes Energy Watch marketing costs
For
per
sona
l use
onl
y

20
Partnerships – a supermarket of brands
1. Includes Energy Watch
16 new partners in FY15…partnership sophistication enhanced
For
per
sona
l use
onl
y

21
Technology and product development
•
•
•
For
per
sona
l use
onl
y

5. Outlook
For
per
sona
l use
onl
y

23
Strategic horizons
Stabilise & build foundations
Build scale & diversify earnings
Yield & expansion
FY16Up to FY15 Longer term
New CEO and Executive team Established strategy and priorities Building baseline operational capability Investment in people, systems and processes Revalued trail book Stabilised company post-IPO Strengthened and added new partners New independent Chairman Resolved NIA Health loan
Broaden brand reach Invest in marketing Invest in direct staffing Invest in R&D, systems and technology Finesse Health Accelerate maturity of other verticals Strong focus on cash flow and ROIC Expand “WeSelect” (cross-serve) penetration
Multiple verticals established Scale, market share, profitability Deeper sector digitisation Explore sector adjacencies Enter new verticals Lifetime customer relationships
1
2
3
Stabilise
Build
AcceleratedEPS growth
For
per
sona
l use
onl
y

24
Investingfor the future
• Investment: strengthen established and accelerate growth of developing businesses
• Brand: re-launch planned, further evolution of brand in line with long term strategy
• Direct staffing: earlier intakes to enhance competency and bolster experience levels
• Technology: Investment in R&D and core systems to build platforms for the future
FY16 Outlook
Financials
• Revenue: Strong growth expected to continue
• FY16 EBIT: Expected range of $26m - $28m (normalised)
• H1 FY16: EBIT to be materially below H1 FY15 due to above investments
• Interest income: Will be significantly lower in FY16 due to NIA Health resolution
Capitalmanagement
• Board review ongoing: considering a number of initiatives including:
• on-market buyback of up to 5% of ISU issued capital over a 12 month period; and
• commencement of paying a fully franked dividend (timing to be confirmed)For
per
sona
l use
onl
y

25
Health
• Consumer propensity to trade down expected to be an ongoing industry issue
• RPS management focus to increase, with strengthened partnerships assisting
• Large investment in direct staffing in H1 FY16 expected to deliver benefits in H2 FY16, and beyond
• Increased attrition (lapses) may adversely impact trail book if observed increases continue
• Longer term fundamentals of health insurance remain positive
Energy
• Expect strong revenue growth but requires reinvestment
• Step up in marketing investment to drive increased market presence and relevance
• Continued investment in staffing and partnerships
• Completion of Energy Watch integration in FY16
FY16 OutlookF
or p
erso
nal u
se o
nly

26
Otherbusinesses
Life Insurance
• Ongoing benefit of panel expansion
• Commenced policy sales via superannuation
Car Insurance
• Revenue and earnings growth driven by ongoing operational improvements
• New partner trials continuing
investment
• Unique visitors (UVs) and revenue growth ahead of expectation
• Strong focus on credit cards
Home Loans
• Revenue growth continuing but requires reinvestment
• Business re-configuration ongoing, including roll-out of digital consumer processes
• Business model now more established with plans to up-scale
• Ongoing progress on partnerships and technology investment required
Broadband
• Business model evolving with plans to up-scale
• Ongoing progress on partnerships (a vibrant sector) and staffing investment
• Establishment of robust technology platform
FY16 OutlookF
or p
erso
nal u
se o
nly

6. Appendix
For
per
sona
l use
onl
y

28
Reported vs normalised results FY14 and FY15
$m, YE 30 JuneReported
Result
CEO
Costs
Trail Re-
Valuatn
Normal-
ised
Result
Reported
Result
NIA Loan
Impair-
ment
NIA
Trans-
action
Costs
Chair-
man
Costs
Energy
Watch
Integratn
Costs
Normal-
ised
Result
Operating revenue 120.4 16.3 136.7 157.2 157.2
Cost of sales 73.6 73.6 90.9 90.9
Gross profit 46.7 0.0 16.3 63.1 66.3 0.0 0.0 0.0 0.0 66.3
Total expenses 34.7 -0.9 33.8 47.7 -10.0 -0.8 -1.0 -0.7 35.1
EBITDA 12.1 0.9 16.3 29.2 18.6 10.0 0.8 1.0 0.7 31.1
D&A 6.5 6.5 6.0 6.0
EBIT 5.6 0.9 16.3 22.8 12.6 10.0 0.8 1.0 0.7 25.1
Interest (Income)/Expense -3.4 -3.4 -5.8 -5.8
Loss from Associate 0.0 0.0 0.3 0.3
Profit before tax 9.0 0.9 16.3 26.2 18.0 10.0 0.8 1.0 0.7 30.6
Income tax expense 2.8 0.3 4.9 7.9 8.4 0.3 0.3 0.2 9.2
NPAT 6.3 0.6 11.4 18.3 9.6 10.0 0.6 0.7 0.5 21.4
EPS 2.4 0.2 4.4 7.0 3.7 3.8 0.2 0.3 0.2 8.2
Operating cash flow 11.5 0.9 12.4 25.0 0.8 1.0 0.7 27.5
FY14 Normalisations FY15 Normalisations
For
per
sona
l use
onl
y

29
Gross metrics1 - including Money and
Leads(m)
Conversion(%)
Revenue Per Sale(RPS)
Sales Units(000s)
1. The definitions of Leads, Conversion, Sales Units and RPS are detailed in the FY15 Financial Report
FY14 FY15 Change
5.8 6.0 4%
FY14 FY15 Change
12.5% 14.2% 1.7pp
FY14 FY15 Change
718 851 19%
FY14 FY15 Change
$195 $198 2%
Deliberate easing in most verticals to align with capacity
Softer market in Health in second half
Investment in Energy resulted in 7% lead growth in Energy
Improvement across majority of verticals, particularly Energy
Reflects past investment in people, systems & processes
Home Loans and Broadband re-configuration proceeding well
Growth in sales driven mostly by focus on conversion
Health up 10% on prior year
Energy up significantly
Decrease largely reflective of shift in mix of business
Health 6% down on prior year, with consumers trading down
Energy RPS up 26%For
per
sona
l use
onl
y

30
NIA receivable balanceSettlement in July 2015
NIA loan settled on 31 July 2015
New multi-year agreement with GMHBA, including
the GMHBA, Frank and health.com.au brands
Total proceeds received: $42.1m
$40.7m received relative to loan of $50.7m
$1.4m received to discharge outstanding interest
Fees of $0.8m incurred in relation to the transaction
Key commentsYear end balance
Loan advances
Impairment charge
Cash settlement of loan balance
Balance $nil as at 31 July 2015
$m
For
per
sona
l use
onl
y

31
The story…
Historically… Products ≠ needs
Complexity and confusion reigned
Inertia
…private health insurance customers
were in the dark…
Then in 2000…
Cut through the complexity and confusion
Simple and easy to use
Products matched to changing needs
Delivered value
Today, our typical customer profile is…
…and they’re hungry for…
Young Professional
Affluent Intelligent
Tech-savvy Time-poor
Options Advice
…but above all else, VALUE…
+
For
per
sona
l use
onl
y

32
Source: PHIAC, iSelect analysis
If consumers aren’t getting value
iSelect gives them a conduit to:
1. Find value
2. Conveniently make a change
iSelect doesn’t
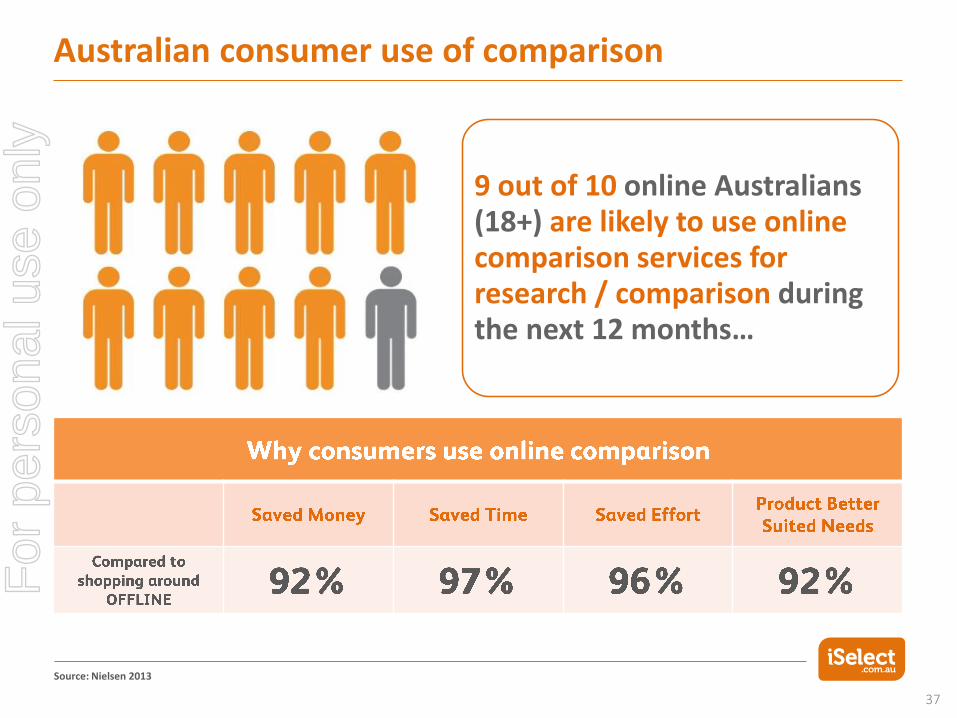
Save money Save time Save effort Find a product better suited to needs
Churn the market
Re-target customers
Re-market to customers
iSelect has a no-churn policy
>50% of our customers are new to PHI
What driveslapse?
33%
66% Affordability
Life stage change
Discontent with fund
Lack of innovation
10yrs of premium increases @ 3 x inflation
PHI rebate reduction(due to means testing)
Premiums increased by >6% again in 2015Discontinued
Switch
…the story
Why consumers use online comparison:
Source: Nielsen 2013
For
per
sona
l use
onl
y

33
The business model
Efficient, scalable, success-only distribution
High quality > data, compliance, management
Product innovation and targeting
No-churn policy > retention programs
iConnect:
Superior customer experience
Increased conversion
Specialist needs-based advice > value focus
End-to-end customer experience
ConversionPartners
Heavy investment > awareness & consideration
Leader positioning > consumer choice
Disruptive marketing message > value focus
High digital integration
iConnect >>> optimised lead management
Data-rich needs analysis
Real-time product selection algorithm
Flexible customer interface
Leads
Profitability
Barriers toentry
Brand
1 2
34
• Deep consumer understanding• Sophisticated segmentation• Lead generation optimisation
Total focus oncustomer needs
Full end-to-end service integration
Delightedcustomers
For
per
sona
l use
onl
y

34
consumer segment profiles
iSelect significantly over-indexes in young, wealthy
and well-educated consumers…passing through life stages
For
per
sona
l use
onl
y

35
Assumptions:
1) Indicative range of iSelect commission arrangements
2) Acquisition price, less net tangible assets per member acquired, presented a % of LTM premium revenue
3) Calculated from nib and Medibank annual reports. Assumes 70% of marketing relates to customer acquisition
4) Prevailing market metrics
5) Assumes 12%corporate discount over the life of the member. Calculated as the present value of the lifetime cost
6) Assumes average special offer of 5 weeks free
1
2
3
4
5
6
1 32 4 5 6
54% 35% 33% 12% 2% 5%
2.7 4.3 4.6 9.1 6.2 12.2
iSelect
Private health insurance customer acquisitionCost as % of annual premium
Source: Deloitte, global investment bank, iSelect research; 20141. Assumes 15% Gross Margin
is the most efficient customer acquisition channelF
or p
erso
nal u
se o
nly

36
delivers benefits beyond acquisition cost efficiencyF
or p
erso
nal u
se o
nly
37
Source: Nielsen 2013
Australian consumer use of comparison
9 out of 10 online Australians (18+) are likely to use online comparison services for research / comparison during the next 12 months…
For
per
sona
l use
onl
y

38
Source: IPSOS Health Care and Insurance Report (2013 Syndicated Survey)PHI = Private Health Insurance
PHI purchasers are driven by “ease and convenience”
Over half (57%) of those likely to
take out PHI in the next year declare
a strong likelihood of using
intermediaries / comparators
83% of those who use comparators
for PHI are driven by convenience,
ease, ‘navigate complexity’ and
time-saving factors
Only 16% of those who use
comparators for PHI are driven by a
desire to get the cheapest price
“The more complex and confusing PHI is perceived to be, the more
people will use comparators…indeed be driven to them”
“IPSOS believes high inflation rates for PHI premiums, cost of
living pressures, a general trend towards shopping around,
perceived complexity and confusion of PHI are driving consumers
to comparator sites, rather than the comparator sites being the
key motivator of the switch process in the first place.”
For
per
sona
l use
onl
y

39
The opportunity
All BusinessesHealth Insurance Market
Annual Commission Pool1
Health
1. Indicative calculation that assumes all sales attract a relevant third-party commission
For
per
sona
l use
onl
y

40
Up-front vs trail revenue over time
59%
71% 72%80%
41%
29% 28%20%
FY12 FY13 FY14 FY15
Upfront Trail
For
per
sona
l use
onl
y

41
Trail book valuationImpacted by three key assumptions
Volume of activepolicy holders
Annual premium increases
Discount rate
Impacted by expected attritionlargely resulting from:
1. switching due to:
• change in circumstances
• pricing
• product innovation
• increased awareness
2. changes in cover
3. regulatory changes
Higher attrition observed in iSelect’s health books
High switching behaviour following last premium rise
Continued health cost pressures and premium rises
Higher industry innovation and product promotion
Attrition rates for health range from 6.5% to 21.0%
Gross annual premium (varies by provider and policy type)
Continued health cost pressures and premium rises
• annual premium growth assumption: 6%
Risk free rate (aligned to commission term); plus
Margin (additional margin for residual risks not captured in forecast cashflow)
Applied rates: 4.3% to 6.5%
Risk to attrition & premiums now explicit in cashflow forecasts
Residual risk in discount rate reflects counter-party credit risk
• regulated insurers and banks
Description Recent Observations / Expectations in Health
1
2
3
Stated annual attrition rates based on weighted average attrition rates across policy age bands (i.e. <1 year, 1-2 years, 2-3 years, 3-4 years, 4-5 years, >5 years)And various policy books for each provider from which iSelect receives commission income.
For
per
sona
l use
onl
y

42
For
per
sona
l use
onl
y

43
Vertical channel prioritisation framework
For
per
sona
l use
onl
y

44
Important notice and disclaimerF
or p
erso
nal u
se o
nly


![FY16 3rd Quarter Financial Results [IFRS] · FY16 3rd Quarter Financial Results [IFRS] Hitachi High-Technologies Corporation January 27, 2017 ... FY15/Q1 FY15/Q2 FY15/Q3 FY15/Q4 FY16/Q1](https://img.pdfslide.net/doc/110x75/5ec630f9034f80098f725dcb/fy16-3rd-quarter-financial-results-ifrs-fy16-3rd-quarter-financial-results-ifrs.jpg)


![Announces Q4 & FY15 results [Result]](https://img.pdfslide.net/doc/110x75/577cb3551a28aba7118c3d58/announces-q4-fy15-results-result.jpg)