Embed Size (px)
Citation preview
Resetting the rules: A New Framework for Affordable Housing?
Bill Randolph, City Futures Research Centre UNSW
Presentation overview
• The ‘affordability crisis’
• What’s driving house prices?
• The problems of the low income renter
• A new Framework for tackling rental unaffordability
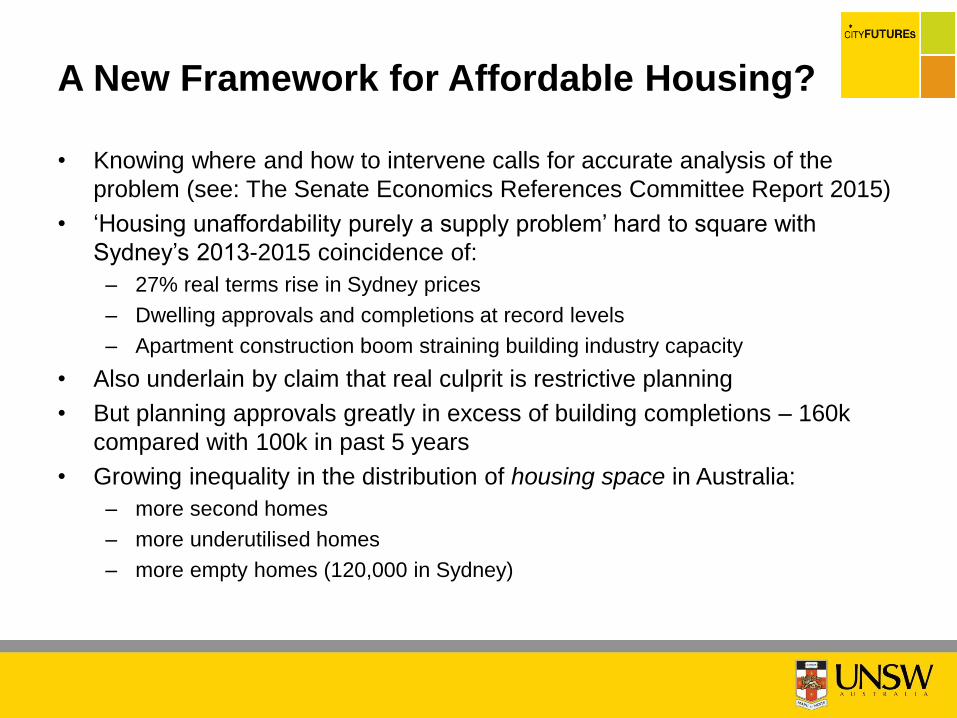
• Knowing where and how to intervene calls for accurate analysis of the
problem (see: The Senate Economics References Committee Report 2015)
• ‘Housing unaffordability purely a supply problem’ hard to square with
Sydney’s 2013-2015 coincidence of:
– 27% real terms rise in Sydney prices
– Dwelling approvals and completions at record levels
– Apartment construction boom straining building industry capacity
• Also underlain by claim that real culprit is restrictive planning
• But planning approvals greatly in excess of building completions – 160k
compared with 100k in past 5 years
• Growing inequality in the distribution of housing space in Australia:
– more second homes
– more underutilised homes
– more empty homes (120,000 in Sydney)
A New Framework for Affordable Housing?
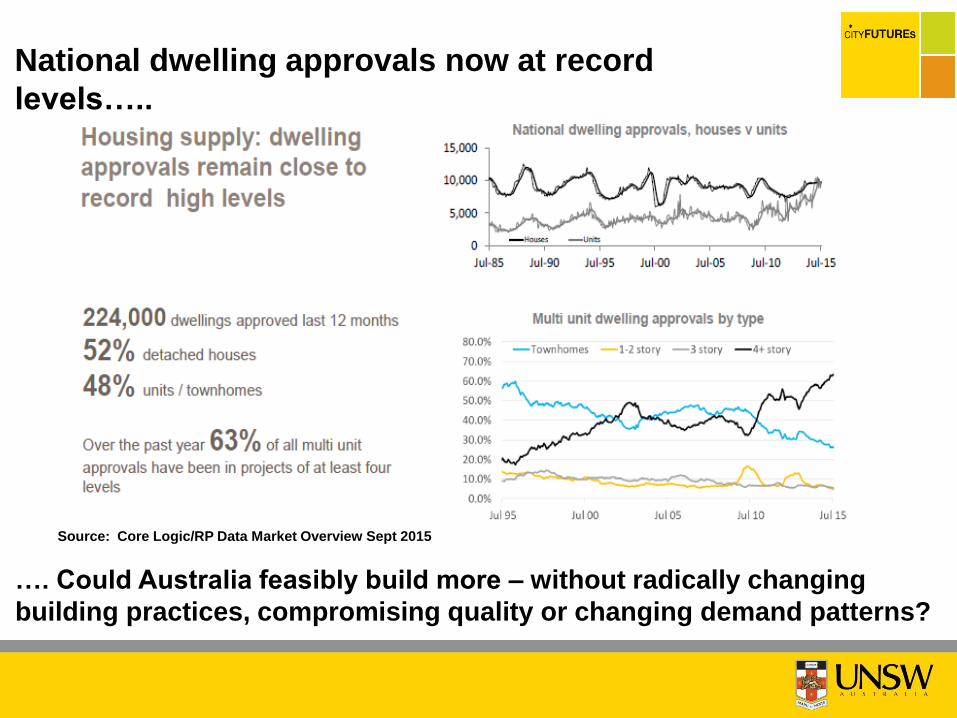
National dwelling approvals now at record
levels…..
…. Could Australia feasibly build more – without radically changing
building practices, compromising quality or changing demand patterns?
Source: Core Logic/RP Data Market Overview Sept 2015
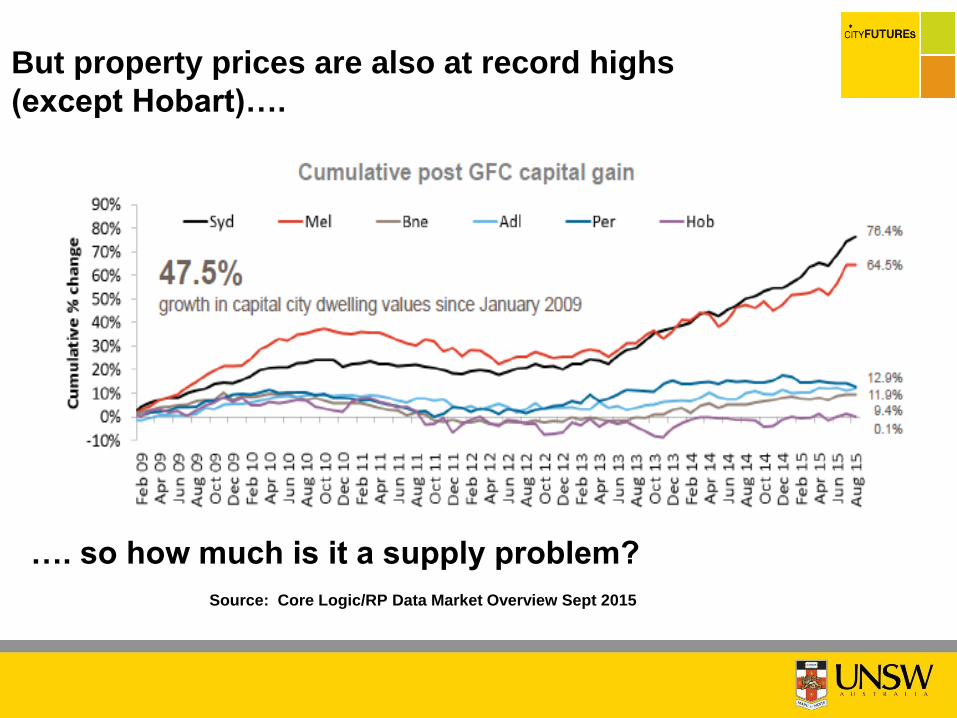
But property prices are also at record highs
(except Hobart)….
…. so how much is it a supply problem?
Source: Core Logic/RP Data Market Overview Sept 2015
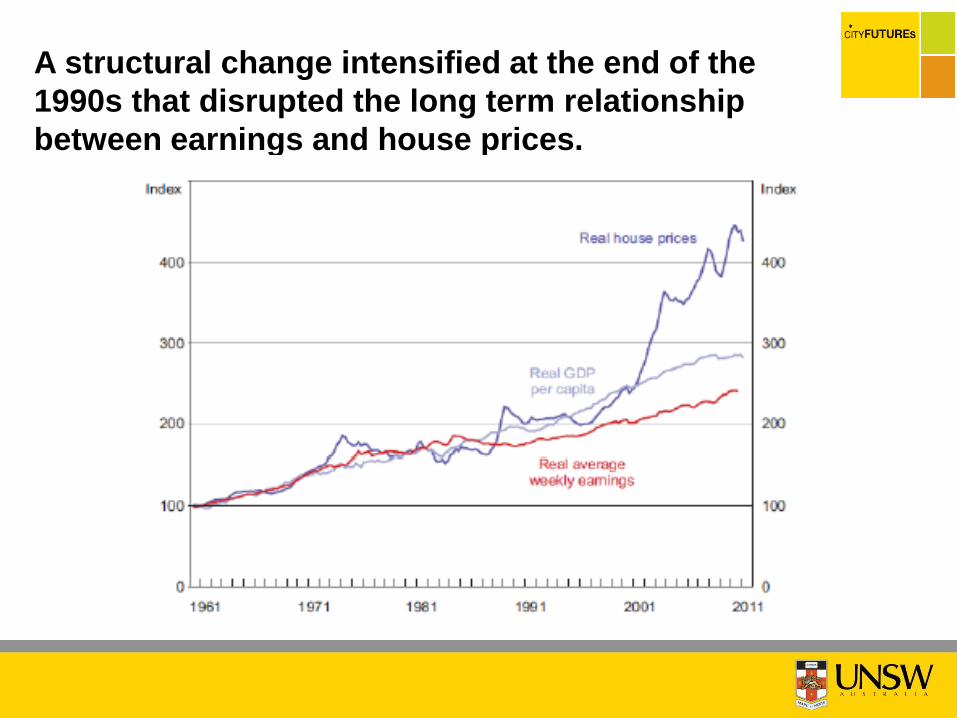
A structural change intensified at the end of the
1990s that disrupted the long term relationship
between earnings and house prices.
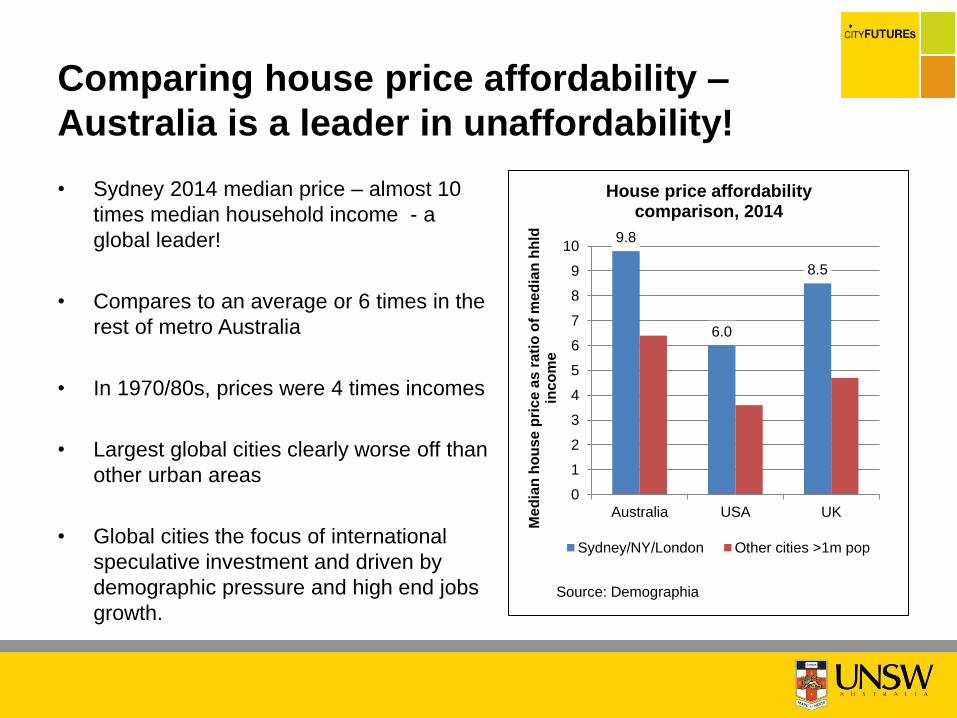
• Sydney 2014 median price – almost 10
times median household income - a
global leader!
• Compares to an average or 6 times in the
rest of metro Australia
• In 1970/80s, prices were 4 times incomes
• Largest global cities clearly worse off than
other urban areas
• Global cities the focus of international
speculative investment and driven by
demographic pressure and high end jobs
growth.
Comparing house price affordability –
Australia is a leader in unaffordability!
9.8
6.0
8.5
0
1
2
3
4
5
6
7
8
9
10
Australia USA UK
Me
dia
n h
ou
se
pri
ce a
s r
ati
o o
f m
ed
ian
hh
ldin
co
me
House price affordability comparison, 2014
Sydney/NY/London Other cities >1m pop
Source: Demographia
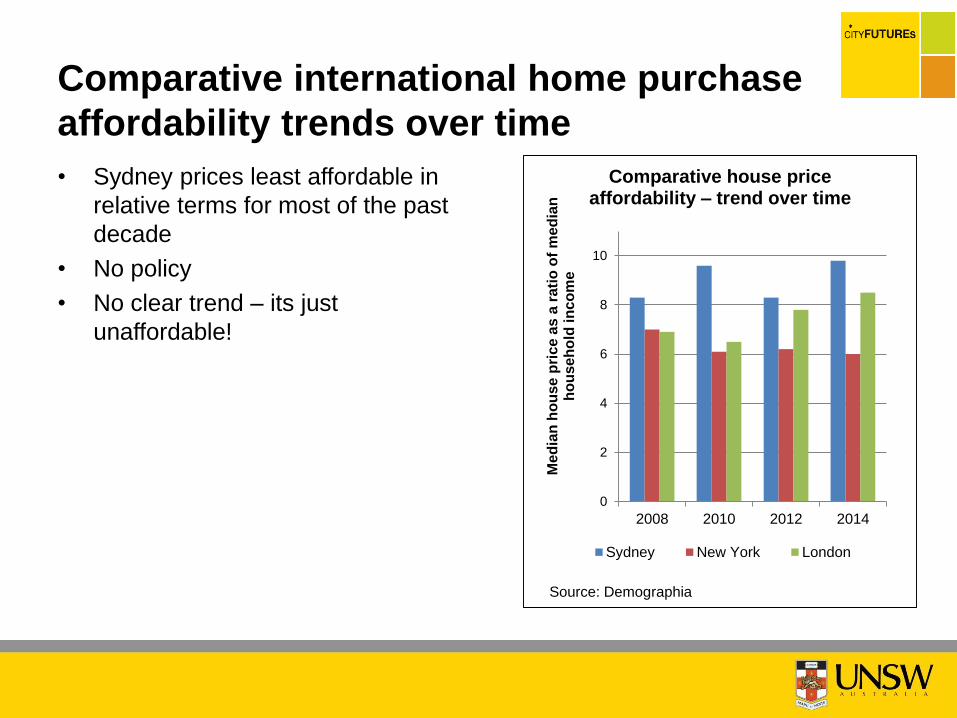
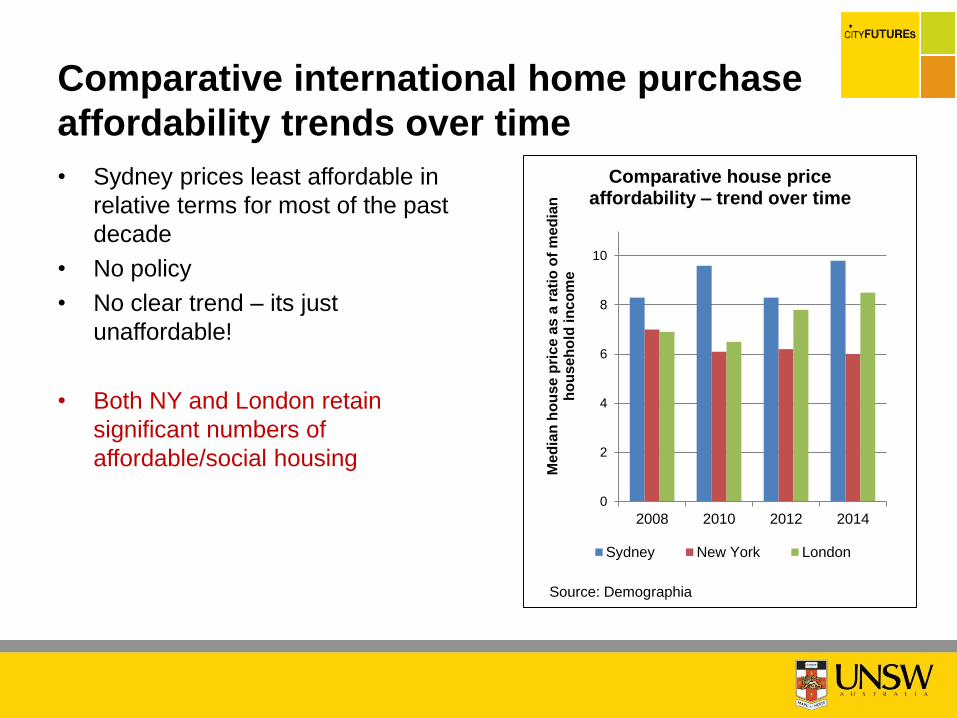
• Sydney prices least affordable in
relative terms for most of the past
decade
• No policy
• No clear trend – its just
unaffordable!
Comparative international home purchase
affordability trends over time
0
2
4
6
8
10
2008 2010 2012 2014
Me
dia
n h
ou
se
pri
ce a
s a
ra
tio
of
me
dia
n
ho
useh
old
in
co
me
Comparative house price affordability – trend over time
Sydney New York London
Source: Demographia
• Sydney prices least affordable in
relative terms for most of the past
decade
• No policy
• No clear trend – its just
unaffordable!
• Both NY and London retain
significant numbers of
affordable/social housing
0
2
4
6
8
10
2008 2010 2012 2014
Me
dia
n h
ou
se
pri
ce a
s a
ra
tio
of
me
dia
n
ho
useh
old
in
co
me
Comparative house price affordability – trend over time
Sydney New York London
Source: Demographia
Comparative international home purchase
affordability trends over time
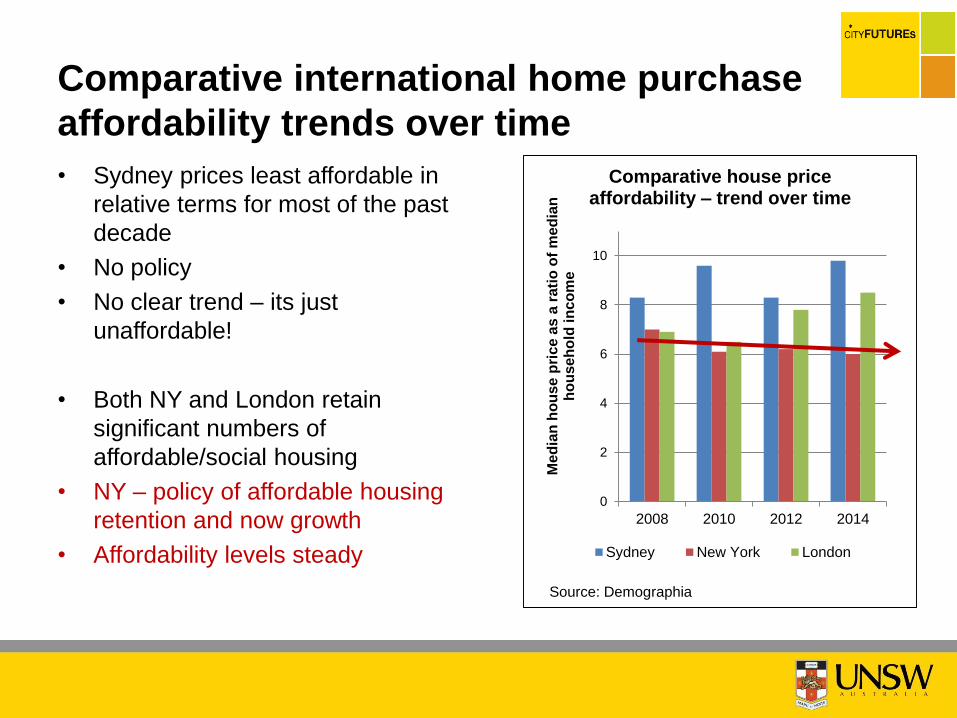
• Sydney prices least affordable in
relative terms for most of the past
decade
• No policy
• No clear trend – its just
unaffordable!
• Both NY and London retain
significant numbers of
affordable/social housing
• NY – policy of affordable housing
retention and now growth
• Affordability levels steady
0
2
4
6
8
10
2008 2010 2012 2014
Me
dia
n h
ou
se
pri
ce a
s a
ra
tio
of
me
dia
n
ho
useh
old
in
co
me
Comparative house price affordability – trend over time
Sydney New York London
Source: Demographia
Comparative international home purchase
affordability trends over time
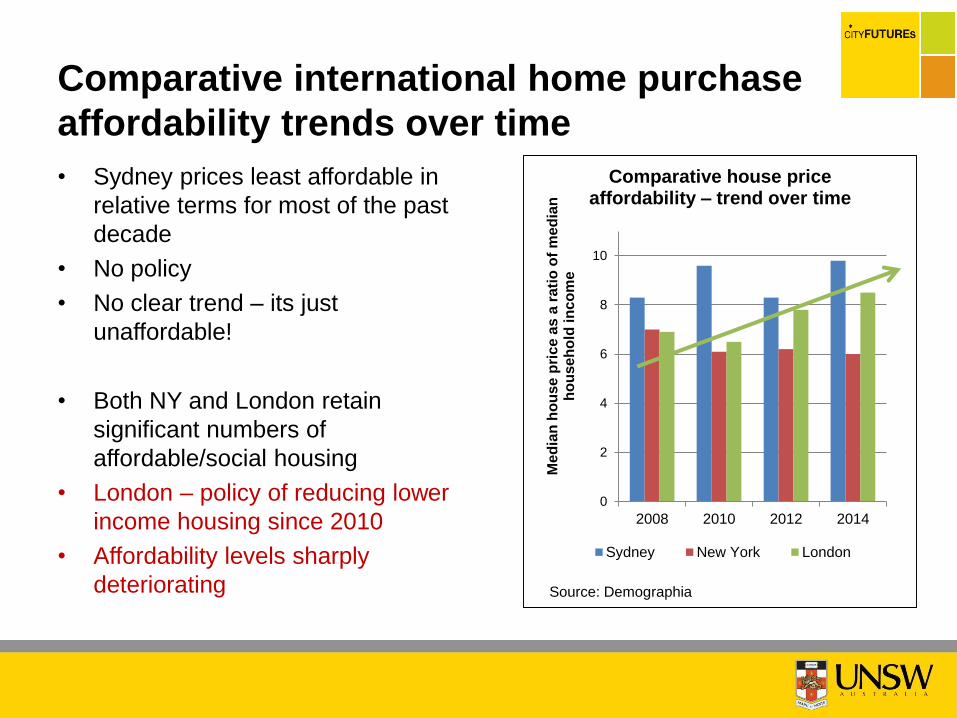
• Sydney prices least affordable in
relative terms for most of the past
decade
• No policy
• No clear trend – its just
unaffordable!
• Both NY and London retain
significant numbers of
affordable/social housing
• London – policy of reducing lower
income housing since 2010
• Affordability levels sharply
deteriorating
0
2
4
6
8
10
2008 2010 2012 2014
Me
dia
n h
ou
se
pri
ce a
s a
ra
tio
of
me
dia
n
ho
useh
old
in
co
me
Comparative house price affordability – trend over time
Sydney New York London
Source: Demographia
Comparative international home purchase
affordability trends over time
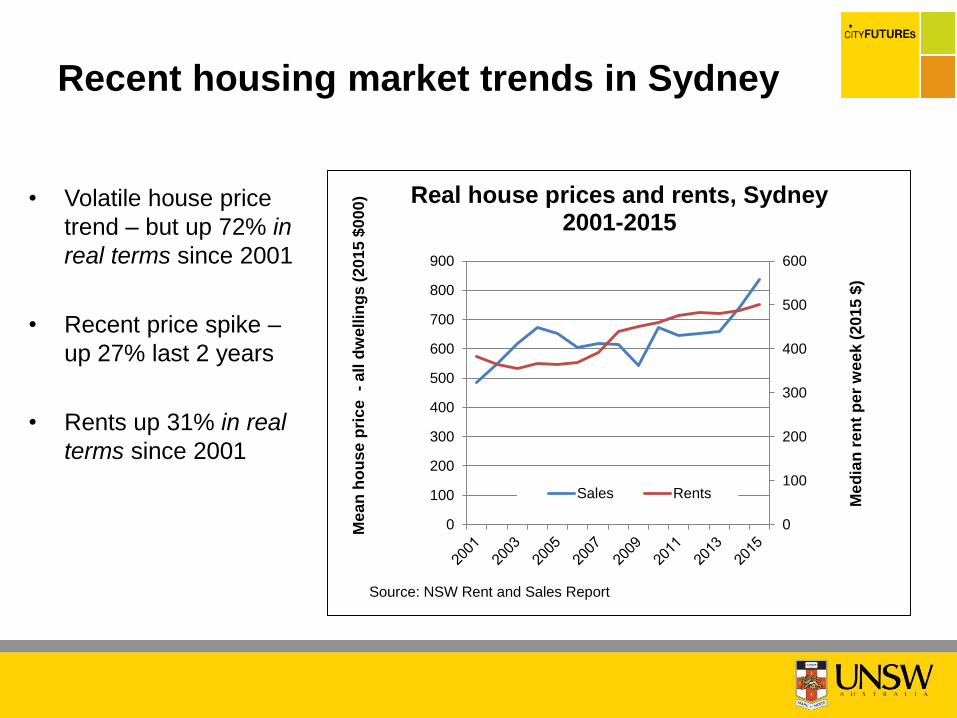
• Volatile house price
trend – but up 72% in
real terms since 2001
• Recent price spike –
up 27% last 2 years
• Rents up 31% in real
terms since 2001
Recent housing market trends in Sydney
0
100
200
300
400
500
600
0
100
200
300
400
500
600
700
800
900
Me
dia
n r
en
t p
er
we
ek
(20
15
$)
Me
an
ho
use
pri
ce
-
all
dw
ell
ing
s (
20
15
$0
00
) Real house prices and rents, Sydney 2001-2015
Sales Rents
Source: NSW Rent and Sales Report
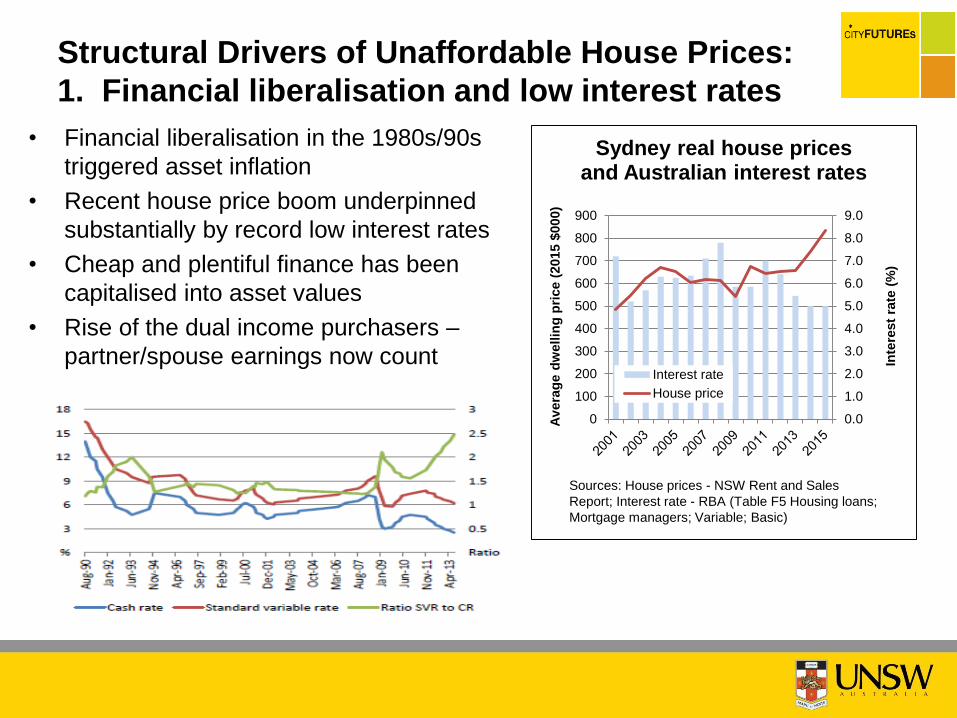
• Financial liberalisation in the 1980s/90s
triggered asset inflation
• Recent house price boom underpinned
substantially by record low interest rates
• Cheap and plentiful finance has been
capitalised into asset values
• Rise of the dual income purchasers –
partner/spouse earnings now count
Structural Drivers of Unaffordable House Prices:
1. Financial liberalisation and low interest rates
0.0
1.0
2.0
3.0
4.0
5.0
6.0
7.0
8.0
9.0
0
100
200
300
400
500
600
700
800
900
Inte
rest
rate
(%
)
Av
era
ge d
wellin
g p
rice (
2015 $
000)
Sydney real house prices and Australian interest rates
Interest rate
House price
Sources: House prices - NSW Rent and Sales
Report; Interest rate - RBA (Table F5 Housing loans;
Mortgage managers; Variable; Basic)
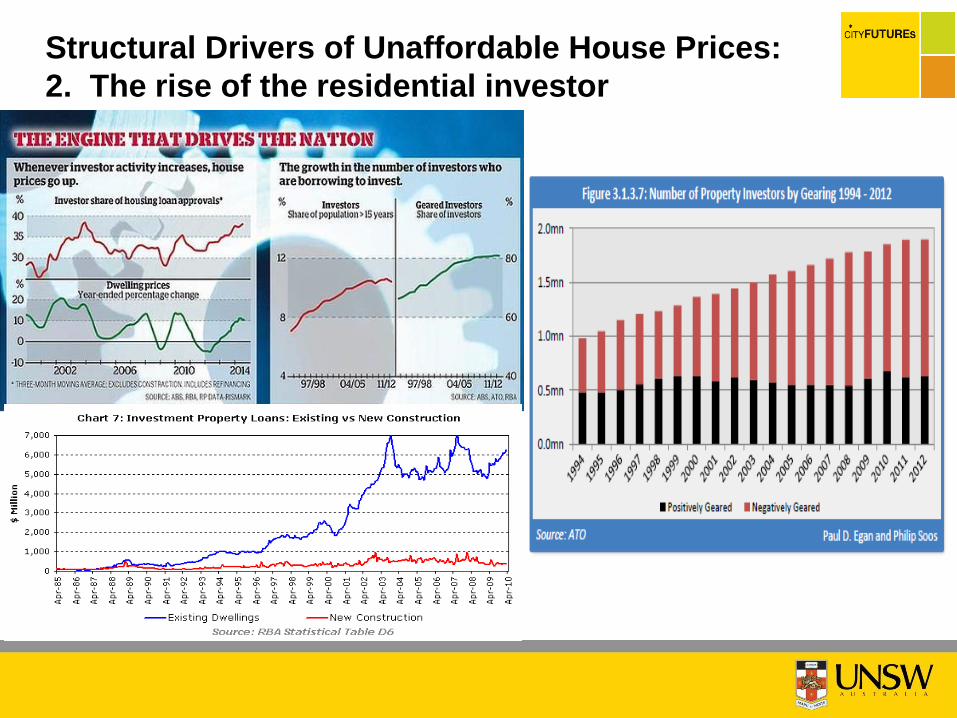
Structural Drivers of Unaffordable House Prices:
2. The rise of the residential investor
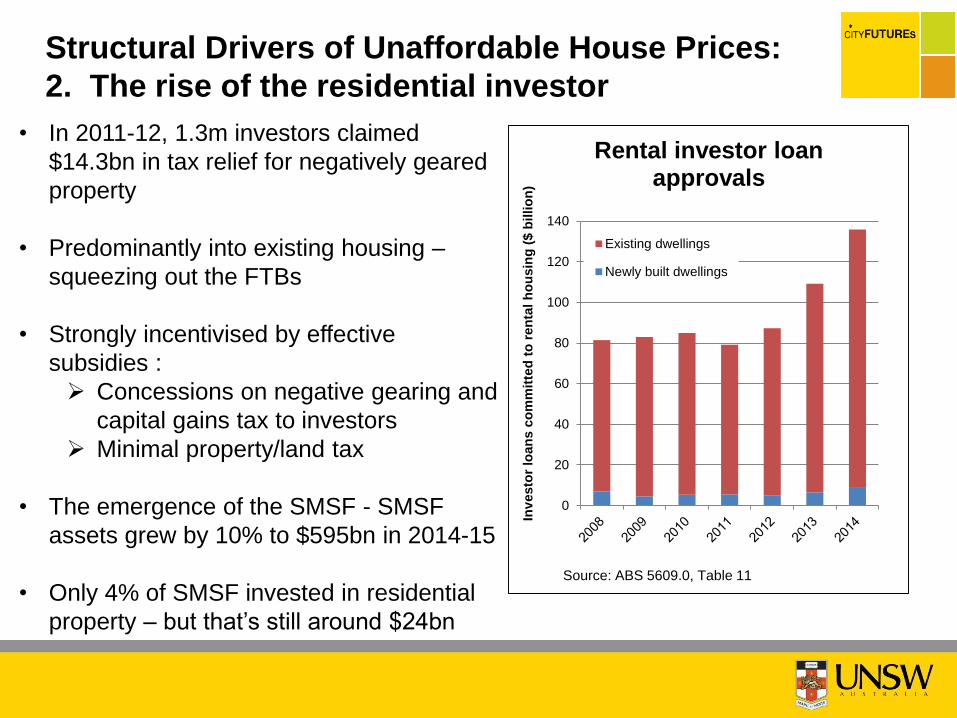
Structural Drivers of Unaffordable House Prices:
2. The rise of the residential investor
• In 2011-12, 1.3m investors claimed
$14.3bn in tax relief for negatively geared
property
• Predominantly into existing housing –
squeezing out the FTBs
• Strongly incentivised by effective
subsidies :
Concessions on negative gearing and
capital gains tax to investors
Minimal property/land tax
• The emergence of the SMSF - SMSF
assets grew by 10% to $595bn in 2014-15
• Only 4% of SMSF invested in residential
property – but that’s still around $24bn
0
20
40
60
80
100
120
140
Inv
esto
r lo
an
s c
om
mit
ted
to
ren
tal
ho
usin
g (
$ b
illio
n)
Rental investor loan approvals
Existing dwellings
Newly built dwellings
Source: ABS 5609.0, Table 11
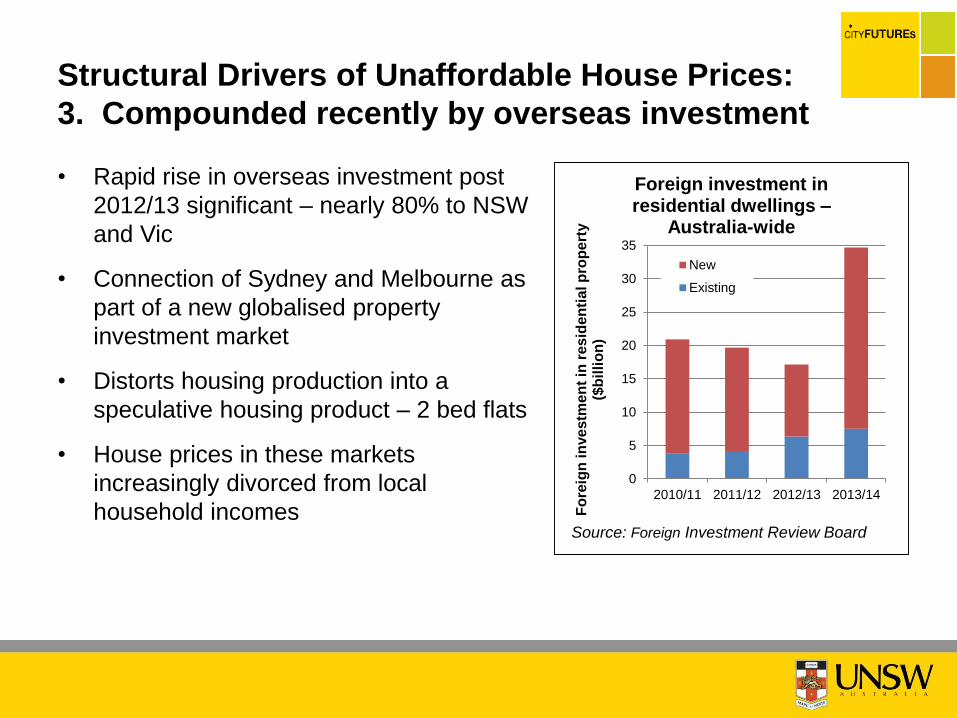
• Rapid rise in overseas investment post
2012/13 significant – nearly 80% to NSW
and Vic
• Connection of Sydney and Melbourne as
part of a new globalised property
investment market
• Distorts housing production into a
speculative housing product – 2 bed flats
• House prices in these markets
increasingly divorced from local
household incomes
Structural Drivers of Unaffordable House Prices:
3. Compounded recently by overseas investment
0
5
10
15
20
25
30
35
2010/11 2011/12 2012/13 2013/14
Fo
reig
n in
ve
stm
en
t in
re
sid
en
tia
l p
rop
ert
y
($b
illi
on
)
Foreign investment in residential dwellings –
Australia-wide
New
Existing
Source: Foreign Investment Review Board
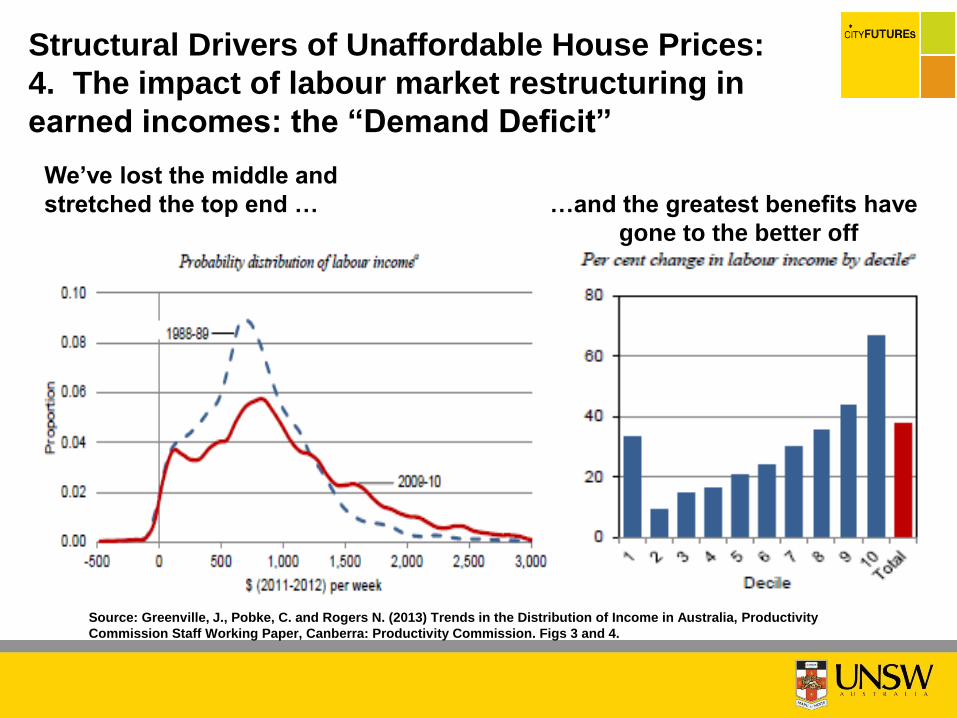
Structural Drivers of Unaffordable House Prices:
4. The impact of labour market restructuring in
earned incomes: the “Demand Deficit”
Source: Greenville, J., Pobke, C. and Rogers N. (2013) Trends in the Distribution of Income in Australia, Productivity
Commission Staff Working Paper, Canberra: Productivity Commission. Figs 3 and 4.
We’ve lost the middle and
stretched the top end … …and the greatest benefits have
gone to the better off

And that’s translated into increased inequality of
household income and wealth…
0
200,000
400,000
600,000
800,000
1,000,000
1,200,000
1,400,000
1,600,000
Highest quintile
Fourth quintile
Third quintile
Second quintile
Lowest quintile
0
1,000
2,000
3,000
4,000
5,000
6,000
Highest quintile
Fourth quintile
Third quintile
Second quintile
Lowest quintile
EQUIVALISED HOUSEHOLD
NET WORTH
Australia, 2003–04 to 2013–14
EQUIVALISED DISPOSABLE HOUSEHOLD
INCOME
Australia, 1994–95 to 2013–14
Source: ABS (2015) 6523.0 Household Income and Wealth 2013-14 (Tables 1.1 and 2.2)
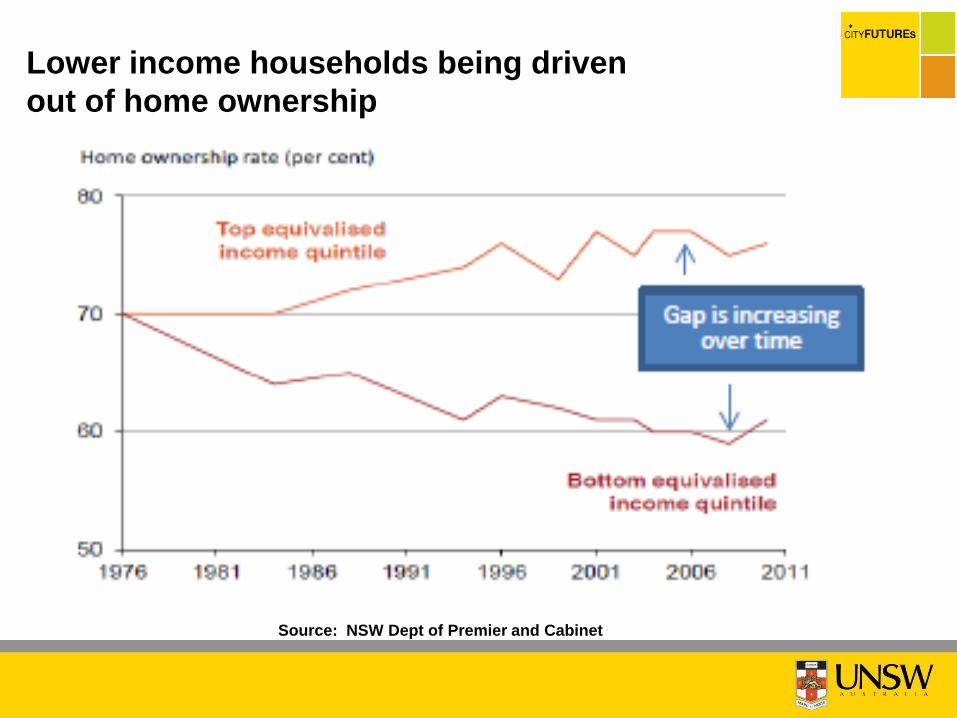
Lower income households being driven
out of home ownership
Source: NSW Dept of Premier and Cabinet
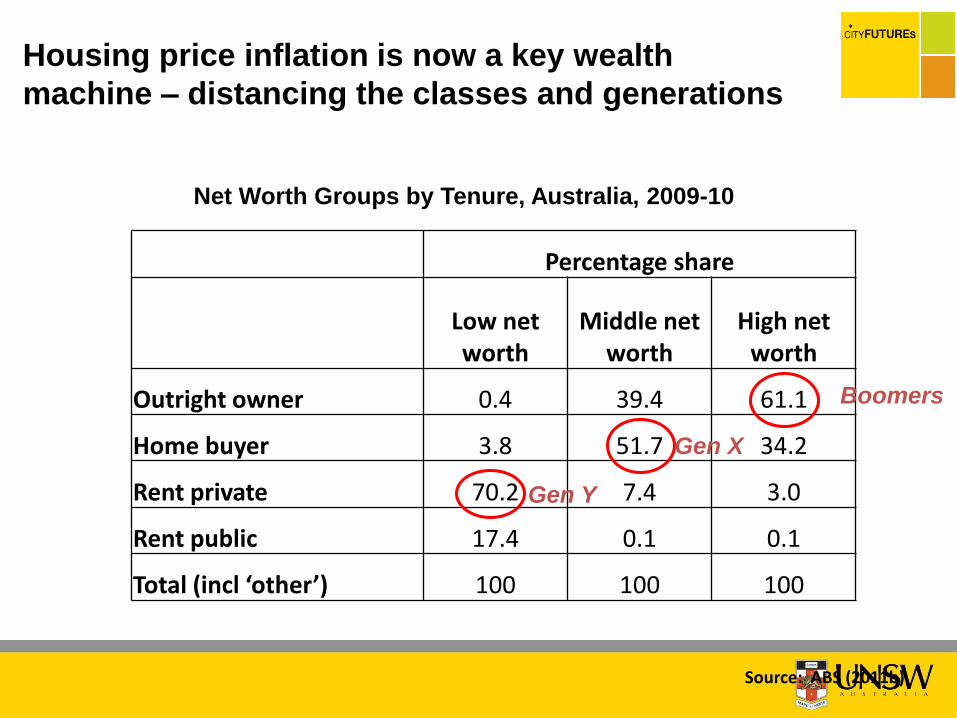
Percentage share
Low net worth
Middle net worth
High net worth
Outright owner 0.4 39.4 61.1
Home buyer 3.8 51.7 34.2
Rent private 70.2 7.4 3.0
Rent public 17.4 0.1 0.1
Total (incl ‘other’) 100 100 100
Net Worth Groups by Tenure, Australia, 2009-10
Source: ABS (2011b)
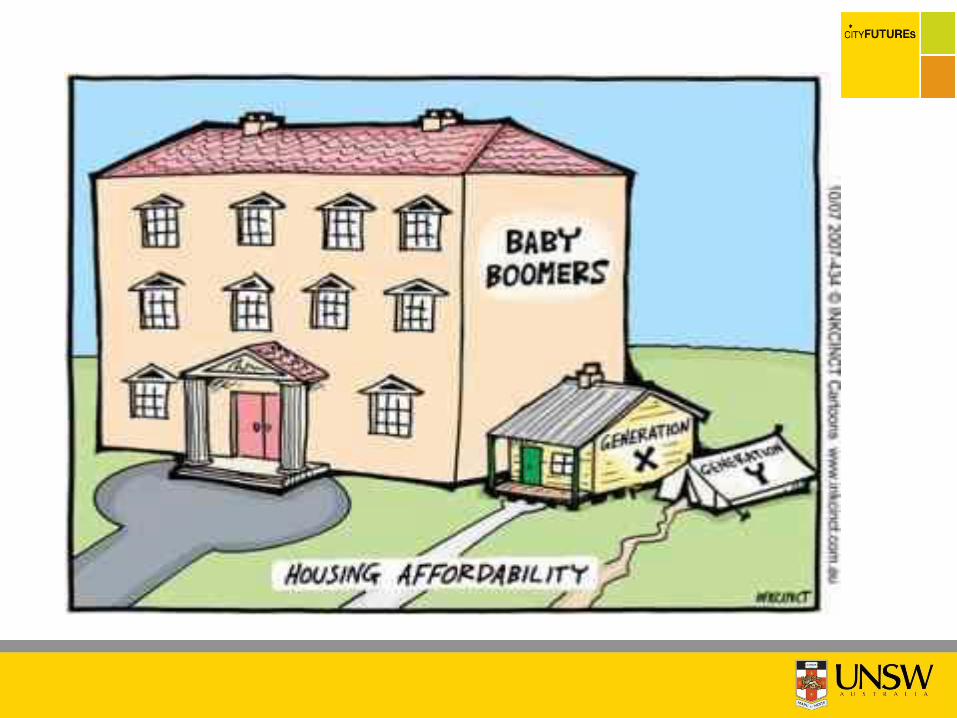
Housing price inflation is now a key wealth
machine – distancing the classes and generations
Boomers
Gen Y
Gen X
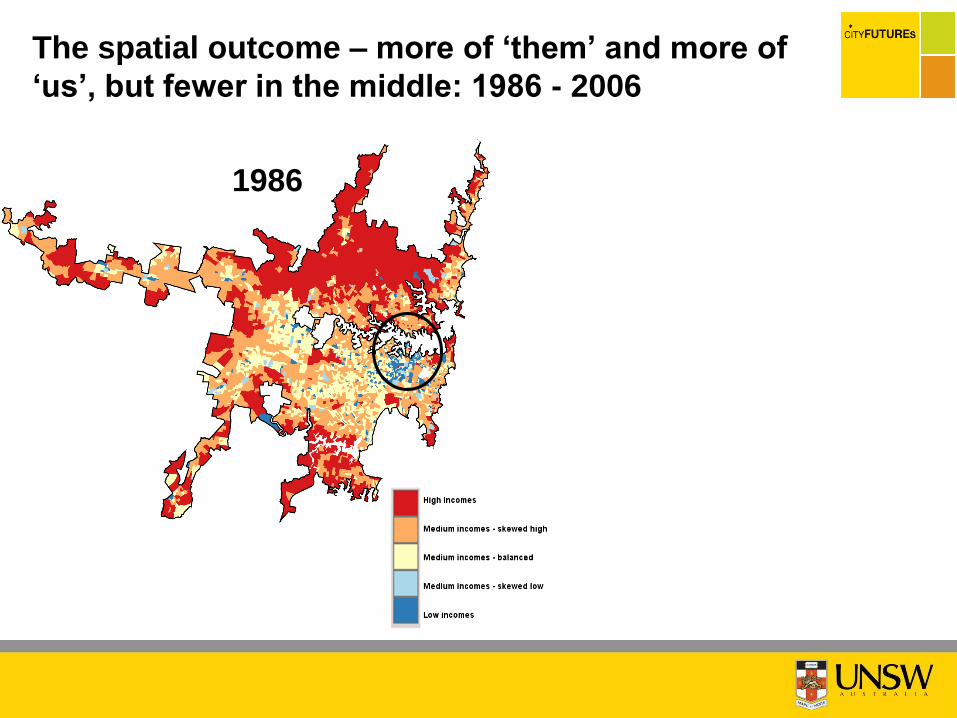
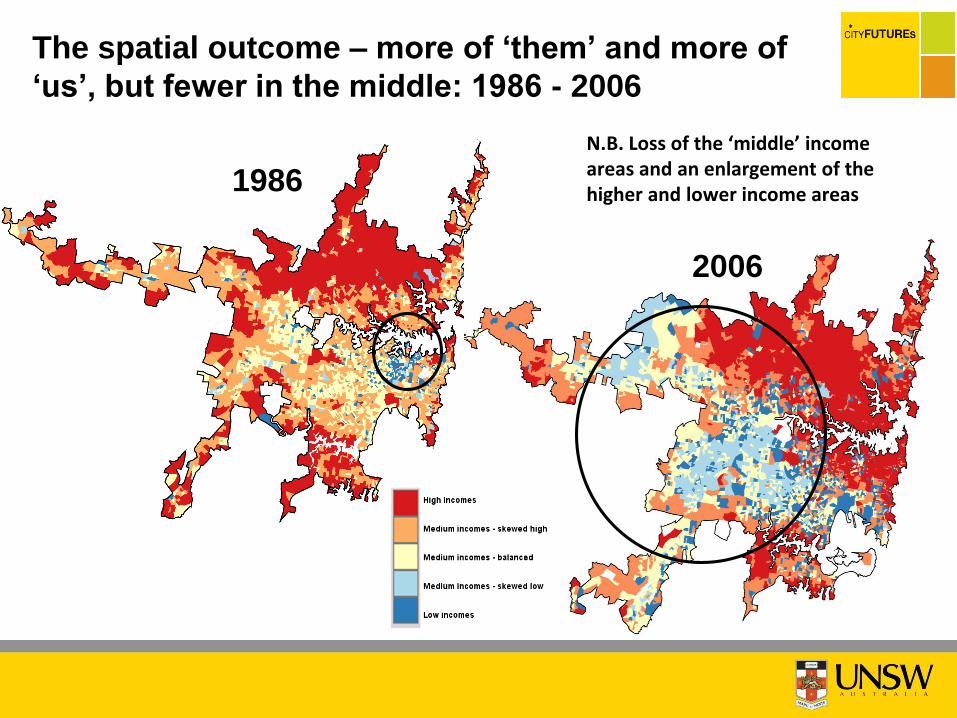
The spatial outcome – more of ‘them’ and more of
‘us’, but fewer in the middle: 1986 - 2006
20011986
2001
2006
1986
N.B. Loss of the ‘middle’ income areas and an enlargement of the higher and lower income areas
The spatial outcome – more of ‘them’ and more of
‘us’, but fewer in the middle: 1986 - 2006
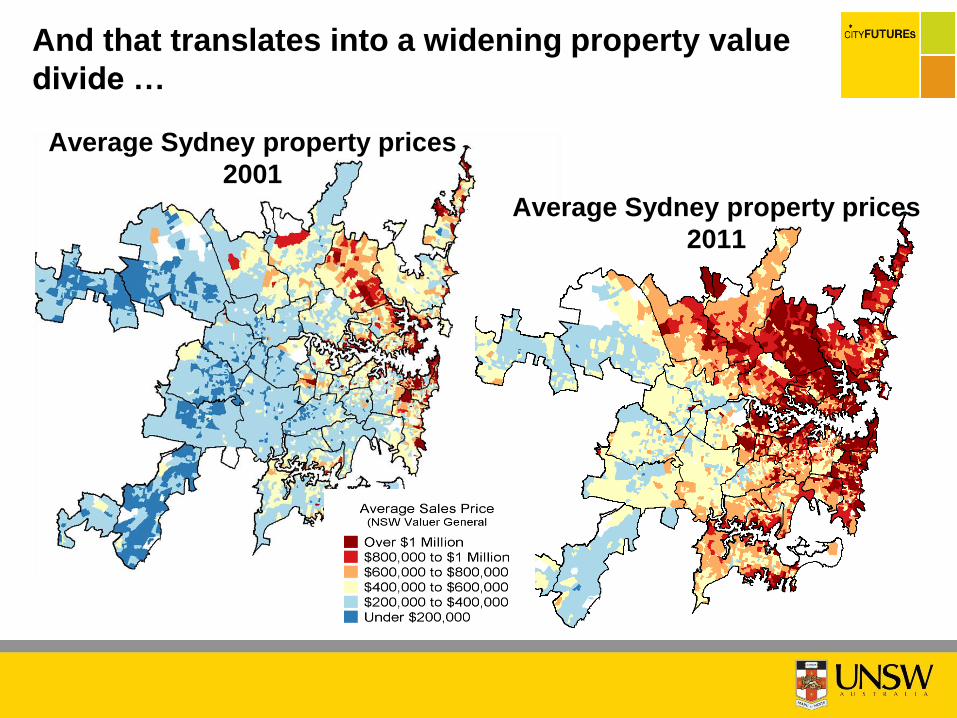
And that translates into a widening property value
divide …
Average Sydney property prices
2011
Average Sydney property prices
2001
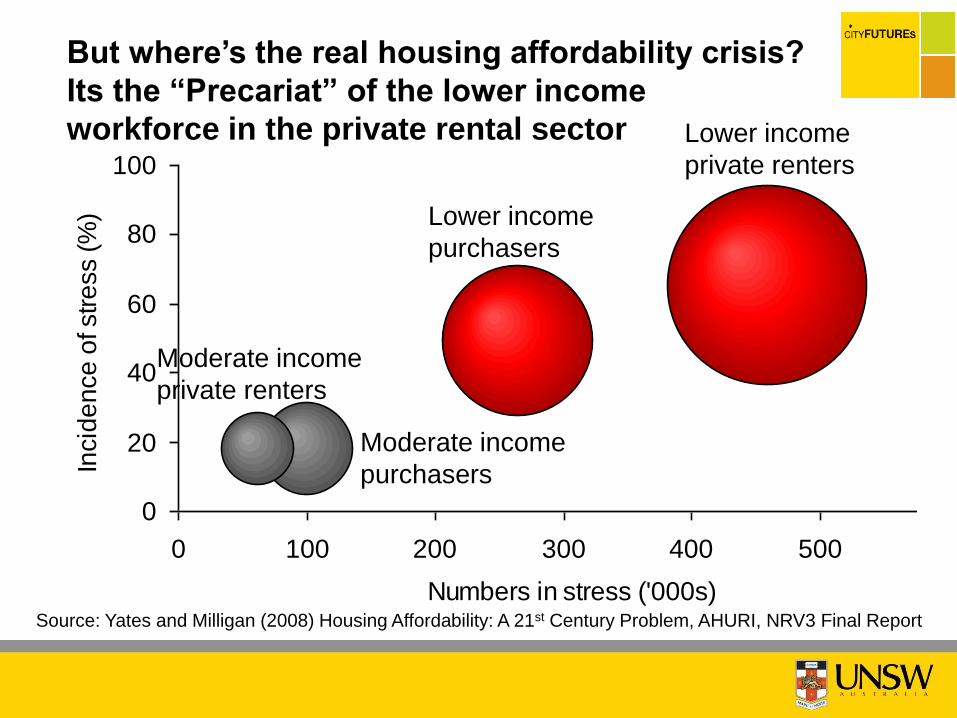
0
20
40
60
80
100
0 100 200 300 400 500 600
Numbers in stress ('000s)
Incid
en
ce
of str
ess (
%)
Lower income
private renters
Lower income
purchasers
Moderate income
purchasers
Moderate income
private renters
Source: Yates and Milligan (2008) Housing Affordability: A 21st Century Problem, AHURI, NRV3 Final Report
But where’s the real housing affordability crisis?
Its the “Precariat” of the lower income
workforce in the private rental sector
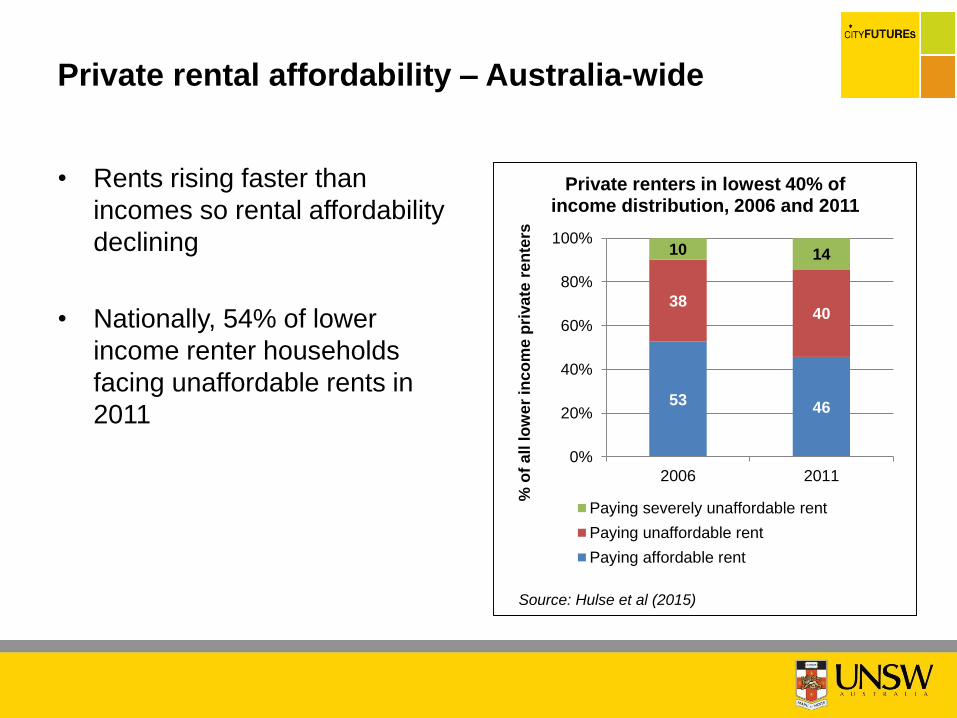
• Rents rising faster than
incomes so rental affordability
declining
• Nationally, 54% of lower
income renter households
facing unaffordable rents in
201153
46
3840
10 14
0%
20%
40%
60%
80%
100%
2006 2011
% o
f a
ll lo
we
r in
co
me
pri
va
te r
en
ters
Private renters in lowest 40% of income distribution, 2006 and 2011
Paying severely unaffordable rent
Paying unaffordable rent
Paying affordable rent
Source: Hulse et al (2015)
Private rental affordability – Australia-wide
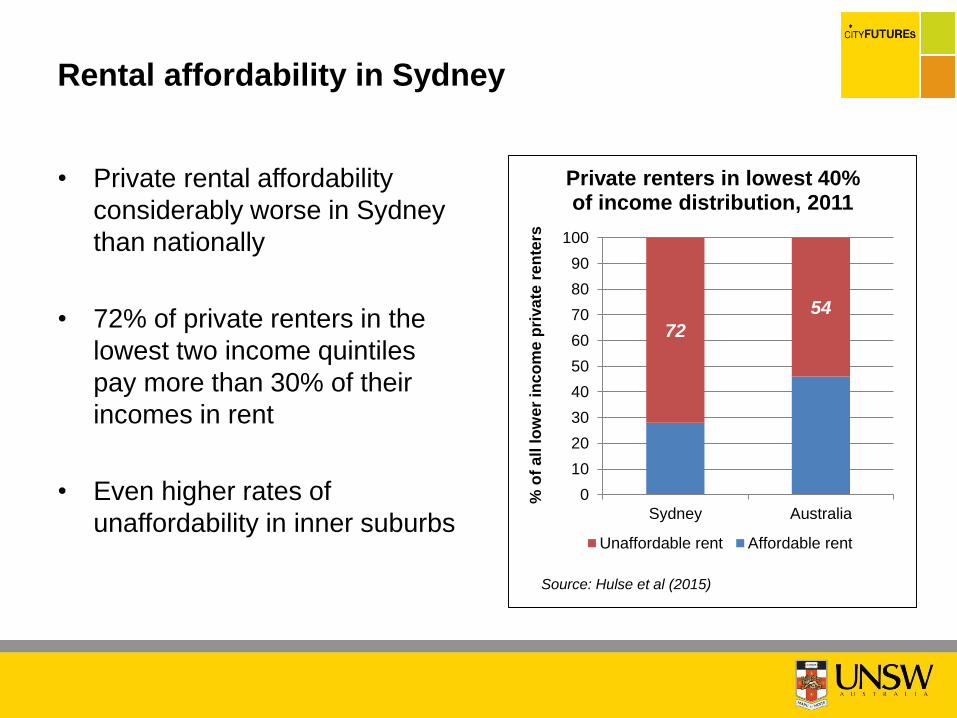
• Private rental affordability
considerably worse in Sydney
than nationally
• 72% of private renters in the
lowest two income quintiles
pay more than 30% of their
incomes in rent
• Even higher rates of
unaffordability in inner suburbs
72
54
0
10
20
30
40
50
60
70
80
90
100
Sydney Australia
% o
f a
ll lo
we
r in
co
me
pri
va
te r
en
ters
Private renters in lowest 40% of income distribution, 2011
Unaffordable rent Affordable rent
Source: Hulse et al (2015)
Rental affordability in Sydney
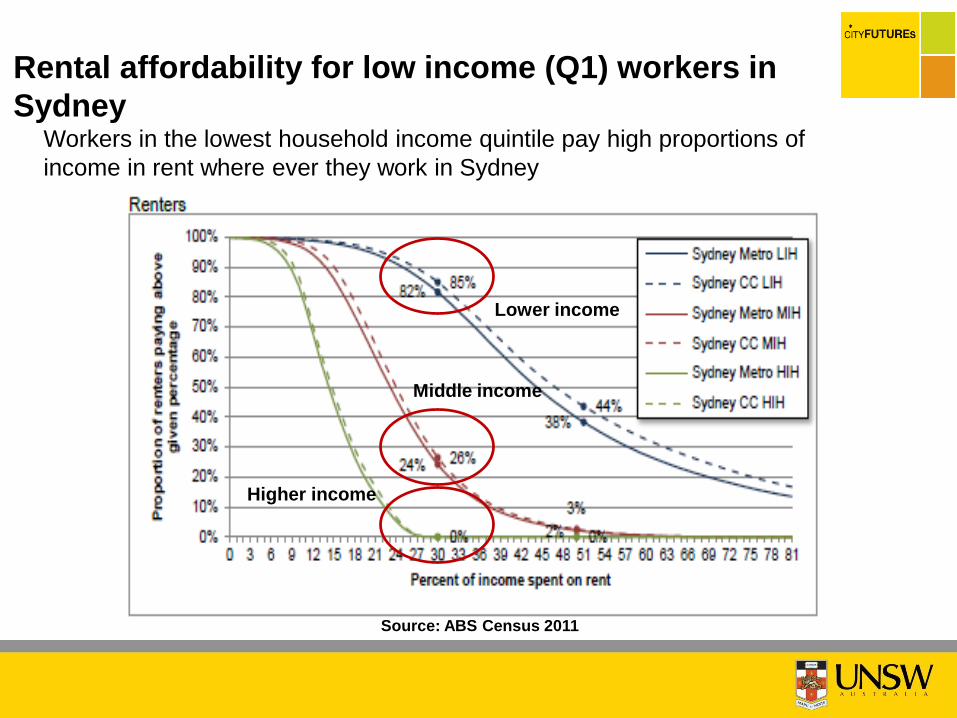
Workers in the lowest household income quintile pay high proportions of
income in rent where ever they work in Sydney
Rental affordability for low income (Q1) workers in
Sydney
Lower income
Middle income
Higher income
Source: ABS Census 2011
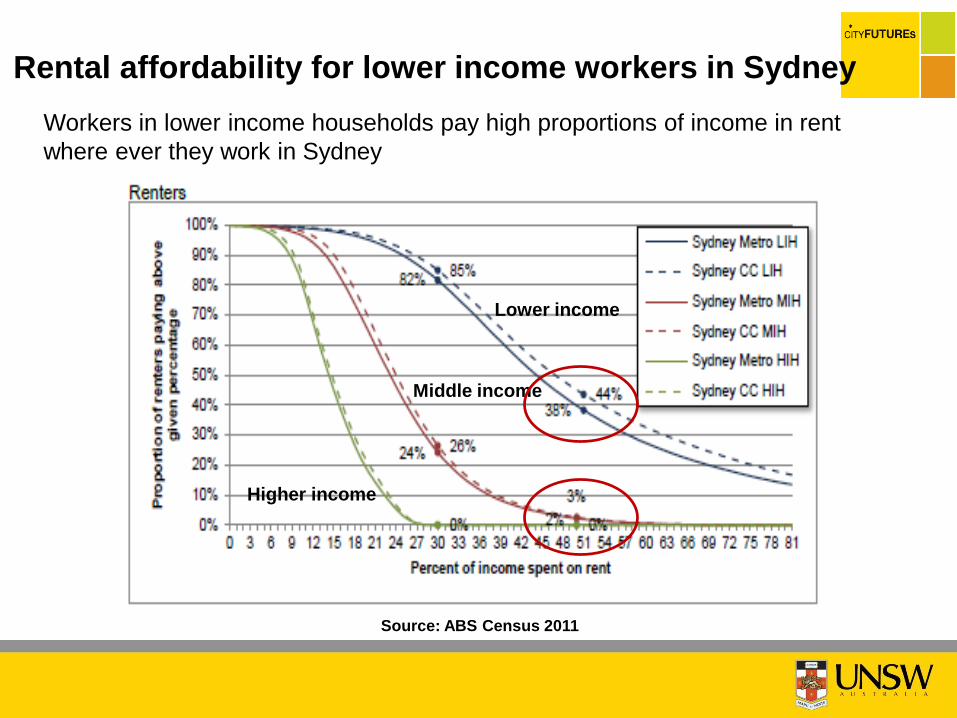
Workers in lower income households pay high proportions of income in rent
where ever they work in Sydney
Lower income
Middle income
Higher income
Source: ABS Census 2011
Rental affordability for lower income workers in Sydney
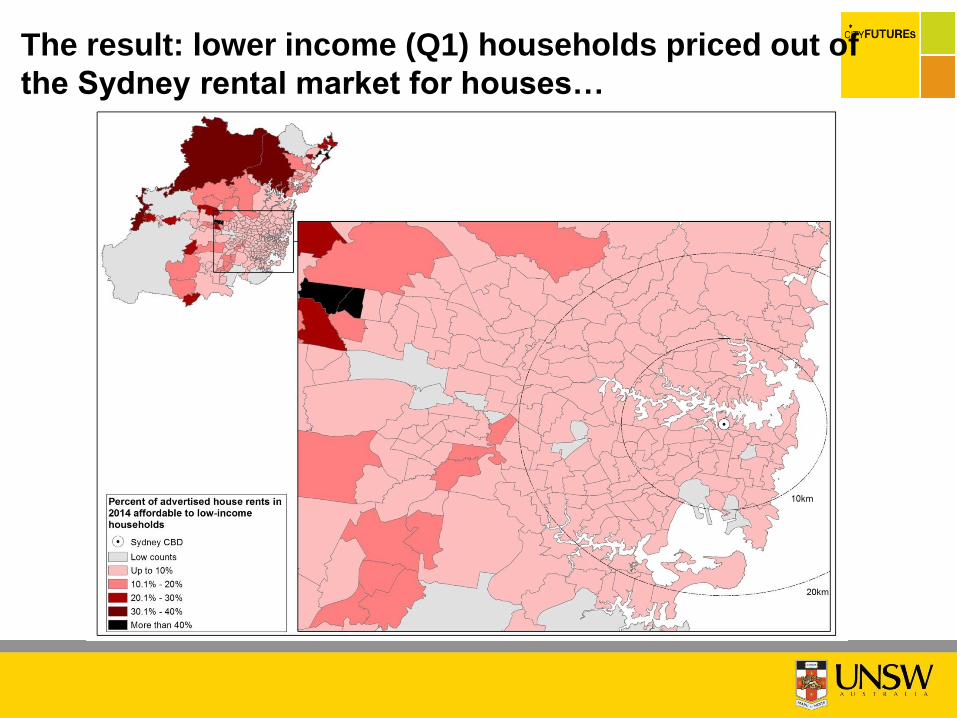
The result: lower income (Q1) households priced out of
the Sydney rental market for houses…
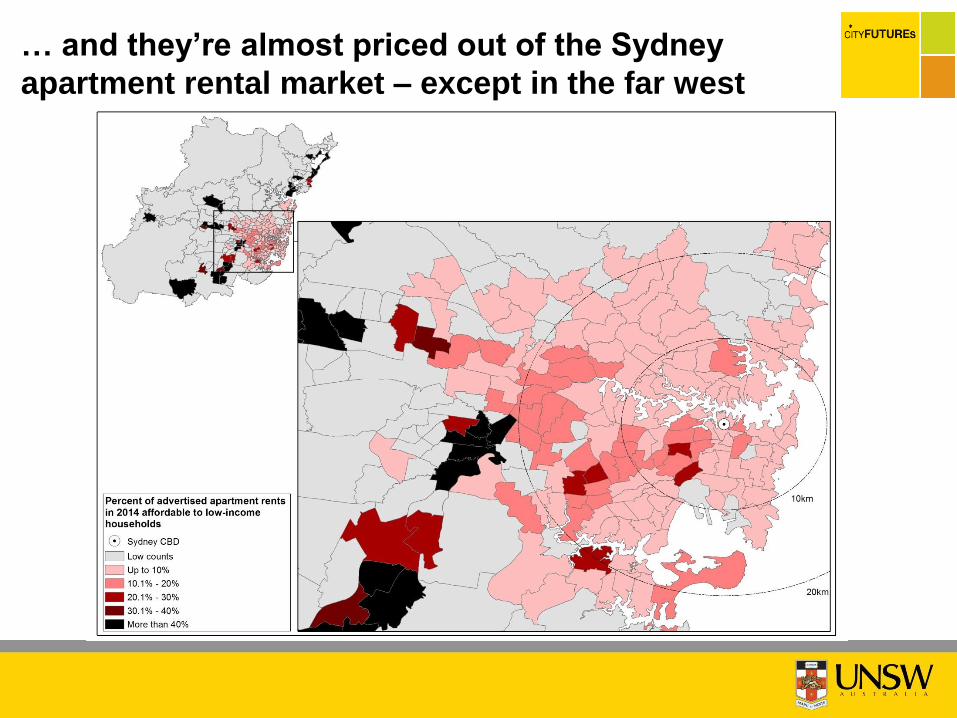
… and they’re almost priced out of the Sydney
apartment rental market – except in the far west
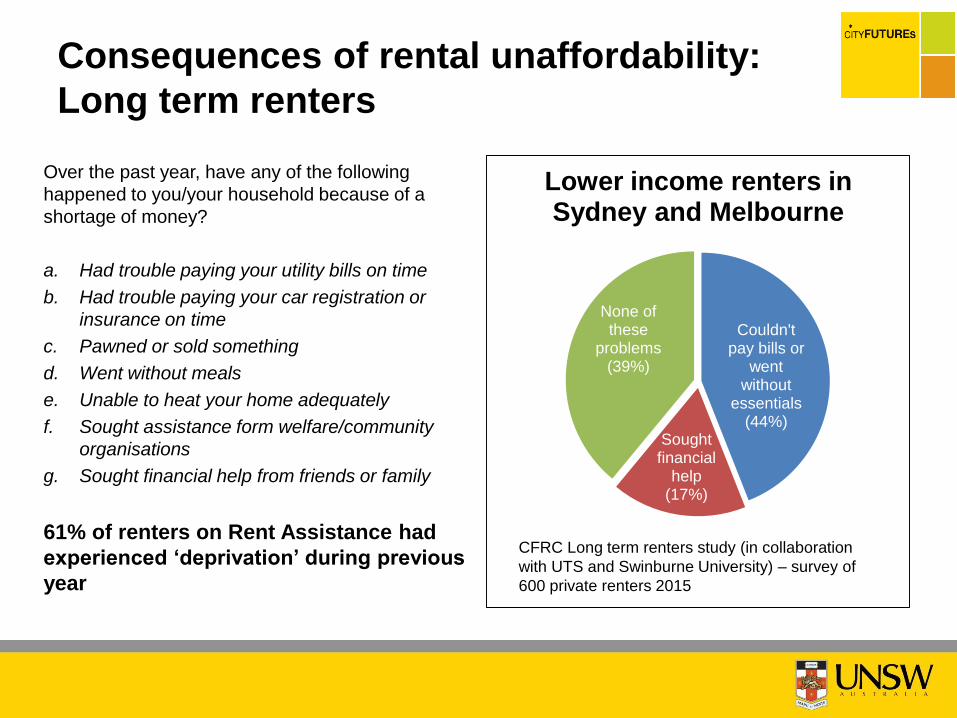
Over the past year, have any of the following
happened to you/your household because of a
shortage of money?
a. Had trouble paying your utility bills on time
b. Had trouble paying your car registration or
insurance on time
c. Pawned or sold something
d. Went without meals
e. Unable to heat your home adequately
f. Sought assistance form welfare/community
organisations
g. Sought financial help from friends or family
61% of renters on Rent Assistance had
experienced ‘deprivation’ during previous
year
Couldn't pay bills or
went without
essentials (44%)
Sought financial
help (17%)
None of these
problems (39%)
Lower income renters in Sydney and Melbourne
CFRC Long term renters study (in collaboration
with UTS and Swinburne University) – survey of
600 private renters 2015
Consequences of rental unaffordability:
Long term renters
• 10-point plan highlights need for actions to:– Cool overpriced market by correcting tax system distortions to
moderate price rises over the longer term
– Redirect effective rental housing subsidies to new affordable
rental through institutional investment
– Direct intervention to expand affordable housing in high demand
locations – inclusionary zoning backed by targeted support for
affordable housing ($1bn NSW Poles and Wires?)
• For State Govts, more scope for actions of third type
– esp. through planning powers
• Compared with NY and London, little Sydney action
to preserve and expand AH since 1990s
• One result: decisive & damaging outward shift in low
income population – remote from job growth zones
• Current NSW Govt may be facing up to problem
• Chance to embed affordable housing in new wave of
major Urban Renewal projects must not be missed
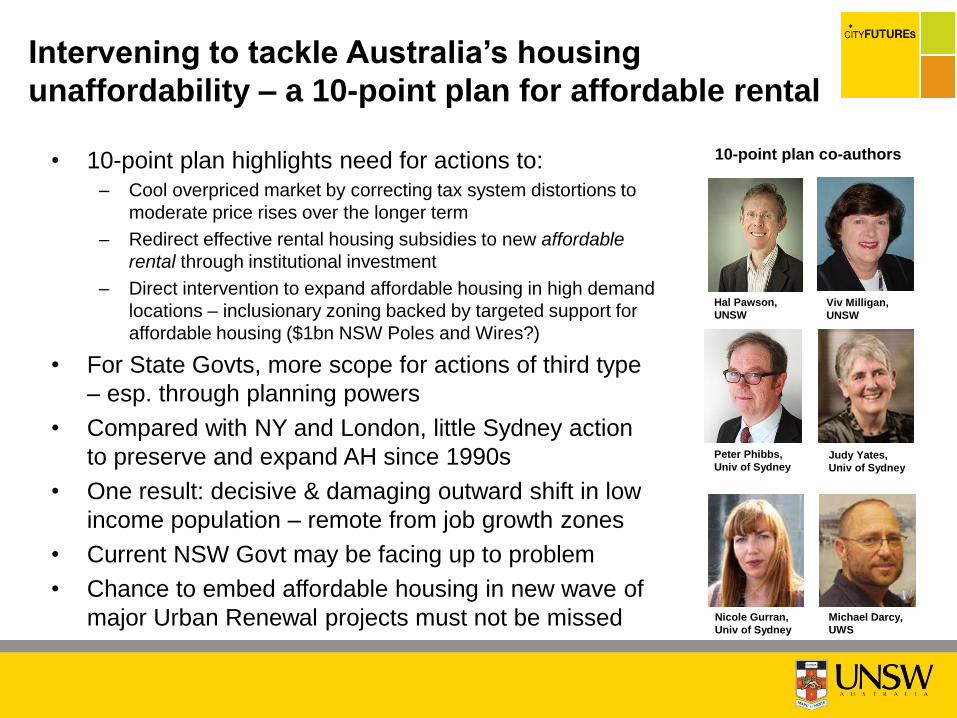
Intervening to tackle Australia’s housing
unaffordability – a 10-point plan for affordable rental
Hal Pawson,
UNSW
Viv Milligan,
UNSW
Peter Phibbs,
Univ of SydneyJudy Yates,
Univ of Sydney
Nicole Gurran,
Univ of Sydney
Michael Darcy,
UWS
10-point plan co-authors
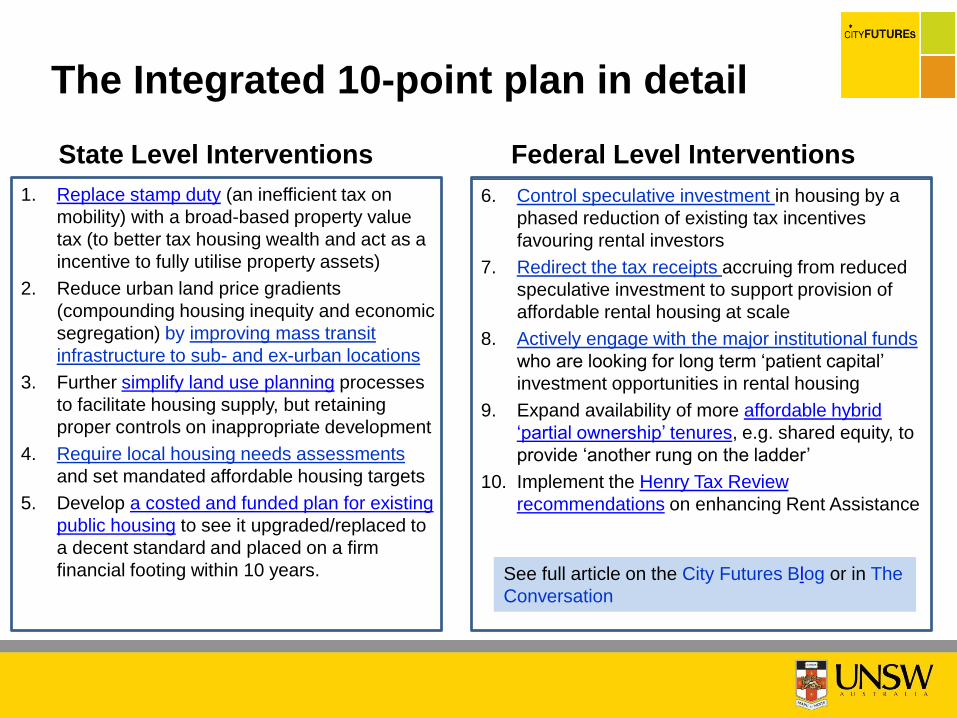
The Integrated 10-point plan in detail
6. Control speculative investment in housing by a
phased reduction of existing tax incentives
favouring rental investors
7. Redirect the tax receipts accruing from reduced
speculative investment to support provision of
affordable rental housing at scale
8. Actively engage with the major institutional funds
who are looking for long term ‘patient capital’
investment opportunities in rental housing
9. Expand availability of more affordable hybrid
‘partial ownership’ tenures, e.g. shared equity, to
provide ‘another rung on the ladder’
10. Implement the Henry Tax Review
recommendations on enhancing Rent Assistance
1. Replace stamp duty (an inefficient tax on
mobility) with a broad-based property value
tax (to better tax housing wealth and act as a
incentive to fully utilise property assets)
2. Reduce urban land price gradients
(compounding housing inequity and economic
segregation) by improving mass transit
infrastructure to sub- and ex-urban locations
3. Further simplify land use planning processes
to facilitate housing supply, but retaining
proper controls on inappropriate development
4. Require local housing needs assessments
and set mandated affordable housing targets
5. Develop a costed and funded plan for existing
public housing to see it upgraded/replaced to
a decent standard and placed on a firm
financial footing within 10 years. See full article on the City Futures Blog or in The
Conversation
State Level Interventions Federal Level Interventions
Resetting the rules: A New Framework for Affordable Housing?
www.cityfutures.net.au
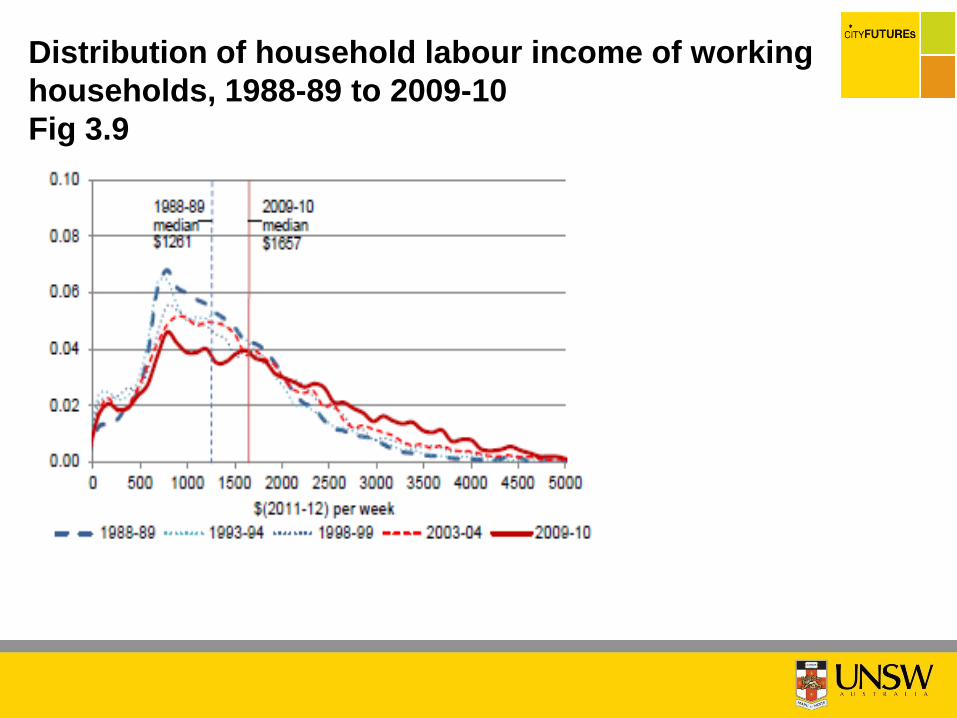
Distribution of household labour income of working
households, 1988-89 to 2009-10
Fig 3.9

Like what you see?Be part of our conversation.
informa.com.au
Join our e-newsletter