Embed Size (px)
Citation preview

xDirect Global Solutions (Pvt) ltd
xDirect is regulated by the Financial Services Commission (FSC) of the Republic of Mauritius.Investment Dealer License (code SEC-2.3) No. C110008226 | Company Reg. No. C094334/GBL

xDirect Global Solutions (Pvt) ltd
XTB established in 2002 Core Business is to provide wide range of investment products and
brokerage services on the both OTC and regulated markets Company’s head office is in Warsaw, Poland XTB has its branch offices in Poland, Czech Republic, Slovakia,
Spain, Germany, France, Hungary, Romania, Russia, Ukraine, China and India
XTB offer through cross-border licenses & branches: UK, Holland, Austria, Sweden, Belgium, Greece, Bulgaria
About XTB Global
xDirect Global Solutions (Pvt) ltd
About XTB Global
XTB Online Trading is the biggest independent forex and CFD broker in Europe specialized in providing to its costumers access to derivative instruments like futures, CFDs, DMA CFDs and more.
XTB is also a member of Warsaw Stock Exchange and Polish National Clearing House.
XTB employs around 500 people
Serves clients from more than 40 different countries

xDirect Global Solutions (Pvt) ltd
Product Allocation

xDirect Global Solutions (Pvt) ltd
About xDirect India
xDirect is located in Mumbai and aims to service clients nationwide and its neighboring countries.
Established in January 2010 Our team of specialist can help clients start, learn and continue trading Customer support is offered not only in English but also in many local languages like:
Hindi, Bengali, Gujarati, Marathi, Tamil, and Nepali The office address is: www.xdirect.in
xDirect Global Solutions (Pvt) LtdA-507 | Xpress Zone | W.E HighwayGoregaon -East | Mumbai 400097

xDirect Global Solutions (Pvt) ltd
Japanese Candlestick
xDirect Global Solutions (Pvt) ltd
Japanese Candlestick
Candlesticks are formed using the open, high, low, and close of the chosen time period.
If the close is above the open, then a hollow candlestick (usually displayed as white) is drawn.
If the close is below the open, then a filled candlestick (usually displayed as black) is drawn.
The hollow or filled section of the candlestick is called the "real body" or body.
The thin lines poking above and below the body display the high/low range and are called shadows.
The top of the upper shadow is the "high".
The bottom of the lower shadow is the "low".

xDirect Global Solutions (Pvt) ltd
Single candlestick pattern
The hammer and hanging man look exactly alike but have totally different meanings depending on past price action. Both have cute little bodies
(black or white), long lower shadows, and short or absent upper shadows.

xDirect Global Solutions (Pvt) ltd
Single candlestick pattern
The hammer is a bullish reversal pattern that forms during a downtrend. It is named because the market is hammering out a
bottom. The hanging man is a bearish reversal pattern that can also mark a top or strong resistance level. When price is rising, the formation of a hanging man
indicates that sellers are beginning to outnumber buyers.

xDirect Global Solutions (Pvt) ltd
Single candlestick pattern
The inverted hammer and shooting star also look identical. The only difference between them is whether you're in a downtrend or
uptrend. Both candlesticks have petite little bodies (filled or hollow), long upper shadows, and small or absent lower shadows.
xDirect Global Solutions (Pvt) ltd
Dual candlestick pattern
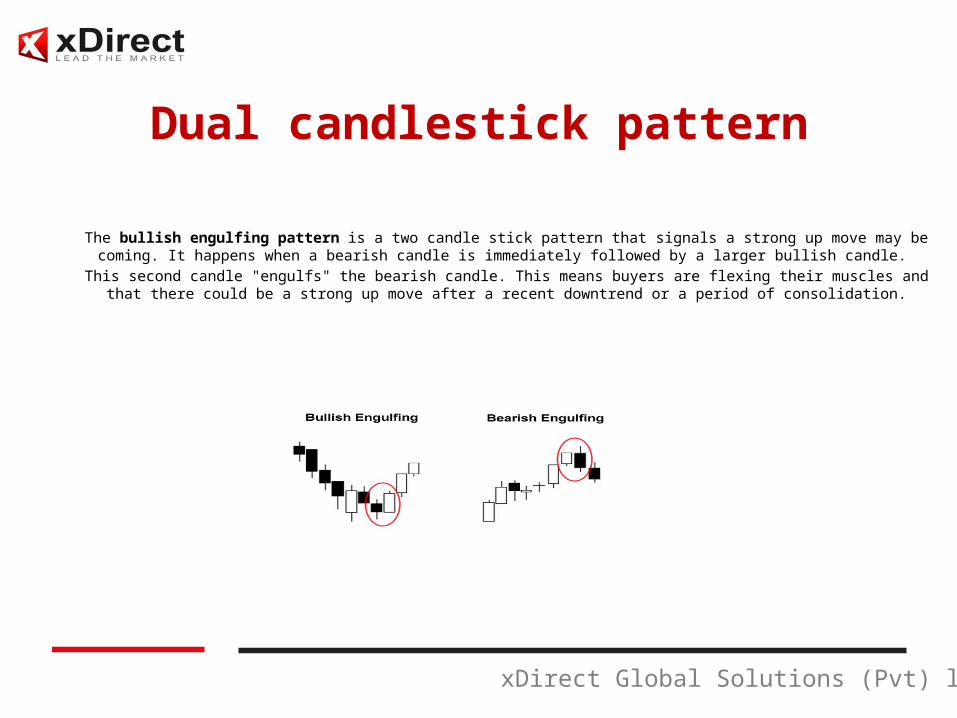
The bullish engulfing pattern is a two candle stick pattern that signals a strong up move may be coming. It happens when a bearish candle is immediately followed by a larger bullish candle.
This second candle "engulfs" the bearish candle. This means buyers are flexing their muscles and that there could be a strong up move after a recent downtrend or a period of consolidation.
xDirect Global Solutions (Pvt) ltd
Dual candlestick pattern
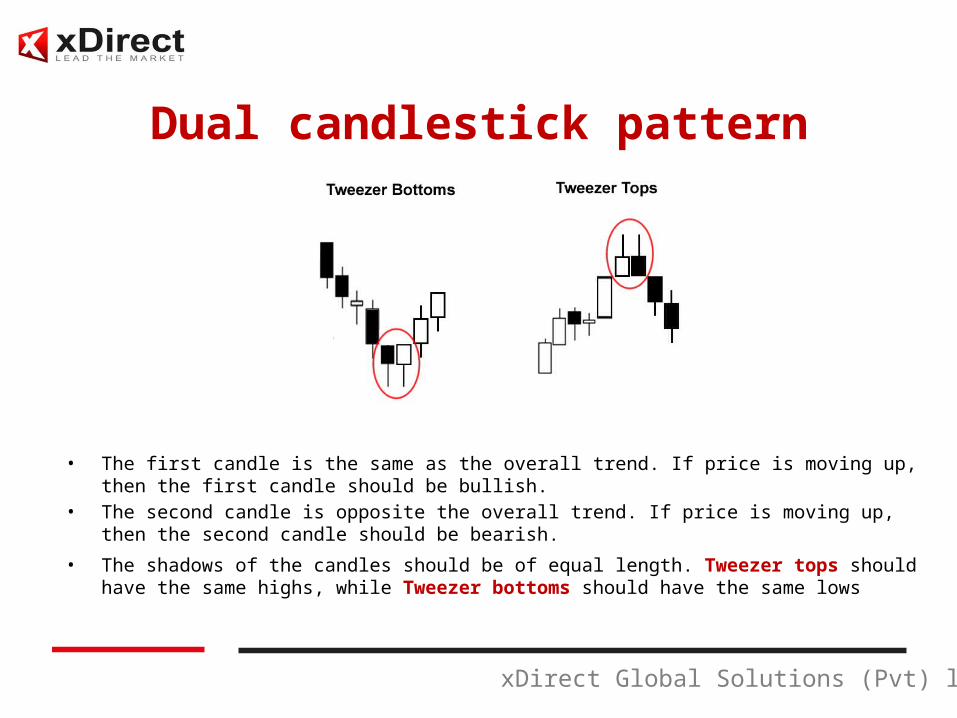
• The first candle is the same as the overall trend. If price is moving up, then the first candle should be bullish.
• The second candle is opposite the overall trend. If price is moving up, then the second candle should be bearish.
• The shadows of the candles should be of equal length. Tweezer tops should have the same highs, while Tweezer bottoms should have the same lows
xDirect Global Solutions (Pvt) ltd
Triple candlestick pattern
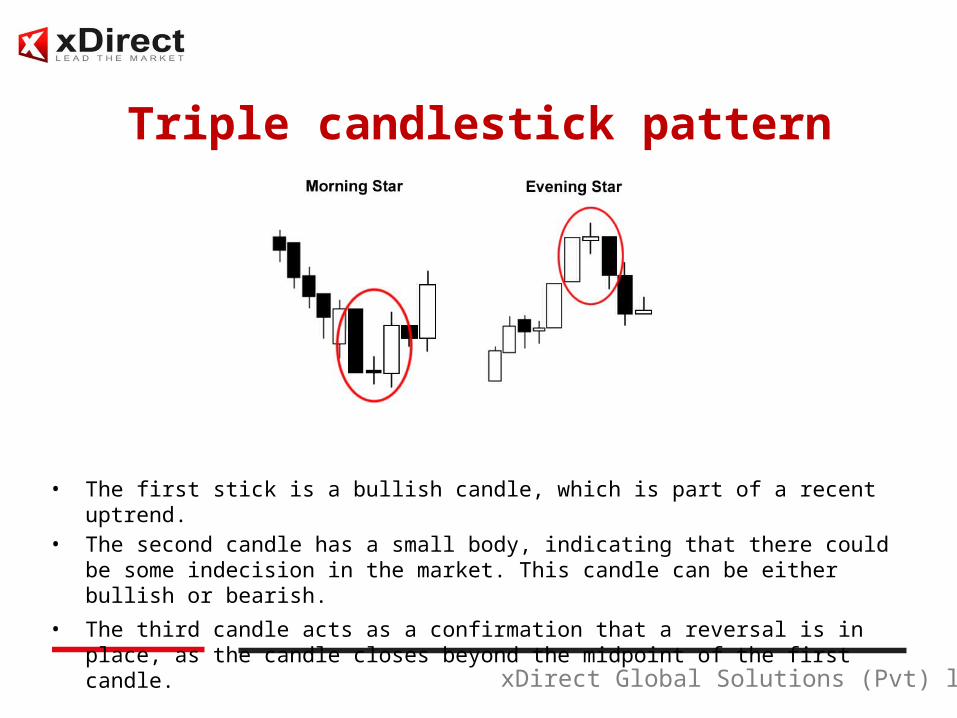
• The first stick is a bullish candle, which is part of a recent uptrend. • The second candle has a small body, indicating that there could be some
indecision in the market. This candle can be either bullish or bearish.
• The third candle acts as a confirmation that a reversal is in place, as the candle closes beyond the midpoint of the first candle.

xDirect Global Solutions (Pvt) ltd
Triple candlestick pattern
• The three white soldiers pattern is formed when three long bullish candles follow a downtrend, signalling a reversal has occurred.
• The three black crows candlestick pattern is just the opposite of the three white soldiers. It is formed when three bearish candles follow a strong uptrend, indicating that a reversal is in the works.

xDirect Global Solutions (Pvt) ltd
Thanks for your attention
xDirect Global Solutions (Pvt) Ltd
Contact: + 91 9664785872 [email protected]