Embed Size (px)
Citation preview

Alex Wynaendts Darryl Button
CEO CFO
The Hague – May 15, 2014
Q1 2014 Results Strong earnings and sales growth

2
Underlying earnings up on higher account balances and lower financing costs at the
holding
► Continuing strong deposit growth results in higher fee-based earnings
Higher sales driven by strong deposit growth and accident & health sales in the US
► MCVNB strong; increased profitability in the US and New markets offset by declines in NL and UK
Active capital management further drives down cost of leverage, supports improving RoE
Operational free cash flows contributing to solid capital position
Positive momentum continues
* Earnings = underlying earnings before tax; Fee = fee-based earnings as a percentage of underlying earnings;
Cash flow = operational free cash flow excluding market impact and one-time items
+7% vs Q1 13
Earnings*
€ 498m 8.4%
9.1% excluding
run-off business
RoE
€ 2.1bn
+20% vs Q1 13
Sales
€ 305m
-7% vs Q1 13
Cash flow*
€ 223m
-4% vs Q1 13
MCVNB
37%
+4pp vs Q1 13
Fee*

3
Gross deposits higher in all units
► Pension deposits in the Americas 43% higher on plan take-overs and continued focus on retirement readiness by growing employee participation and contributions
► US variable annuity deposits up 26% as a result of focus on key distribution partners and expanding alternative distribution channels
► Deposits in AAM increase 82% driven by strong retail sales in the UK and China
Strong net deposits in the Americas of EUR 2 billion more than offset by transfer of pension fund assets to the Polish government (EUR 1.5 billion) and replacement of large asset management mandate (EUR 3 billion)
US pensions, VA and asset management drive 35% deposit growth
Aegon Asset Management (EUR billion)
5.8 5.4
8.3
Q1 13 Q4 13 Q1 14
1.6
2.3
2.0
Q1 13 Q4 13 Q1 14
2.3
2.9
4.1
Q1 13 Q4 13 Q1 14
1.7 2.0 (0.9)
10.0 10.6 13.5
Q1 13 Q4 13 Q1 14
Gross deposits (EUR billion)
Net deposits excluding run-off
US Pensions (USD billion)
US variable annuities (USD billion)
4
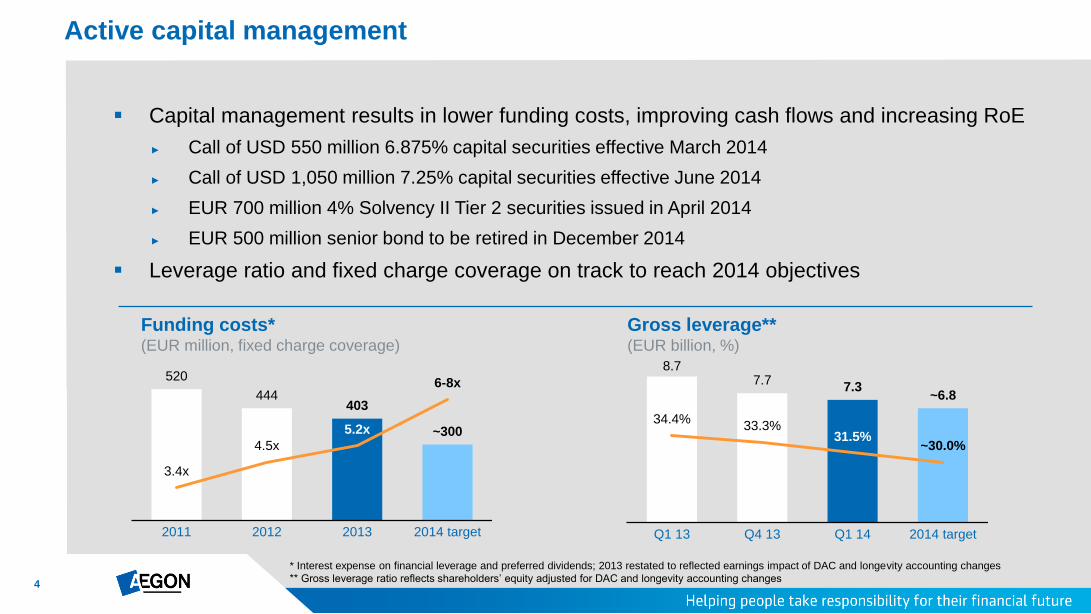
Capital management results in lower funding costs, improving cash flows and increasing RoE
► Call of USD 550 million 6.875% capital securities effective March 2014
► Call of USD 1,050 million 7.25% capital securities effective June 2014
► EUR 700 million 4% Solvency II Tier 2 securities issued in April 2014
► EUR 500 million senior bond to be retired in December 2014
Leverage ratio and fixed charge coverage on track to reach 2014 objectives
Active capital management
Gross leverage** (EUR billion, %)
8.7 7.7
7.3 ~6.8
34.4% 33.3%
31.5% ~30.0%
Q1 13 Q4 13 Q1 14 2014 target
* Interest expense on financial leverage and preferred dividends; 2013 restated to reflected earnings impact of DAC and longevity accounting changes
** Gross leverage ratio reflects shareholders’ equity adjusted for DAC and longevity accounting changes
Funding costs* (EUR million, fixed charge coverage)
520
444 403
~300
3.4x
4.5x
5.2x
6-8x
2011 2012 2013 2014 target

5
Sale of 50% stake in joint venture with Caja de Badajoz in Spain
Launch of Retiready in UK to address retirement needs of growing non-advised market
► Regulatory changes support strategic focus on At Retirement and Workplace savings through platform
► Successful Dutch mortgage fund with inflows of over EUR 1 billion since launch in Q4 2013
Launch of “Mijn Aegon” in NL, giving customers access to their Aegon products on one online portal
► Over 350,000 customers registered already to use “Mijn Aegon”
“Your Financial Life” added to Transamerica.com, a one-stop retirement resource
Enhancing
customer
loyalty
Issuance of EUR 1.4bn Dutch RMBS at best pricing since financial crisis, funding for ~8,000 mortgages
Aegon UK S&P rating affirmed, outlook to Stable; AA- rating assigned by Fitch
Achieving
operational
excellence
Tracking above financial sector for engagement and at high performance norm for enablement
► 88% of employees participated in global survey
Optimizing
our portfolio
Execution of our strategy
Empowering
our employees

6
Upcoming events
May Annual General Meeting
of Shareholders
The Hague
May 21, 2014
Retirement Readiness
Report 2014
May 28, 2014
June Analyst & Investor
Conference
New York
June 25, 2014
August Q2 2014 Results
August 14, 2014
Register now for our
annual Analyst & Investor
Conference
Scan the QR code for
more detailed information
or contact investor relations

Appendix
Appendix
For questions please contact Investor Relations
+31 70 344 8305
P.O. Box 85
2501 CB The Hague
The Netherlands
Download
IR & Media App
in the appstore

8
Progress towards 2015 targets
See slide 30 for main economic assumptions
* Excluding market impact and one-time items
€ 498m
Underlying earnings
+7% vs Q1 13
€ 498m
Underlying earnings
+7% vs Q1 13
€ 498m
Underlying earnings
+7% vs Q1 13
€ 498m
Underlying earnings
+7% vs Q1 13
30-35%
Fee-based earnings as % of
underlying earnings by 2015
€ 1.3-1.6 billion
Annual operational free cash
flow* by 2015
7-10%
Grow underlying earnings
before tax on average per
annum between 2012 and 2015
10-12%
Return on equity by 2015
37%
Q1 2014
€ 305 million
Q1 2014
7%
Q1 2014 vs. Q1 2013
8.4%
Q1 2014 (9.1% excluding run-
off capital)

9
Continued delivery of strong results
* See slide 31 for MCVNB methodology changes
** Excluding market impacts and one-time items
464 473 498
Q1 13 Q4 13 Q1 14
33
37 37
Q1 13 Q4 13 Q1 14
232 268 223
1,738 1,741 2,086
Q1 13 Q4 13 Q1 14
7.8 7.7 8.4
Q1 13 Q4 13 Q1 14
327 304 305
Q1 13 Q4 13 Q1 14
790 836 779
Q1 13 Q4 13 Q1 14
Underlying earnings
before tax (EUR million)
Fee-based earnings
(% of UEBT)
Sales and MCVNB*
(EUR million)
Operational free cash flows**
(EUR million)
Operating expenses
(EUR million)
Return on equity
(%)

10
Q1 13 Q2 13 Q3 13 Q4 13 Q1 14
Underlying earnings increased 7% compared to Q1 2013 driven by business growth and
favorable equity markets (EUR 39 million) and impact of deleveraging (EUR 10 million)
► partly offset by investments in technology (EUR 10 million) and the impact of unfavorable currency
exchange rates (EUR 11 million)
Underlying earnings up on business growth, markets and lower leverage costs
Underlying earnings before tax (EUR million)
481 498
United Kingdom
New Markets
Americas
The Netherlands
Holding
+7%
550 473 464

11
Higher earnings in the Americas as growth in variable annuity, pension and mutual fund balances more
than offset the impact of lower reinvestment yields and unfavorable mortality
Higher earnings in the Netherlands due mostly to higher investment income and lower funding costs
UK earnings higher as improved persistency more than offset investments in technology
New Markets earnings increased as higher earnings from asset management more than offset lower
earnings in Asia and a divestment in Spain in 2013
Holding costs decreased 44% to EUR 21 million following debt redemptions, lower operating expenses
and a one-time gain of EUR 8 million related to interest on taxes
Underlying earnings increased to EUR 498 million
The Netherlands (EUR million)
New Markets
(EUR million)
United Kingdom (GBP million)
Americas (USD million)
60 46
61
Q1 13 Q4 13 Q1 14
Underlying earnings before tax
114 124 129
Q1 13 Q4 13 Q1 14
18 16
22
Q1 13 Q4 13 Q1 14
405 408 414
Q1 13 Q4 13 Q1 14

12
Underlyingearnings before
tax Q1 14
Fair value items Realized gainson investments
Impairmentcharges
Other charges Run-offbusinesses
Income tax Net incomeQ1 14
Fair value items mainly reflect hedging programs without accounting match in the US and NL
Gains on investments mainly driven by the sale of a stake in a single equity investment in the
Netherlands
Impairments remained low and mainly consisted of mortgages in CEE; impairments in the US
completely offset by RMBS recoveries
Other charges primarily related to restructuring costs in the United Kingdom
Strong net income in Q1 2014
498 (116) 110 (8) (6) 14 (100) 392
Underlying earnings to net income development in Q1 2014 (EUR million)

13
Total fair value items of EUR (116) million
Fair value items impacted by hedge programs without an accounting match
Americas: (13)
Alternative investments
Credit derivatives
Real estate
Netherlands: (11)
Alternative investments
Real estate
US GMWB: 44
Guarantees net of hedges
Netherlands guarantees: 22
Guarantees net of hedges
US macro hedging: (64)
GMIB/DB hedges
Other extreme event hedges
Holding: (23)
Swaps related to hybrids
Other: (6)
Credit spread on MTN
Foreign currency exchange
FV hedging with
accounting match*
EUR 66 million
Derivatives ∆: EUR 784m
Liability ∆: EUR (718)m
FV hedging without
accounting match
EUR (152) million
Derivatives ∆: EUR (152)m
Liability ∆: -
FV other
EUR (6) million
FV investments
EUR (24) million
* Except for changes in own credit spread and other non-hedged items
Other: (62)
Longevity swap
Hedging mortgage portfolio
Other
UK macro hedging: (3)

14
Gross deposits up 35% driven by US pensions and VA as well as asset management flows
► Net deposits down on transfer of Polish pension fund assets to the government for EUR 1.5 billion
and replacement of EUR 3 billion asset management mandate
New life sales lower following strong post-RDR UK pension sales in Q1 2013 partly offset
by increased universal life sales in the Americas
Higher accident & health and general insurance sales driven by portfolio acquisitions in the
US resulting from new distribution agreements and growth in supplemental health
Total sales up 20% on strong deposits and accident & health sales
1.7 2.0 (0.9)
10.0 10.6 13.5
Q1 13 Q4 13 Q1 14
Gross deposits (EUR billion)
239 198
279
Q1 13 Q4 13 Q1 14
A&H and general insurance (EUR million)
Net deposits excluding run-off
499 480
Q1 13 Q4 13 Q1 14
New life sales (EUR million)
Note: total sales consists of new life sales plus 1/10th of gross deposits plus new premiums for accident & health and general insurance
459

15
Gross deposits in the Americas up 26% driven by growth in pensions and variable annuities
Gross deposits in the Netherlands up 20% driven by inflows at on-line bank Knab
Gross and net inflow on the Platform of GBP 0.3 billion, launch of Retiready is expected to
accelerate growth
New Markets up 73% on strong asset management inflows driven by growth in retail sales in
the UK and China as well as strong VA production in Japan
Gross deposits higher in all units
2.8 3.2 3.2
6.2 6.2 8.3
Q1 13 Q4 13 Q1 14
IS&R (excl. FA) ES&P
Gross deposits
The Netherlands (EUR million)
United Kingdom (Platform deposits GBP million)
Americas (USD billion)
New Markets
(EUR billion)
404 329
486
Q1 13 Q4 13 Q1 14
156
336 305
Q1 13 Q4 13 Q1 14
2.6 3.2
4.4
Q1 13 Q4 13 Q1 14

16
Higher new life sales in the Americas primarily driven by higher sales of universal life
New life sales decreased in the Netherlands driven mostly by the continued shift from life
insurance to bank savings products and lower pension sales
Lower new life sales in the UK compared to elevated sales related to the introduction of RDR
in Q1 2013
New Markets sales slightly lower as growth in Asia was offset by declines in CEE and Spain
New life sales of EUR 459 million
145 154 158
Q1 13 Q4 13 Q1 14
New life sales
The Netherlands (EUR million)
United Kingdom (GBP million)
Americas (USD million)
New Markets
(EUR million)
40
95
32
Q1 13 Q4 13 Q1 14
244
179 206
Q1 13 Q4 13 Q1 14
63 58 62
Q1 13 Q4 13 Q1 14

17
Q1 12 Q1 13 Q1 14
Sales and investments in new
business as % of sales (EUR billion)
Americas
The Netherlands
- MCVNB/PVNBP
United Kingdom
New Markets
Americas strong on improvements in VA and universal life
MCVNB the Netherlands reflects lower mortgage margins
UK impacted by lower margins and volumes on annuities and
lower margins arising from auto-enrollment
New markets up on inclusion Santander joint venture and higher
life sales in Asia following expanded distribution
Investment in new business as % of sales down as a result of
strong sales of capital-light deposit business
Continued strong MCVNB and reduced investment in new business
1.8 1.7
2.1
17% 15%
12%
Q1 12 Q1 13 Q1 14
Market consistent VNB (EUR million)
232 223
1.9%
1.6%
1.0%
125
See slide 31 for MCVNB methodology changes

18
Strong MCVNB growth in the Americas driven by higher variable annuity sales and margins,
and improvement in life insurance sales
Lower MCVNB in the Netherlands due mainly to lower margins on new mortgage production
MCVNB in the UK decreased due to lower margins and volumes on annuities and lower
margins in pensions from auto enrollment
Higher MCVNB in New Markets due to the addition of the joint venture with Santander in Spain
and higher universal life sales in Asia
Market consistent value of new business of EUR 223 million
Market consistent value of new business
Americas (USD million)
New Markets
(EUR million)
18
6 1
Q1 13 Q4 13 Q1 14
95
59 39
Q1 13 Q4 13 Q1 14
United Kingdom (GBP million)
The Netherlands (EUR million)
125
242 208
Q1 13 Q4 13 Q1 14
21 22
32
Q1 13 Q4 13 Q1 14

19
Normalized operational free cash flows of EUR 305 million
► Market impacts of EUR 48 million driven mostly by interest rates and credit spreads
► One-time items of EUR (22) million due mostly to reserve strain on term and UL business in the
Americas and business transformation costs in the UK
Holding excess capital of EUR 1.7 billion following call of USD 550 million capital securities
Solid operational free cash flows and holding excess capital
Q1 13 Q4 13 Q1 14
Earnings on in-force 526 234 802
Return on free surplus 17 16 14
Release of required surplus 270 300 (234)
New business strain (261) (322) (251)
Operational free cash flow 553 228 331
Market impacts & one-time items 226 (76) 26
Normalized operational free cash flow 327 304 305
Holding funding & operating expenses (74) (118) (71)
Q1 14
Starting position 2.2
Net dividends received from business units (0.0)
Acquisitions & divestments -
Common dividends -
Funding & operating expenses (0.1)
Deleveraging (0.4)
Other (0.0)
Ending position 1.7
Capital allocated to additional deleveraging (0.5)
Holding excess capital development (EUR billion)
Operational free cash flows (EUR million)

20
United Kingdom (Pillar 1 ratio incl. with profit fund**)
United States (USD million excess over S&P AA)
165%
145%
Group IGD solvency ratio remained at ~212% as the benefit of earnings and tightening
of credit spreads was offset by the redemption of USD 550 million capital securities
Excess capital in the United States of USD ~800 million above S&P AA level
Stable solvency 1 ratios in the Netherlands and the UK
Solid group and local capital positions
~130% ~150% ~150%
Q1 13 Q4 13 Q1 14
Target level Buffer level
250% 700
0
200% ~900
~500
~800
Q1 13 Q4 13 Q1 14
* ECB AAA curve used for Q1 13 ratio; swap curve used starting Q2 13
** including excess capital at UK holding level
~285%
~240% ~240%
Q1 13 Q4 13 Q1 14
The Netherlands (IGD ratio ex. Bank*)

21
Current capital allocated to run-off businesses of USD 2.1 billion
► Return on capital of run-off businesses of 3.7% year to date
Capital intensive run-off businesses negatively impact return on equity
► Capital allocated to run-off businesses included in RoE calculations, but earnings are excluded
Capital allocated to run-off businesses
Run-off period 2010 2011 2012 2013 2014 Q1 2015E
Payout annuities > 20 years 0.5 0.5 0.5 0.5 0.5 0.4
Institutional spread-based business ~ 5 years 0.8 0.7 0.6 0.4 0.4 0.3
BOLI/COLI > 10 years 0.7 0.5 0.5 0.5 0.5 0.5
Life reinsurance ~ 15 years 3.1 1.3 1.1 0.7 0.7 0.7
5.1 3.0 2.7 2.1 2.1 1.9
* IFRS equity, excluding revaluation reserves
Allocated capital to run-off businesses* (USD billion)

22
9.2 9.6 11.7
Q1 13 Q4 13 Q1 14
Higher underlying earnings as growth in variable annuity, mutual fund and pension balances more than
offset the impact of lower Life & Protection earnings
Operating expenses 4% lower due mainly to lower employee benefit and performance related expenses
New life sales increased 9% mainly driven by higher sales of universal life secondary guarantee life
products following introduction of redesigned product in 2013; A&H sales up 28% to USD 338 million on
portfolio acquisitions resulting from new distribution agreements
26% increase in gross deposits driven mostly by strong production in variable annuities and pensions
Strong MCVNB growth driven by higher variable annuity sales and margins, and improvement in life
insurance sales
Americas
Underlying earnings
before tax (USD million)
New life sales (USD million)
Gross deposits (USD billion)
Operating expenses (USD million)
473 480 453
Q1 13 Q4 13 Q1 14
405 408 414
Q1 13 Q4 13 Q1 14
145 154 158
Q1 13 Q4 13 Q1 14

23
Earnings increased 13% due mostly to higher investment income and lower funding costs
Operating expenses increased 4% driven by a reclassification of expenses
New life sales decreased due mostly to the continued shift from life insurance to bank savings products and lower pension sales as Q1 2013 included a large buyout deal
Higher gross deposits mainly the result of strong performance from online bank Knab, following repositioning
Lower MCVNB due mainly to lower margins on new mortgage production
The Netherlands
404 329
486
Q1 13 Q4 13 Q1 14
179 190 185
Q1 13 Q4 13 Q1 14
114 124 129
Q1 13 Q4 13 Q1 14
40
95
32
Q1 13 Q4 13 Q1 14
Underlying earnings
before tax (EUR million)
New life sales (EUR million)
Platform deposits (EUR million)
Operating expenses (EUR million)

24
Earnings higher as improved persistency more than offset investments in technology
Operating expenses increased as cost reductions were more than offset by higher investments
in technology and business transformation costs
Group pensions sales slowed compared with a strong Q1 13 following the introduction of RDR
Fast growing platform with balances reaching GBP 1.6 billion
MCVNB decreased due to lower margins and volumes on annuities and lower margins in
pensions from auto enrollment
United Kingdom
Underlying earnings
before tax (GBP million)
New life sales (GBP million)
Platform deposits (GBP million)
Operating expenses (GBP million)
156
336 305
Q1 13 Q4 13 Q1 14
69 84 77
Q1 13 Q4 13 Q1 14
18 16
22
Q1 13 Q4 13 Q1 14
244
179 206
Q1 13 Q4 13 Q1 14

25
Higher earnings from Aegon Asset Management more than offset lower earnings in Asia and a
divestment in Spain in 2013
Lower operating expenses as a result of currencies and timing of expenses
New life sales slightly lower as growth in Asia was offset by declines in CEE and Spain
Gross deposits increased 73% due mostly to higher retail asset management deposits in the
UK and China
Higher MCVNB due to the addition of the joint venture with Santander in Spain and higher
universal life sales in Asia
New Markets
Underlying earnings
before tax (EUR million)
New life sales (EUR million)
Gross deposits (EUR billion)
Operating expenses (EUR million)
2.6 3.2
4.4
Q1 13 Q4 13 Q1 14
157 176
156
Q1 13 Q4 13 Q1 14
60 46
61
Q1 13 Q4 13 Q1 14
63 58 62
Q1 13 Q4 13 Q1 14

26
Actual income tax can deviate from the nominal tax rate, amongst others due to:
► Tax exempt income
► Tax credits
► Valuation allowances for tax losses
► Tax rate changes
Reconciliation of effective tax rate Q1 2014
► Cross border intercompany reinsurance
► Policyholder tax UK (offsetting)
► Other items
Reconciliation of effective tax rate Q1 2014
EUR million Americas The Netherlands United Kingdom New Markets/ Holdings Total
Income before tax 282 172 37 1 492
Nominal tax rate 35.0% (97) 25.0% (43) 21.5% (8) N/A 3 (145)
Actual income tax (63) (29) (9) 0 (100)
Net income 219 143 28 1 392

27
General account investments roll-forward
General account investment roll-forward
EUR billion Americas The Netherlands United Kingdom New Markets & Other
Opening balance December 31, 2013 75.8 45.3 10.7 3.5
Net in- and outflow 0.1 0.5 (0.1) 0.2
Unrealized / realized results 1.5 0.8 0.2 0.1
Foreign exchange (0.2) 0.0 0.1 (0.0)
Closing balance March 31, 2014 77.2 46.7 11.0 3.7
Americas includes balance reductions from the run-off of the institutional spread business of
EUR 0.5 billion and from fixed annuities of EUR 0.4 billion as the product is de-emphasized

28
Sustainability efforts support strategy
Products and services customers can trust A responsible approach to investments Supporting local communities
Introducing products that are
clearer and easier to understand
Changing the product design
process so that each step
considers the value to the
customer
Supporting market conduct
principles that focus on meeting
customers’ needs
Decisions guided by
Responsible Investment Policy
Clear standards in areas such
as child labor, the environment
and corruption
Using influence to promote
sustainability governance and
economic development
Long tradition of working
with and investing in local
communities
Volunteering program
encourages employees to
take paid time-off to work
on local initiatives
Supporting local charities
and good causes
worldwide
A recognized strong foundation – Doing the “basics” well

29
Aegon ordinary shares
► Traded in Amsterdam (NYSE Euronext) since 1969
and quoted in Euros
Aegon New York Registry Shares (NYRS)
► Traded on NYSE since 1991 and quoted in US
dollars
► Attractive option for US investors
► One Aegon NYRS equals one Aegon Amsterdam-
listed common share
► Cost effective way to hold international securities
Investing in Aegon
Aegon’s ordinary shares
Aegon’s New York Registry Shares
Ticker symbol AGN NA
Underlying ISIN NL0000303709
SEDOL 5927375NL
Trading Platform Euronext Amsterdam
Country Netherlands
Aegon NYRS contact details
Broker contacts at Citibank N.A.:
Telephone: New York: +1 212 723 5435
London: +44 (0) 207 500 2030
E-mail: [email protected]
Ticker symbol AEG US
NYRS ISIN US0079241032
NYRS SEDOL 2008411US
Trading Platform NYSE
Country USA
NYRS Transfer Agent Citibank, N.A.
30
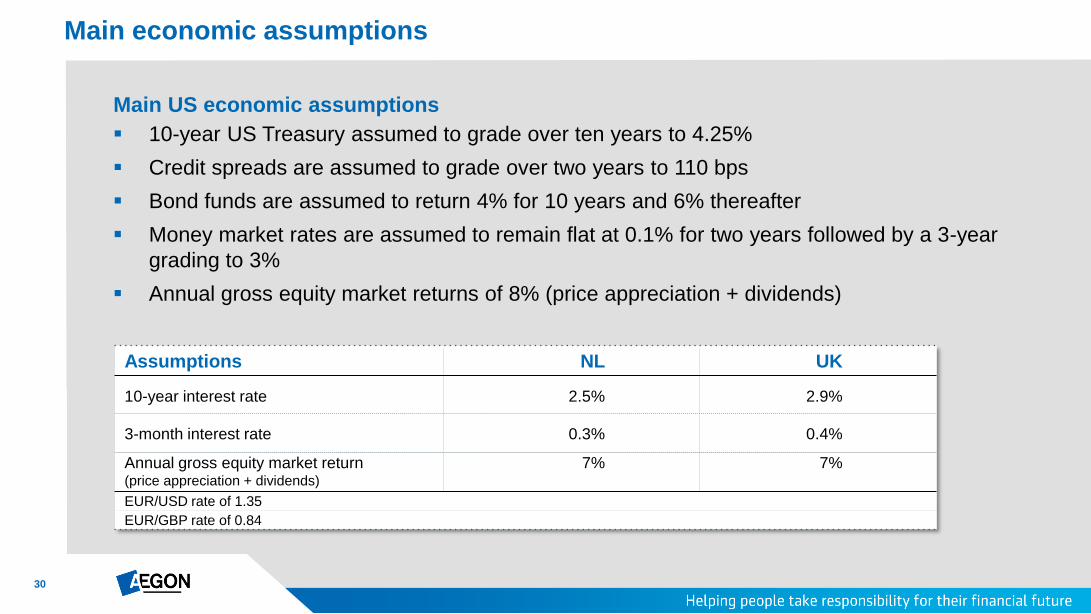
10-year US Treasury assumed to grade over ten years to 4.25%
Credit spreads are assumed to grade over two years to 110 bps
Bond funds are assumed to return 4% for 10 years and 6% thereafter
Money market rates are assumed to remain flat at 0.1% for two years followed by a 3-year
grading to 3%
Annual gross equity market returns of 8% (price appreciation + dividends)
Main economic assumptions
Main US economic assumptions
Assumptions NL UK
10-year interest rate 2.5% 2.9%
3-month interest rate 0.3% 0.4%
Annual gross equity market return (price appreciation + dividends)
7% 7%
EUR/USD rate of 1.35
EUR/GBP rate of 0.84

31
Reporting changes implemented per Q1 2014
Amended accounting policies
As of January 1, 2014 Aegon voluntarily changed its accounting policies for deferral of acquisition costs across the group and
longevity reserving in the Netherlands. For details see http://www.aegon.com/6k and http://www.aegon.com/reportingchanges
Sales
Aegon UK started reporting platform assets on a quarterly basis. There will be no change to the reporting of sales.
Aegon's Stable Value Solutions (SVS) business in the Americas is managed to maintain the current level of assets, and not for
new sales. Therefore, SVS' deposits will no longer be included in Aegon's sales and MCVNB reporting going forward. In 2013,
SVS recorded USD 3.0 billion in deposits and USD 23 million in MCVNB.
Market consistent value of new business
Aegon prospectively implemented a number of changes to the calculation of MCVNB. These include adjustments to the cost of
capital, the inclusion of expenses charged by the Corporate Center to the operating units, and incorporation of the ultimate
forward rate in the methodology to construct the risk free curve.
Operating expenses
Aegon Americas' IS&R internal wholesalers are compensated primarily based on sales levels. Their variable compensation as
well as production bonuses at ES&P resemble commission. These items have been, therefore, retrospectively reclassified as
commissions from operating expenses. In 2013, variable compensation for Aegon Americas' IS&R internal wholesalers and the
production bonuses at ES&P totaled USD 74 million. This reporting change has no impact on underlying earnings.

32
IFRS longevity reserves in the Netherlands based on prospective mortality tables as of Q1 2014
► IFRS capital in the Netherlands reduced by EUR 0.8 billion
► Positive impact on underlying earnings estimated at ~EUR 130 million* in 2014
Valuation consistent with IGD solvency, Solvency II and internal economic framework
Aegon assumes an improvement in life expectancy of approximately one to three months each year by moving from observed to prospective mortality tables
► Increase is higher in the short term than in the long term
Longevity reserves based on prospective mortality tables
70
80
90
2012 2022 2032 2042 2052 2062
Male (old) Male (new) Female (old) Female (new)
70
80
90
2012 2022 2032 2042 2052 2062
Male (old) Male (new) Female (old) Female (new)
* Excluding the impact of observed mortality of EUR 25 million in Q4 2013
Life expectancy 60 year olds Life expectancy newborns

33
Cautionary note regarding non-IFRS measures This document includes the non-IFRS financial measures: underlying earnings before tax, income tax, income before tax and market consistent value of new business. These non-IFRS measures are calculated by consolidating on a proportionate basis Aegon’s joint ventures and associated companies. The reconciliation of these measures, except for market consistent value of new business, to the most comparable IFRS measure is provided in note 3 ‘Segment information’ of Aegon’s Condensed Consolidated Interim Financial Statements. Market consistent value of new business is not based on IFRS, which are used to report Aegon’s primary financial statements and should not be viewed as a substitute for IFRS financial measures. Aegon may define and calculate market consistent value of new business differently than other companies. Aegon believes that its non-IFRS measures, together with the IFRS information, provide meaningful information about the underlying operating results of Aegon’s business including insight into the financial measures that senior management uses in managing the business. In addition return on equity is a ratio using a non-GAAP measure and is calculated by dividing the net underlying earnings after cost of leverage by the average shareholders 'equity excluding the preferred shares, the revaluation reserve and the reserves related to defined benefit plans.
Local currencies and constant currency exchange rates This document contains certain information about Aegon’s results, financial condition and revenue generating investments presented in USD for the Americas and GBP for the United Kingdom, because those businesses operate and are managed primarily in those currencies. Certain comparative information presented on a constant currency basis eliminates the effects of changes in currency exchange rates. None of this information is a substitute for or superior to financial information about Aegon presented in EUR, which is the currency of Aegon’s primary financial statements.
Forward-looking statements The statements contained in this document that are not historical facts are forward-looking statements as defined in the US Private Securities Litigation Reform Act of 1995. The following are words that identify such forward-looking statements: aim, believe, estimate, target, intend, may, expect, anticipate, predict, project, counting on, plan, continue, want, forecast, goal, should, would, is confident, will, and similar expressions as they relate to Aegon. These statements are not guarantees of future performance and involve risks, uncertainties and assumptions that are difficult to predict. Aegon undertakes no obligation to publicly update or revise any forward-looking statements. Readers are cautioned not to place undue reliance on these forward-looking statements, which merely reflect company expectations at the time of writing. Actual results may differ materially from expectations conveyed in forward-looking statements due to changes caused by various risks and uncertainties. Such risks and uncertainties include but are not limited to the following:
Changes in general economic conditions, particularly in the United States, the Netherlands and the United Kingdom;
Changes in the performance of financial markets, including emerging markets, such as with regard to: ► The frequency and severity of defaults by issuers in Aegon’s fixed income investment portfolios;
► The effects of corporate bankruptcies and/or accounting restatements on the financial markets and the resulting decline in the value of equity and debt securities Aegon holds; and
► The effects of declining creditworthiness of certain private sector securities and the resulting decline in the value of sovereign exposure that Aegon holds;
Changes in the performance of Aegon’s investment portfolio and decline in ratings of Aegon’s counterparties;
Consequences of a potential (partial) break-up of the euro;
The frequency and severity of insured loss events;
Changes affecting longevity, mortality, morbidity, persistence and other factors that may impact the profitability of Aegon’s insurance products;
Reinsurers to whom Aegon has ceded significant underwriting risks may fail to meet their obligations;
Changes affecting interest rate levels and continuing low or rapidly changing interest rate levels;
Changes affecting currency exchange rates, in particular the EUR/USD and EUR/GBP exchange rates;
Changes in the availability of, and costs associated with, liquidity sources such as bank and capital markets funding, as well as conditions in the credit markets in general such as changes in borrower and counterparty creditworthiness;
Increasing levels of competition in the United States, the Netherlands, the United Kingdom and emerging markets;
Changes in laws and regulations, particularly those affecting Aegon’s operations, ability to hire and retain key personnel, the products Aegon sells, and the attractiveness of certain products to its consumers;
Regulatory changes relating to the insurance industry in the jurisdictions in which Aegon operates;
Changes in customer behavior and public opinion in general related to, among other things, the type of products also Aegon sells, including legal, regulatory or commercial necessity to meet changing customer expectations;
Acts of God, acts of terrorism, acts of war and pandemics;
Changes in the policies of central banks and/or governments;
Lowering of one or more of Aegon’s debt ratings issued by recognized rating organizations and the adverse impact such action may have on Aegon’s ability to raise capital and on its liquidity and financial condition;
Lowering of one or more of insurer financial strength ratings of Aegon’s insurance subsidiaries and the adverse impact such action may have on the premium writings, policy retention, profitability and liquidity of its insurance subsidiaries;
The effect of the European Union’s Solvency II requirements and other regulations in other jurisdictions affecting the capital Aegon is required to maintain;
Litigation or regulatory action that could require Aegon to pay significant damages or change the way Aegon does business;
As Aegon’s operations support complex transactions and are highly dependent on the proper functioning of information technology, a computer system failure or security breach may disrupt Aegon’s business, damage its reputation and adversely affect its results of operations, financial condition and
cash flows;
Customer responsiveness to both new products and distribution channels;
Competitive, legal, regulatory, or tax changes that affect profitability, the distribution cost of or demand for Aegon’s products;
Changes in accounting regulations and policies or a change by Aegon in applying such regulations and policies, voluntarily or otherwise, may affect Aegon’s reported results and shareholders’ equity;
The impact of acquisitions and divestitures, restructurings, product withdrawals and other unusual items, including Aegon’s ability to integrate acquisitions and to obtain the anticipated results and synergies from acquisitions;
Catastrophic events, either manmade or by nature, could result in material losses and significantly interrupt Aegon’s business; and
Aegon’s failure to achieve anticipated levels of earnings or operational efficiencies as well as other cost saving initiatives.
Further details of potential risks and uncertainties affecting Aegon are described in its filings with the Netherlands Authority for the Financial Markets and the US Securities and Exchange Commission, including the Annual Report. These forward-looking statements speak only as of the date of this document. Except as required by any applicable law or regulation, Aegon expressly disclaims any obligation or undertaking to release publicly any updates or revisions to any forward-looking statements contained herein to reflect any change in Aegon’s expectations with regard thereto or any change in events, conditions or circumstances on which any such statement is based.
Disclaimer


![Investors & Analysts Presentation [Company Update]](https://img.pdfslide.net/doc/110x75/577c7c231a28abe0549972fe/investors-analysts-presentation-company-update.jpg)


![Investors' and Analysts' Meet [Company Update]](https://img.pdfslide.net/doc/110x75/577c7ac51a28abe054963435/investors-and-analysts-meet-company-update.jpg)