Embed Size (px)
Citation preview
Center for Energy and Environment
March 26, 2015
Providing energy solutions for homeowners, nonprofits,
businesses and government
Pg. 2
CEE’s Nonprofit Mission
The Center for Energy and Environment (CEE) is a
nonprofit organization that promotes energy efficiency to
strengthen the economy while improving the
environment
• We do this through:
• Nation-leading Energy Efficiency Research
• Award-winning Energy Efficiency Programs that have saved
customers over $500 million
• Nearly $200 million in Clean Energy Project Financing
• Policy Innovations such as Minnesota’s Energy Efficiency
Resource Standard and associated utility financial
incentives
Pg. 3
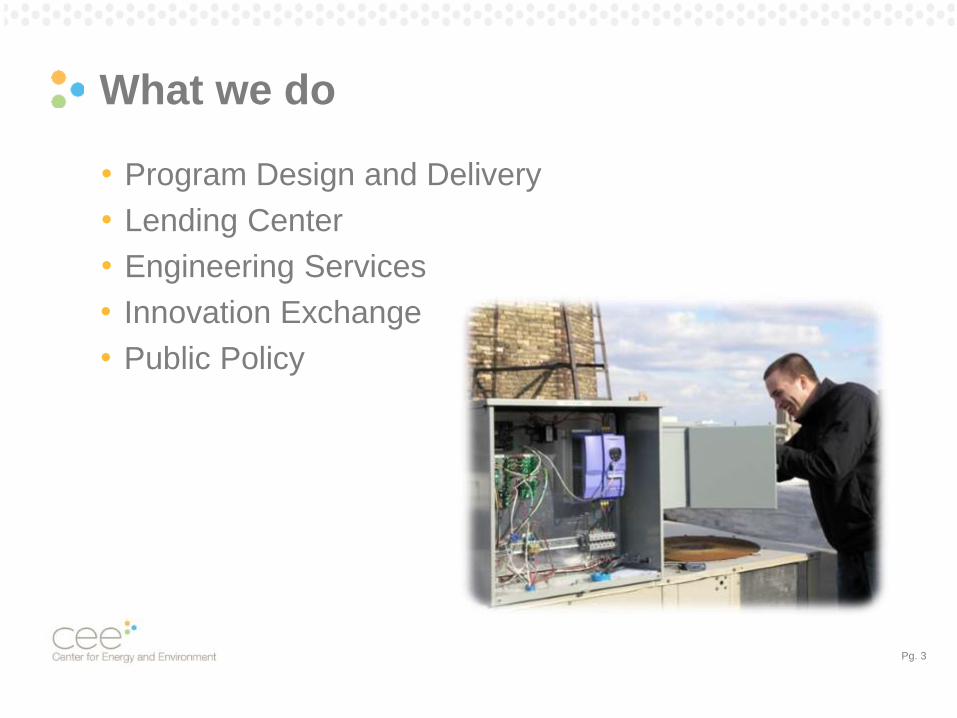
What we do
• Program Design and Delivery
• Lending Center
• Engineering Services
• Innovation Exchange
• Public Policy
Pg. 4
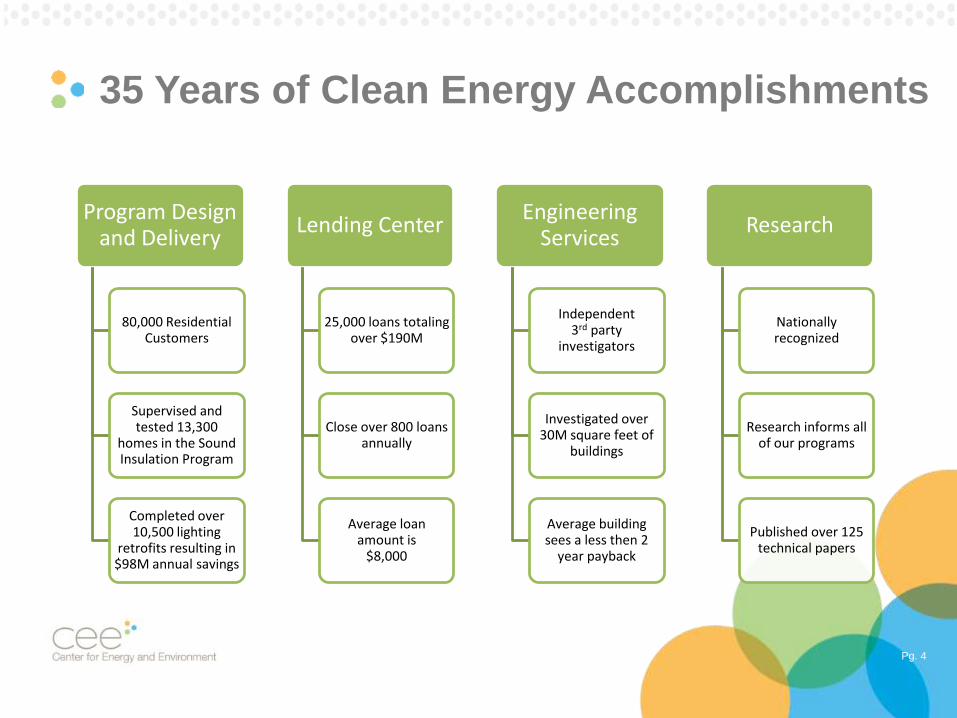
35 Years of Clean Energy Accomplishments
Program Design and Delivery
80,000 Residential Customers
Supervised and tested 13,300
homes in the Sound Insulation Program
Completed over 10,500 lighting
retrofits resulting in $98M annual savings
Lending Center
25,000 loans totaling over $190M
Close over 800 loans annually
Average loan amount is
$8,000
Engineering Services
Independent 3rd party
investigators
Investigated over 30M square feet of
buildings
Average building sees a less then 2
year payback
Research
Nationally recognized
Research informs all of our programs
Published over 125 technical papers
Pg. 5
Partnerships

NEXT GENERATION OF CIP PROGRAMS
AESP Midwest Meeting
March 25, 2015
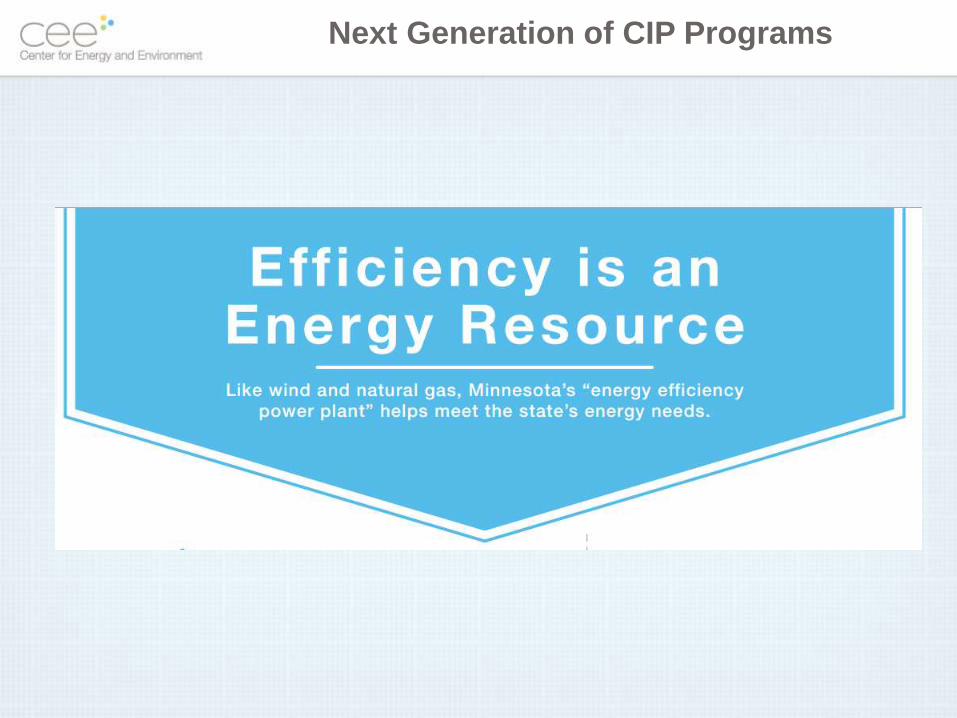
Next Generation of CIP Programs
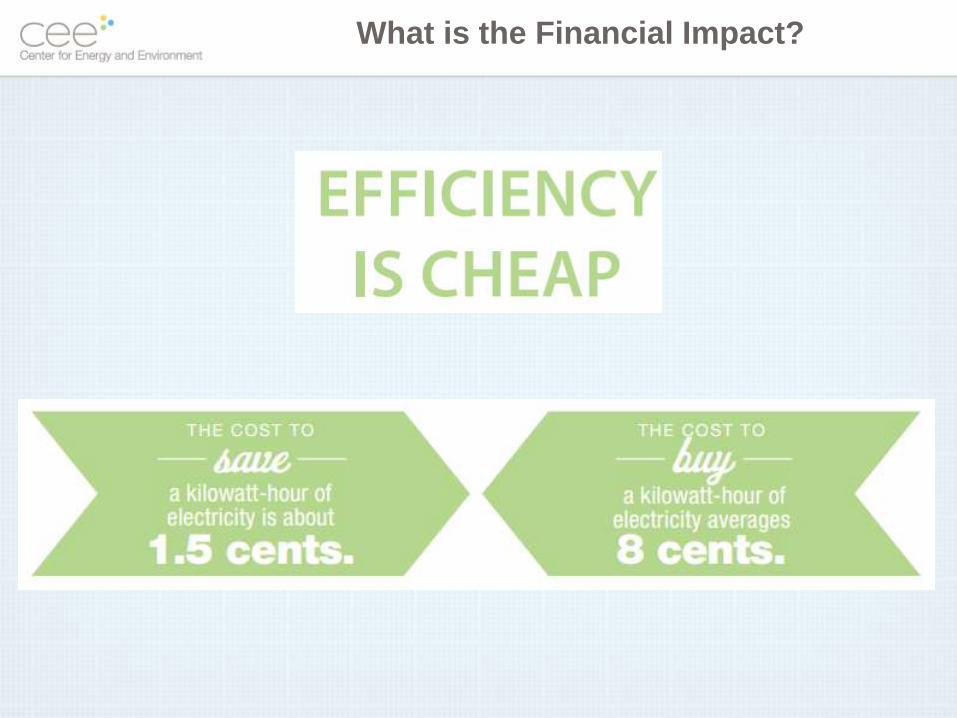
What is the Financial Impact?
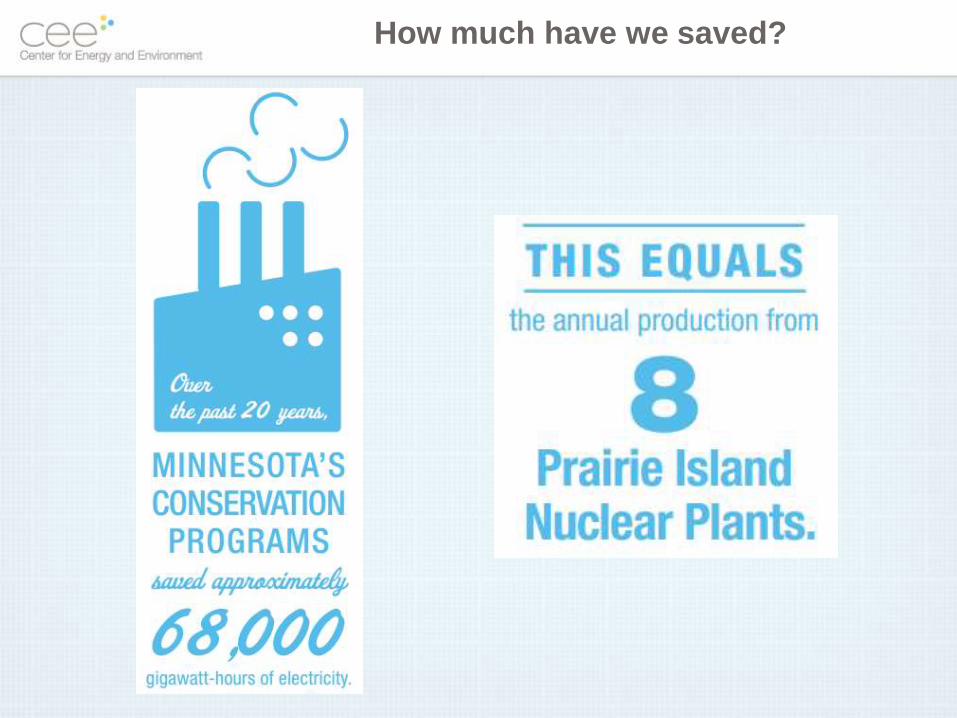
How much have we saved?
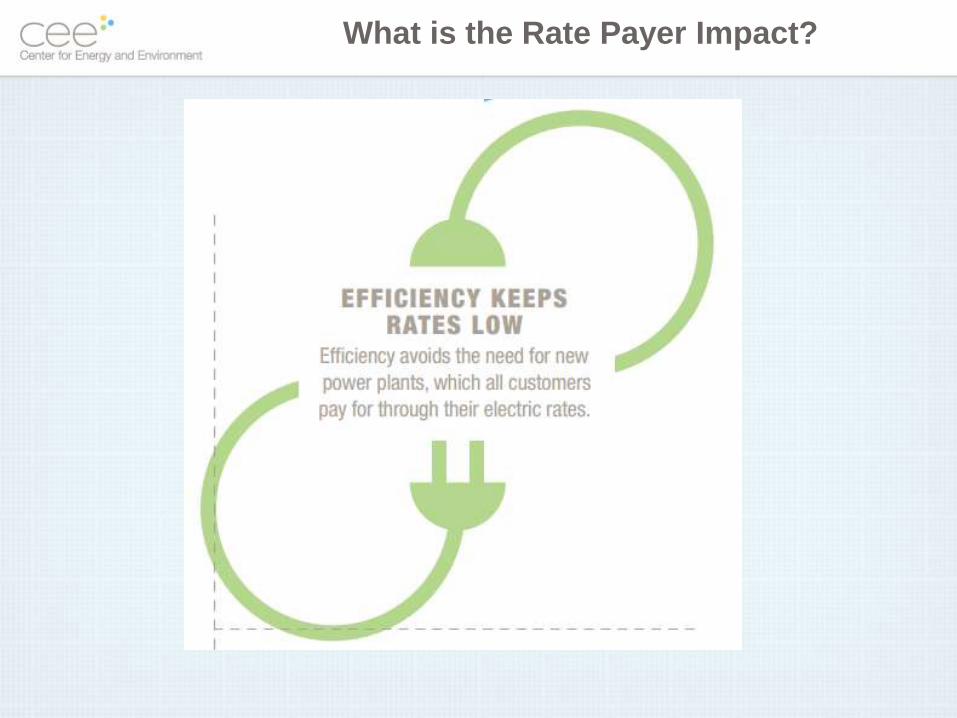
What is the Rate Payer Impact?
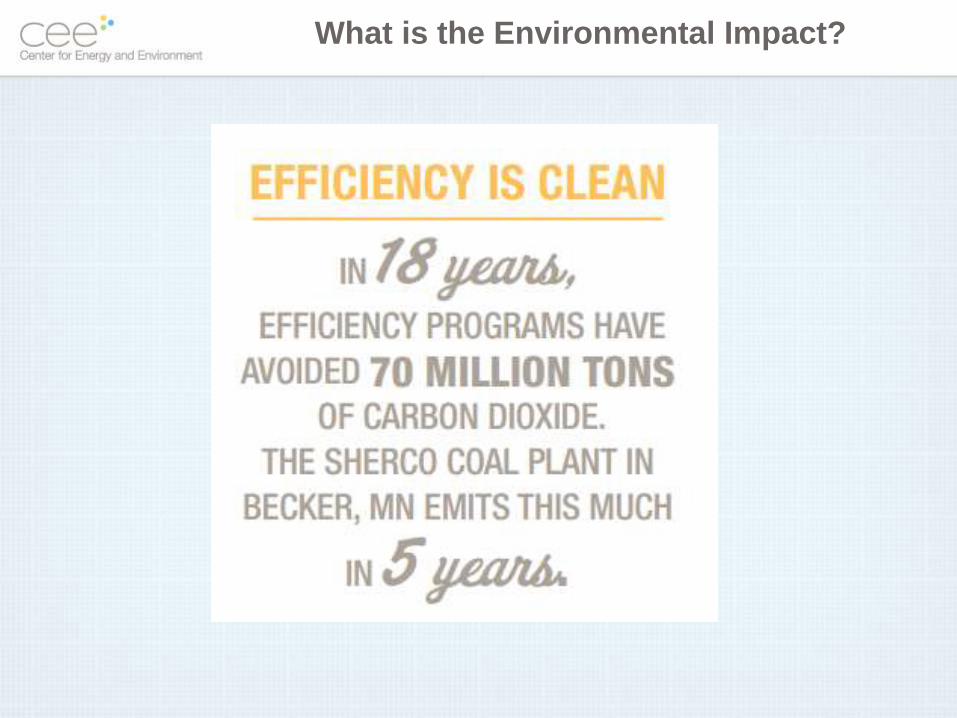
What is the Environmental Impact?
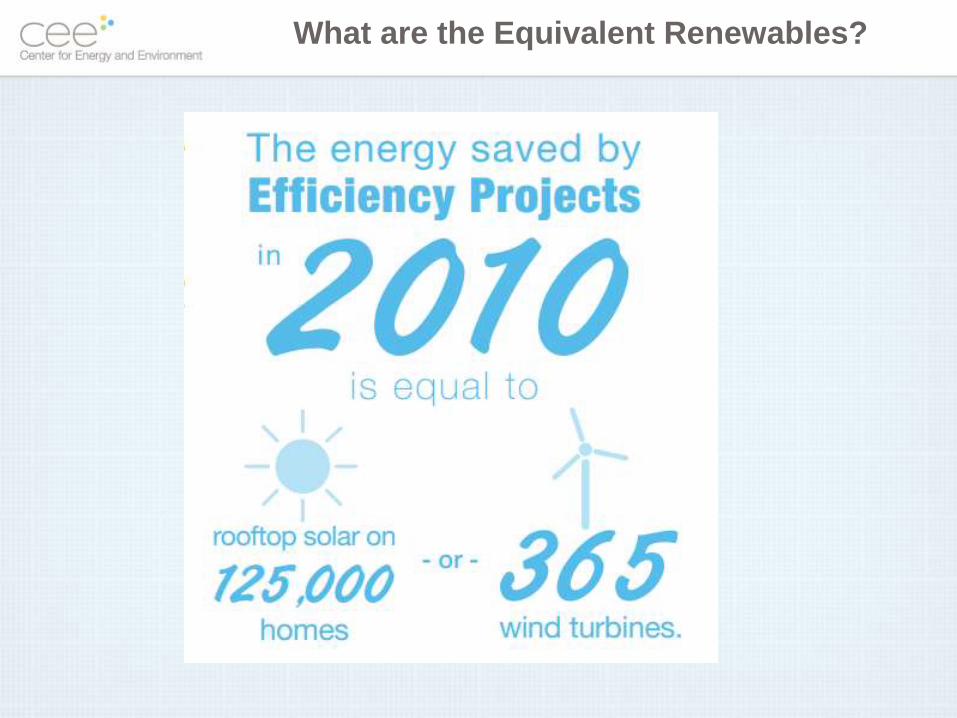
What are the Equivalent Renewables?
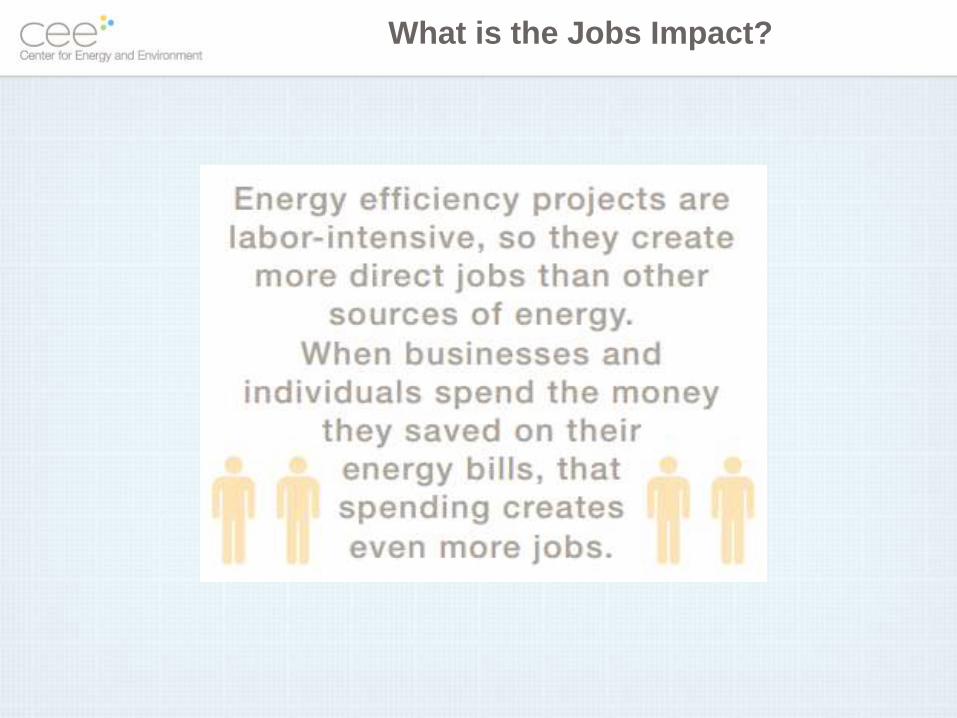
What is the Jobs Impact?
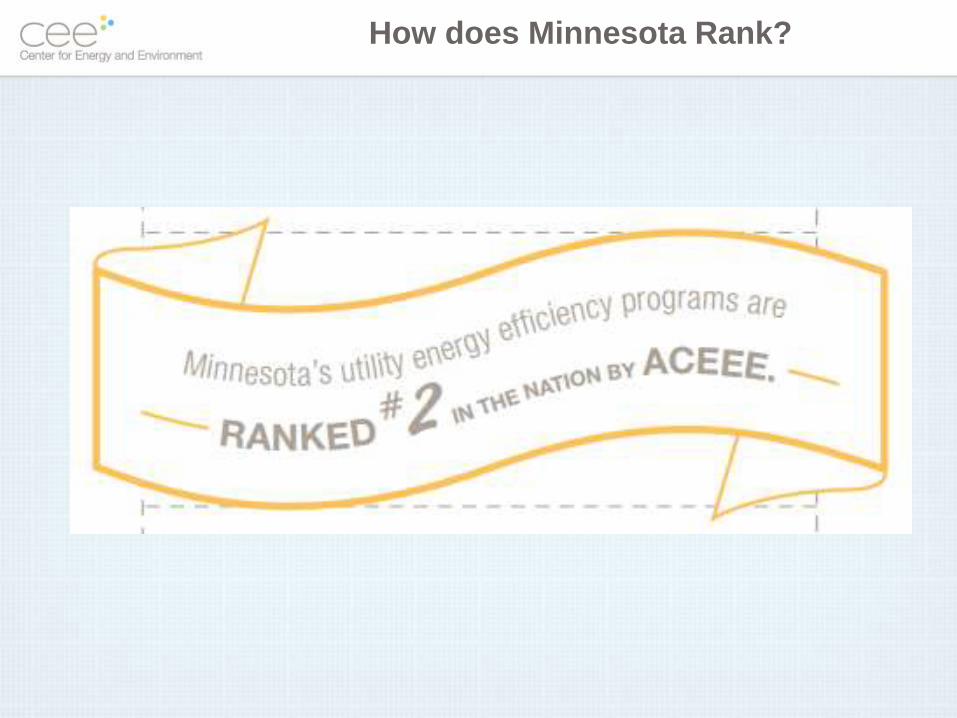
How does Minnesota Rank?
Advanced Rooftop HVAC Unit
Controls Pilot
Mark Hancock P.E.

Pg. 17
So Why Roof Top Units (RTUs)?
Account for more than 25% of the energy use in typical commercial spaces
Pg. 18
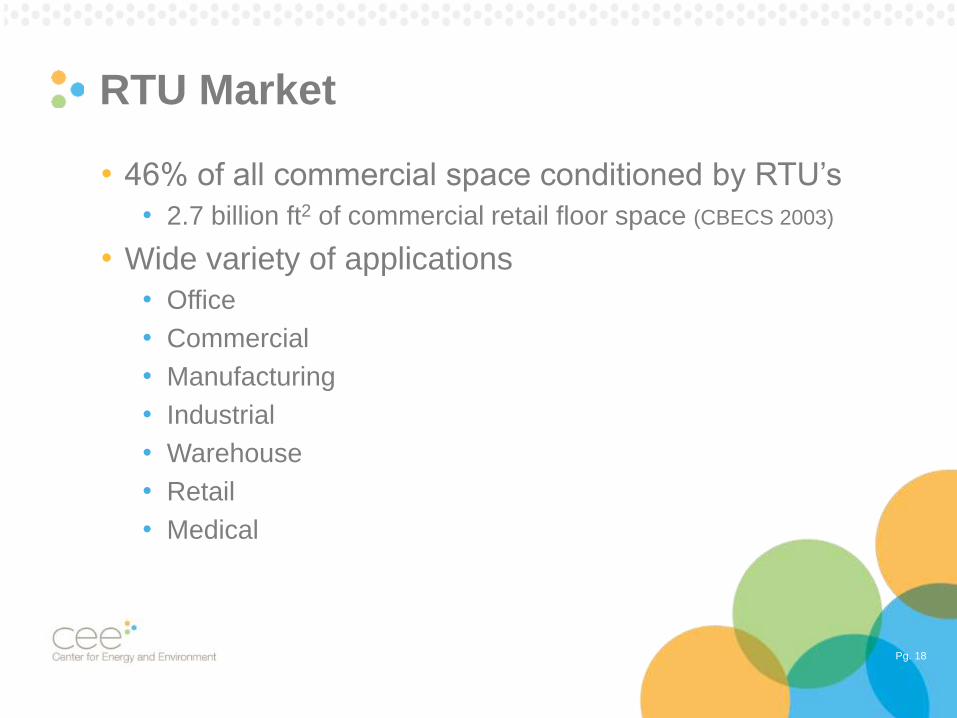
RTU Market
• 46% of all commercial space conditioned by RTU’s
• 2.7 billion ft2 of commercial retail floor space (CBECS 2003)
• Wide variety of applications
• Office
• Commercial
• Manufacturing
• Industrial
• Warehouse
• Retail
• Medical
Pg. 19
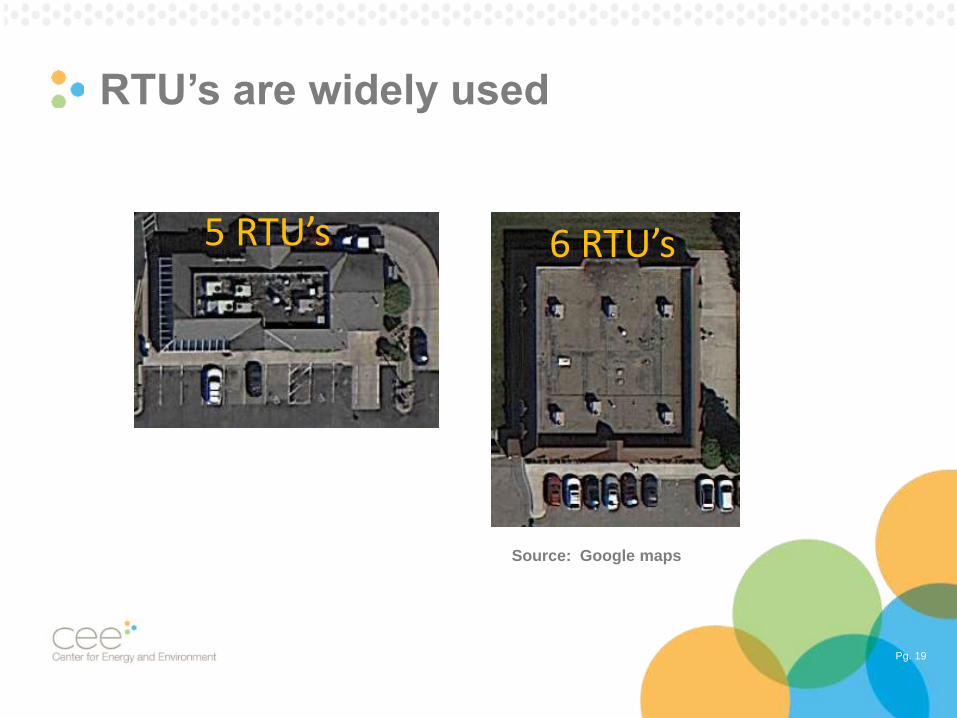
RTU’s are widely used
Source: Google maps
5 RTU’s 6 RTU’s
Pg. 20
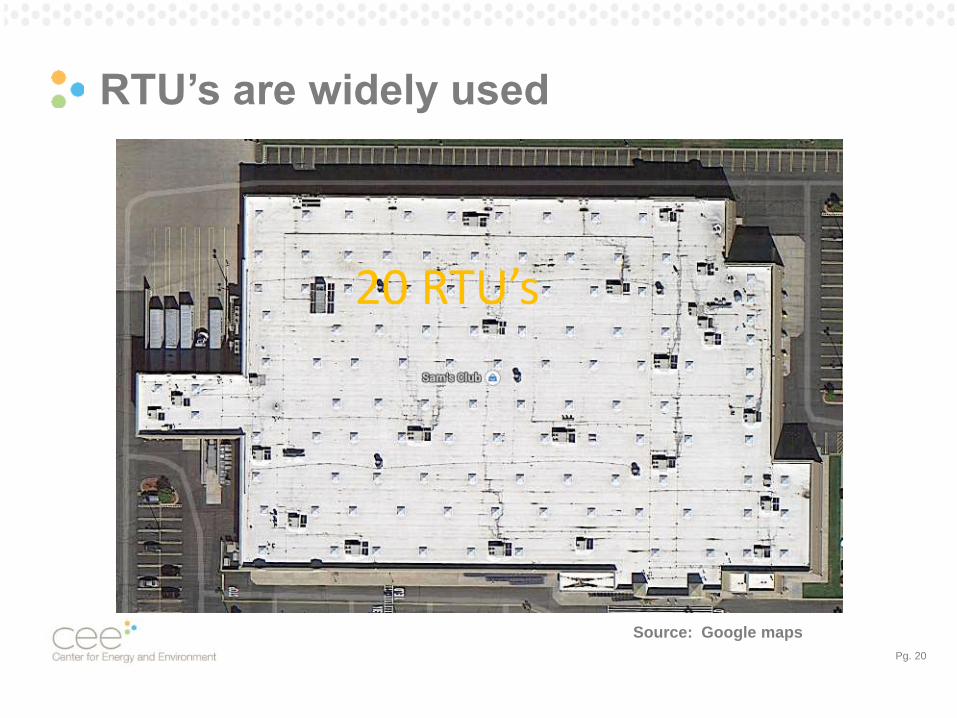
RTU’s are widely used
Source: Google maps
20 RTU’s
Pg. 21
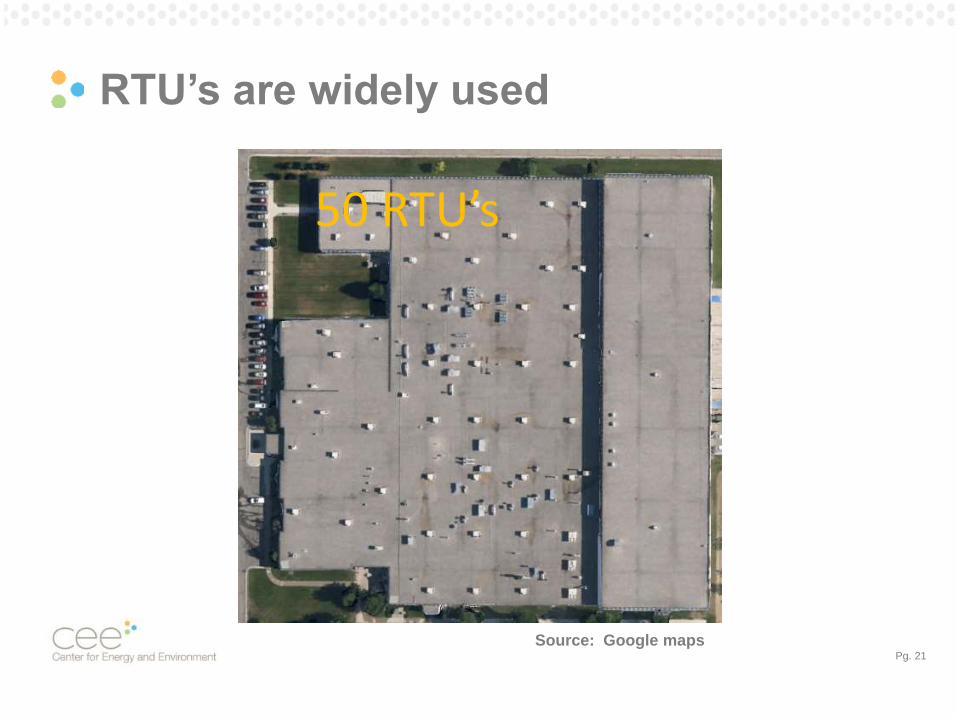
RTU’s are widely used
Source: Google maps
50 RTU’s
Pg. 22
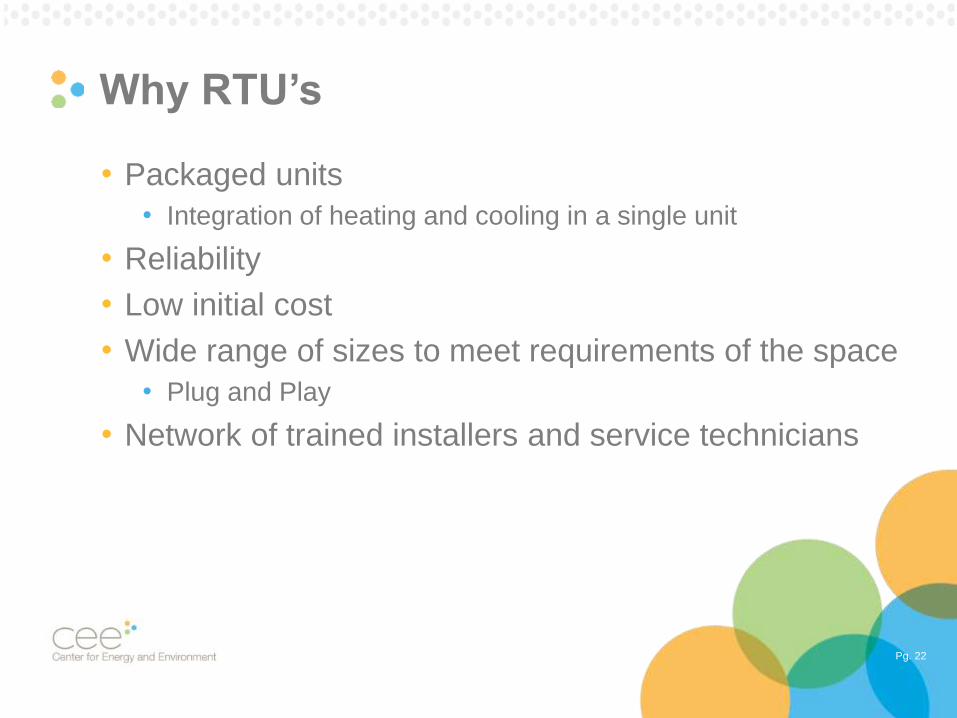
Why RTU’s
• Packaged units
• Integration of heating and cooling in a single unit
• Reliability
• Low initial cost
• Wide range of sizes to meet requirements of the space
• Plug and Play
• Network of trained installers and service technicians
Pg. 23
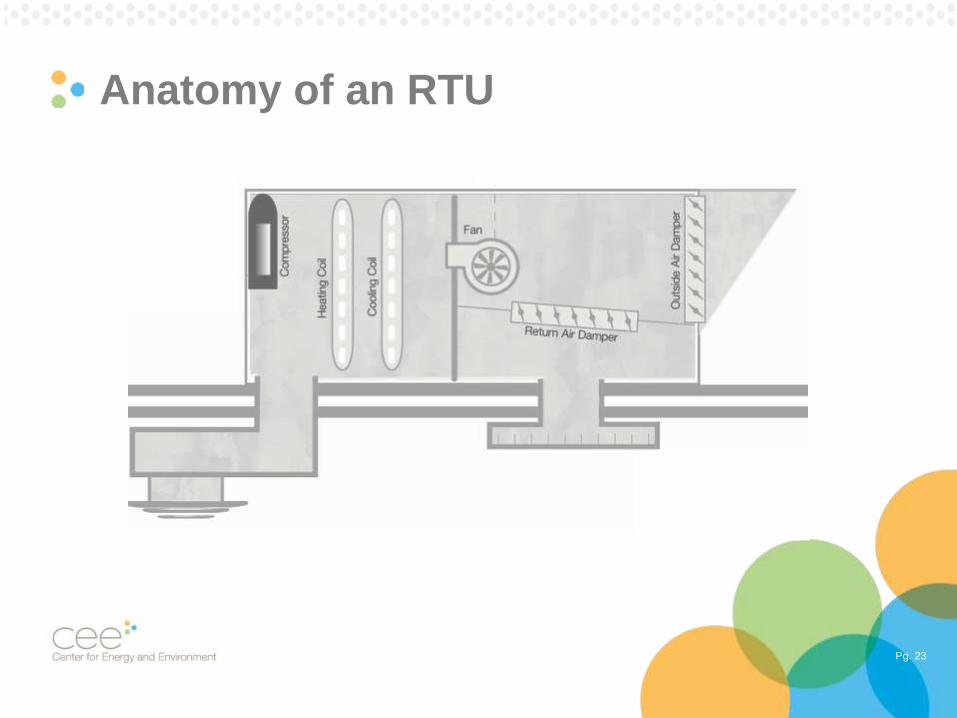
Anatomy of an RTU
Pg. 24
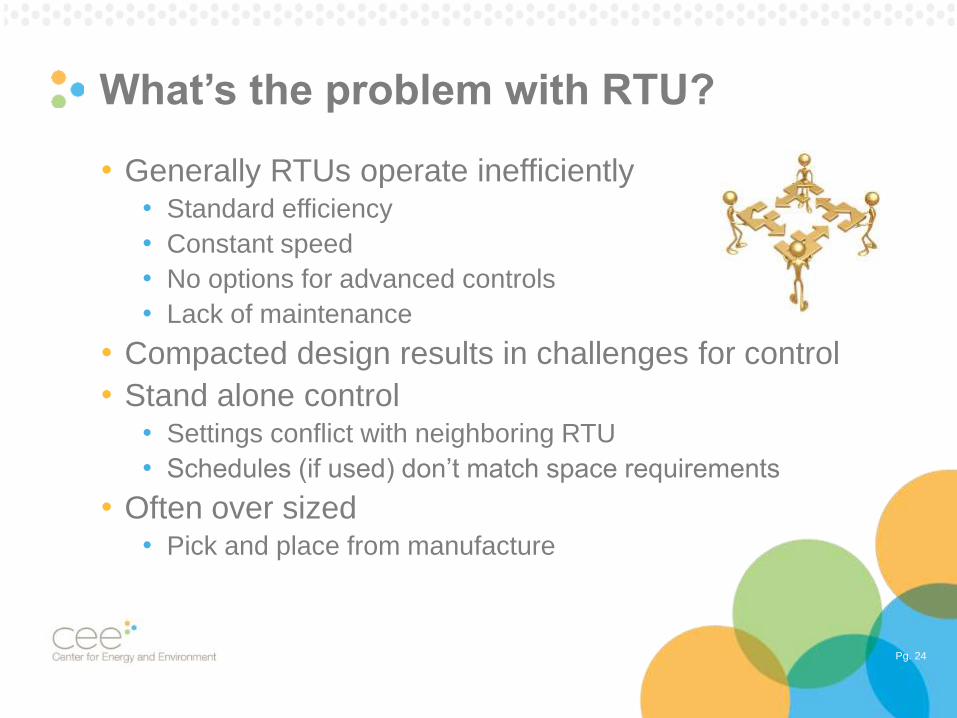
What’s the problem with RTU?
• Generally RTUs operate inefficiently• Standard efficiency
• Constant speed
• No options for advanced controls
• Lack of maintenance
• Compacted design results in challenges for control
• Stand alone control• Settings conflict with neighboring RTU
• Schedules (if used) don’t match space requirements
• Often over sized• Pick and place from manufacture
Pg. 25
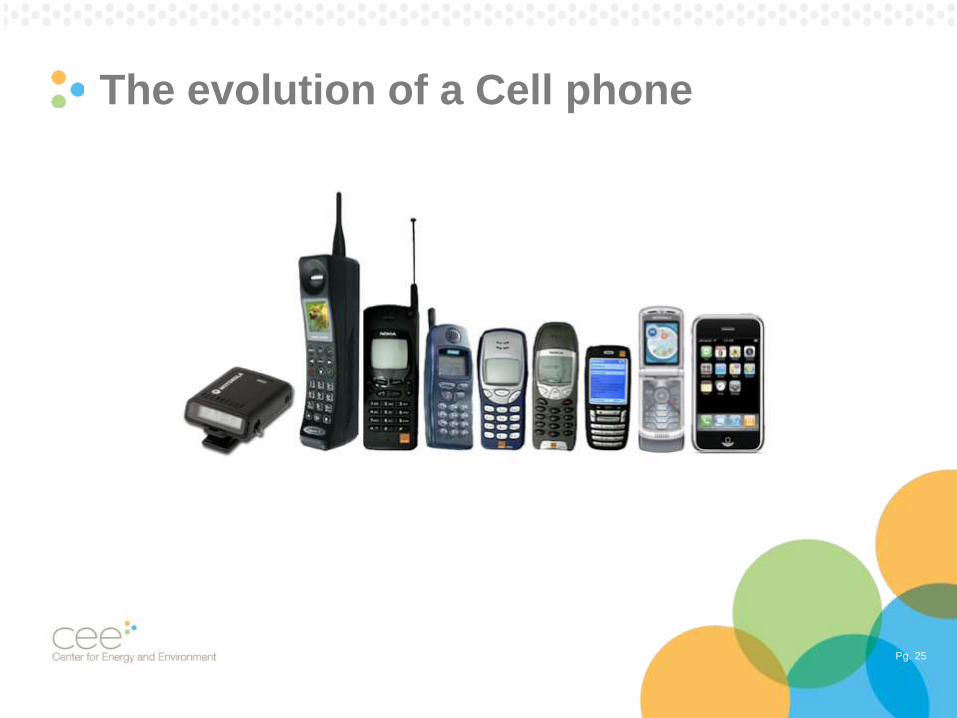
The evolution of a Cell phone
Pg. 26
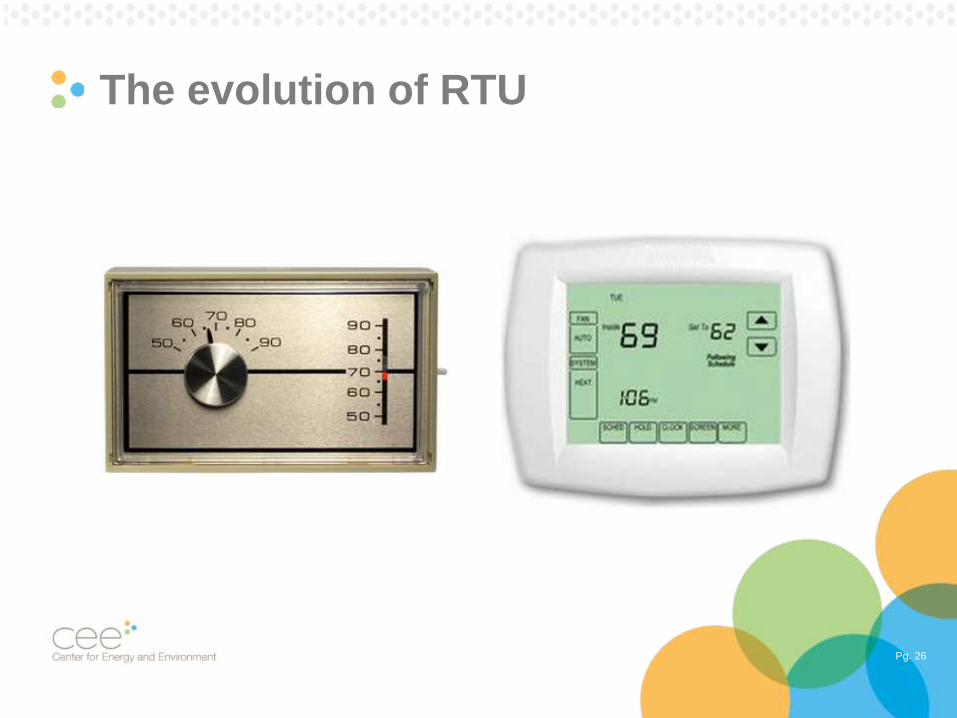
The evolution of RTU
Pg. 27
Current Options for RTU’s
• Replacement
• More efficient components
• Control packages
Pg. 28
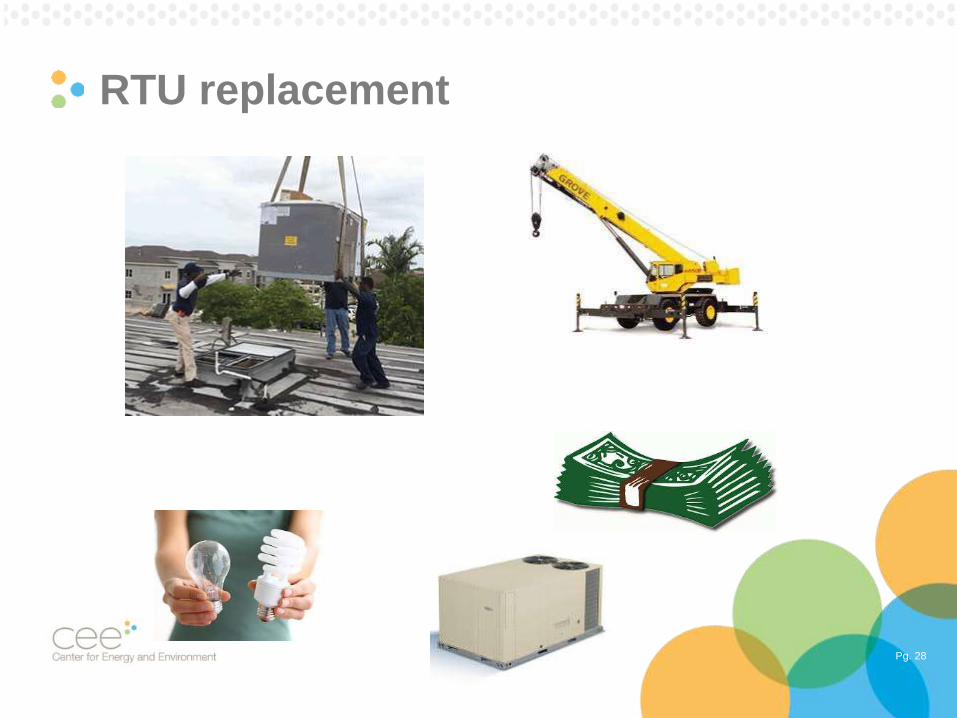
RTU replacement
Pg. 29
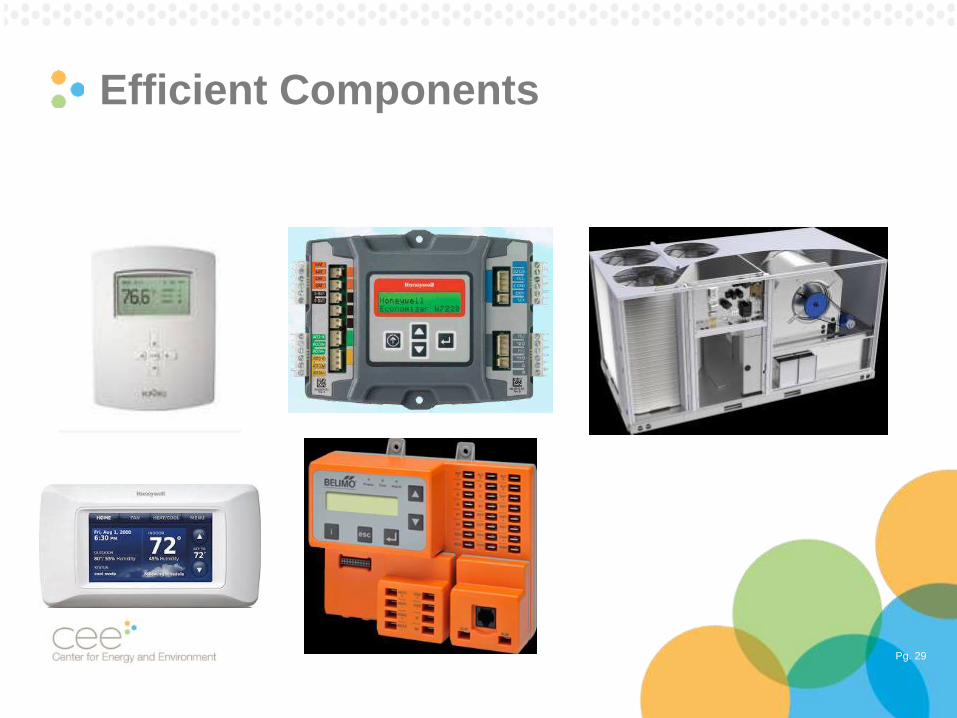
Efficient Components
Pg. 30
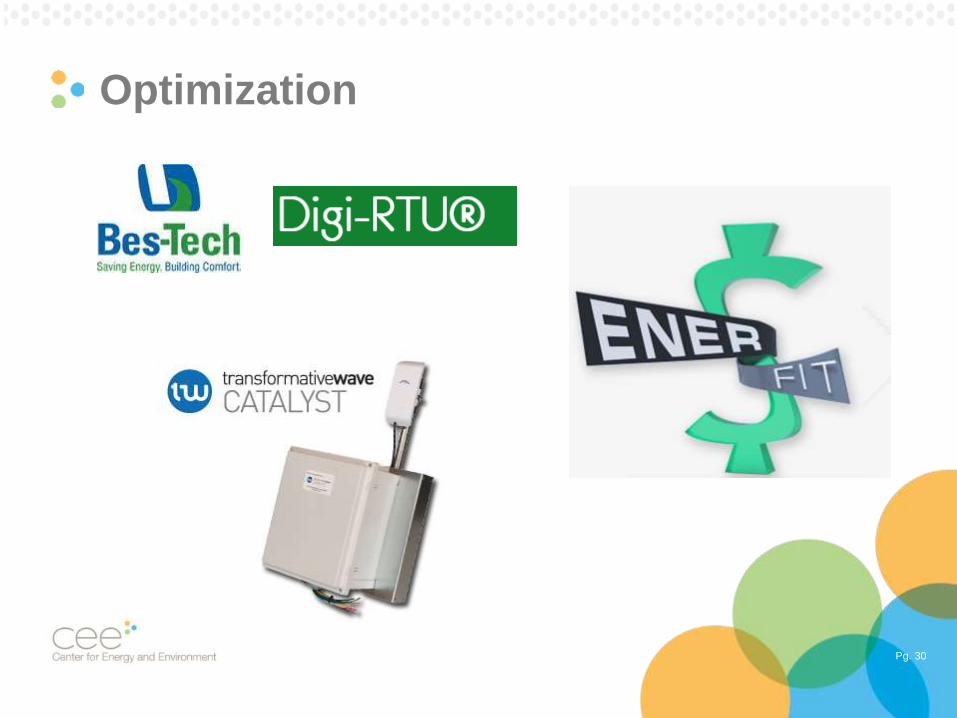
Optimization
Pg. 31
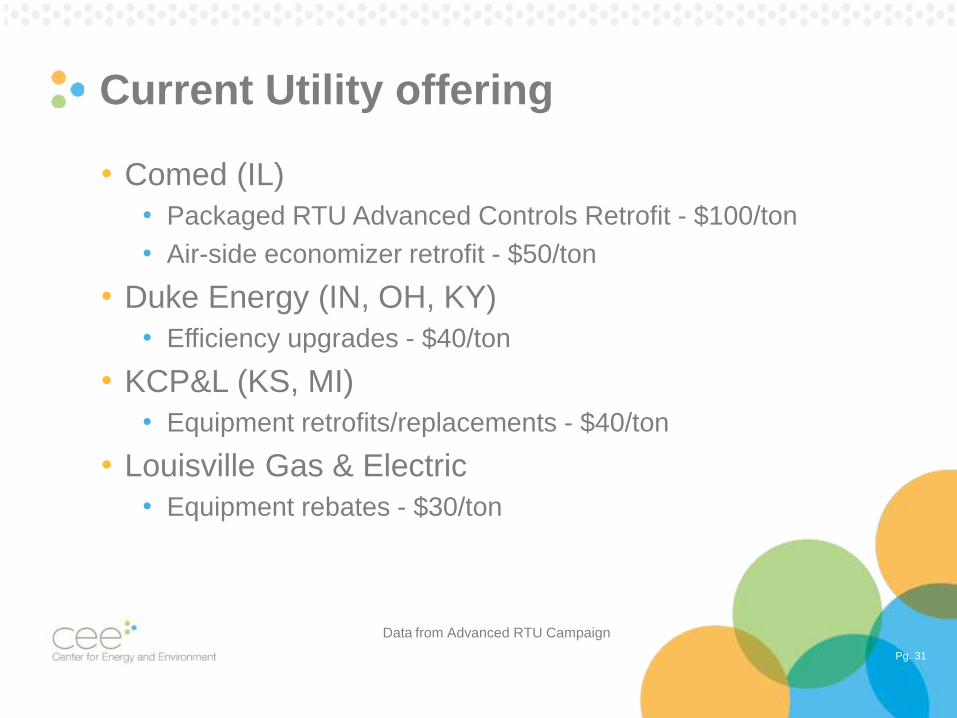
Current Utility offering
• Comed (IL)
• Packaged RTU Advanced Controls Retrofit - $100/ton
• Air-side economizer retrofit - $50/ton
• Duke Energy (IN, OH, KY)
• Efficiency upgrades - $40/ton
• KCP&L (KS, MI)
• Equipment retrofits/replacements - $40/ton
• Louisville Gas & Electric
• Equipment rebates - $30/ton
Data from Advanced RTU Campaign
Pg. 32
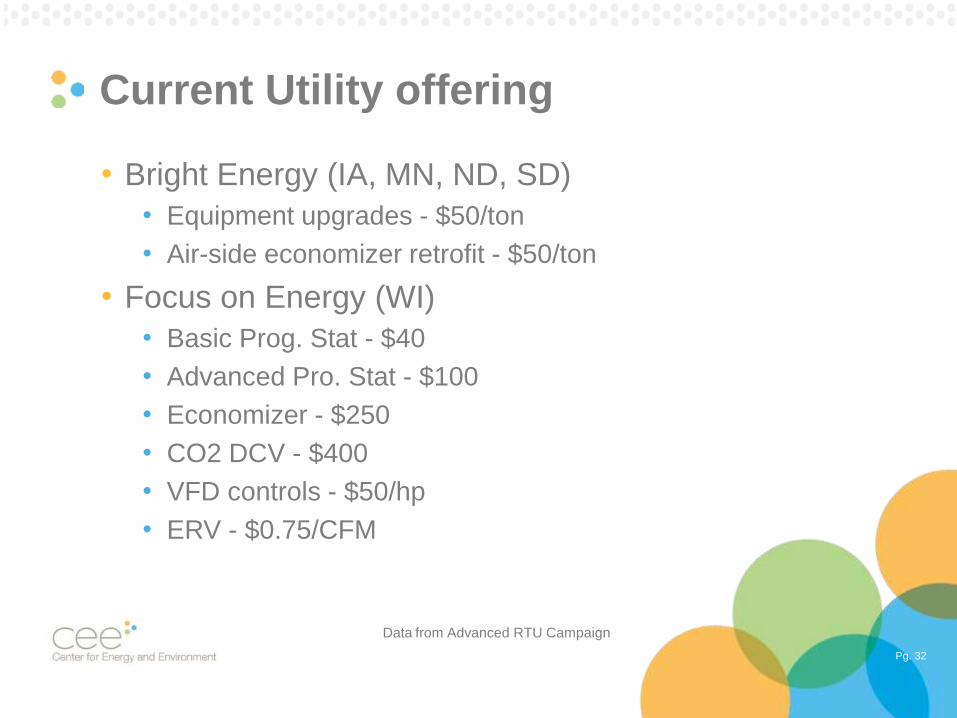
Current Utility offering
• Bright Energy (IA, MN, ND, SD)
• Equipment upgrades - $50/ton
• Air-side economizer retrofit - $50/ton
• Focus on Energy (WI)
• Basic Prog. Stat - $40
• Advanced Pro. Stat - $100
• Economizer - $250
• CO2 DCV - $400
• VFD controls - $50/hp
• ERV - $0.75/CFM
Data from Advanced RTU Campaign
Pg. 33
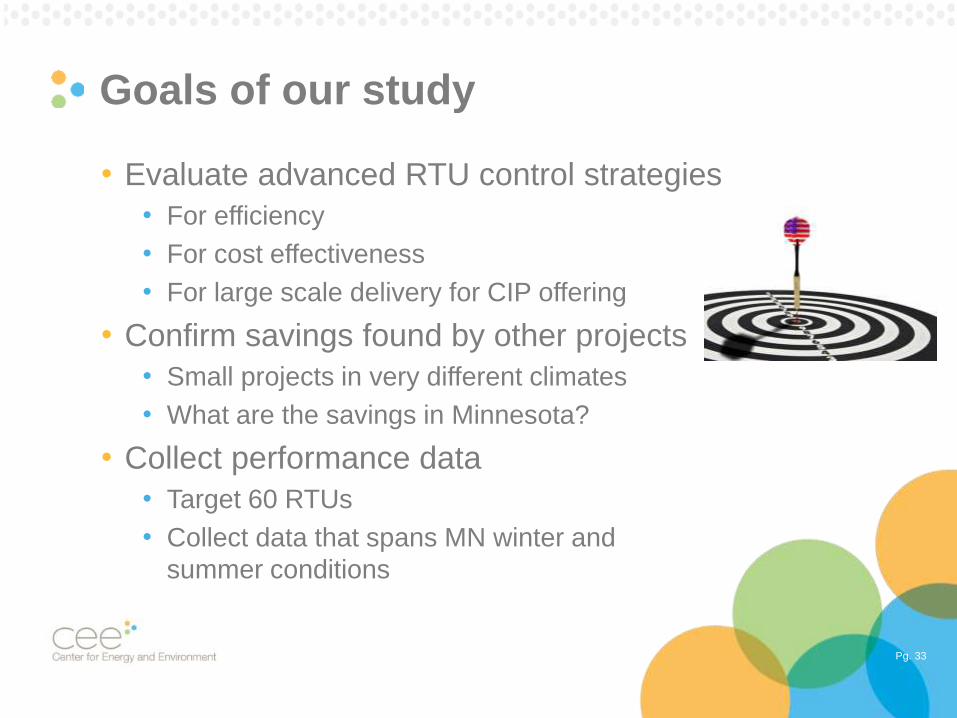
Goals of our study
• Evaluate advanced RTU control strategies
• For efficiency
• For cost effectiveness
• For large scale delivery for CIP offering
• Confirm savings found by other projects
• Small projects in very different climates
• What are the savings in Minnesota?
• Collect performance data
• Target 60 RTUs
• Collect data that spans MN winter and
summer conditions
Pg. 34
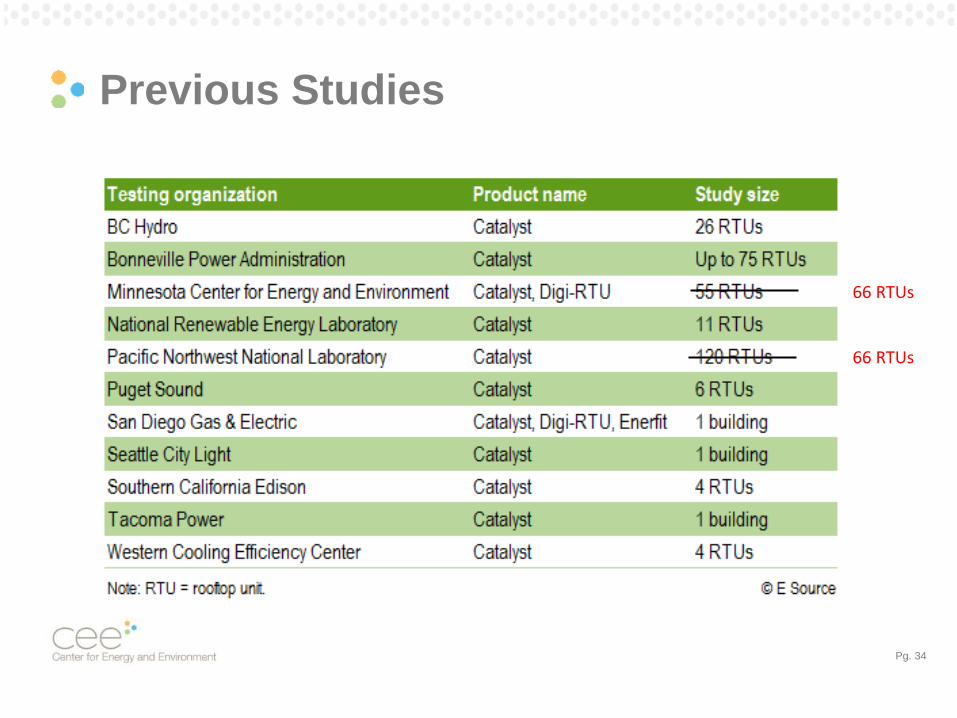
Previous Studies
66 RTUs
66 RTUs
Pg. 35
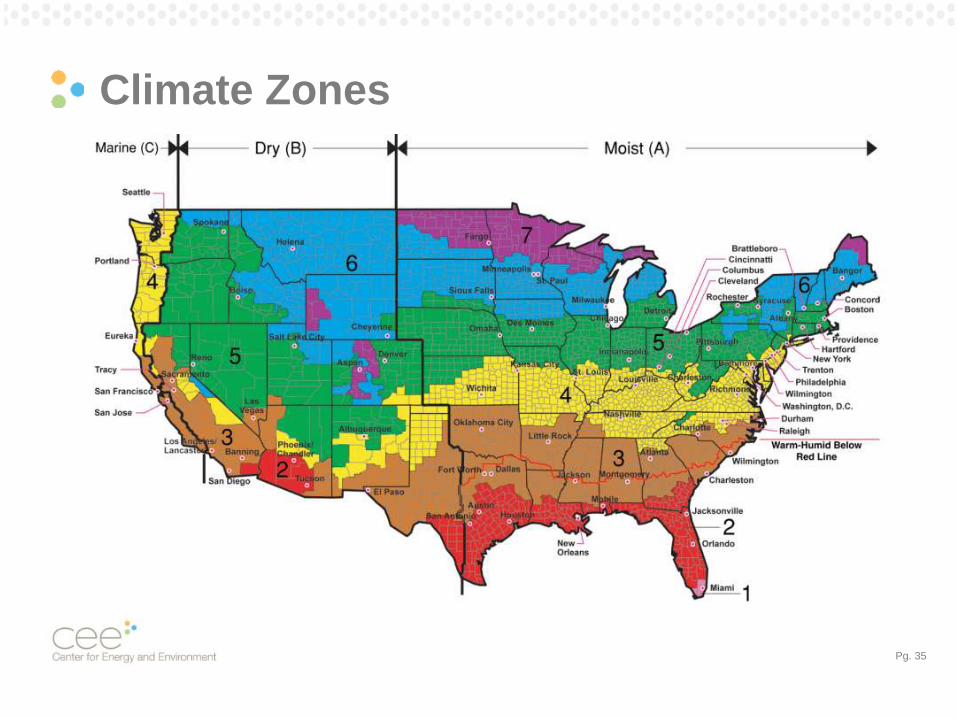
Climate Zones
Pg. 36
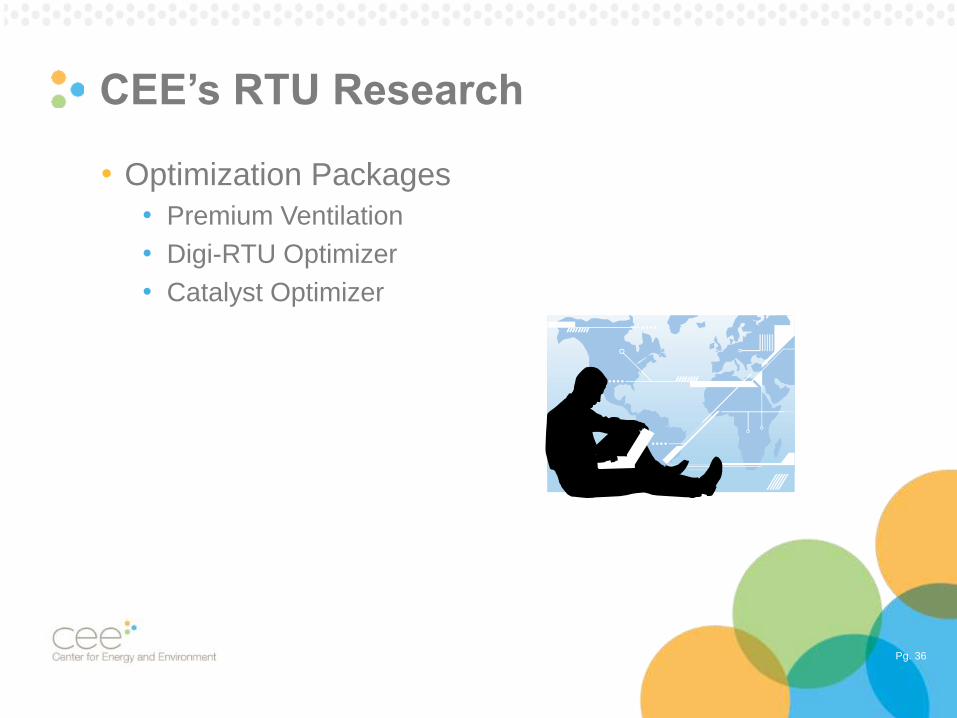
CEE’s RTU Research
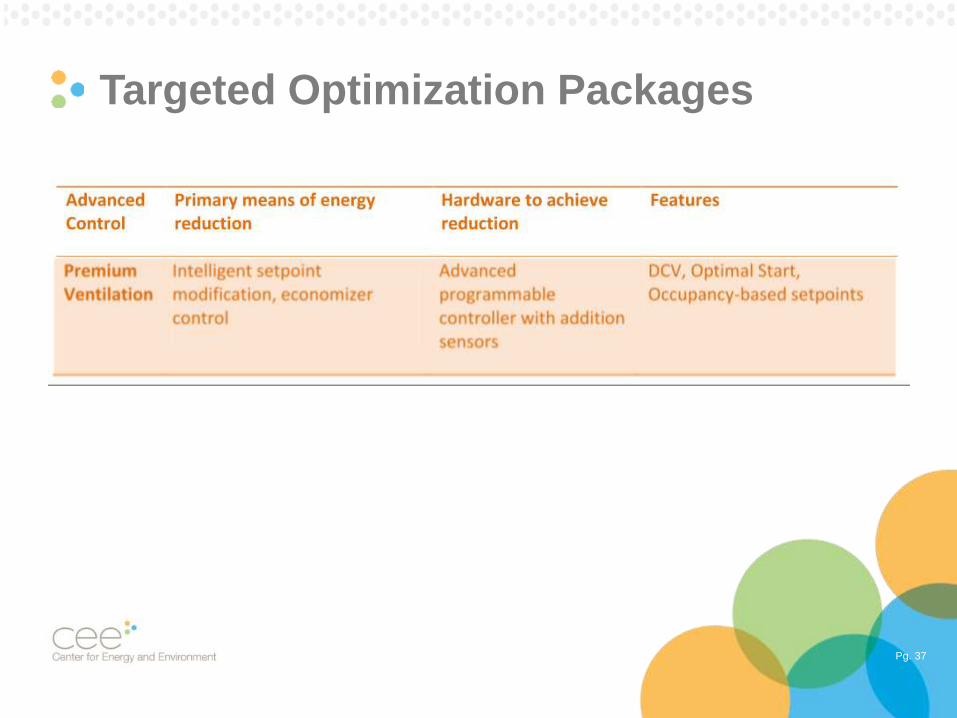
• Optimization Packages
• Premium Ventilation
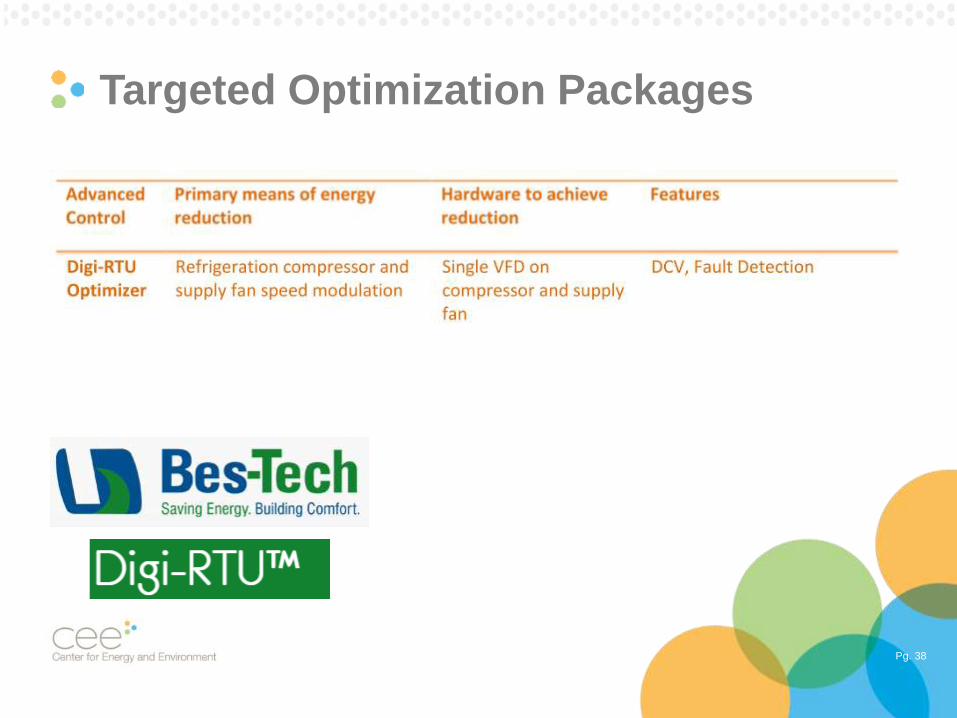
• Digi-RTU Optimizer
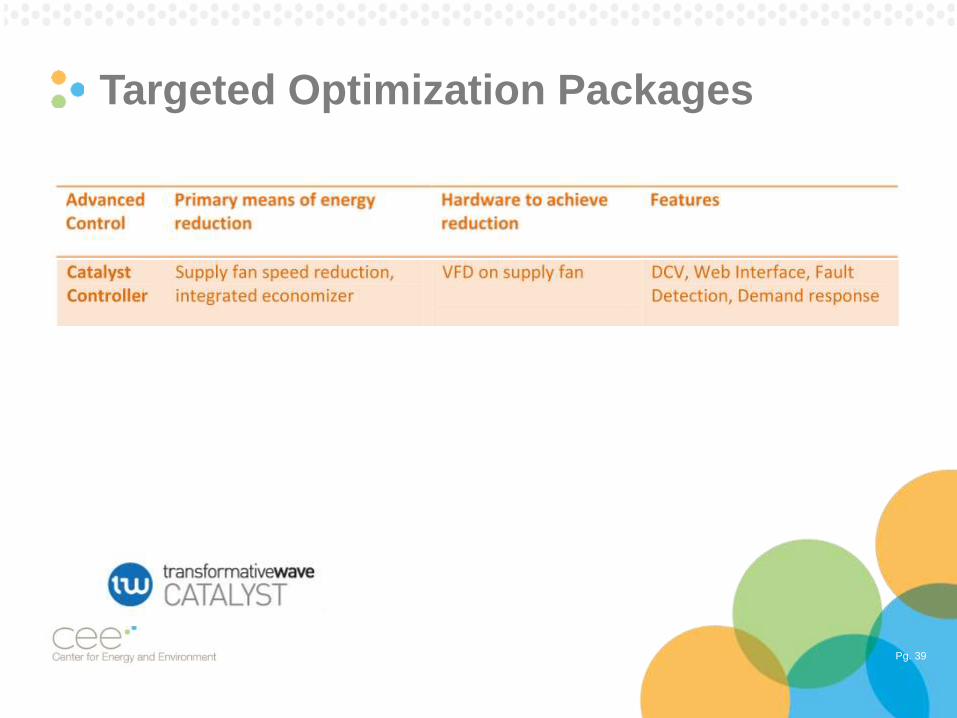
• Catalyst Optimizer
Pg. 37
Targeted Optimization Packages
Pg. 38
Targeted Optimization Packages
Pg. 39
Targeted Optimization Packages
Pg. 40
Analysis
• Primary Objectives
• Estimate electric and gas use with and without optimizers
• Estimate savings from optimizers
• Compare savings between optimizer technologies
• Estimate savings for each site
• Calculate simple payback
• Based in measured data and installed costs
• Develop energy savings calculator
• Secondary Objectives
• Analyze IAQ and indoor comfort with and without
optimizers
Pg. 41
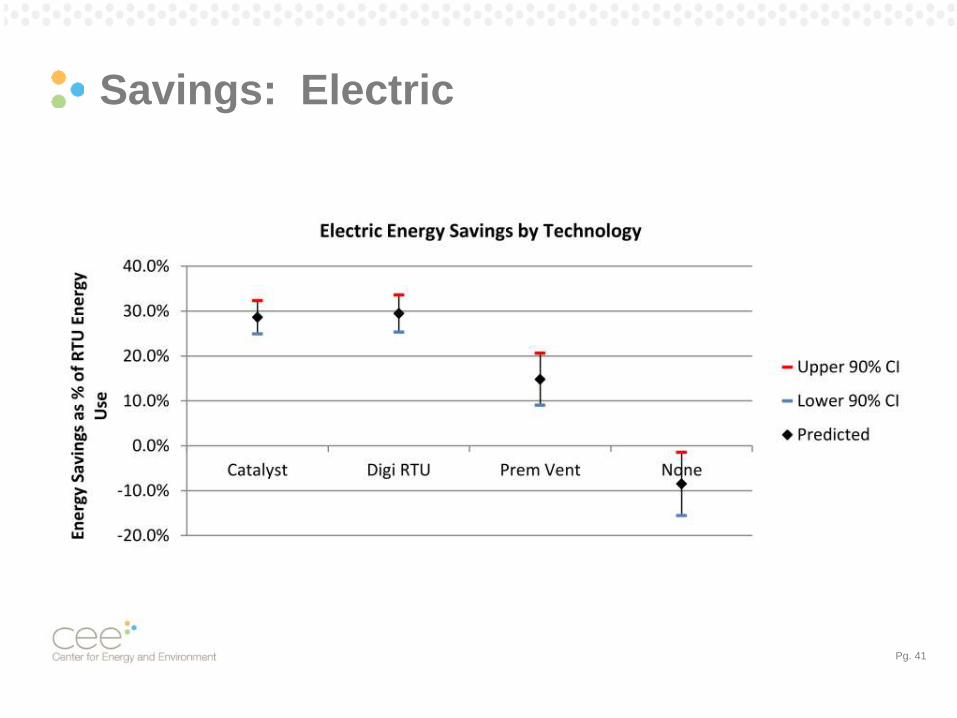
Savings: Electric
Pg. 42
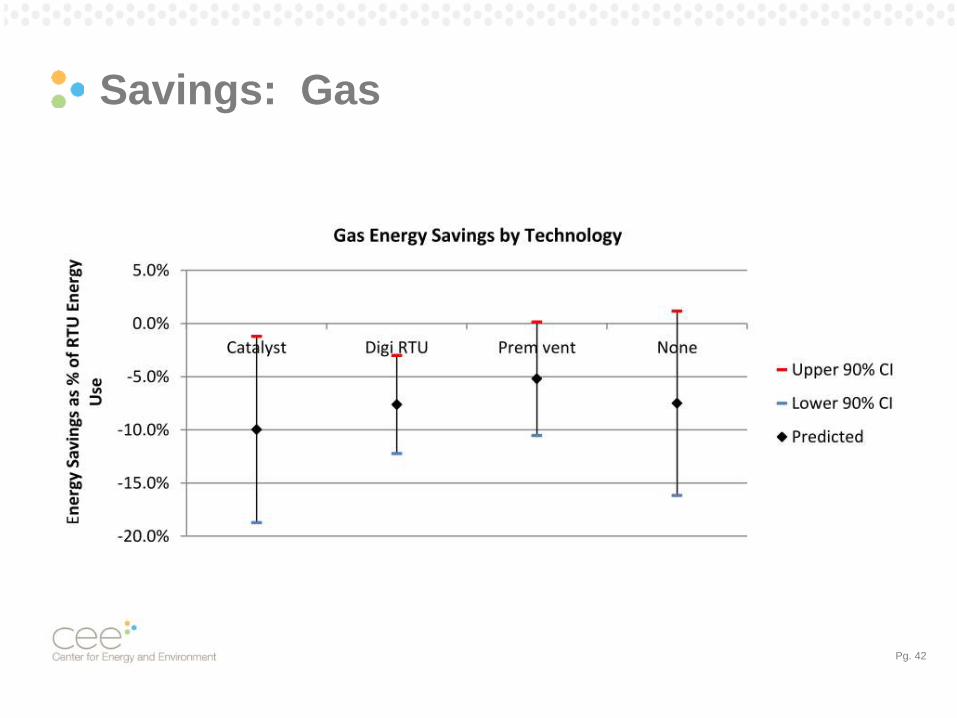
Savings: Gas
Pg. 43
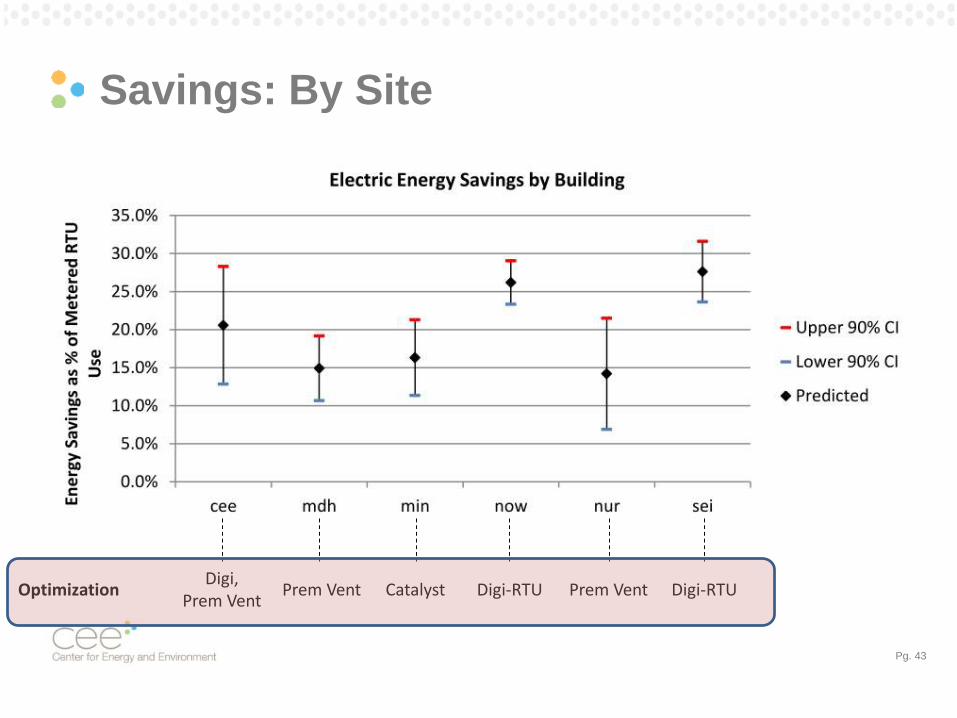
Savings: By Site
Digi,Prem Vent
Prem Vent Catalyst Digi-RTU Prem Vent Digi-RTUOptimization
Pg. 44
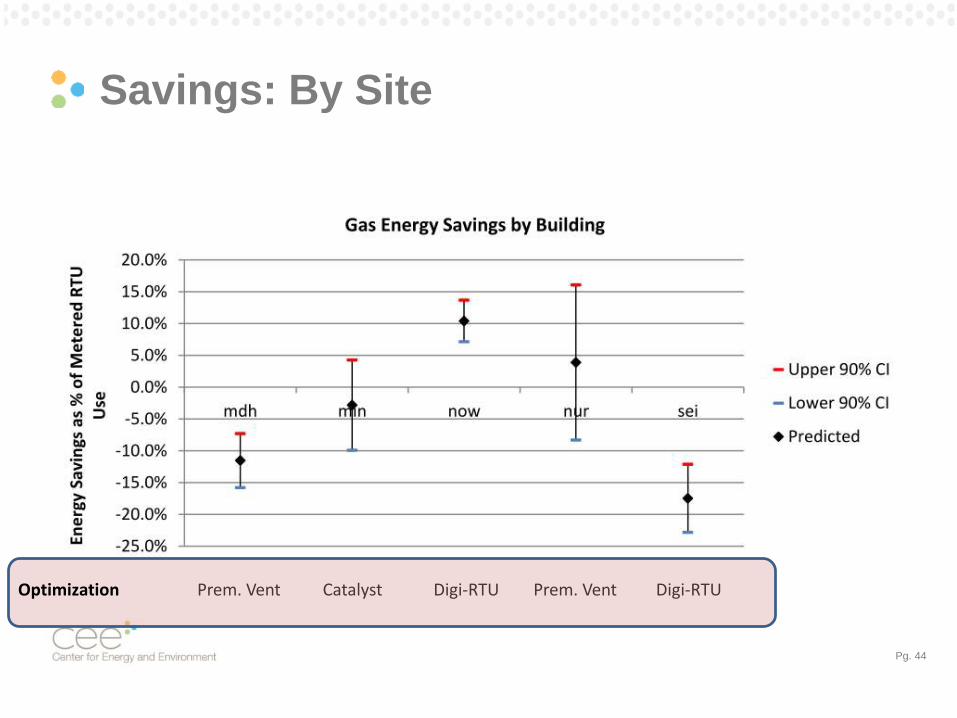
Savings: By Site
Digi-RTU Digi-RTUPrem. VentCatalystPrem. VentOptimization
Pg. 45
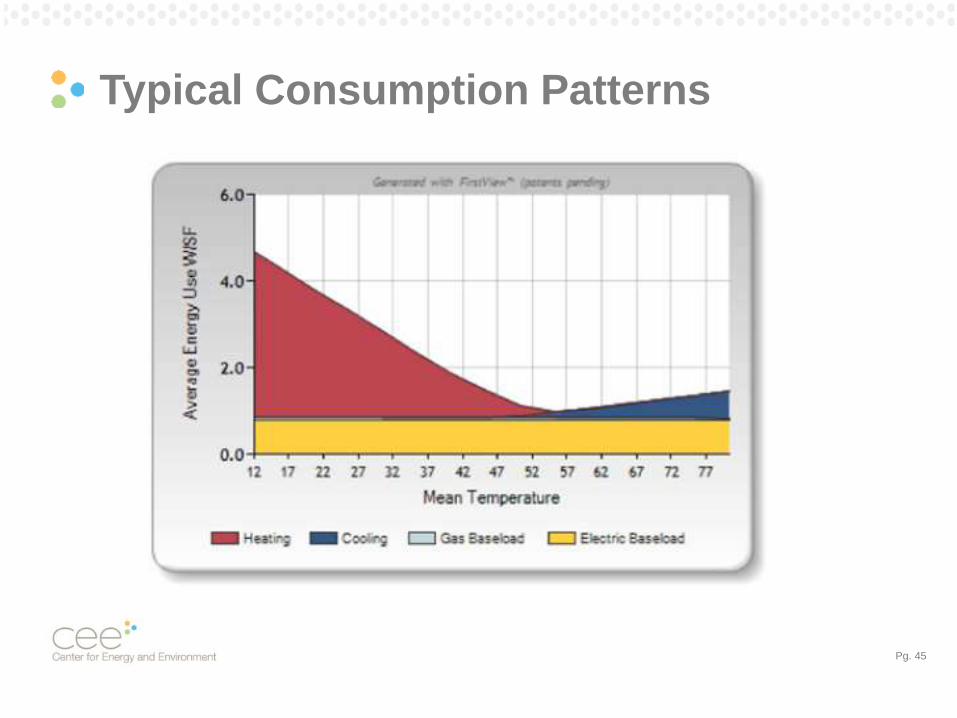
Typical Consumption Patterns
Pg. 46
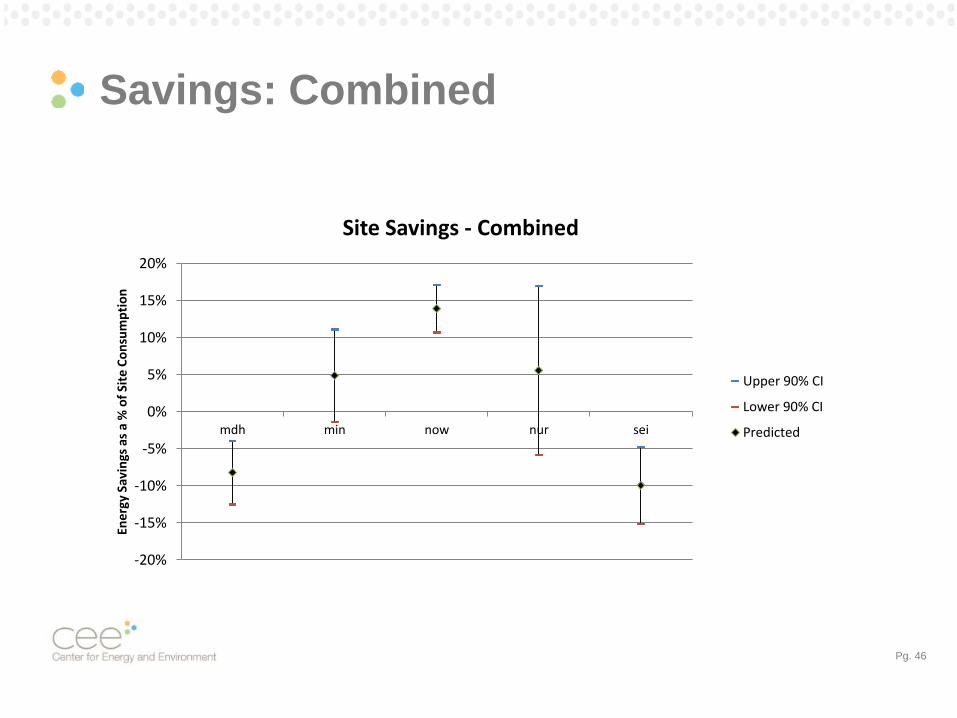
Savings: Combined
-20%
-15%
-10%
-5%
0%
5%
10%
15%
20%
mdh min now nur sei
Ener
gy S
avin
gs a
s a
% o
f Si
te C
on
sum
pti
on
Site Savings - Combined
Upper 90% CI
Lower 90% CI
Predicted
Pg. 47
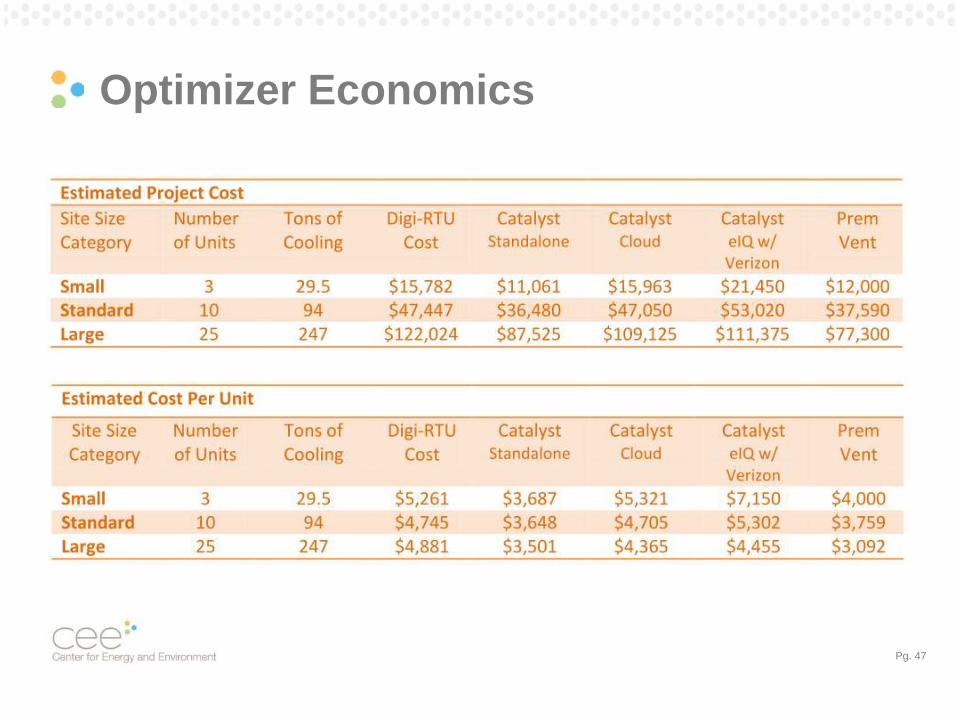
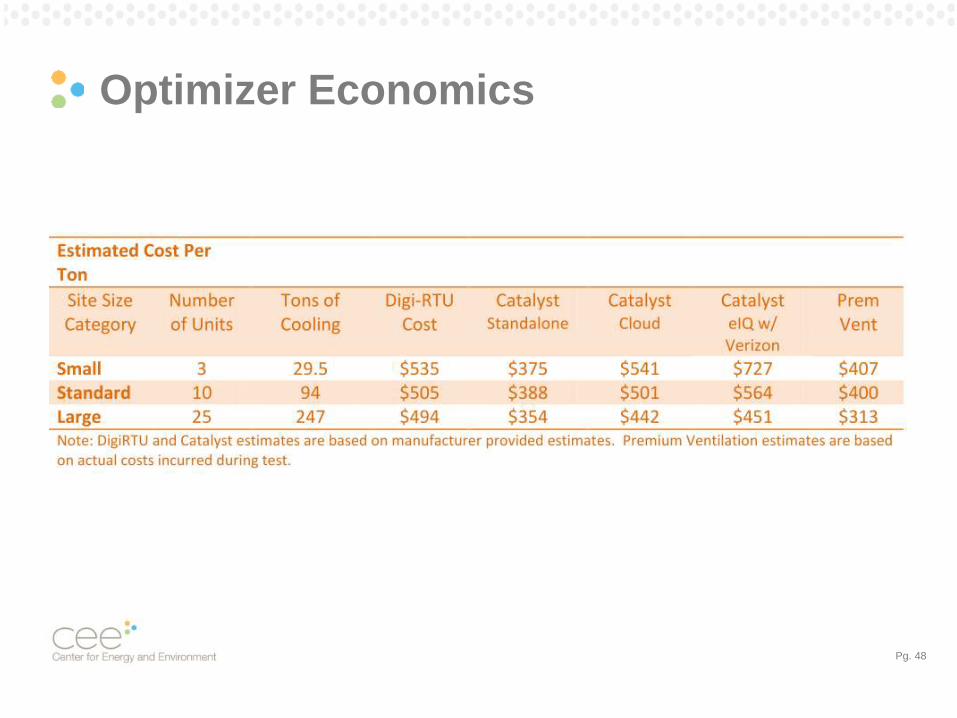
Optimizer Economics
Pg. 48
Optimizer Economics
Pg. 49
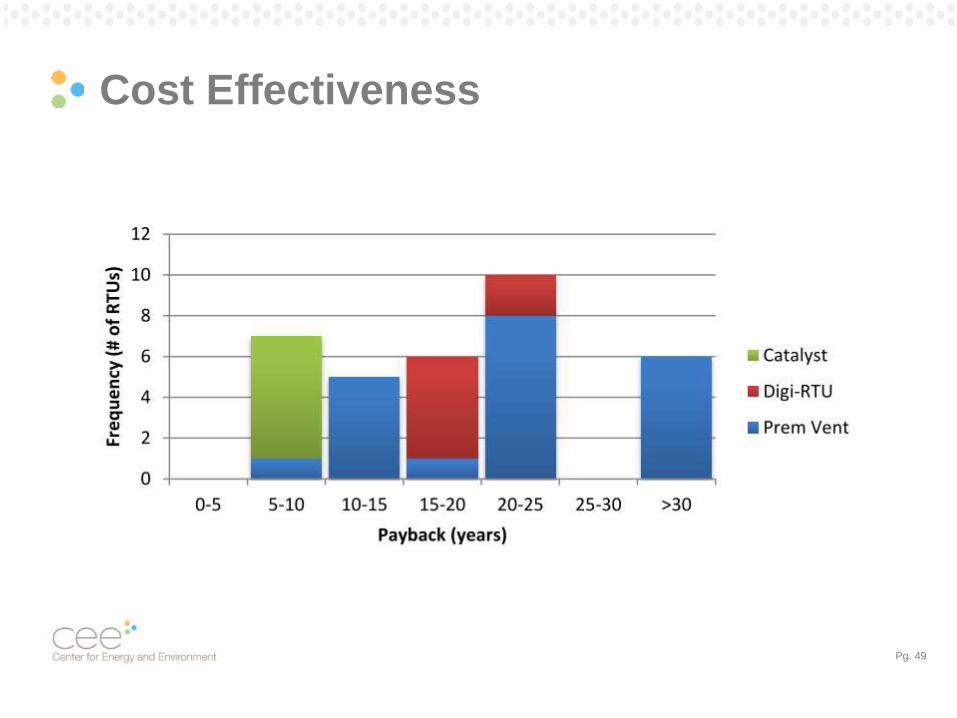
Cost Effectiveness
Pg. 50
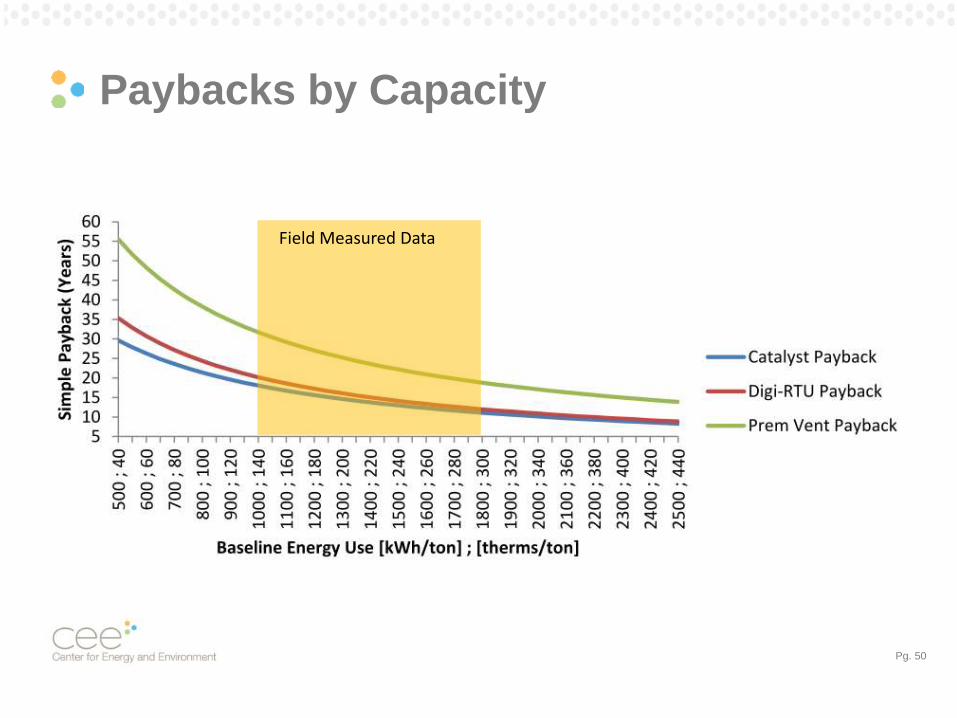
Paybacks by Capacity
Field Measured Data
Pg. 51
Key Findings
• All technologies achieved significant
electric savings
• Gas savings were negative or statistically insignificant
• Savings were highly variable
• Fan settings and minimum OA dampers settings were
not consistent
• Advanced controls did not achieve cost-effective
energy savings
• Larger units with more operation would improve cost
effectiveness
Pg. 52
Key Findings
• Control Units were affected by Optimizers
• Best optimizer for a space depends on situation
• “One size does not fit all”
• Market is rapidly expanding
• New innovation
• Product maturity
• Contractor support critical to success of products
• Products tested had issues with MN Climate (Zone 6)
Center for Energy and Environment
March 25, 2015
Minnesota CARD Grant Energy Research Projects
Dave Bohac P.E. | Director of Research
Ben Schoenbauer| Senior Research Engineer
Russ Landry, P.E. | Senior Mechanical Engineer
Pg. 55
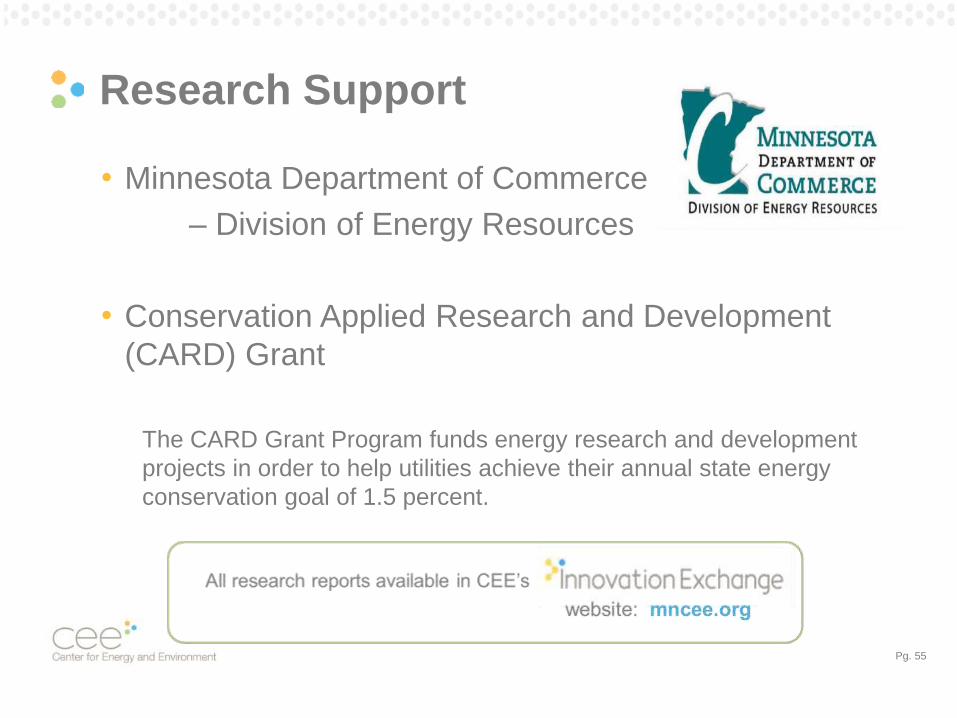
Research Support
• Minnesota Department of Commerce
– Division of Energy Resources
• Conservation Applied Research and Development
(CARD) Grant
The CARD Grant Program funds energy research and development
projects in order to help utilities achieve their annual state energy
conservation goal of 1.5 percent.
Pg. 56
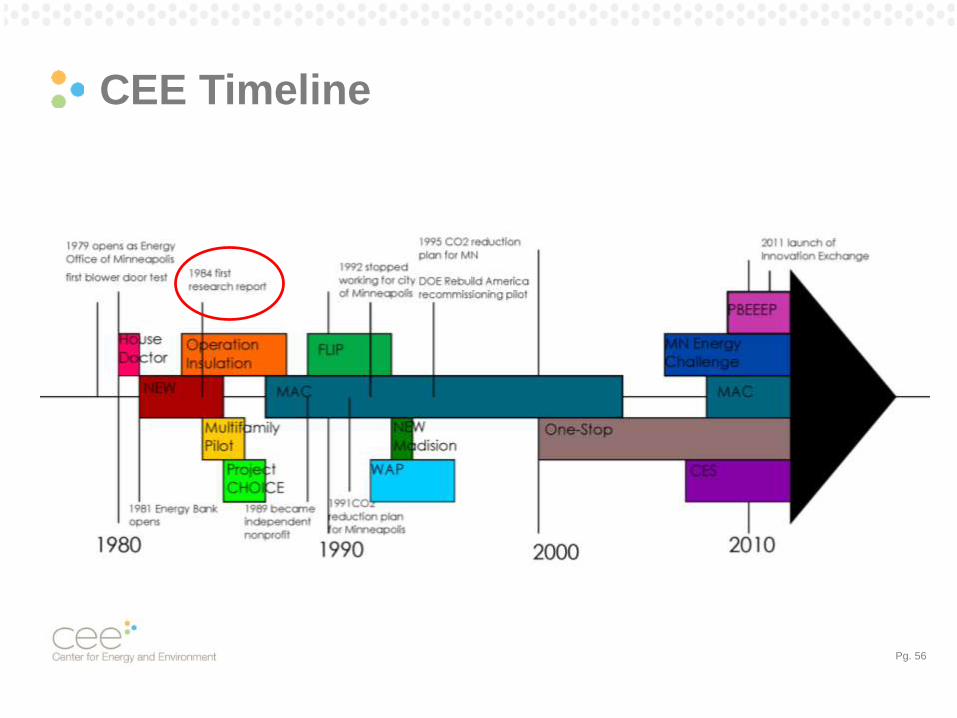
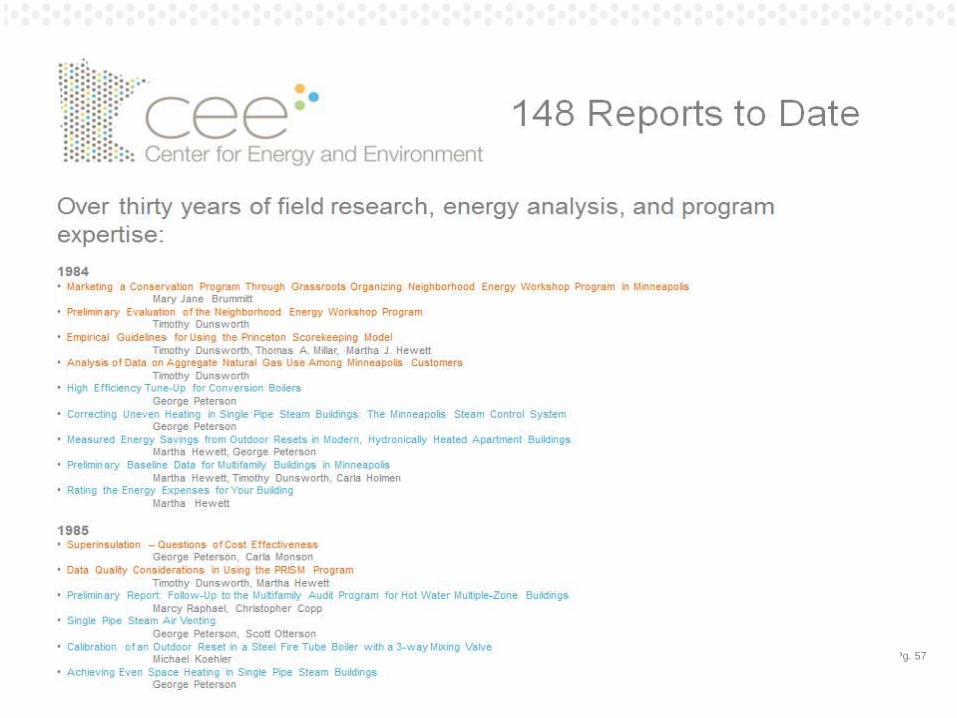
CEE Timeline
Pg. 57
Topics
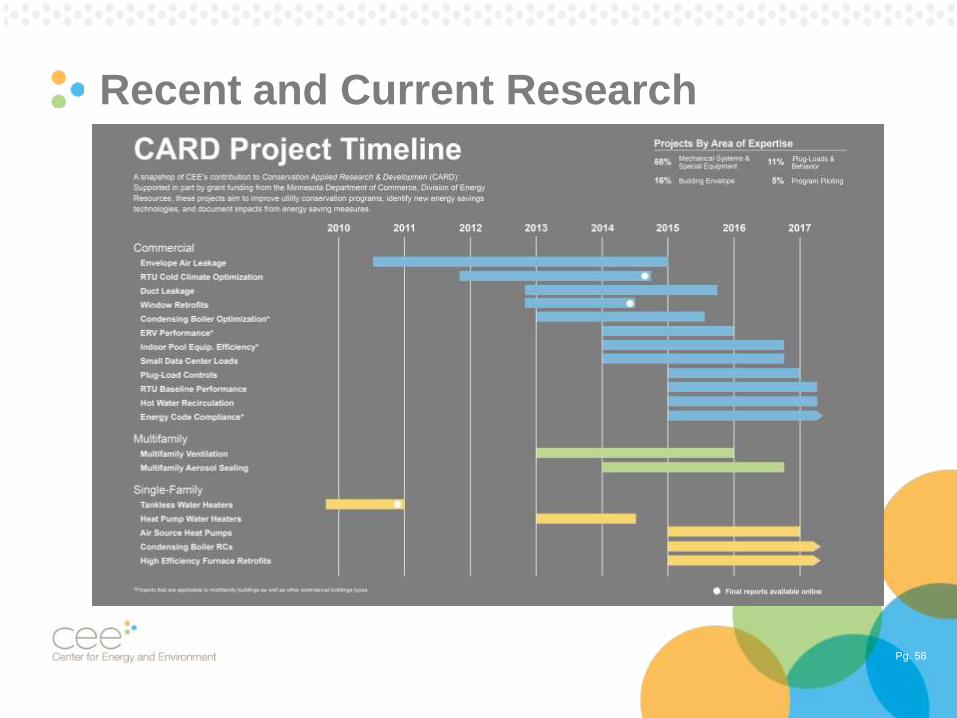
Pg. 58
Recent and Current Research

Multifamily Envelope Aerosol Sealing
Dave Bohac, PE
Director of Research
Center for Energy and Environment
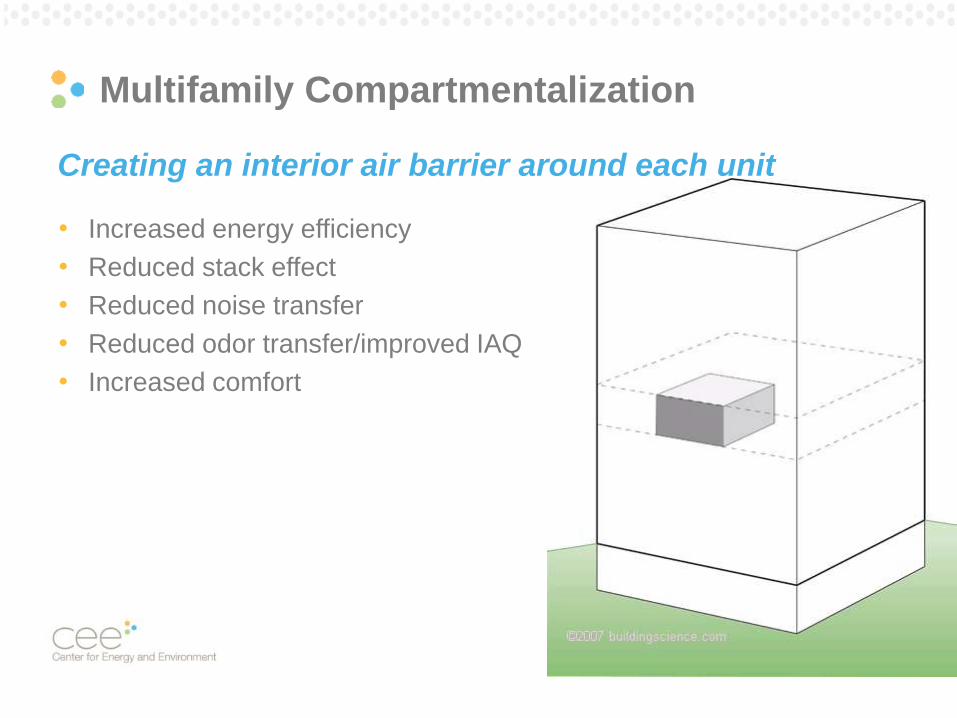
Creating an interior air barrier around each unit
Multifamily Compartmentalization
• Increased energy efficiency
• Reduced stack effect
• Reduced noise transfer
• Reduced odor transfer/improved IAQ
• Increased comfort
Pg. 61
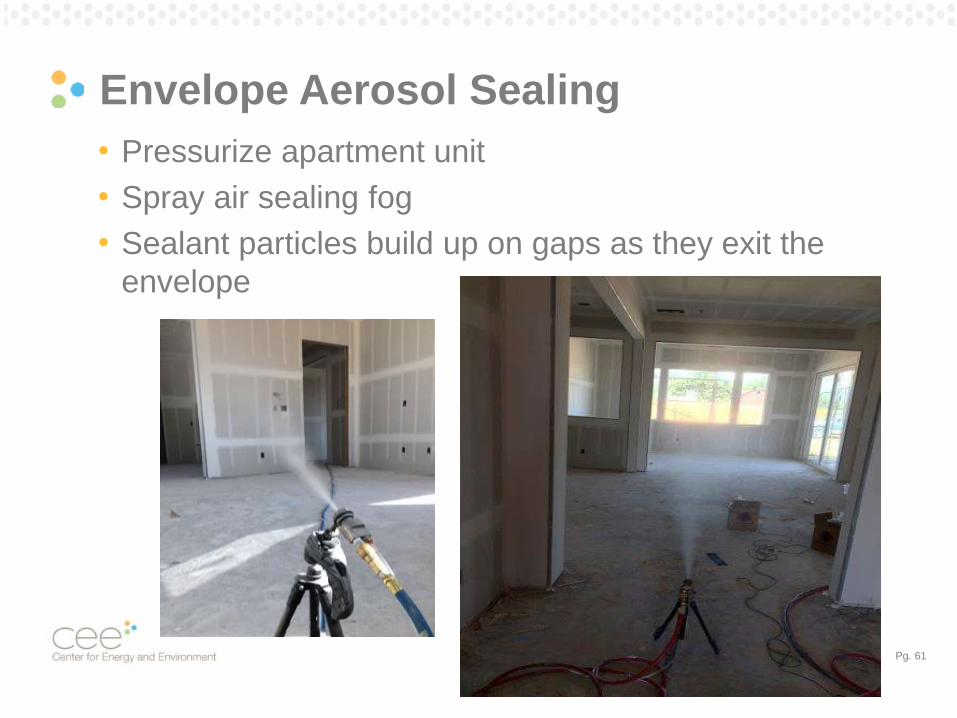
Envelope Aerosol Sealing
• Pressurize apartment unit
• Spray air sealing fog
• Sealant particles build up on gaps as they exit the
envelope
Pg. 62
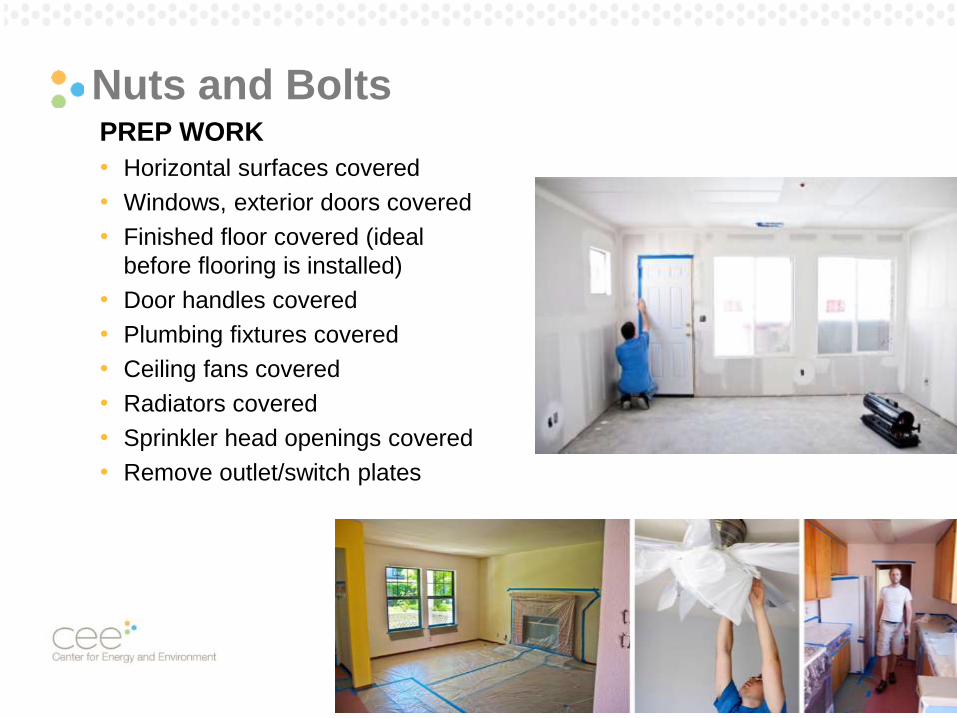
Nuts and BoltsPREP WORK
• Horizontal surfaces covered
• Windows, exterior doors covered
• Finished floor covered (ideal
before flooring is installed)
• Door handles covered
• Plumbing fixtures covered
• Ceiling fans covered
• Radiators covered
• Sprinkler head openings covered
• Remove outlet/switch plates
Pg. 63
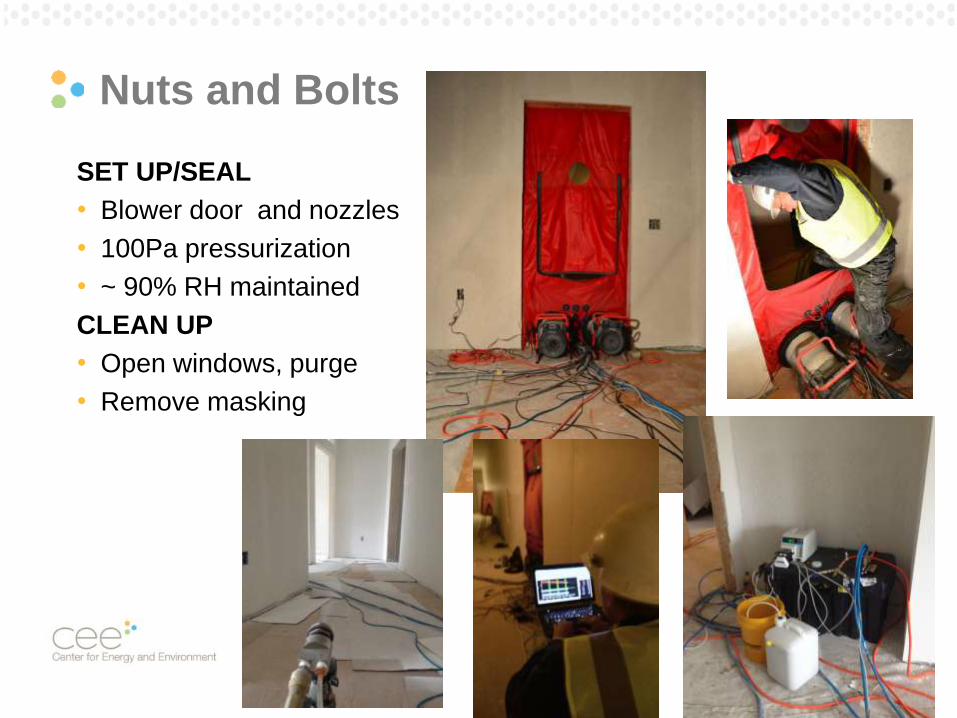
Nuts and Bolts
SET UP/SEAL
• Blower door and nozzles
• 100Pa pressurization
• ~ 90% RH maintained
CLEAN UP
• Open windows, purge
• Remove masking

How does it work???
Pg. 65
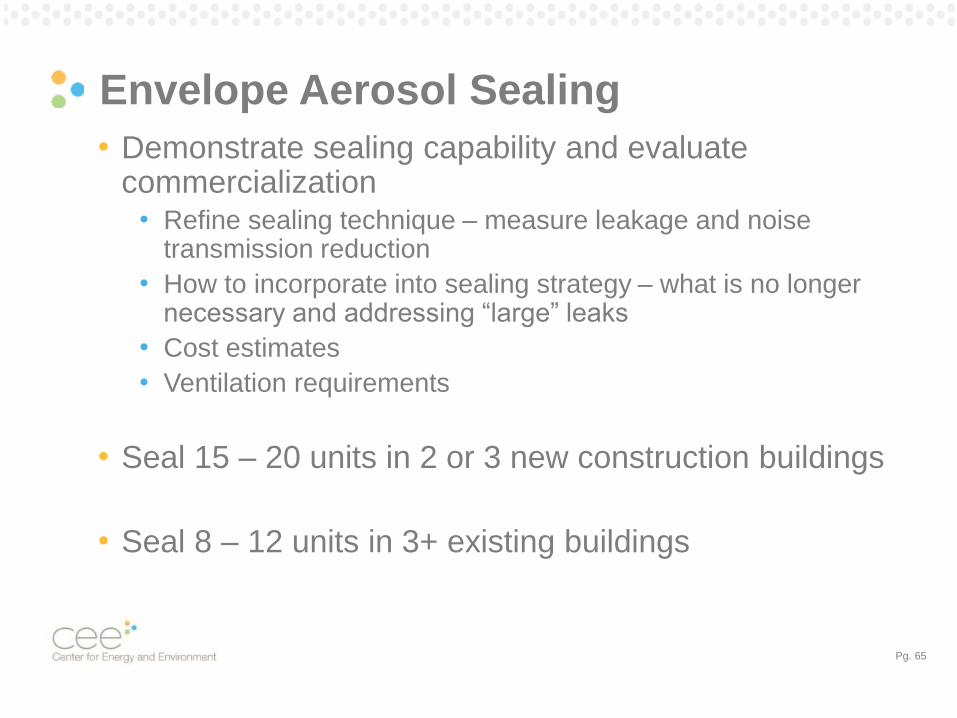
Envelope Aerosol Sealing
• Demonstrate sealing capability and evaluate commercialization
• Refine sealing technique – measure leakage and noise transmission reduction
• How to incorporate into sealing strategy – what is no longer necessary and addressing “large” leaks
• Cost estimates
• Ventilation requirements
• Seal 15 – 20 units in 2 or 3 new construction buildings
• Seal 8 – 12 units in 3+ existing buildings
Pg. 66
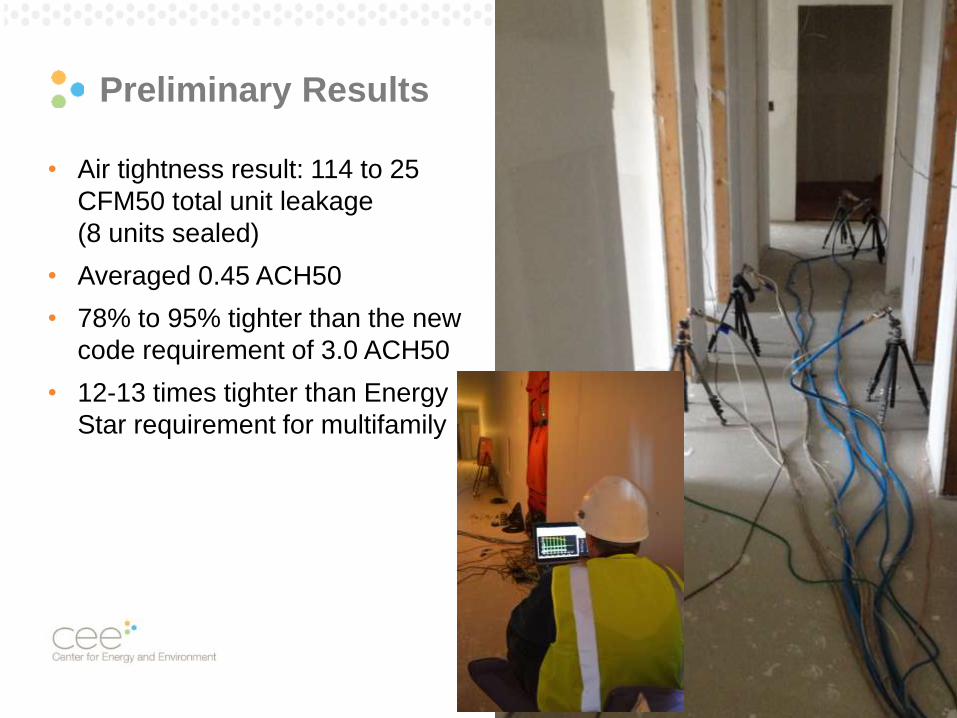
Preliminary Results
• Air tightness result: 114 to 25
CFM50 total unit leakage
(8 units sealed)
• Averaged 0.45 ACH50
• 78% to 95% tighter than the new
code requirement of 3.0 ACH50
• 12-13 times tighter than Energy
Star requirement for multifamily
Pg. 67
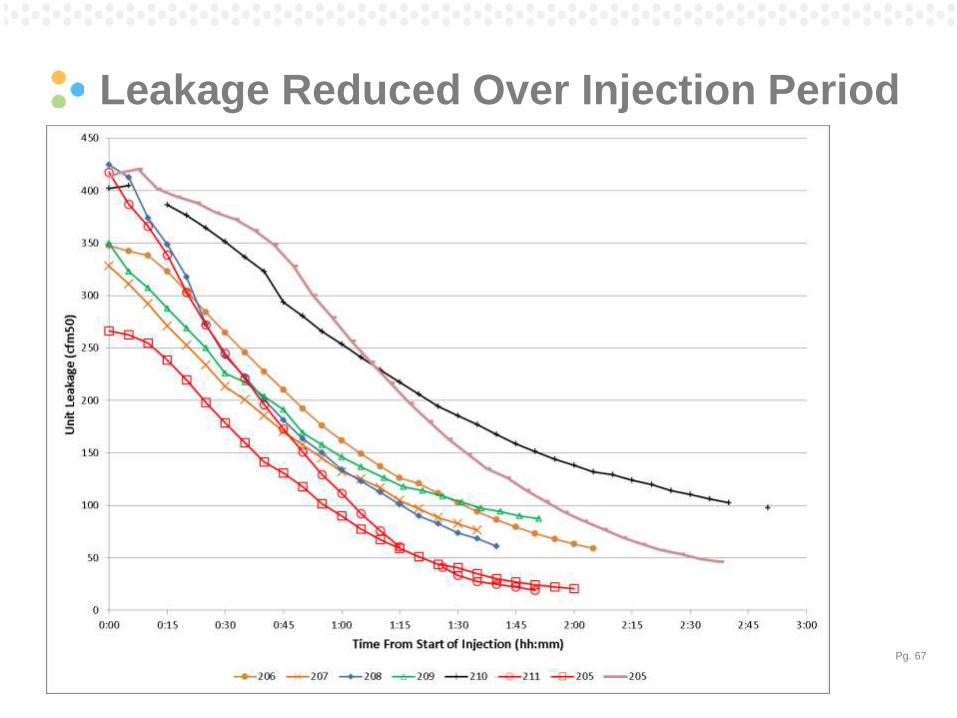
Leakage Reduced Over Injection Period
Pg. 68
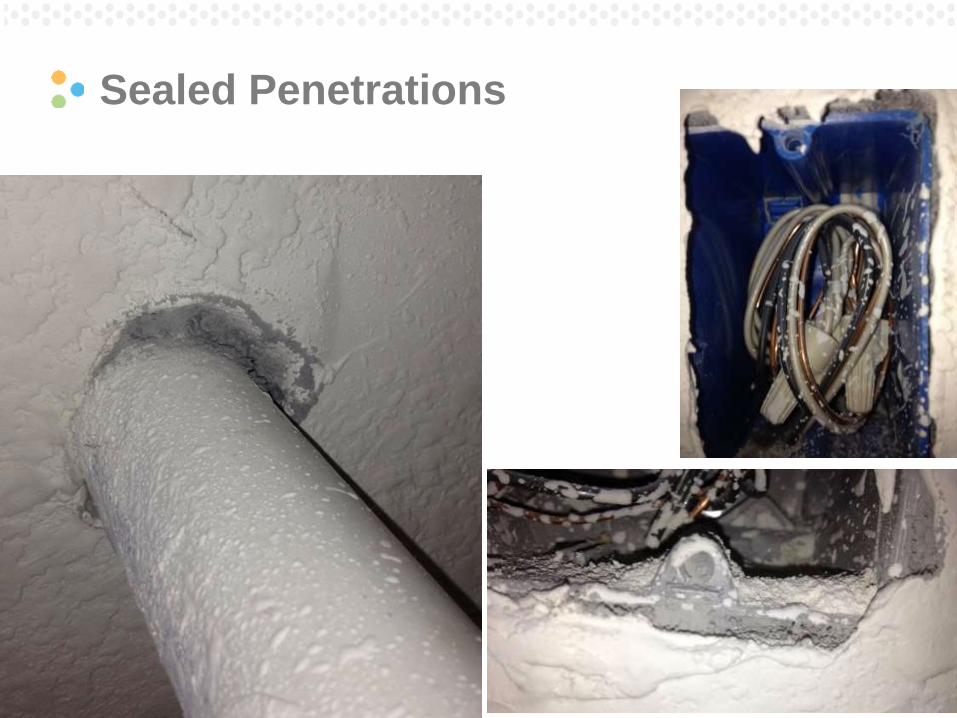
Sealed Penetrations
Pg. 69
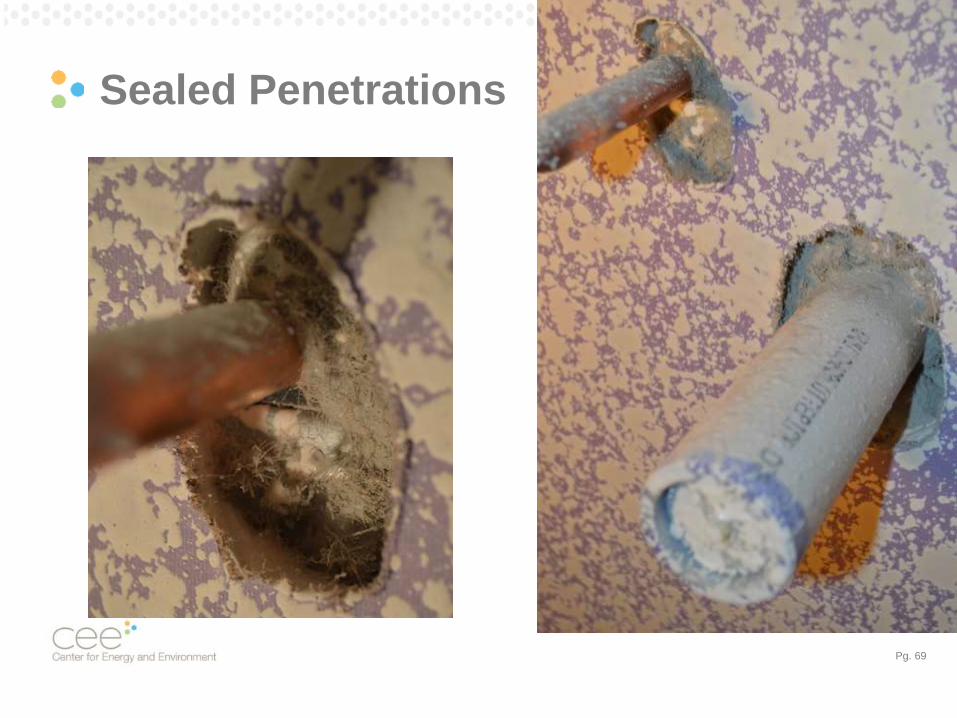
Sealed Penetrations
Pg. 70
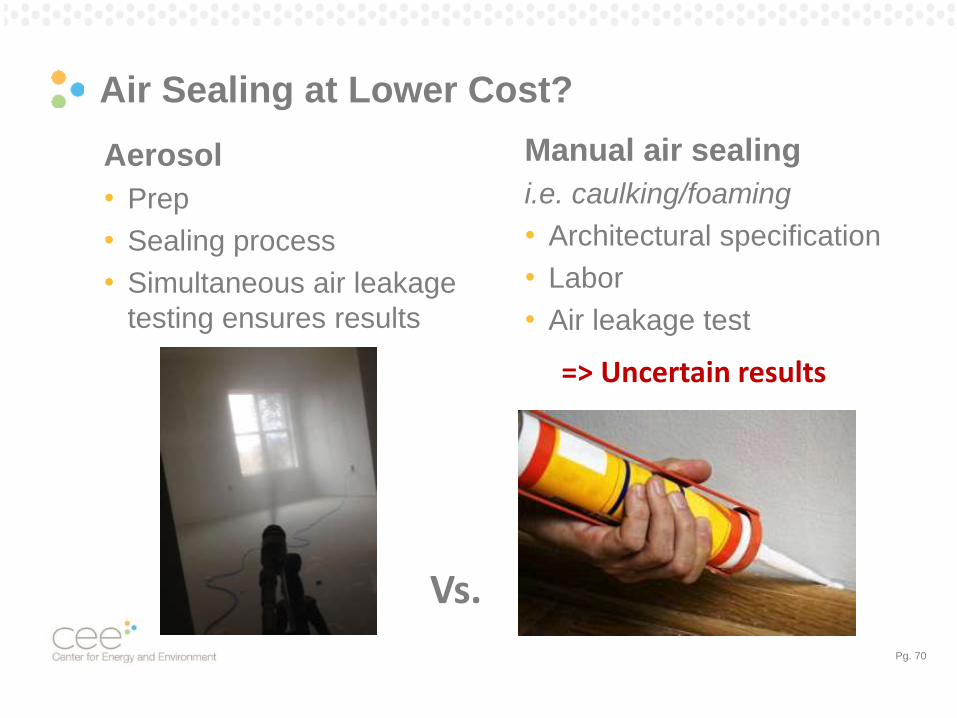
Air Sealing at Lower Cost?
Aerosol
• Prep
• Sealing process
• Simultaneous air leakage
testing ensures results
Manual air sealing
i.e. caulking/foaming
• Architectural specification
• Labor
• Air leakage test
=> Uncertain results
Vs.
Pg. 71
Identifying the Opportunity
NOT IDEAL
• Where carpet is
installed
• If occupied
IDEAL
CANDIDATES
• New construction
• Moderate rehabs
“floors and cabinets”
Pg. 72
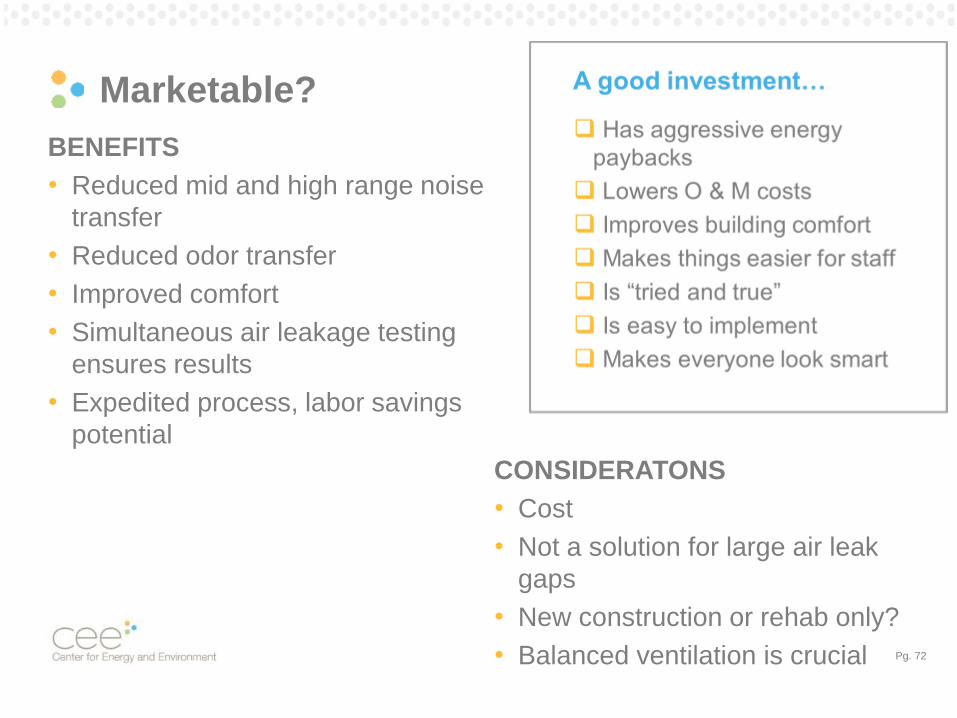
Marketable?
BENEFITS
• Reduced mid and high range noise
transfer
• Reduced odor transfer
• Improved comfort
• Simultaneous air leakage testing
ensures results
• Expedited process, labor savings
potential
CONSIDERATONS
• Cost
• Not a solution for large air leak
gaps
• New construction or rehab only?
• Balanced ventilation is crucial
Pg. 73
Stay Tuned
Study will look at :
• 6 test sites; new construction and rehabs in MN
• Enabling commercialization of process
• Air leakage reductions
• Sound attenuation
• ID leak site locations with fluorescent dye/black light
photography
• Evaluation of time and materials required

Dave Bohac | [email protected]

Cold Climate Air Source Heat Pumps
Ben Schoenbauer
March 26, 2015
Field Assessment
Pg. 76
Research Support
• Minnesota Department of Commerce
– Division of Energy Resources
• Conservation Applied Research and Development
(CARD) Grant
The CARD Grant Program funds energy research and development
projects in order to help utilities achieve their annual state energy
conservation goal of 1.5 percent.
• Grants are awarded annually through an RFP process
Pg. 77
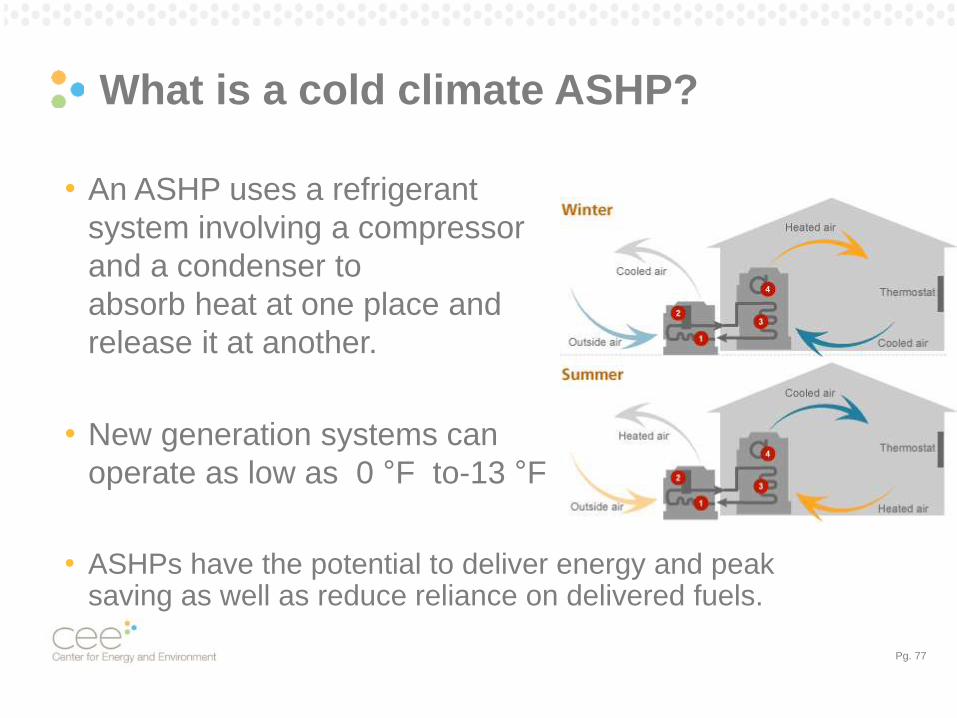
What is a cold climate ASHP?
• An ASHP uses a refrigerant
system involving a compressor
and a condenser to
absorb heat at one place and
release it at another.
• New generation systems can
operate as low as 0 °F to-13 °F
• ASHPs have the potential to deliver energy and peak saving as well as reduce reliance on delivered fuels.
Pg. 78
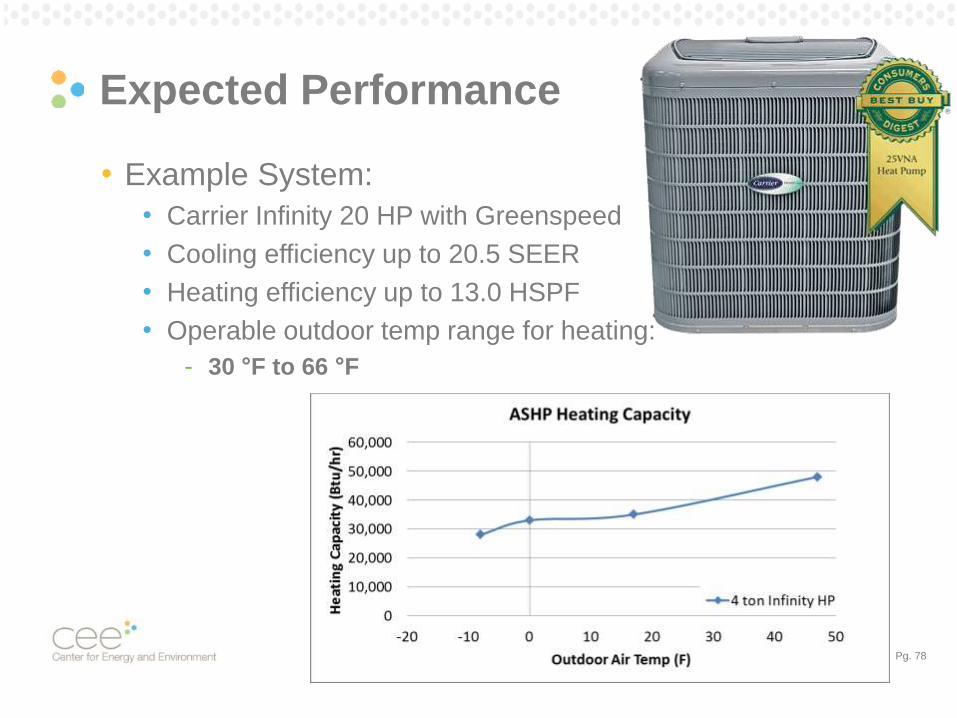
Expected Performance
• Example System:
• Carrier Infinity 20 HP with Greenspeed
• Cooling efficiency up to 20.5 SEER
• Heating efficiency up to 13.0 HSPF
• Operable outdoor temp range for heating:
- 30 °F to 66 °F
Pg. 79
Project Overview:
• Market Assessment [Now to July ‘15]
• Equipment
• Potential Housing Stock
• Field Monitoring [Aug 2015 to Aug 2016]
• Install 5-8 Systems
• Monitor
• Alternating between ASHP and traditional system
• Data Analysis [Aug 2015 to Sep2016]
• CIP Integration & Delivered Fuels [Now to Jul 2016]
• Final Report [Due Dec 2016]
Pg. 80
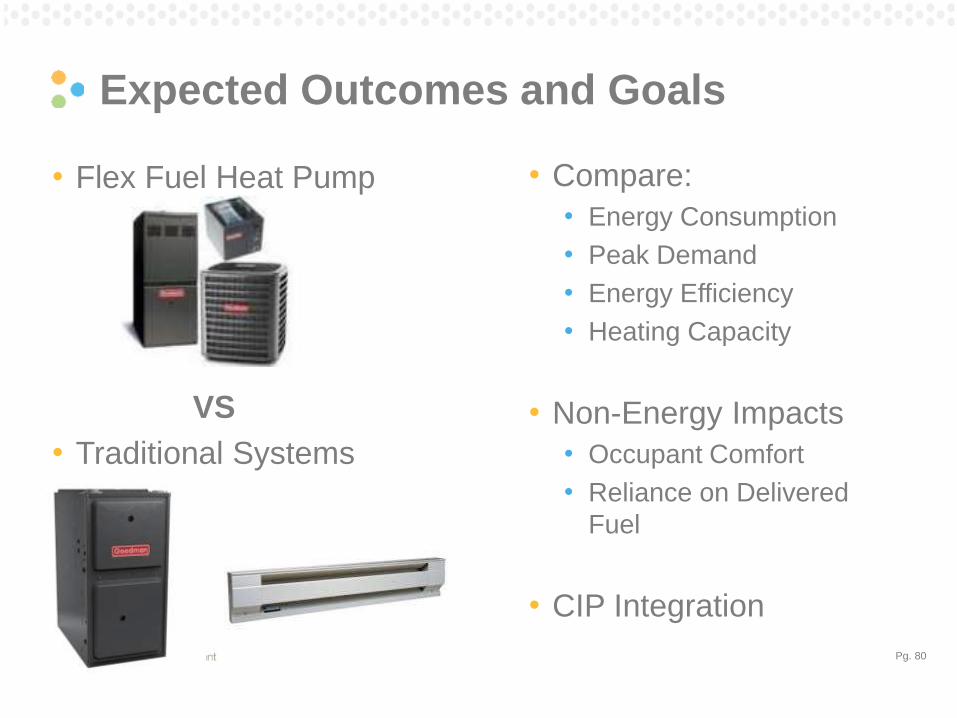
Expected Outcomes and Goals
• Flex Fuel Heat Pump
VS
• Traditional Systems
• Compare:
• Energy Consumption
• Peak Demand
• Energy Efficiency
• Heating Capacity
• Non-Energy Impacts
• Occupant Comfort
• Reliance on Delivered
Fuel
• CIP Integration
CONDENSING BOILER OPTIMIZATION
IN COMMERCIAL BUILDINGS
Project Summary and Update to AESP
March 25, 2015
Russ Landry, PE
Senior Mechanical Engineer
Pg. 82
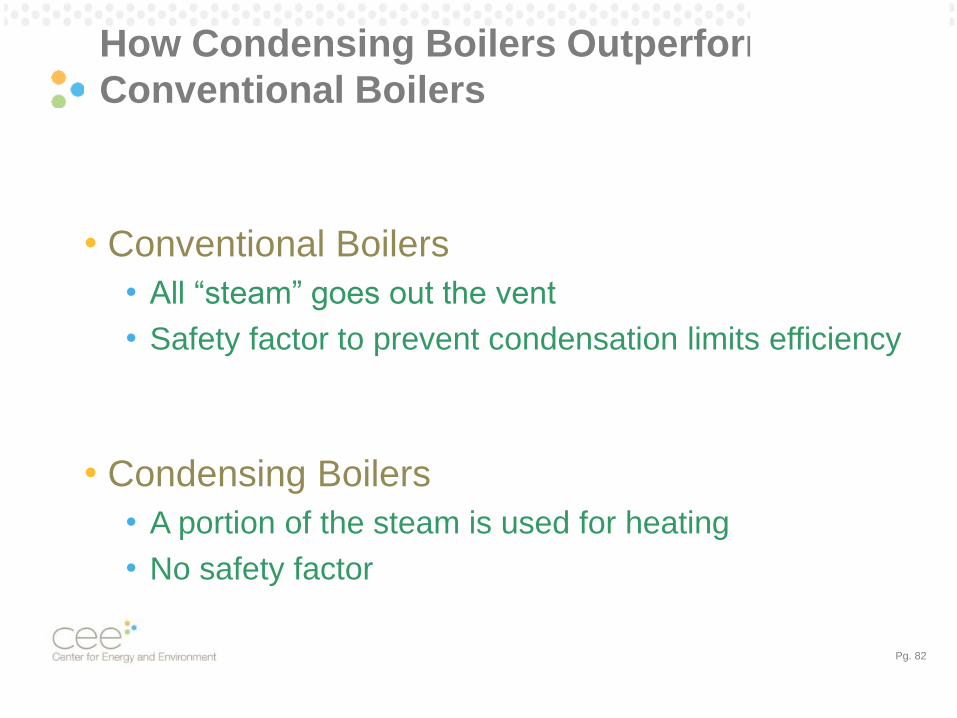
How Condensing Boilers Outperform
Conventional Boilers
• Conventional Boilers
• All “steam” goes out the vent
• Safety factor to prevent condensation limits efficiency
• Condensing Boilers
• A portion of the steam is used for heating
• No safety factor
Pg. 83
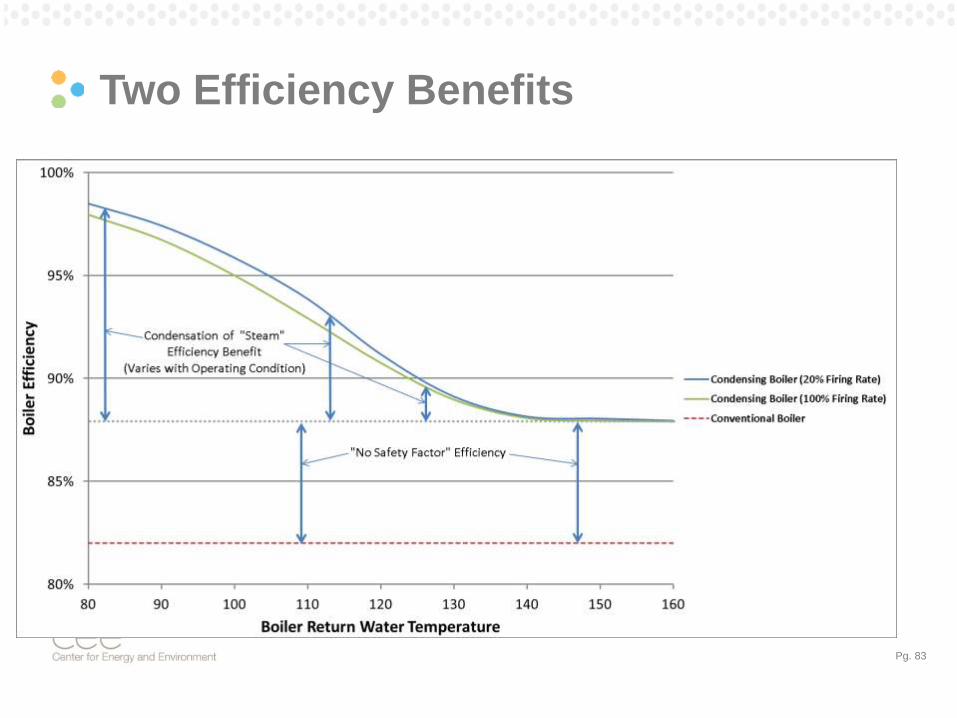
Two Efficiency Benefits
Pg. 84
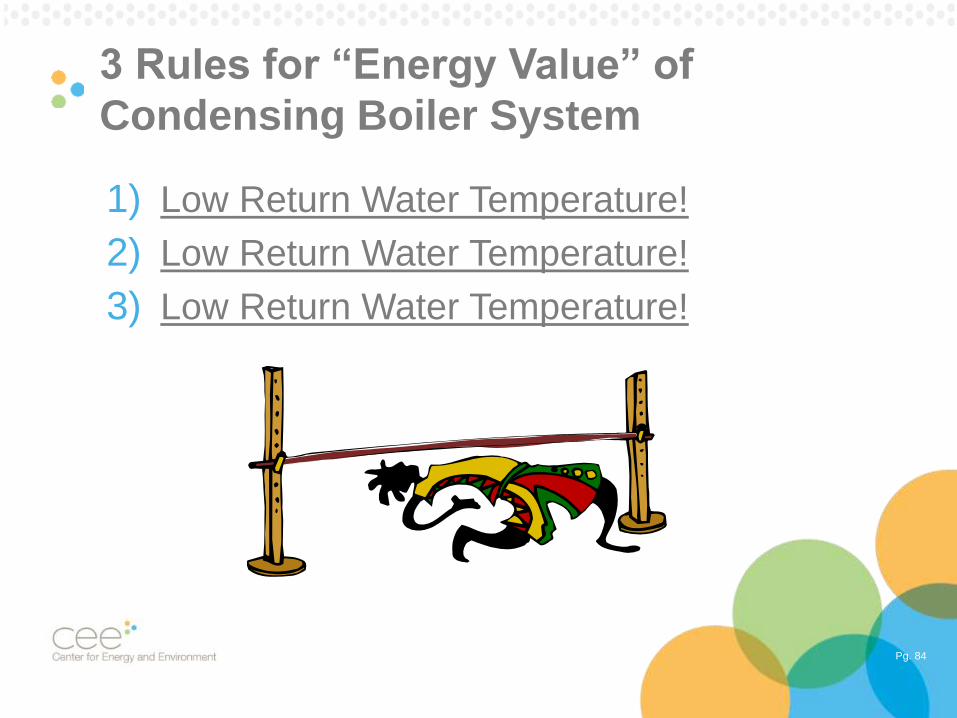
3 Rules for “Energy Value” of
Condensing Boiler System
1) Low Return Water Temperature!
2) Low Return Water Temperature!
3) Low Return Water Temperature!
Pg. 85
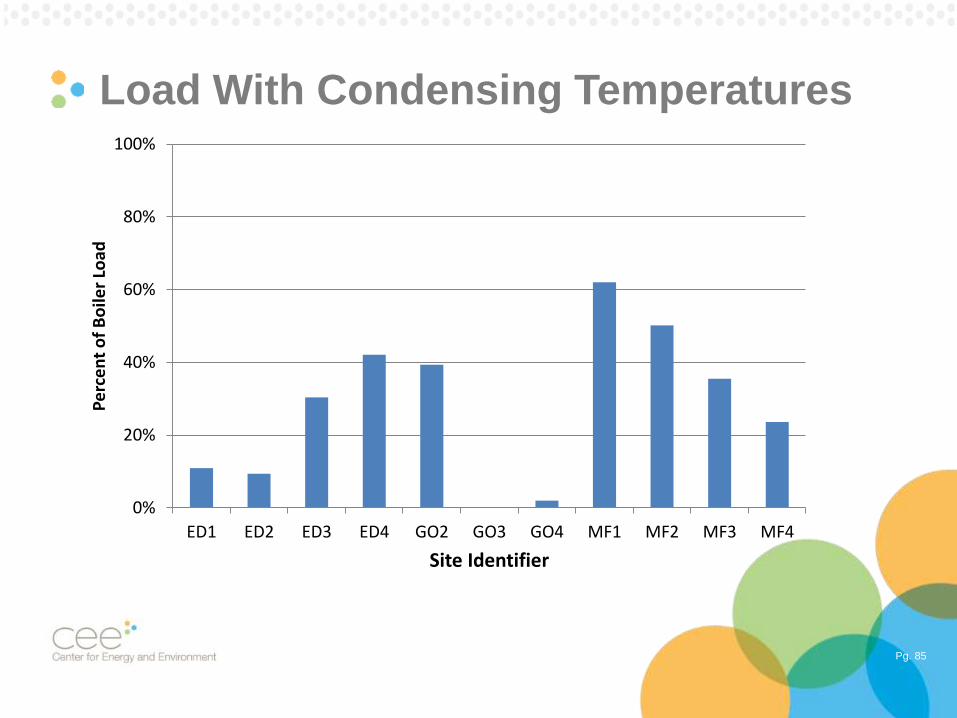
Load With Condensing Temperatures
0%
20%
40%
60%
80%
100%
ED1 ED2 ED3 ED4 GO2 GO3 GO4 MF1 MF2 MF3 MF4
Pe
rce
nt
of
Bo
iler
Load
Site Identifier
Pg. 86
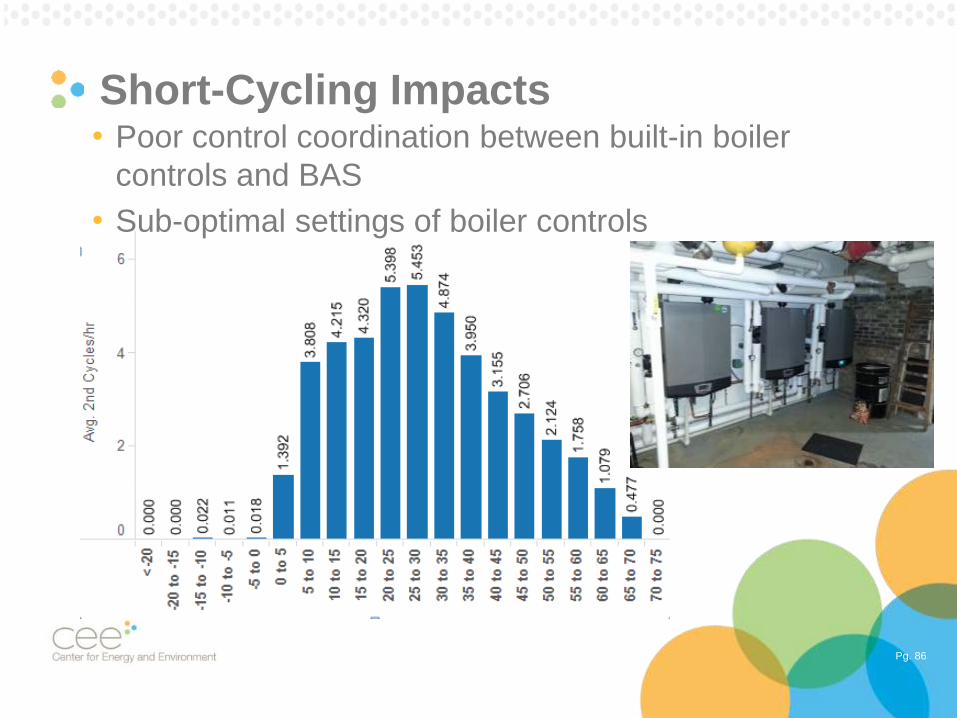
Short-Cycling Impacts• Poor control coordination between built-in boiler
controls and BAS
• Sub-optimal settings of boiler controls
Pg. 87
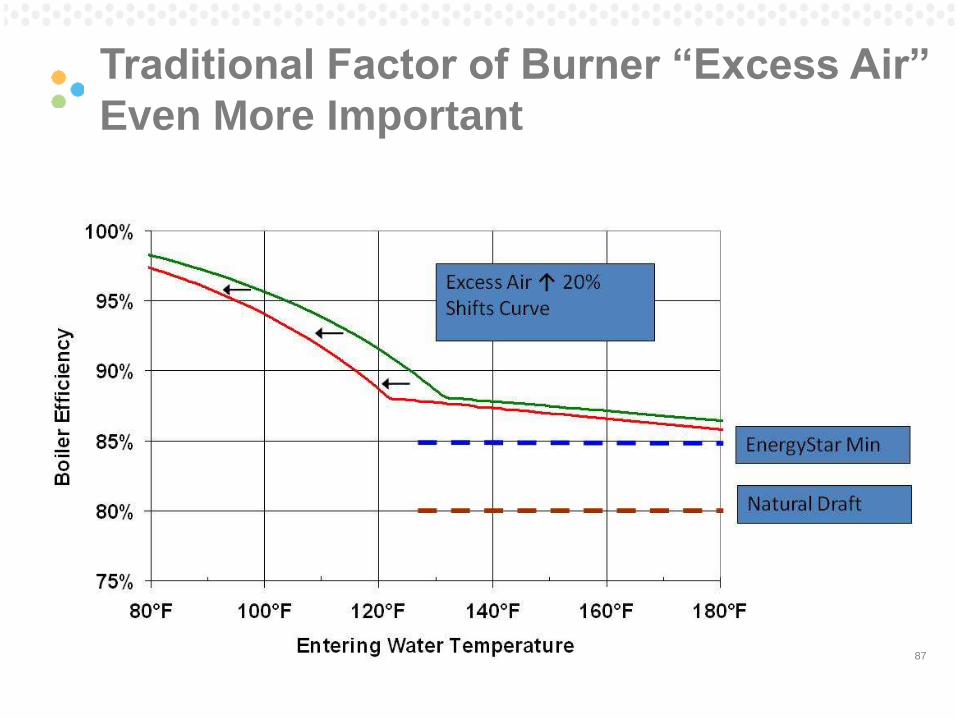
Traditional Factor of Burner “Excess Air”
Even More Important
Pg. 88
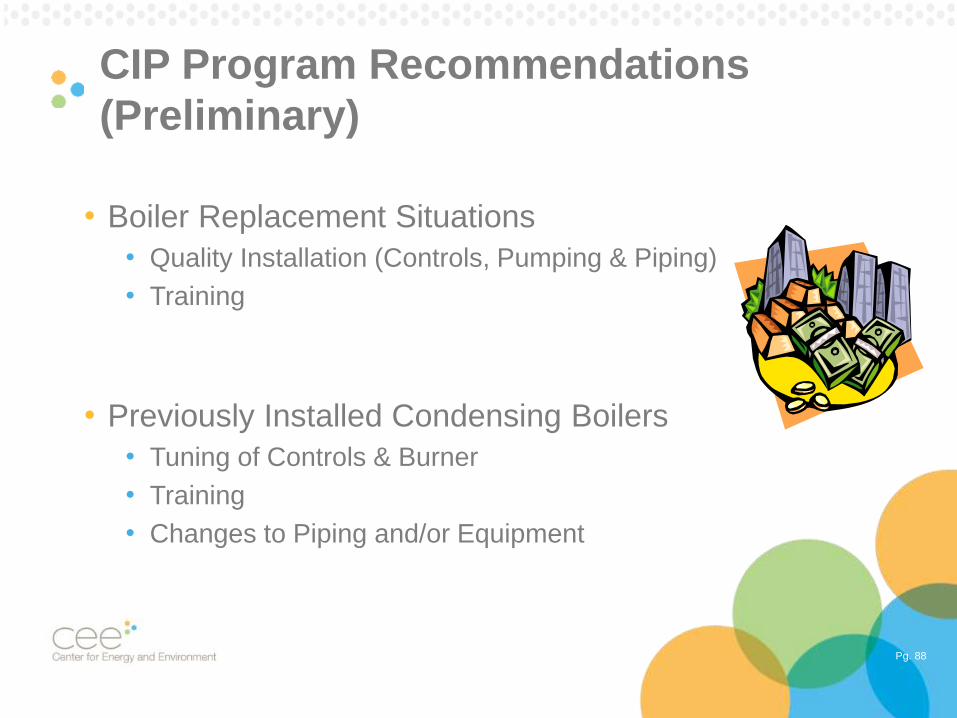
CIP Program Recommendations
(Preliminary)
• Boiler Replacement Situations
• Quality Installation (Controls, Pumping & Piping)
• Training
• Previously Installed Condensing Boilers
• Tuning of Controls & Burner
• Training
• Changes to Piping and/or Equipment
Pg. 89
Acknowledgements
• This project was supported in part by a grant from the
Minnesota Department of Commerce, Division of
Energy Resources through the Conservation Applied
Research and Development (CARD) program

ENERGY PROGRAM DEVELOPMENT & DESIGN
Energy Intelligence for Industry Pilot Program
AESP Midwest Meeting
March 25, 2015
Pg. 91
From Research to Program
How do you move from prototype to pilot to a successful program?
• Prototype: One of a kind model, not replicable
• Pilot program
• Short-term and small-scale
• Allows us to develop and test delivery of product
• Who is the right customer? Size? Segment?
• How should the product be delivered?
• Level of effort (incentive) to engage customer?
• When and how do we measure impacts?
• Development of cost-effectiveness
• Example: Energy Intelligence for Industry
Pg. 92
Energy Intelligence for Industry Pilot
Focuses on providing small industrial customers with real-time energy feedback and a mix of services to cost-effectively reduce energy consumption.
• 70 participants during 2013-2015 plan.
• Installing equipment at customer premise capable of providing15-minute interval energy use readings.
• Providing web-based reporting of interval data and training for customers on the use and interpretation of data.
• Identifying energy savings averaging at least 5% per site.
• Drive customer use of other CIP offerings beyond Energy Intelligence.
Pg. 93
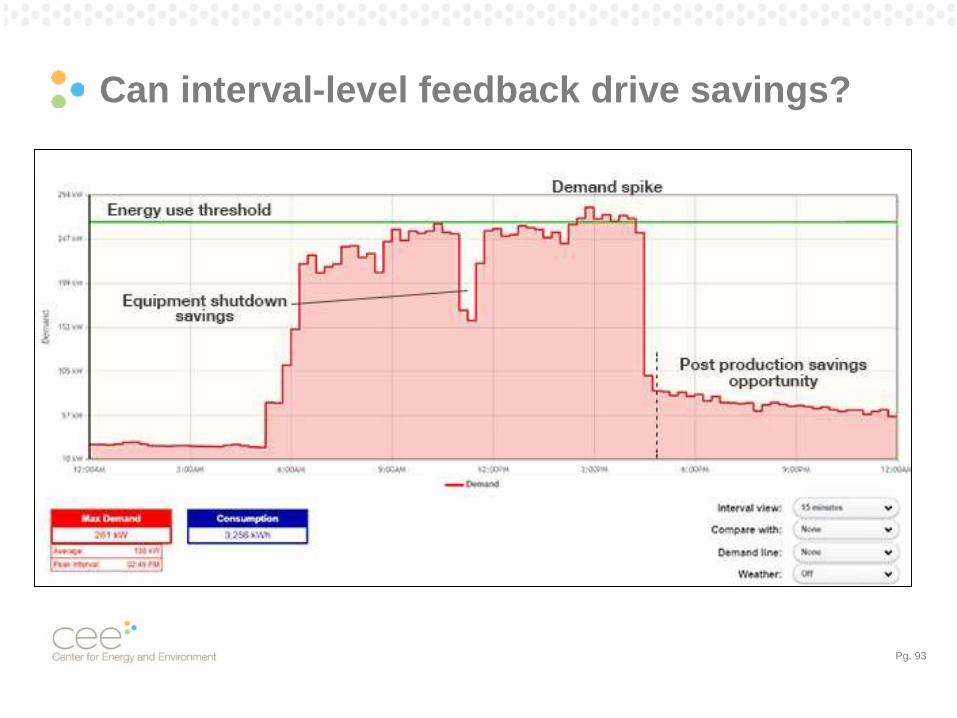
Can interval-level feedback drive savings?
Pg. 94
Pilots and Programs
• Utilities are pursuing energy feedback programs
• Alerts customers to high-energy use periods.
• Alerts customers to bills that are higher than peers.
• Helps identify actions.
• Often limited to residential market or buildings where the building
envelope and schedule drive usage.
• Is interval-level feedback effective for other segments?
• Small industrial
• Difficult to reach and engage with standard programs
• What actions/behaviors are a result of the feedback?
Pg. 95
Kickoff of the Pilot…Preparation
• Pilot began September 2013
• Assemble the team:• Project Manager, Project Coordinator, Engineer, Field Technician
• Identify the segment:• Who are “small and medium-sized industrial” customers?
• How do we market and recruit?
• How do we monitor to obtain 15-minute interval data?• CT-based monitoring on main electric service
• How do we provide web-based feedback?• Providers with capability and willing to bill on subscription basis.
Pg. 96
Kickoff of the Pilot…Countdown
• Filing Milestones – Regulatory stakeholder
• Monthly Reports and Findings – Utility stakeholder
• What about the Customer stakeholder?
• What is the program design, length, and deliverable?
• How much time will it take?
• What will it cost me?
• Will there be a disruption to my power?
Pg. 97
Kickoff of the Pilot…Launch
• First sites were really Prototypes
• Protocols changed with each new participant
• Extensive use of highly skilled staff (engineers, project
managers, executive team)
• “Off the shelf” equipment did not exist
• Communications challenges
• Participant confusion
• As things stabilized it became a Pilot

Who is doing the work?
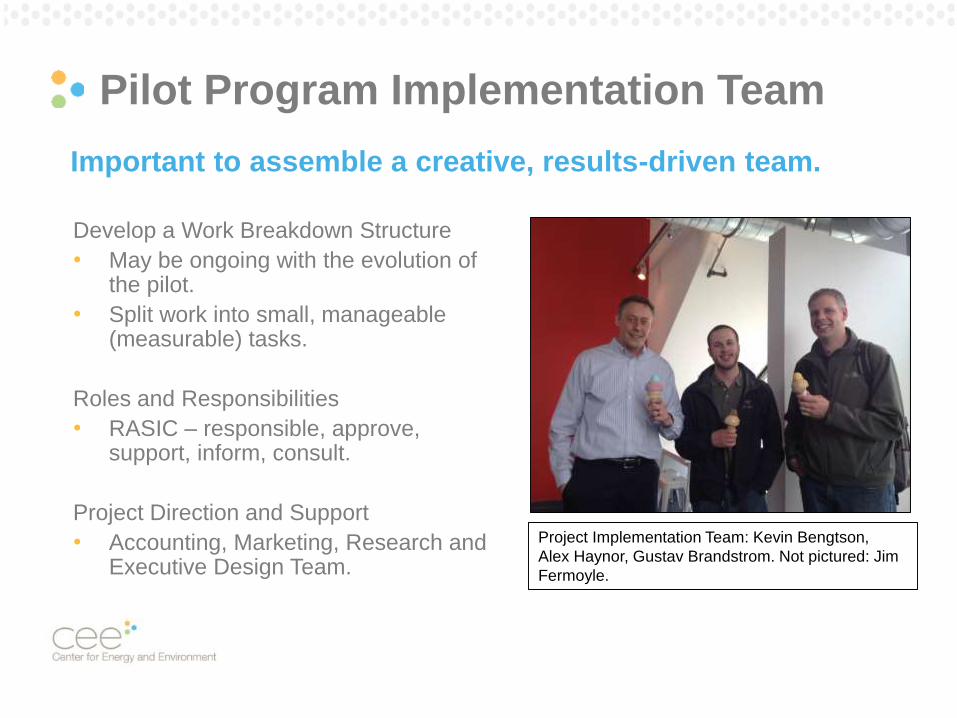
Pilot Program Implementation Team
Develop a Work Breakdown Structure
• May be ongoing with the evolution of the pilot.
• Split work into small, manageable (measurable) tasks.
Roles and Responsibilities
• RASIC – responsible, approve, support, inform, consult.
Project Direction and Support
• Accounting, Marketing, Research and Executive Design Team.
Project Implementation Team: Kevin Bengtson,
Alex Haynor, Gustav Brandstrom. Not pictured: Jim
Fermoyle.
Important to assemble a creative, results-driven team.

Who is our customer?
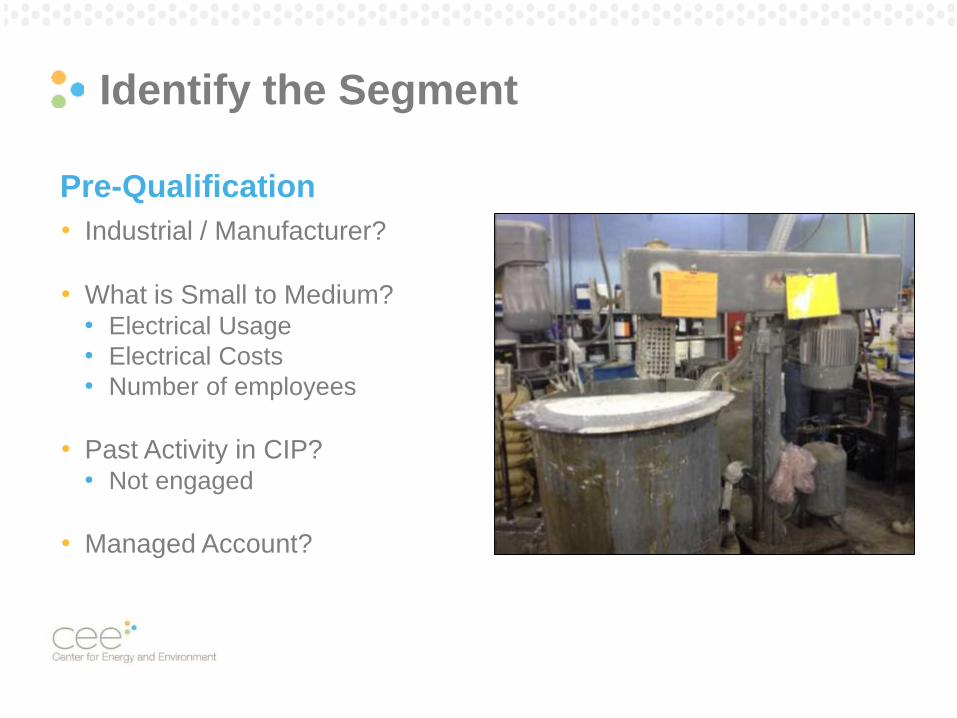
Pre-Qualification
• Industrial / Manufacturer?
• What is Small to Medium?• Electrical Usage
• Electrical Costs
• Number of employees
• Past Activity in CIP?• Not engaged
• Managed Account?
Identify the Segment
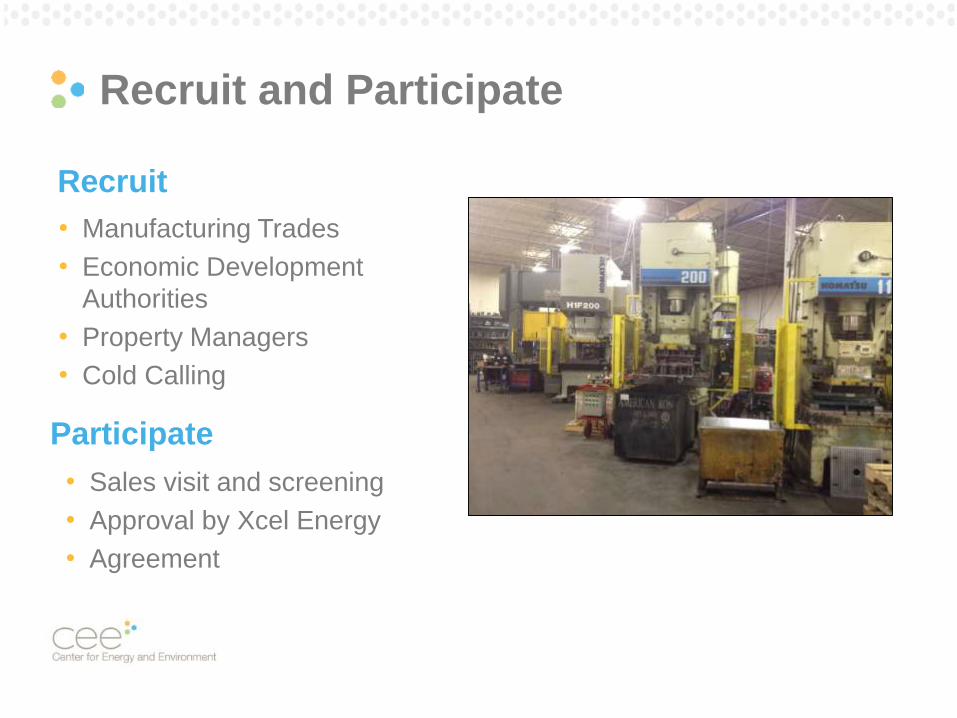
Recruit and Participate
Recruit
Participate
• Manufacturing Trades
• Economic Development
Authorities
• Property Managers
• Cold Calling
• Sales visit and screening
• Approval by Xcel Energy
• Agreement
Pg. 103
Participation in 2014
• 2,721 possible customers (per KEMA potential study)• Avg: 666,000 KWH per year
• Met with 75 customers • 41 signed to program
• 83,000 to 2,100,000 KWH/year (Avg: 435,000)
• 32 to 477 KW monthly demand (Avg: 132 KW)
• 1.3 electric meters per site (limiting ppt to <=3)
• Average monthly bill is $3,800
• But does that make them good candidates?• What are the characteristics of a high-opportunity customer?
How do we get the data?
(what do we need to do to find savings)
Pg. 105
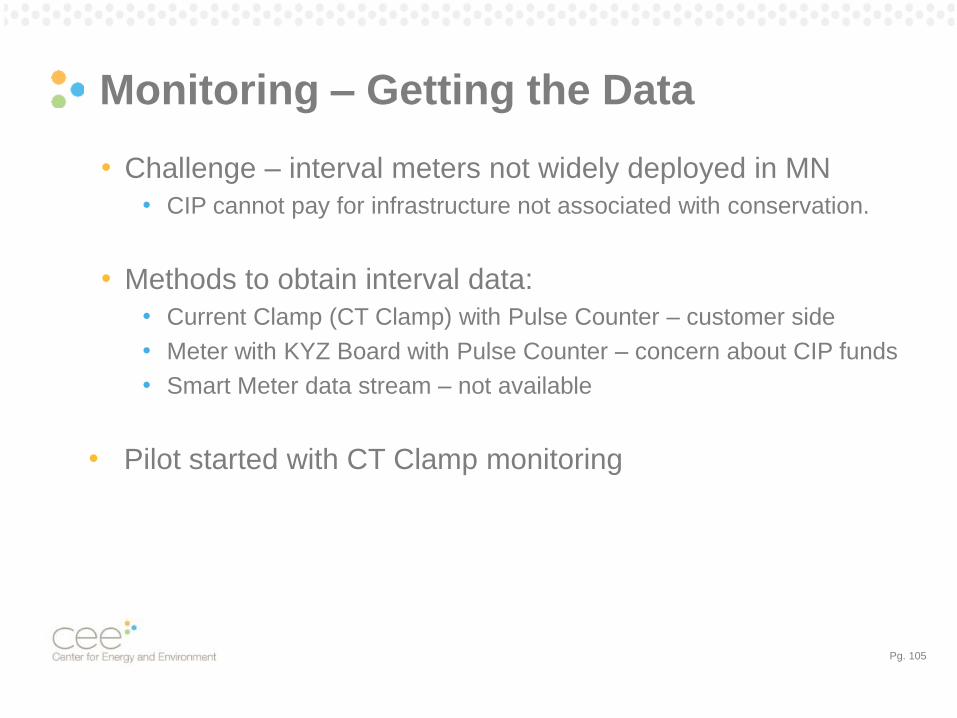
Monitoring – Getting the Data
• Challenge – interval meters not widely deployed in MN
• CIP cannot pay for infrastructure not associated with conservation.
• Methods to obtain interval data:
• Current Clamp (CT Clamp) with Pulse Counter – customer side
• Meter with KYZ Board with Pulse Counter – concern about CIP funds
• Smart Meter data stream – not available
• Pilot started with CT Clamp monitoring
Pg. 106
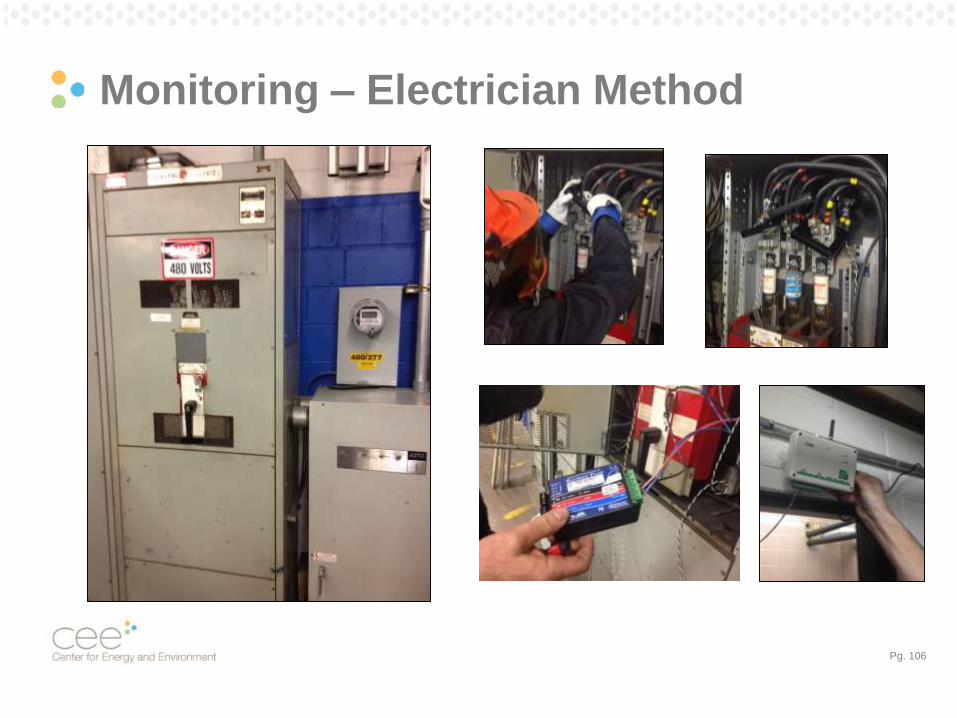
Monitoring – Electrician Method
Pg. 107
Monitoring – Procedure Change
• Pilot started with CT Clamp monitoring
After collecting data and experiences from several customer
sites, presented case to Regulatory stakeholder to try monitoring
with Meter/KYZ board.
Pg. 108
Monitoring – Transition to KYZ Board
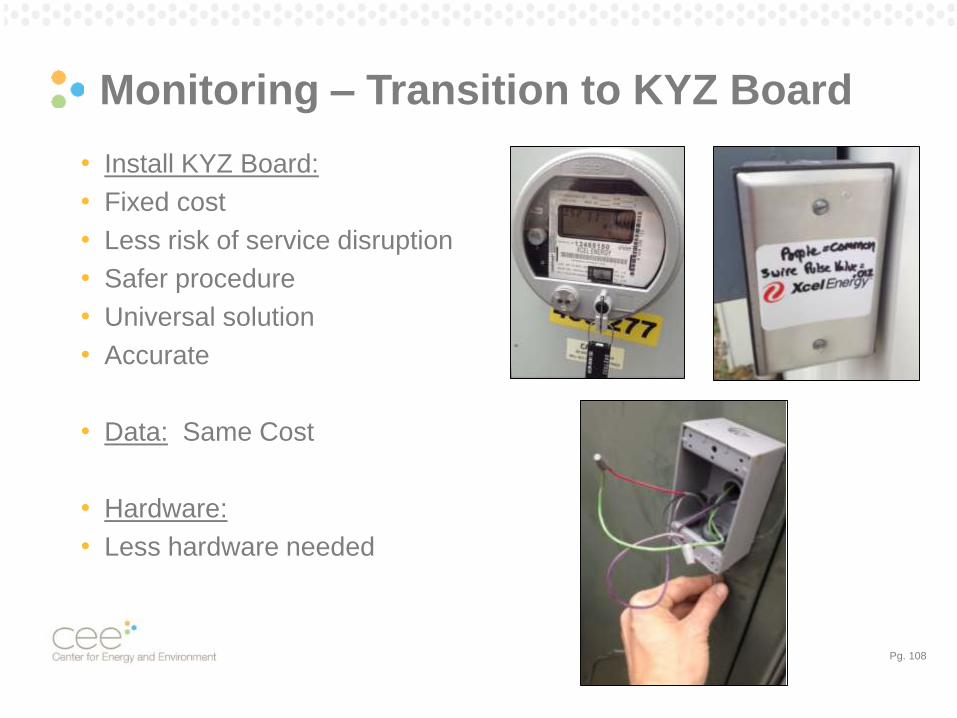
• Install KYZ Board:
• Fixed cost
• Less risk of service disruption
• Safer procedure
• Universal solution
• Accurate
• Data: Same Cost
• Hardware:
• Less hardware needed
Pg. 109
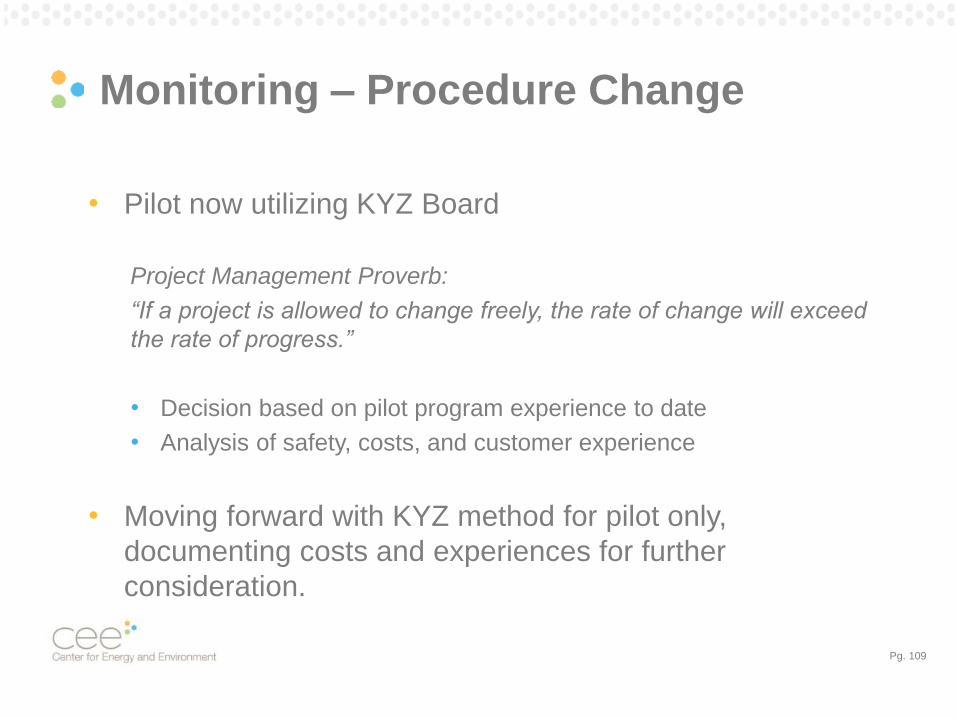
Monitoring – Procedure Change
• Pilot now utilizing KYZ Board
Project Management Proverb:
“If a project is allowed to change freely, the rate of change will exceed
the rate of progress.”
• Decision based on pilot program experience to date
• Analysis of safety, costs, and customer experience
• Moving forward with KYZ method for pilot only,
documenting costs and experiences for further
consideration.
How do we provide feedback?
(what do we need to get implementation)
Pg. 111
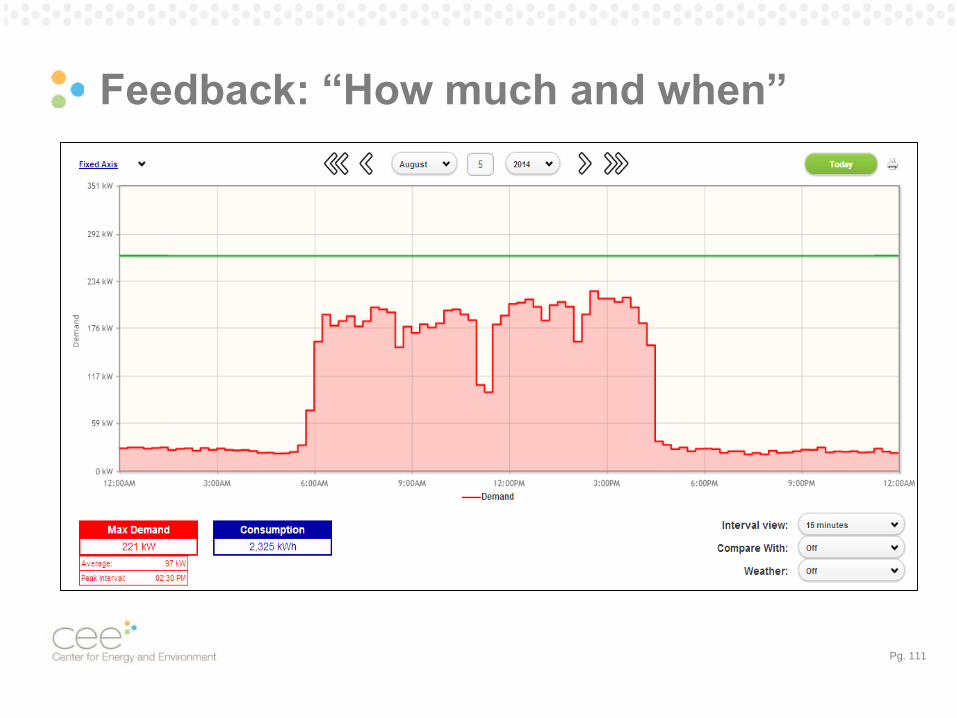
Feedback: “How much and when”
Pg. 112
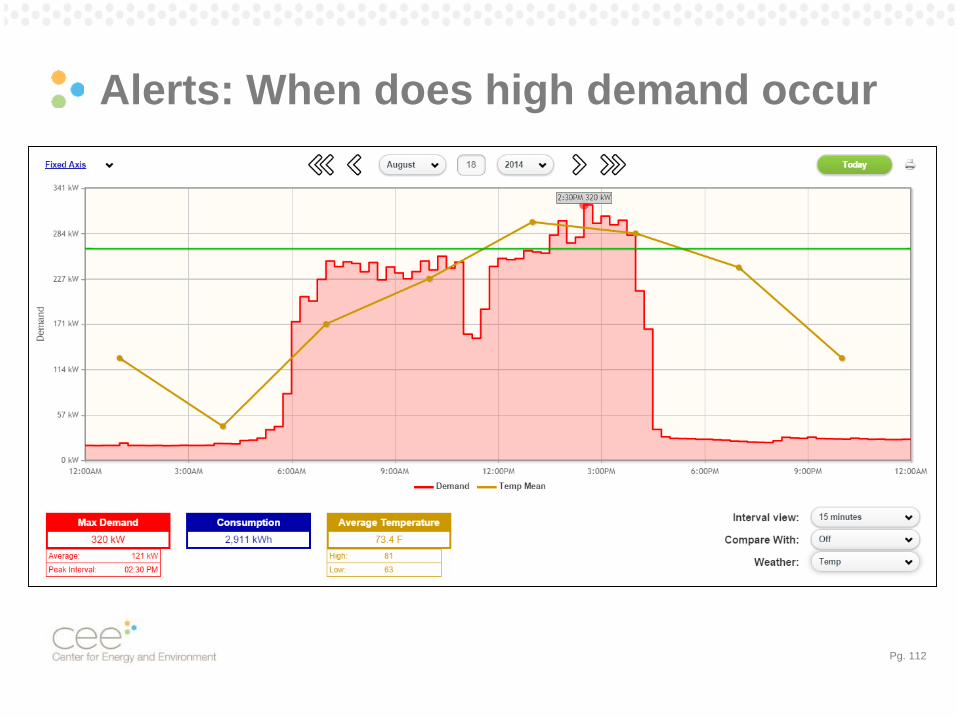
Alerts: When does high demand occur
Pg. 113
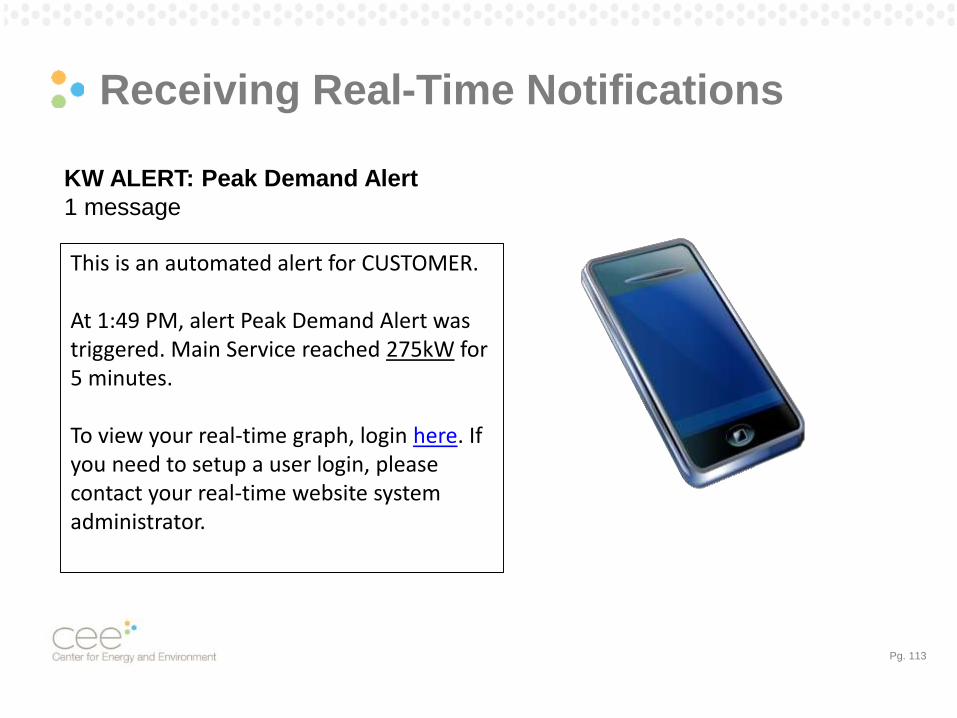
Receiving Real-Time Notifications
KW ALERT: Peak Demand Alert
1 message
This is an automated alert for CUSTOMER.
At 1:49 PM, alert Peak Demand Alert was triggered. Main Service reached 275kW for 5 minutes.
To view your real-time graph, login here. If you need to setup a user login, please contact your real-time website system administrator.
Pg. 114
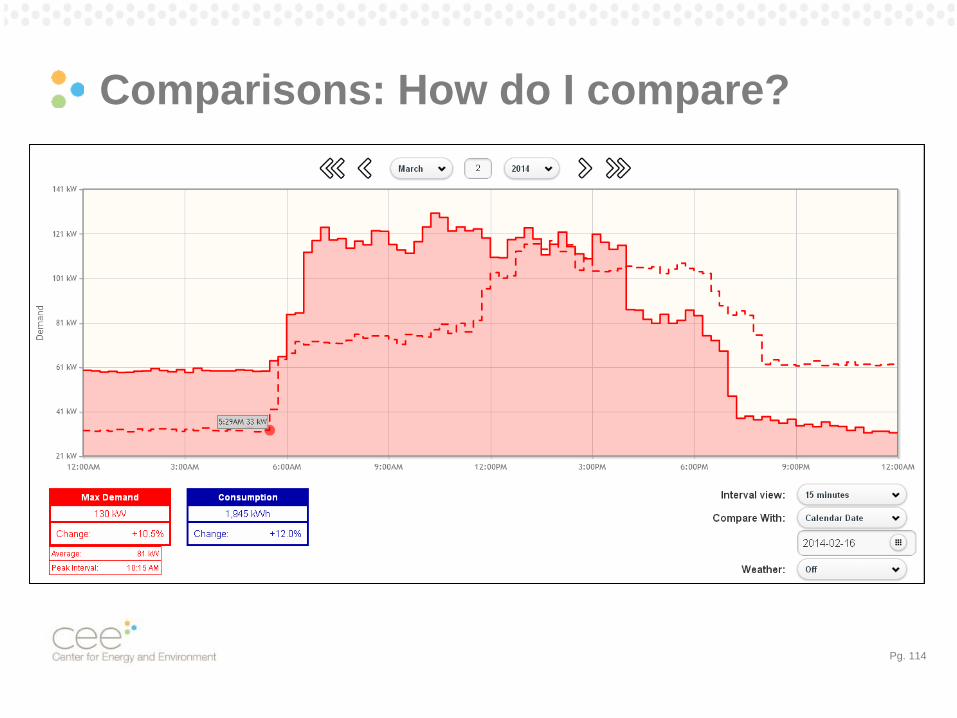
Comparisons: How do I compare?
Pg. 115
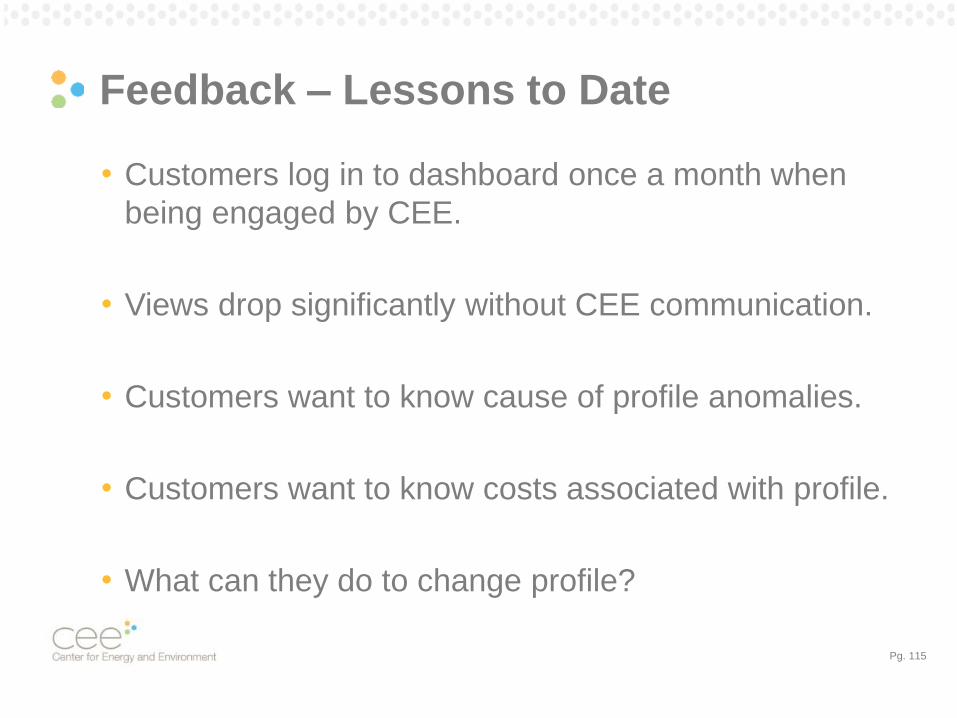
Feedback – Lessons to Date
• Customers log in to dashboard once a month when
being engaged by CEE.
• Views drop significantly without CEE communication.
• Customers want to know cause of profile anomalies.
• Customers want to know costs associated with profile.
• What can they do to change profile?
Pg. 116
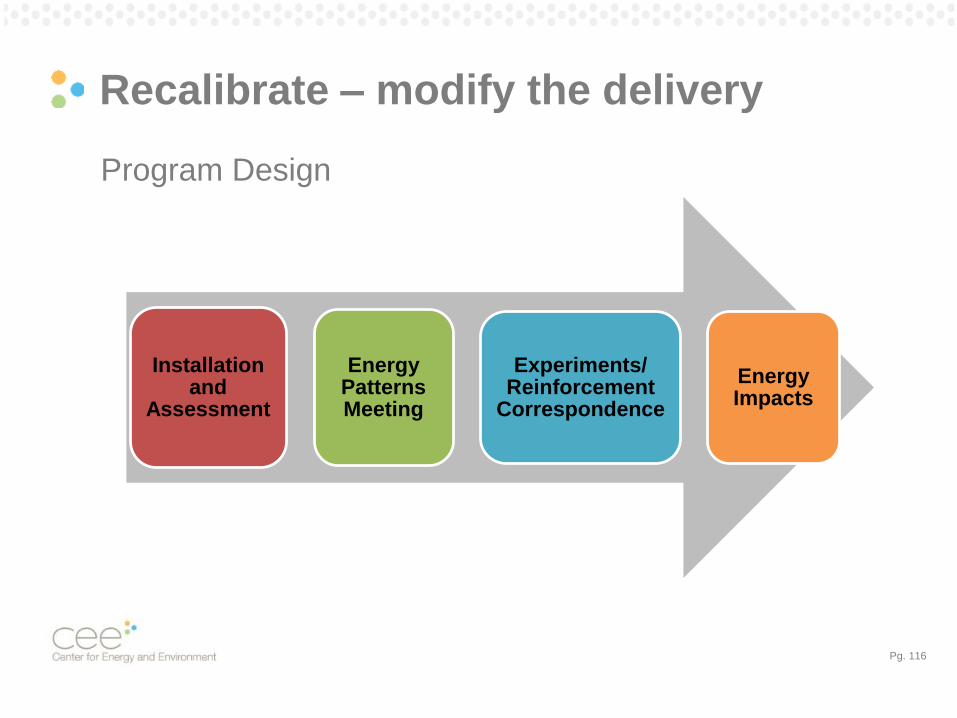
Recalibrate – modify the delivery
Program Design
Installation and
Assessment
Energy Patterns Meeting
Experiments/ Reinforcement
Correspondence
Energy Impacts
Pg. 117
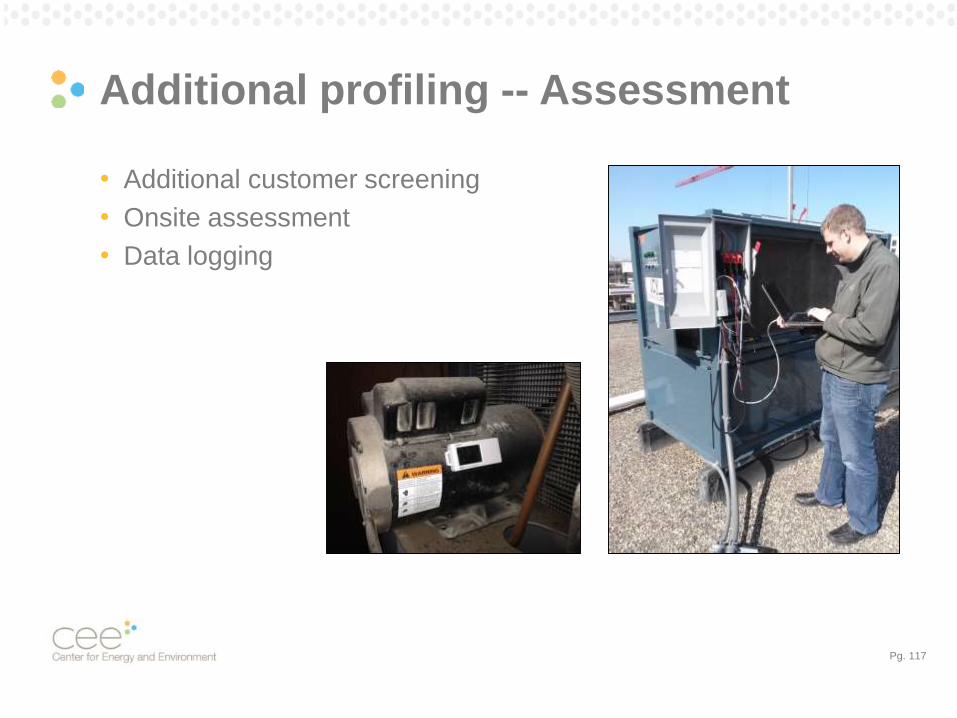
Additional profiling -- Assessment
• Additional customer screening
• Onsite assessment
• Data logging
Pg. 118
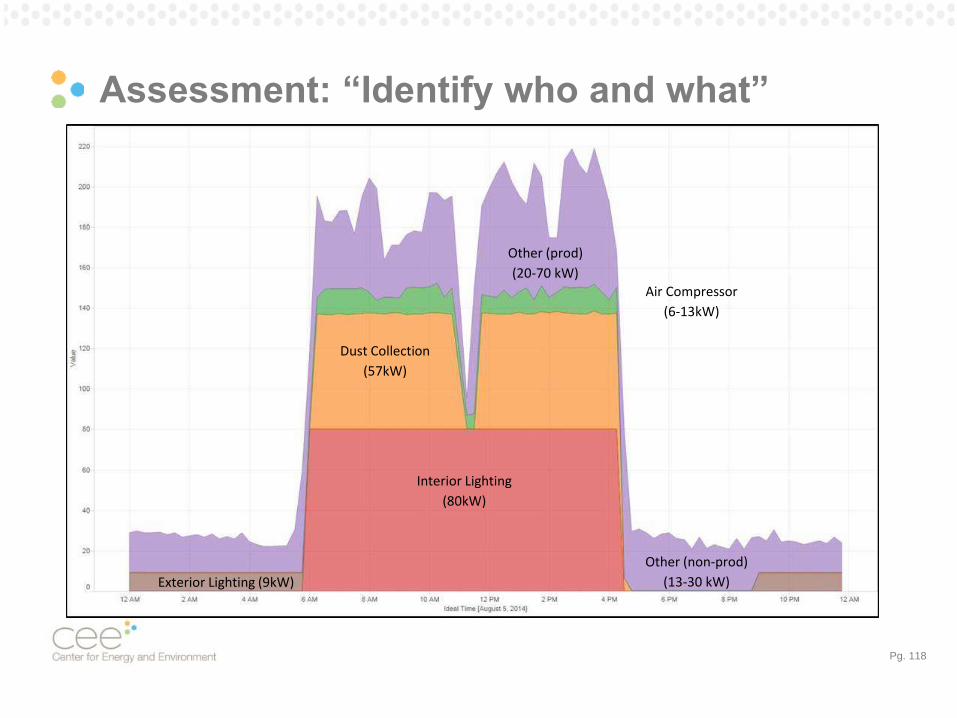
Assessment: “Identify who and what”
Interior Lighting
(80kW)
Dust Collection
(57kW)
Air Compressor
(6-13kW)
Other (prod)
(20-70 kW)
Exterior Lighting (9kW)
Other (non-prod)
(13-30 kW)
Pg. 119
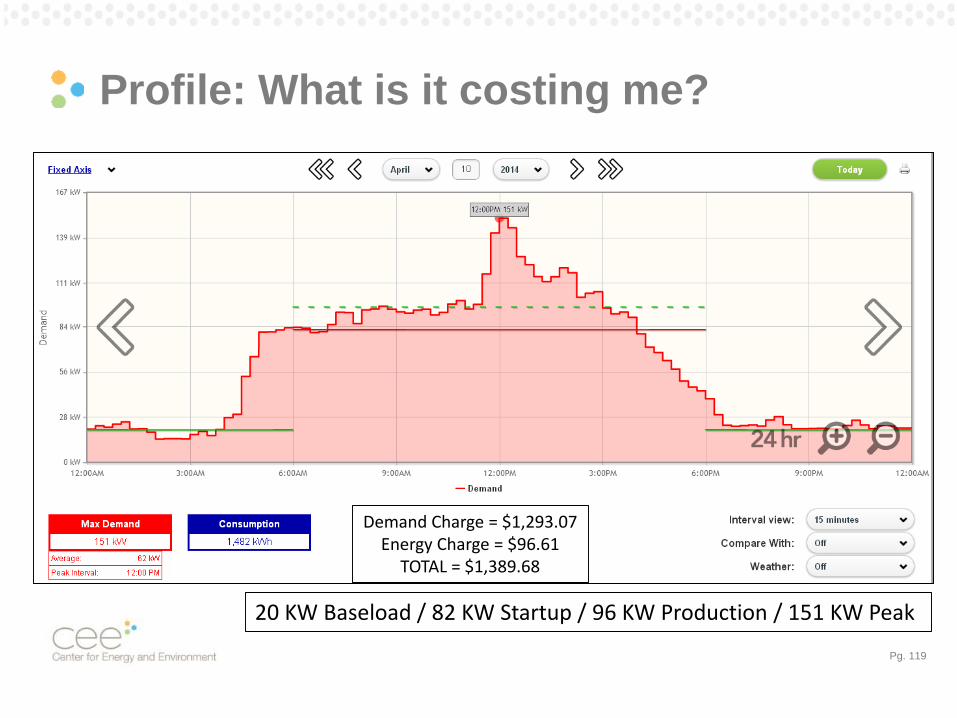
Profile: What is it costing me?
20 KW Baseload / 82 KW Startup / 96 KW Production / 151 KW Peak
Demand Charge = $1,293.07Energy Charge = $96.61
TOTAL = $1,389.68
Pg. 120
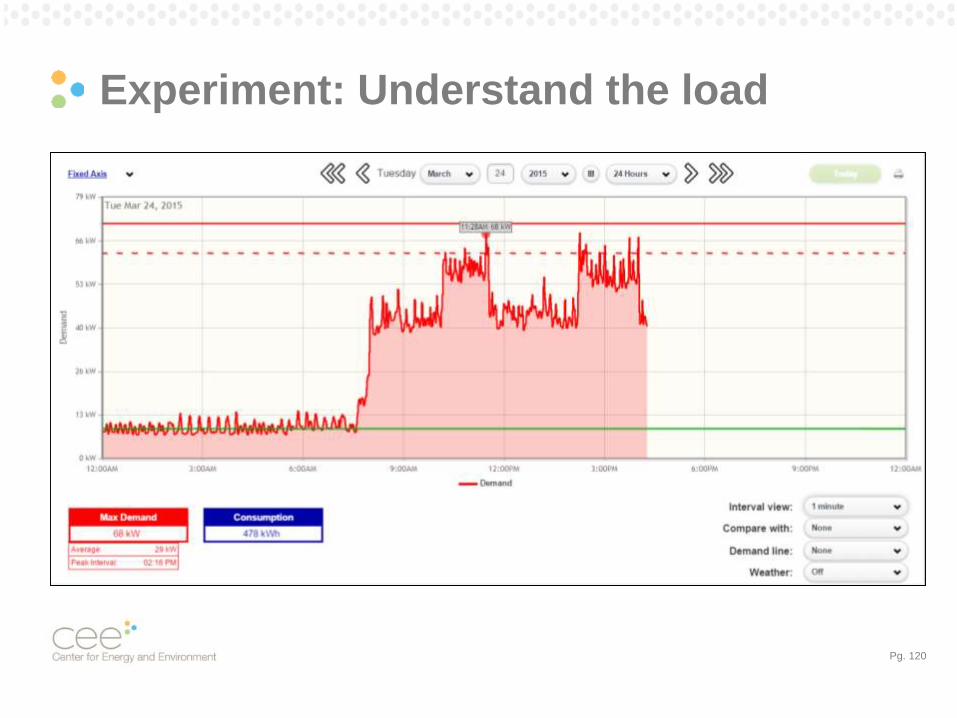
Experiment: Understand the load
Pg. 121
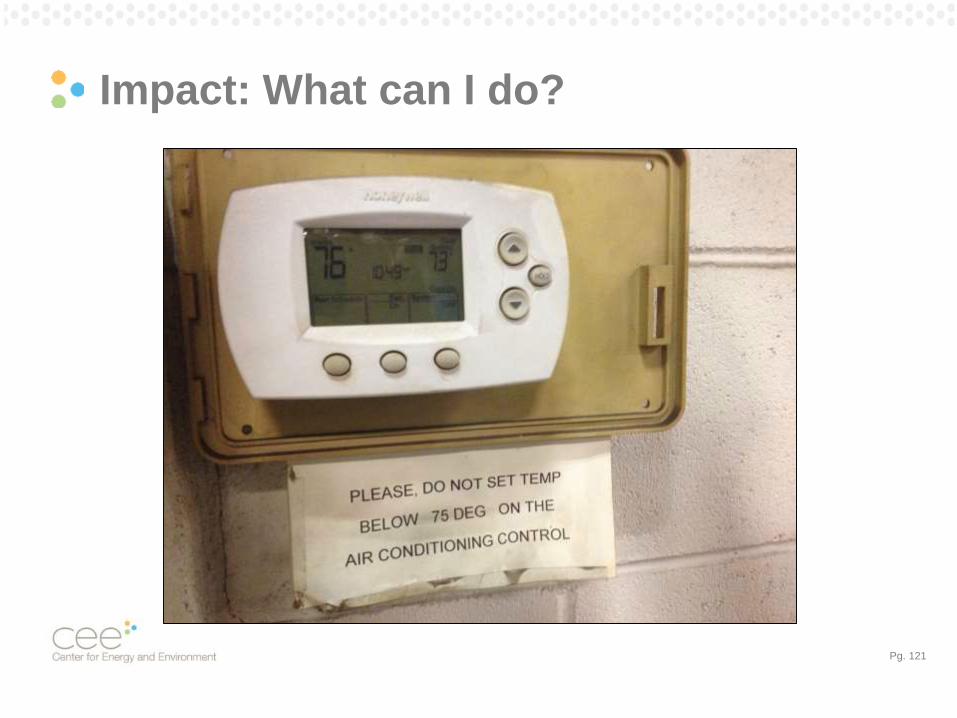
Impact: What can I do?
Pg. 122
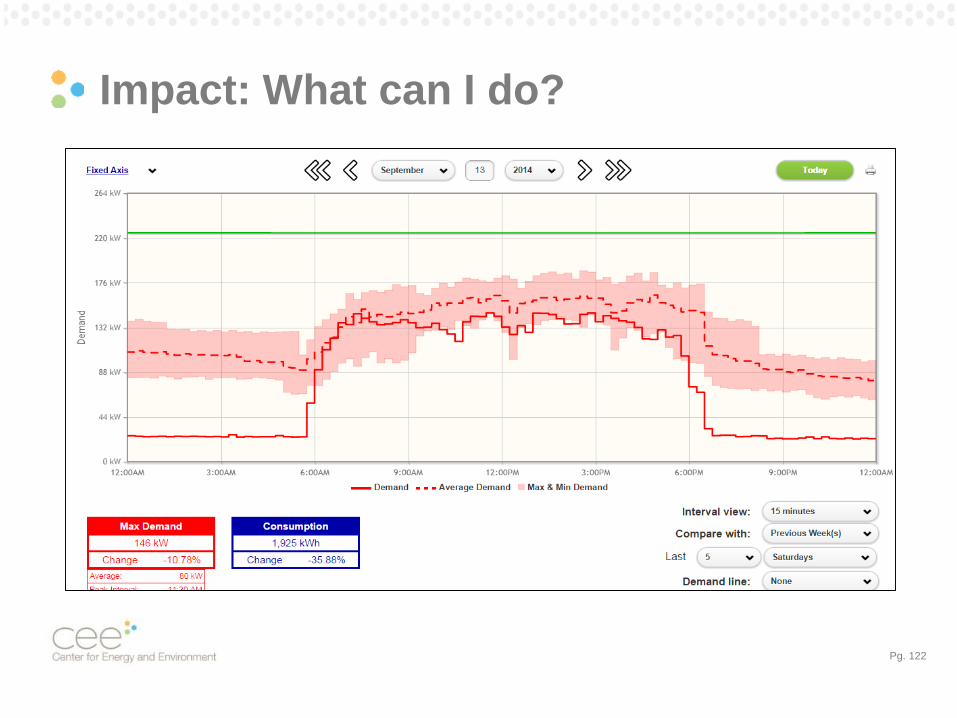
Impact: What can I do?
Pg. 123
Energy Impacts to Date (20 customers)
• Identified 11.5% in energy savings (1,025,946 KWH)• 3.4% in behavioral/operational savings (297,842 KWH)
• 8.1% in program-based opportunities (728,104 KWH)
• Implemented 2.5% (225,161 KWH)• 0.9% in behavioral/operational savings (76,191 KWH)
• 1.7% in program-based opportunities (148,970 KWH)
• Next steps• Modify the design (again) to drive implementation and lower
cost of delivery.
Pg. 124
From Research to Program
Short-term & small-scale to utility-scale & cost-effective
• Multi-disciplinary team.
• Understand what systems are needed for support, and
realize those system may have their own challenges.
• Evolve program delivery to identify, engage, and get
implementation.
• Review of all systems and processes to optimize cost-
effectiveness.
• Stakeholder engagement to help guide path.

Additional Profile Slides
(not part of main presentation)

Pg. 127
How Low Can You Go? -- Sunday
Pg. 128
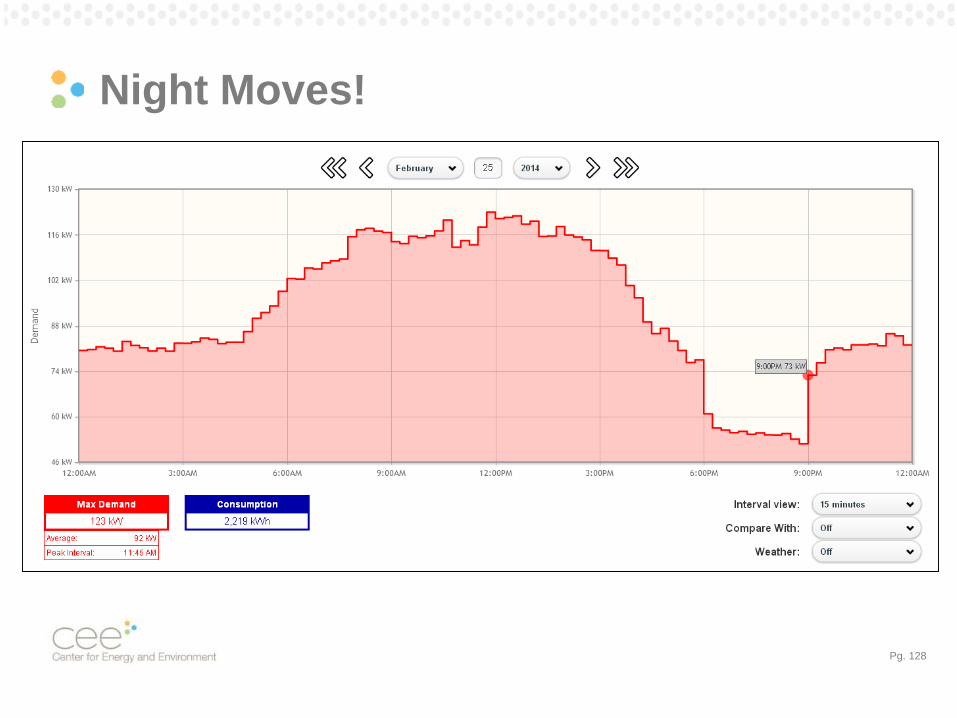
Night Moves!
Pg. 129
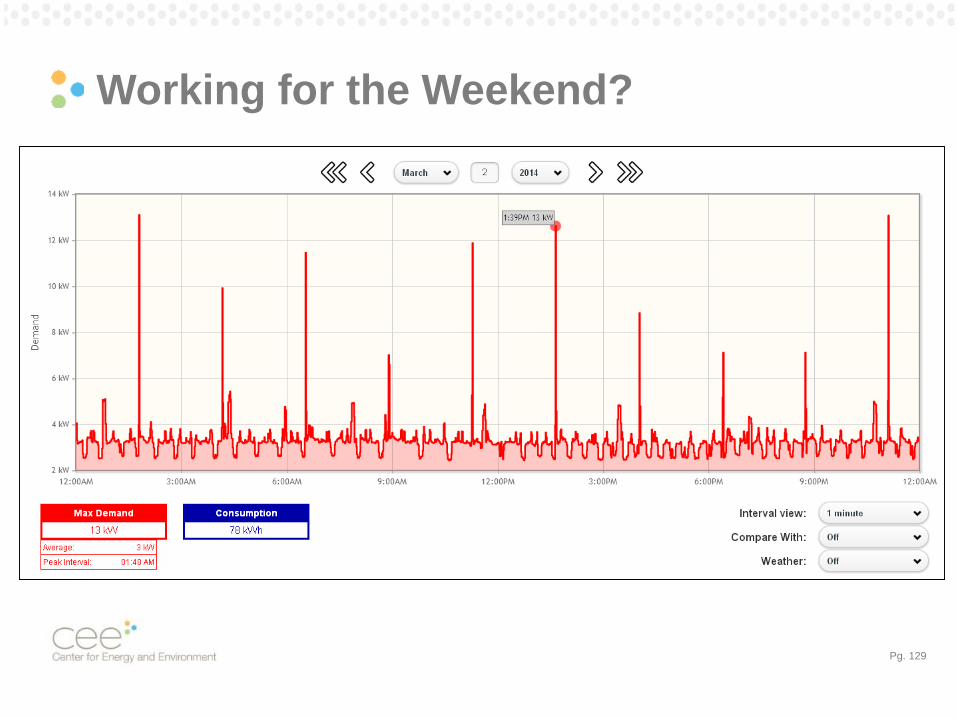
Working for the Weekend?
Pg. 130
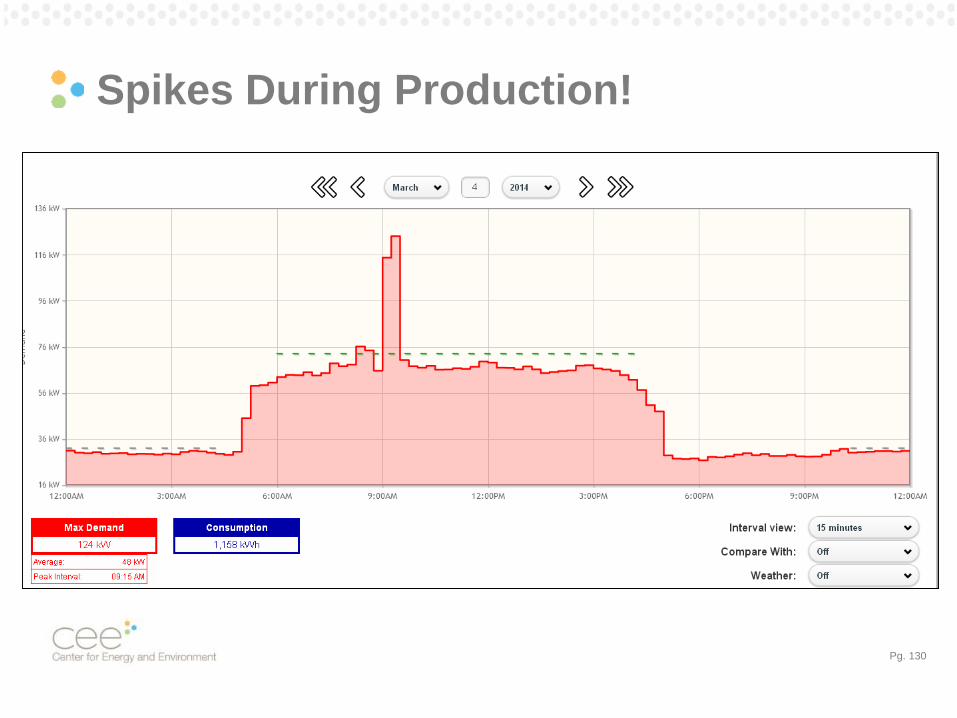
Spikes During Production!
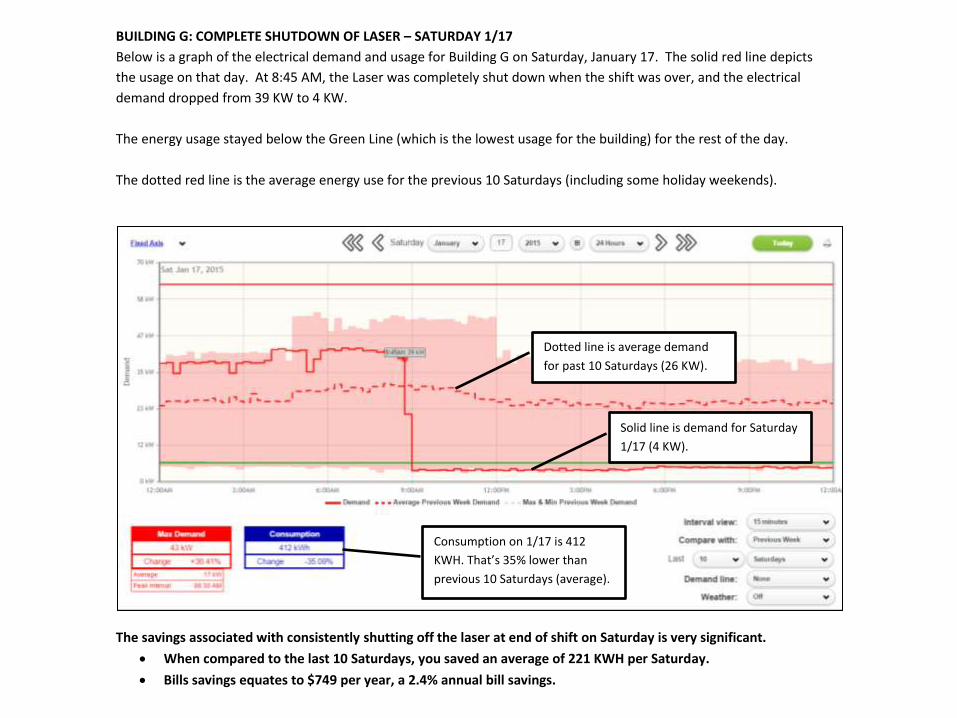
BUILDING G: COMPLETE SHUTDOWN OF LASER – SATURDAY 1/17
Below is a graph of the electrical demand and usage for Building G on Saturday, January 17. The solid red line depicts
the usage on that day. At 8:45 AM, the Laser was completely shut down when the shift was over, and the electrical
demand dropped from 39 KW to 4 KW.
The energy usage stayed below the Green Line (which is the lowest usage for the building) for the rest of the day.
The dotted red line is the average energy use for the previous 10 Saturdays (including some holiday weekends).
The savings associated with consistently shutting off the laser at end of shift on Saturday is very significant.
When compared to the last 10 Saturdays, you saved an average of 221 KWH per Saturday.
Bills savings equates to $749 per year, a 2.4% annual bill savings.
Dotted line is average demand
for past 10 Saturdays (26 KW).
Solid line is demand for Saturday
1/17 (4 KW).
Consumption on 1/17 is 412
KWH. That’s 35% lower than
previous 10 Saturdays (average).
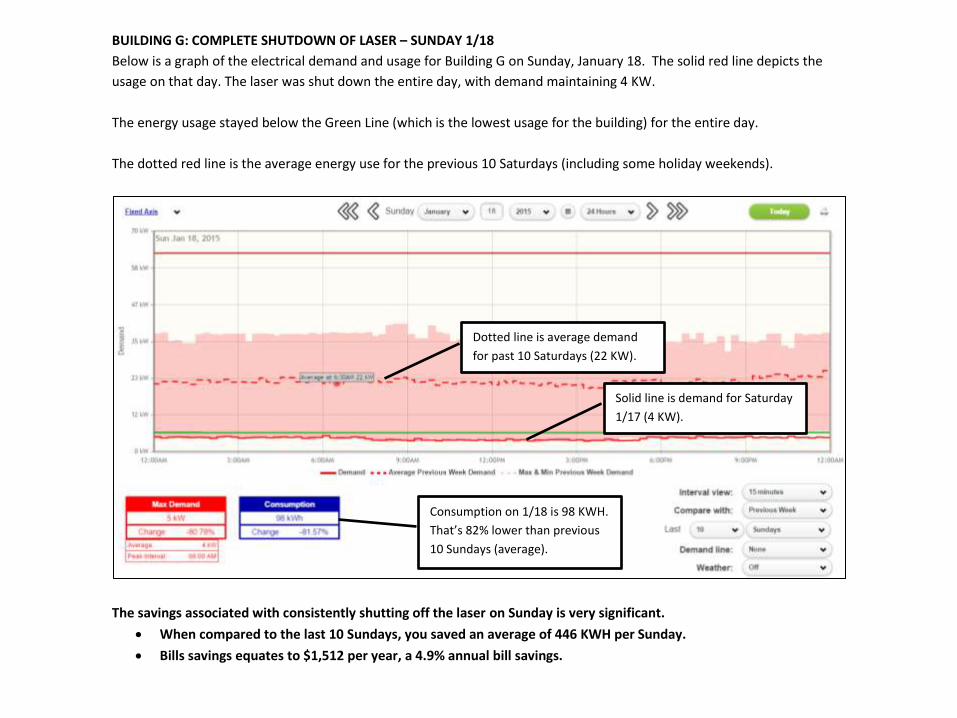
BUILDING G: COMPLETE SHUTDOWN OF LASER – SUNDAY 1/18
Below is a graph of the electrical demand and usage for Building G on Sunday, January 18. The solid red line depicts the
usage on that day. The laser was shut down the entire day, with demand maintaining 4 KW.
The energy usage stayed below the Green Line (which is the lowest usage for the building) for the entire day.
The dotted red line is the average energy use for the previous 10 Saturdays (including some holiday weekends).
The savings associated with consistently shutting off the laser on Sunday is very significant.
When compared to the last 10 Sundays, you saved an average of 446 KWH per Sunday.
Bills savings equates to $1,512 per year, a 4.9% annual bill savings.
Dotted line is average demand
for past 10 Saturdays (22 KW).
Solid line is demand for Saturday
1/17 (4 KW).
Consumption on 1/18 is 98 KWH.
That’s 82% lower than previous
10 Sundays (average).
Pg. 133
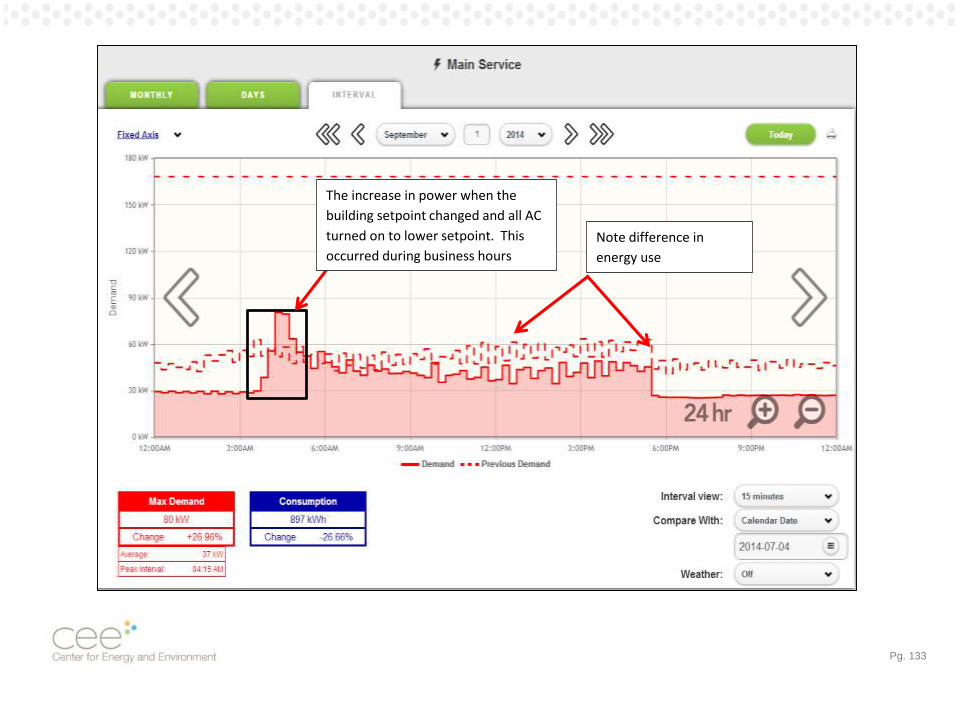
The increase in power when the
building setpoint changed and all AC
turned on to lower setpoint. This
occurred during business hours
Note difference in
energy use
Pg. 134