Embed Size (px)
DESCRIPTION
High performance solutions for peak and average power measurements
Citation preview
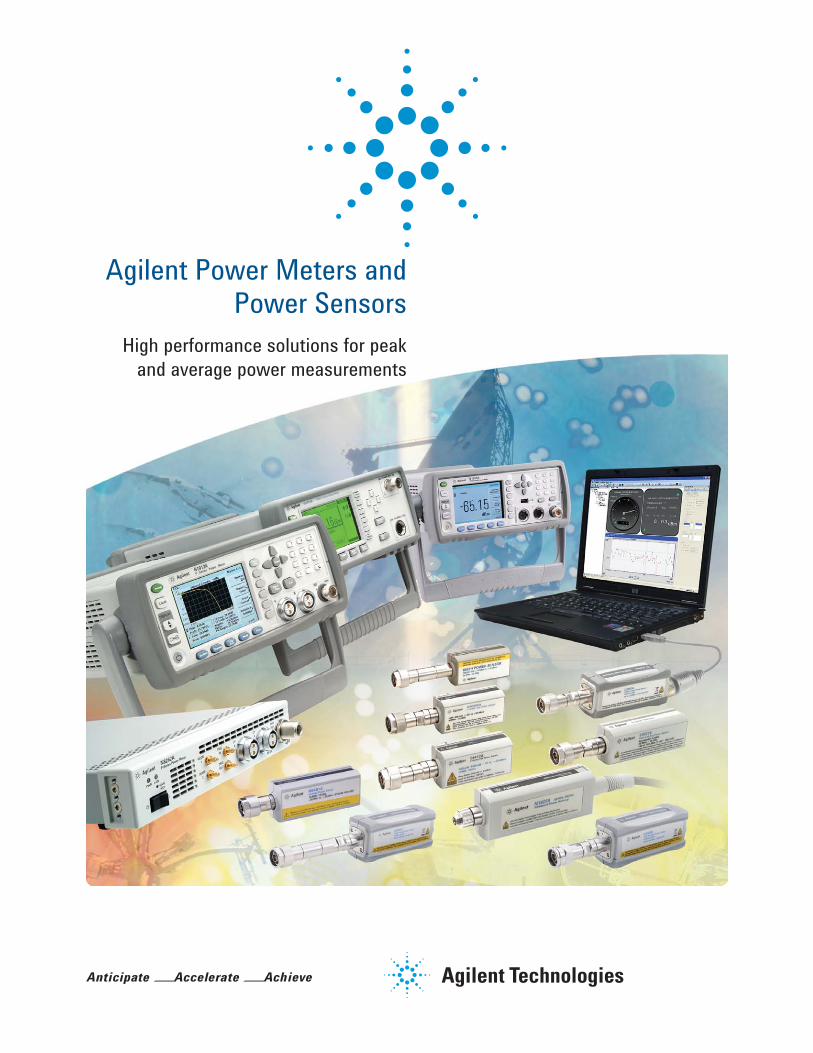
Agilent Power Meters and Power Sensors
High performance solutions for peak
and average power measurements
2
Introducing Agilent Power Meters and Sensors
Reliable, high-performing solutions
Every power meter and sensor from Agilent consistently delivers great results.
A sure investment for many years to come
Code-compatibility between power meters reduces the need for re-coding. Not
only that, all Agilent power meters are backward-compatible with most legacy
power sensors.
One specific application: One right solution
Agilent offers a wide selection of power meters and sensors for practically
all application needs—wireless communications, radar pulse measurements,
component test and more.
Global network support
No matter where you are, Agilent is committed to giving you the 24-hour
support you need regarding our products, applications or services.
Explore Agilent Power Solutions Further
Peak Power Measurements and Analysis
For Faster Measurement Speed and Greater Measurement Accuracy ........................................................... 3
Peak and Average Power Measurements
For Accelerated Production Throughput ............................................................................................................... 6
For Compact ATE Systems ...................................................................................................................................... 8
For Effective Capture of Wireless Signals .......................................................................................................... 11
For Testing of Complex Modulation Formats ..................................................................................................... 15
Average Power Measurements
For Metrology and Calibration Laboratories ....................................................................................................... 18
For Flexible Testing: On the Rack and On the Go .............................................................................................. 19
For Mobile Testing that’s Plug-and-Play Easy ................................................................................................... 19
For Portable RF Measurements ............................................................................................................................ 23
Power Measurement Software
For Easy Monitoring and Troubleshooting........................................................................................................... 25
Power Meters Selection Chart for Wireless Communication ................................................................................ 27
Power Sensors Selection Chart for Wireless Communication ............................................................................... 28
Power Meters and Sensors Compatibility Table ....................................................................................................... 29
Related Agilent Literature ............................................................................................................................................. 31
Warranty Information ......................................................................................................................................Back cover
Contact Agilent ................................................................................................................................................Back cover
3
Peak Power Measurements and AnalysisFor Faster Measurement Speed and Greater Measurement Accuracy
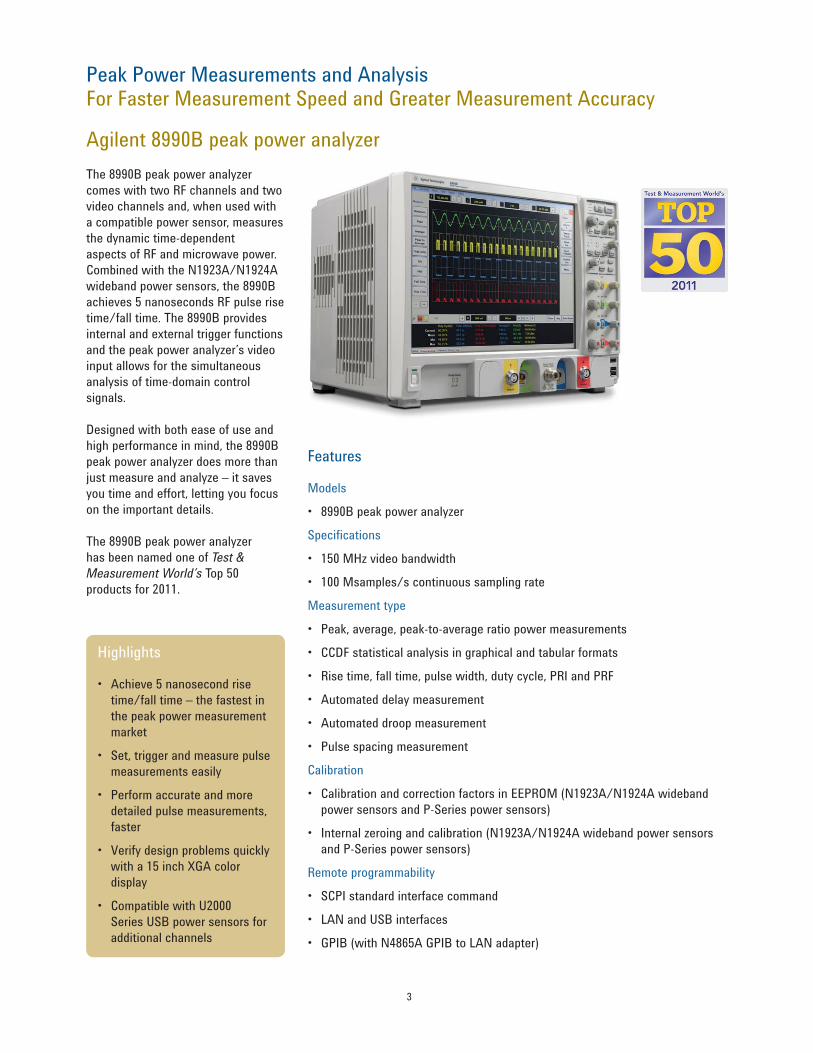
The 8990B peak power analyzer
comes with two RF channels and two
video channels and, when used with
a compatible power sensor, measures
the dynamic time-dependent
aspects of RF and microwave power.
Combined with the N1923A/N1924A
wideband power sensors, the 8990B
achieves 5 nanoseconds RF pulse rise
time/fall time. The 8990B provides
internal and external trigger functions
and the peak power analyzer’s video
input allows for the simultaneous
analysis of time-domain control
signals.
Designed with both ease of use and
high performance in mind, the 8990B
peak power analyzer does more than
just measure and analyze – it saves
you time and effort, letting you focus
on the important details.
The 8990B peak power analyzer
has been named one of Test &
Measurement World’s Top 50
products for 2011.
Features
Models
• 8990B peak power analyzer
Specifications
• 150 MHz video bandwidth
• 100 Msamples/s continuous sampling rate
Measurement type
• Peak, average, peak-to-average ratio power measurements
• CCDF statistical analysis in graphical and tabular formats
• Rise time, fall time, pulse width, duty cycle, PRI and PRF
• Automated delay measurement
• Automated droop measurement
• Pulse spacing measurement
Calibration
• Calibration and correction factors in EEPROM (N1923A/N1924A wideband
power sensors and P-Series power sensors)
• Internal zeroing and calibration (N1923A/N1924A wideband power sensors
and P-Series power sensors)
Remote programmability
• SCPI standard interface command
• LAN and USB interfaces
• GPIB (with N4865A GPIB to LAN adapter)
Highlights
• Achieve 5 nanosecond rise
time/fall time – the fastest in
the peak power measurement
market
• Set, trigger and measure pulse
measurements easily
• Perform accurate and more
detailed pulse measurements,
faster
• Verify design problems quickly
with a 15 inch XGA color
display
• Compatible with U2000
Series USB power sensors for
additional channels
Agilent 8990B peak power analyzer
4
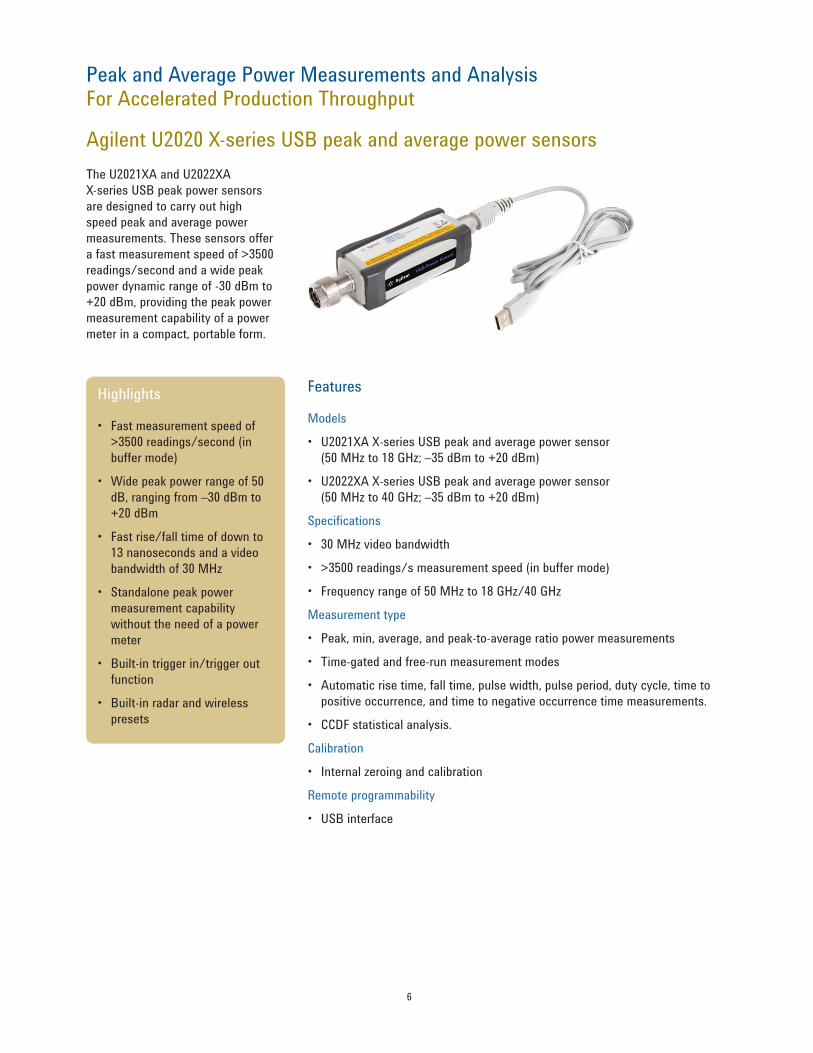
Spacing measurement Easily measure the space between pulses when a long pulse train occurs and
detect abnormalities in certain pulse groups. The 8990B allows users to select
the starting pulse and the end pulse, a function that is important in pulse block
validation.
Peak Power Measurements and AnalysisFor Faster Measurement Speed and Greater Measurement Accuracy
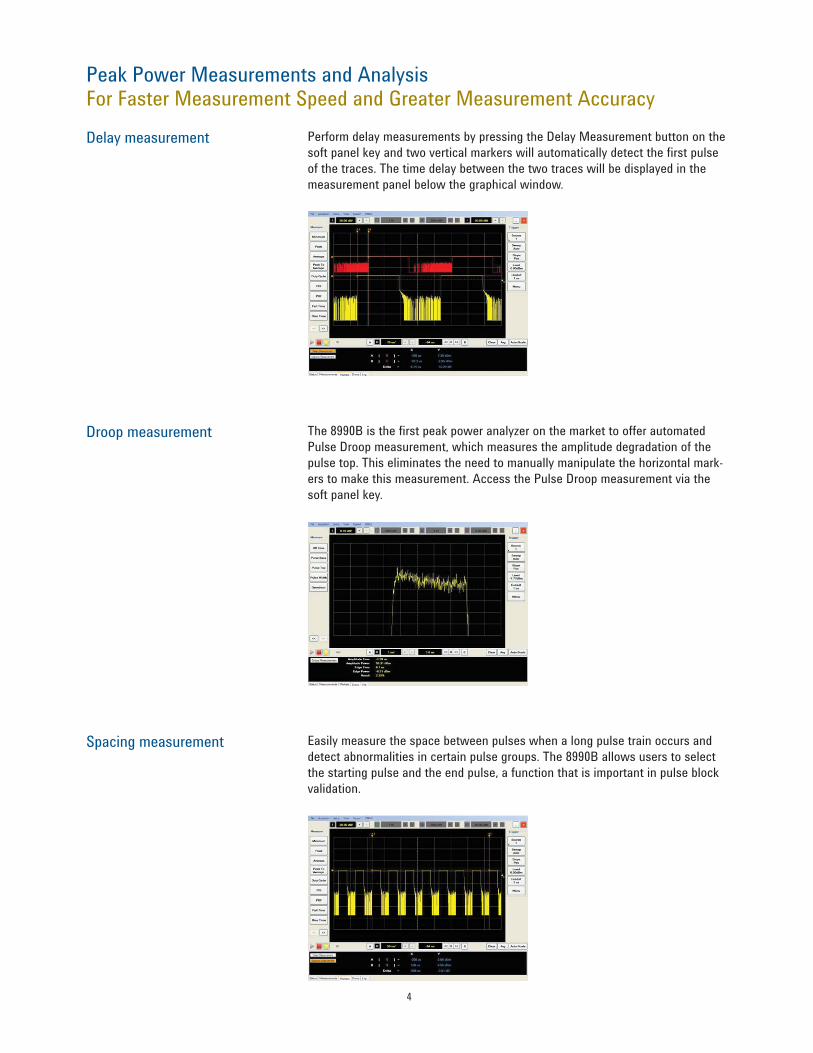
Delay measurement Perform delay measurements by pressing the Delay Measurement button on the
soft panel key and two vertical markers will automatically detect the first pulse
of the traces. The time delay between the two traces will be displayed in the
measurement panel below the graphical window.
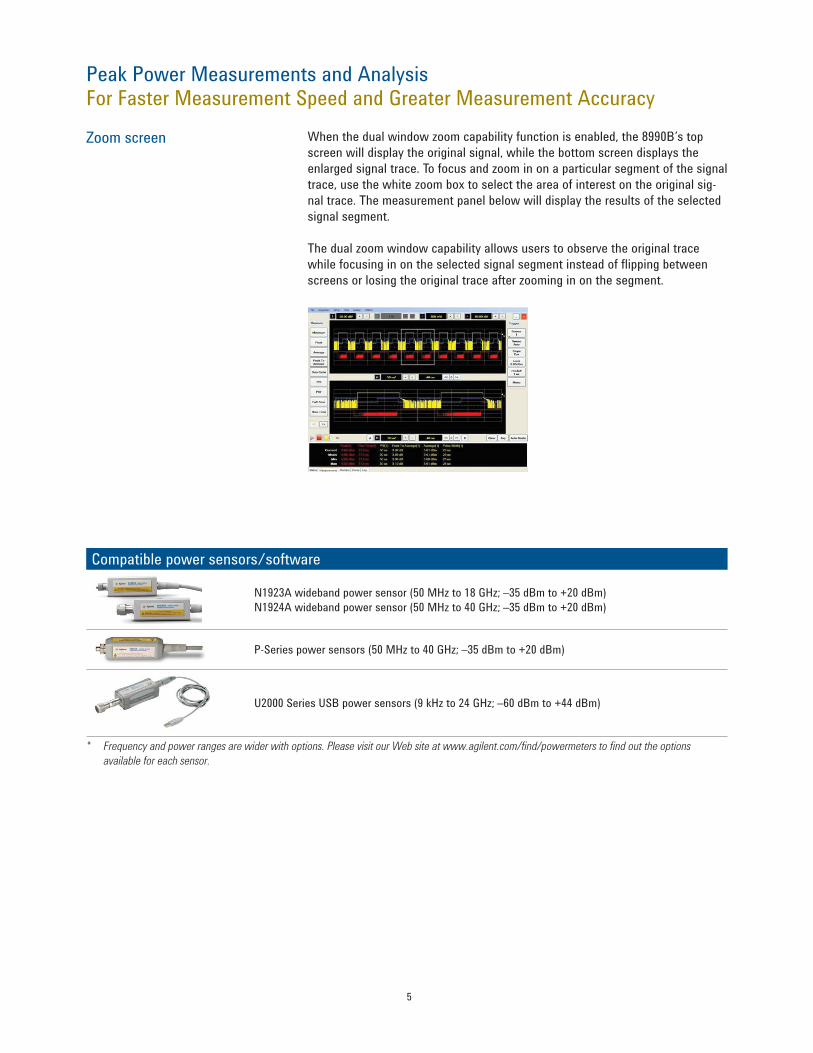
Droop measurement The 8990B is the first peak power analyzer on the market to offer automated
Pulse Droop measurement, which measures the amplitude degradation of the
pulse top. This eliminates the need to manually manipulate the horizontal mark-
ers to make this measurement. Access the Pulse Droop measurement via the
soft panel key.
5
Peak Power Measurements and AnalysisFor Faster Measurement Speed and Greater Measurement Accuracy
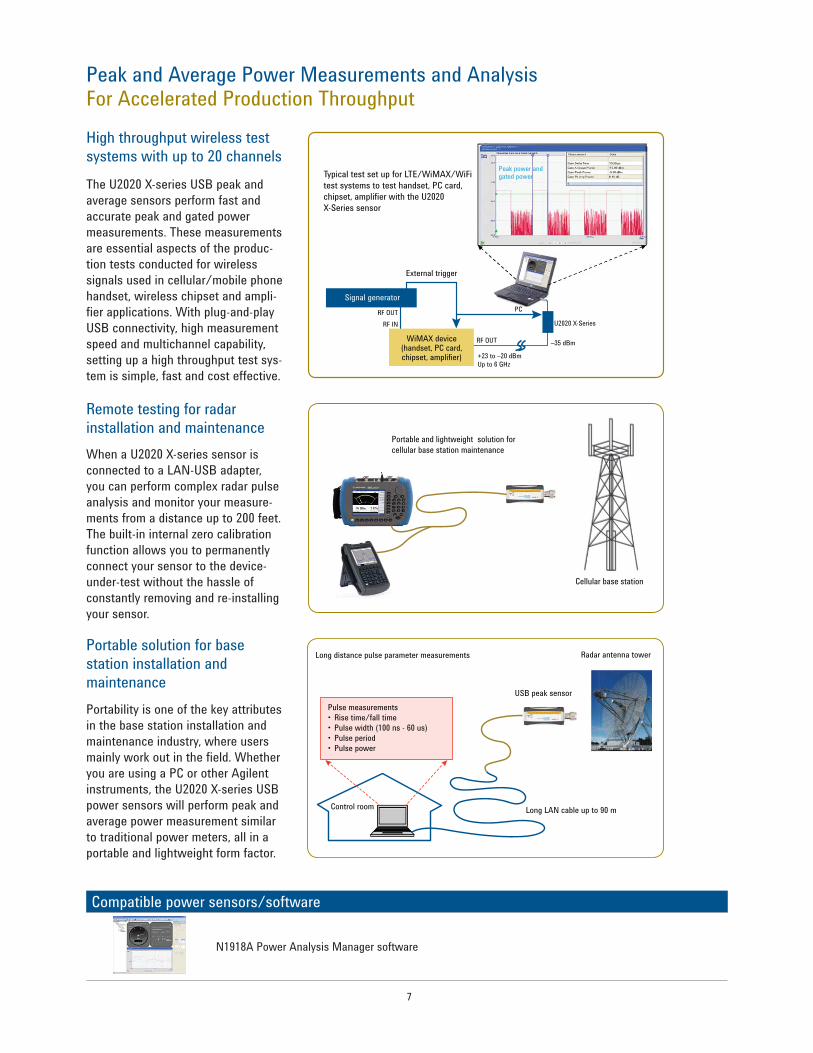
Zoom screen When the dual window zoom capability function is enabled, the 8990B’s top
screen will display the original signal, while the bottom screen displays the
enlarged signal trace. To focus and zoom in on a particular segment of the signal
trace, use the white zoom box to select the area of interest on the original sig-
nal trace. The measurement panel below will display the results of the selected
signal segment.
The dual zoom window capability allows users to observe the original trace
while focusing in on the selected signal segment instead of flipping between
screens or losing the original trace after zooming in on the segment.
Compatible power sensors/software
N1923A wideband power sensor (50 MHz to 18 GHz; –35 dBm to +20 dBm)
N1924A wideband power sensor (50 MHz to 40 GHz; –35 dBm to +20 dBm)
P-Series power sensors (50 MHz to 40 GHz; –35 dBm to +20 dBm)
U2000 Series USB power sensors (9 kHz to 24 GHz; –60 dBm to +44 dBm)
* Frequency and power ranges are wider with options. Please visit our Web site at www.agilent.com/find/powermeters to find out the options
available for each sensor.
6
Peak and Average Power Measurements and AnalysisFor Accelerated Production Throughput
The U2021XA and U2022XA
X-series USB peak power sensors
are designed to carry out high
speed peak and average power
measurements. These sensors offer
a fast measurement speed of >3500
readings/second and a wide peak
power dynamic range of -30 dBm to
+20 dBm, providing the peak power
measurement capability of a power
meter in a compact, portable form.
Features
Models
• U2021XA X-series USB peak and average power sensor
(50 MHz to 18 GHz; –35 dBm to +20 dBm)
• U2022XA X-series USB peak and average power sensor
(50 MHz to 40 GHz; –35 dBm to +20 dBm)
Specifications
• 30 MHz video bandwidth
• >3500 readings/s measurement speed (in buffer mode)
• Frequency range of 50 MHz to 18 GHz/40 GHz
Measurement type
• Peak, min, average, and peak-to-average ratio power measurements
• Time-gated and free-run measurement modes
• Automatic rise time, fall time, pulse width, pulse period, duty cycle, time to
positive occurrence, and time to negative occurrence time measurements.
• CCDF statistical analysis.
Calibration
• Internal zeroing and calibration
Remote programmability
• USB interface
Highlights
• Fast measurement speed of
>3500 readings/second (in
buffer mode)
• Wide peak power range of 50
dB, ranging from –30 dBm to
+20 dBm
• Fast rise/fall time of down to
13 nanoseconds and a video
bandwidth of 30 MHz
• Standalone peak power
measurement capability
without the need of a power
meter
• Built-in trigger in/trigger out
function
• Built-in radar and wireless
presets
Agilent U2020 X-series USB peak and average power sensors
7
Portable solution for base station installation and maintenance
Portability is one of the key attributes
in the base station installation and
maintenance industry, where users
mainly work out in the field. Whether
you are using a PC or other Agilent
instruments, the U2020 X-series USB
power sensors will perform peak and
average power measurement similar
to traditional power meters, all in a
portable and lightweight form factor.
Peak and Average Power Measurements and AnalysisFor Accelerated Production Throughput
High throughput wireless test systems with up to 20 channels
The U2020 X-series USB peak and
average sensors perform fast and
accurate peak and gated power
measurements. These measurements
are essential aspects of the produc-
tion tests conducted for wireless
signals used in cellular/mobile phone
handset, wireless chipset and ampli-
fier applications. With plug-and-play
USB connectivity, high measurement
speed and multichannel capability,
setting up a high throughput test sys-
tem is simple, fast and cost effective.
Remote testing for radar installation and maintenance
When a U2020 X-series sensor is
connected to a LAN-USB adapter,
you can perform complex radar pulse
analysis and monitor your measure-
ments from a distance up to 200 feet.
The built-in internal zero calibration
function allows you to permanently
connect your sensor to the device-
under-test without the hassle of
constantly removing and re-installing
your sensor.
Long distance pulse parameter measurements Radar antenna tower
Long LAN cable up to 90 mControl room
USB peak sensor
Pulse measurements
Typical test set up for LTE/WiMAX/WiFi
test systems to test handset, PC card,
chipset, amplifier with the U2020
X-Series sensor
External trigger
RF IN
PCRF OUT
RF OUT –35 dBm
U2020 X-Series
+23 to –20 dBm
Up to 6 GHz
Signal generator
Peak power and gated power
WiMAX device(handset, PC card,chipset, amplifier)
Portable and lightweight solution for
cellular base station maintenance
Cellular base station
Compatible power sensors/software
N1918A Power Analysis Manager software
8
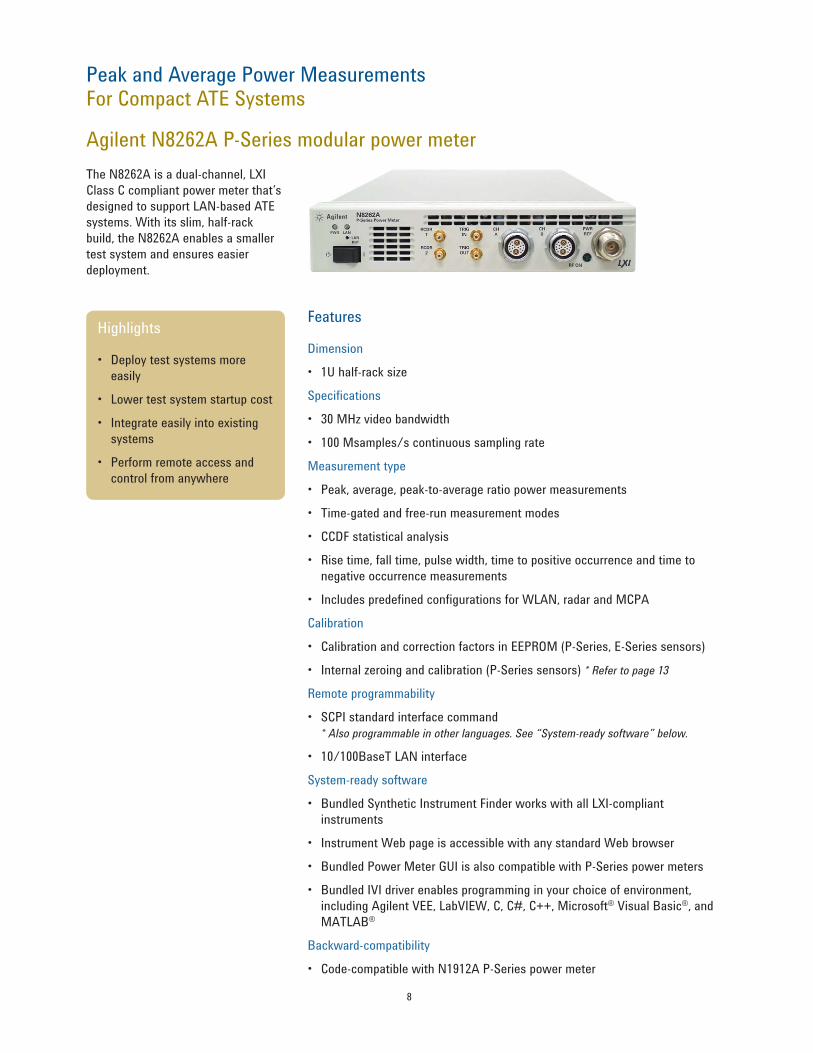
Peak and Average Power MeasurementsFor Compact ATE Systems
The N8262A is a dual-channel, LXI
Class C compliant power meter that’s
designed to support LAN-based ATE
systems. With its slim, half-rack
build, the N8262A enables a smaller
test system and ensures easier
deployment.
Features
Dimension
• 1U half-rack size
Specifications
• 30 MHz video bandwidth
• 100 Msamples/s continuous sampling rate
Measurement type
• Peak, average, peak-to-average ratio power measurements
• Time-gated and free-run measurement modes
• CCDF statistical analysis
• Rise time, fall time, pulse width, time to positive occurrence and time to
negative occurrence measurements
• Includes predefined configurations for WLAN, radar and MCPA
Calibration
• Calibration and correction factors in EEPROM (P-Series, E-Series sensors)
• Internal zeroing and calibration (P-Series sensors) * Refer to page 13
Remote programmability
• SCPI standard interface command
* Also programmable in other languages. See “System-ready software” below.
• 10/100BaseT LAN interface
System-ready software
• Bundled Synthetic Instrument Finder works with all LXI-compliant
instruments
• Instrument Web page is accessible with any standard Web browser
• Bundled Power Meter GUI is also compatible with P-Series power meters
• Bundled IVI driver enables programming in your choice of environment,
including Agilent VEE, LabVIEW, C, C#, C++, Microsoft® Visual Basic®, and
MATLAB®
Backward-compatibility
• Code-compatible with N1912A P-Series power meter
Highlights
• Deploy test systems more
easily
• Lower test system startup cost
• Integrate easily into existing
systems
• Perform remote access and
control from anywhere
Agilent N8262A P-Series modular power meter
9
Peak and Average Power MeasurementsFor Compact ATE Systems
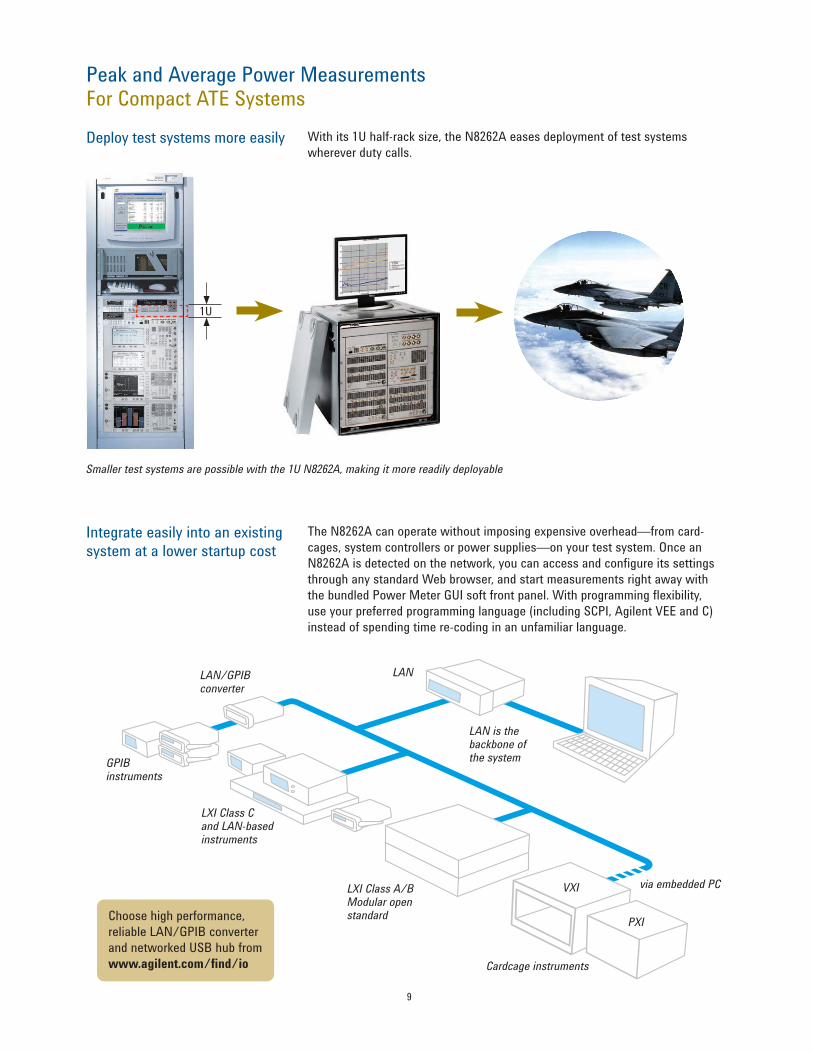
Deploy test systems more easily
Smaller test systems are possible with the 1U N8262A, making it more readily deployable
Integrate easily into an existing system at a lower startup cost
The N8262A can operate without imposing expensive overhead—from card-
cages, system controllers or power supplies—on your test system. Once an
N8262A is detected on the network, you can access and configure its settings
through any standard Web browser, and start measurements right away with
the bundled Power Meter GUI soft front panel. With programming flexibility,
use your preferred programming language (including SCPI, Agilent VEE and C)
instead of spending time re-coding in an unfamiliar language.
1U
via embedded PCVXI
PXI
Cardcage instruments
LXI Class A/B Modular open standard
LXI Class C and LAN-based instruments
GPIB instruments
LAN/GPIB converter
LAN
LAN is the backbone of the system
Choose high performance,
reliable LAN/GPIB converter
and networked USB hub from
www.agilent.com/find/io
With its 1U half-rack size, the N8262A eases deployment of test systems
wherever duty calls.
10
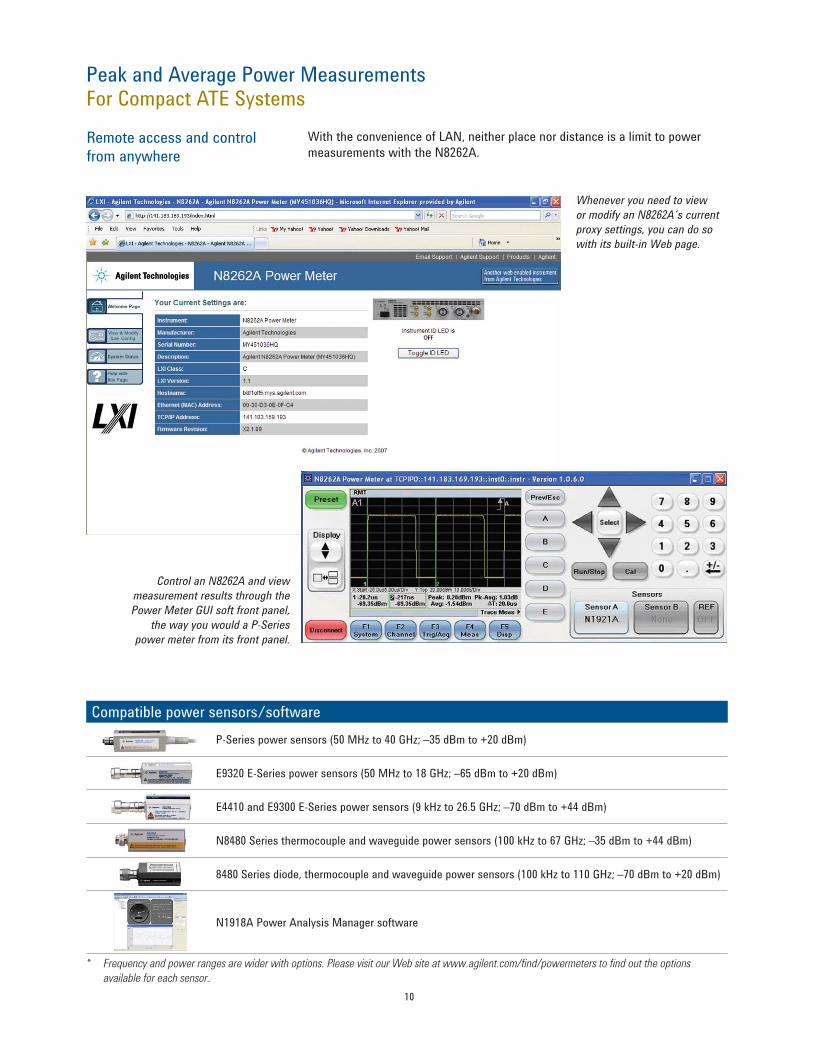
Remote access and control from anywhere
With the convenience of LAN, neither place nor distance is a limit to power
measurements with the N8262A.
Whenever you need to view
or modify an N8262A’s current
proxy settings, you can do so
with its built-in Web page.
Control an N8262A and view
measurement results through the
Power Meter GUI soft front panel,
the way you would a P-Series
power meter from its front panel.
Compatible power sensors/software
P-Series power sensors (50 MHz to 40 GHz; –35 dBm to +20 dBm)
E9320 E-Series power sensors (50 MHz to 18 GHz; –65 dBm to +20 dBm)
E4410 and E9300 E-Series power sensors (9 kHz to 26.5 GHz; –70 dBm to +44 dBm)
N8480 Series thermocouple and waveguide power sensors (100 kHz to 67 GHz; –35 dBm to +44 dBm)
8480 Series diode, thermocouple and waveguide power sensors (100 kHz to 110 GHz; –70 dBm to +20 dBm)
N1918A Power Analysis Manager software
* Frequency and power ranges are wider with options. Please visit our Web site at www.agilent.com/find/powermeters to find out the options
available for each sensor.
Peak and Average Power MeasurementsFor Compact ATE Systems
11
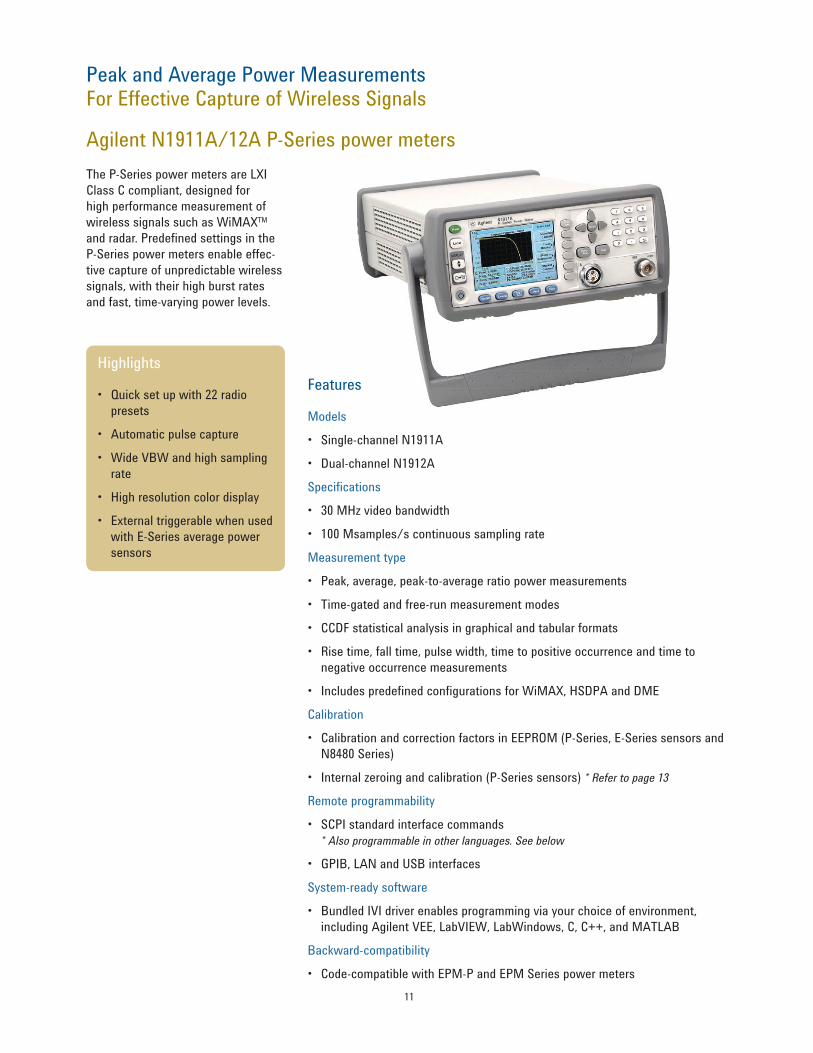
Peak and Average Power MeasurementsFor Effective Capture of Wireless Signals
The P-Series power meters are LXI
Class C compliant, designed for
high performance measurement of
wireless signals such as WiMAX™
and radar. Predefined settings in the
P-Series power meters enable effec-
tive capture of unpredictable wireless
signals, with their high burst rates
and fast, time-varying power levels.
Features
Models
• Single-channel N1911A
• Dual-channel N1912A
Specifications
• 30 MHz video bandwidth
• 100 Msamples/s continuous sampling rate
Measurement type
• Peak, average, peak-to-average ratio power measurements
• Time-gated and free-run measurement modes
• CCDF statistical analysis in graphical and tabular formats
• Rise time, fall time, pulse width, time to positive occurrence and time to
negative occurrence measurements
• Includes predefined configurations for WiMAX, HSDPA and DME
Calibration
• Calibration and correction factors in EEPROM (P-Series, E-Series sensors and
N8480 Series)
• Internal zeroing and calibration (P-Series sensors) * Refer to page 13
Remote programmability
• SCPI standard interface commands
* Also programmable in other languages. See below
• GPIB, LAN and USB interfaces
System-ready software
• Bundled IVI driver enables programming via your choice of environment,
including Agilent VEE, LabVIEW, LabWindows, C, C++, and MATLAB
Backward-compatibility
• Code-compatible with EPM-P and EPM Series power meters
Highlights
• Quick set up with 22 radio
presets
• Automatic pulse capture
• Wide VBW and high sampling
rate
• High resolution color display
• External triggerable when used
with E-Series average power
sensors
Agilent N1911A/12A P-Series power meters
12
Peak and Average Power MeasurementsFor Effective Capture of Wireless Signals
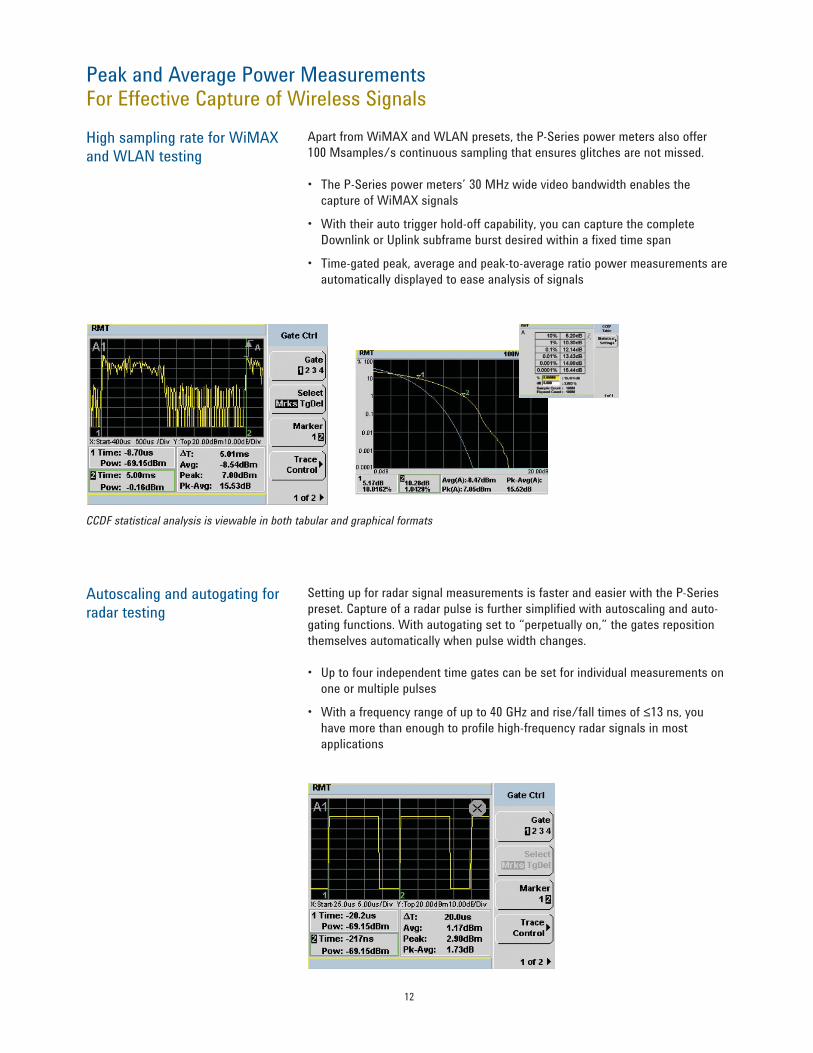
High sampling rate for WiMAX and WLAN testing
Apart from WiMAX and WLAN presets, the P-Series power meters also offer
100 Msamples/s continuous sampling that ensures glitches are not missed.
• The P-Series power meters’ 30 MHz wide video bandwidth enables the
capture of WiMAX signals
• With their auto trigger hold-off capability, you can capture the complete
Downlink or Uplink subframe burst desired within a fixed time span
• Time-gated peak, average and peak-to-average ratio power measurements are
automatically displayed to ease analysis of signals
CCDF statistical analysis is viewable in both tabular and graphical formats
Autoscaling and autogating for radar testing
Setting up for radar signal measurements is faster and easier with the P-Series
preset. Capture of a radar pulse is further simplified with autoscaling and auto-
gating functions. With autogating set to “perpetually on,” the gates reposition
themselves automatically when pulse width changes.
• Up to four independent time gates can be set for individual measurements on
one or multiple pulses
• With a frequency range of up to 40 GHz and rise/fall times of ≤13 ns, you
have more than enough to profile high-frequency radar signals in most
applications
13
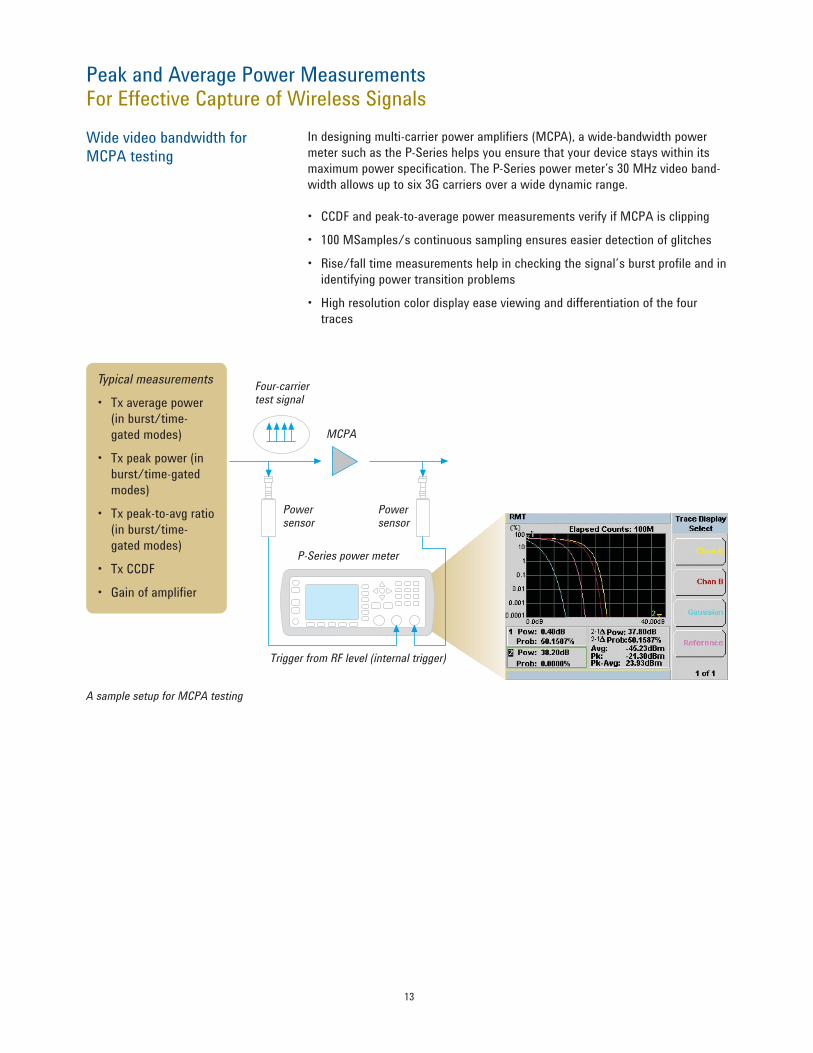
Wide video bandwidth for MCPA testing
In designing multi-carrier power amplifiers (MCPA), a wide-bandwidth power
meter such as the P-Series helps you ensure that your device stays within its
maximum power specification. The P-Series power meter’s 30 MHz video band-
width allows up to six 3G carriers over a wide dynamic range.
• CCDF and peak-to-average power measurements verify if MCPA is clipping
• 100 MSamples/s continuous sampling ensures easier detection of glitches
• Rise/fall time measurements help in checking the signal’s burst profile and in
identifying power transition problems
• High resolution color display ease viewing and differentiation of the four
traces
Peak and Average Power MeasurementsFor Effective Capture of Wireless Signals
Typical measurements
• Tx average power
(in burst/time-
gated modes)
• Tx peak power (in
burst/time-gated
modes)
• Tx peak-to-avg ratio
(in burst/time-
gated modes)
• Tx CCDF
• Gain of amplifier
A sample setup for MCPA testing
Four-carriertest signal
MCPA
Powersensor
Powersensor
Trigger from RF level (internal trigger)
P-Series power meter
14
Peak and Average Power MeasurementsFor Effective Capture of Wireless Signals
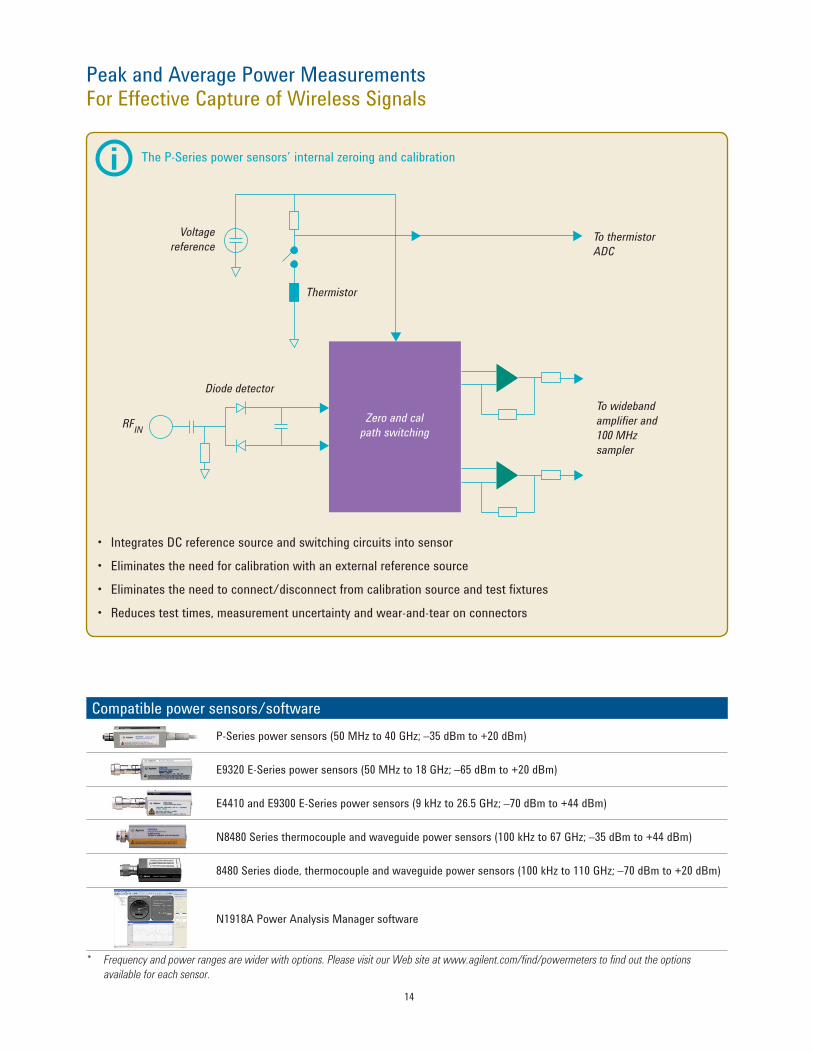
i
Zero and cal
path switching
To wideband
amplifier and
100 MHz
sampler
To thermistor
ADC
Thermistor
Voltage
reference
Diode detector
RFIN
The P-Series power sensors’ internal zeroing and calibration
• Integrates DC reference source and switching circuits into sensor
• Eliminates the need for calibration with an external reference source
• Eliminates the need to connect/disconnect from calibration source and test fixtures
• Reduces test times, measurement uncertainty and wear-and-tear on connectors
Compatible power sensors/software
P-Series power sensors (50 MHz to 40 GHz; –35 dBm to +20 dBm)
E9320 E-Series power sensors (50 MHz to 18 GHz; –65 dBm to +20 dBm)
E4410 and E9300 E-Series power sensors (9 kHz to 26.5 GHz; –70 dBm to +44 dBm)
N8480 Series thermocouple and waveguide power sensors (100 kHz to 67 GHz; –35 dBm to +44 dBm)
8480 Series diode, thermocouple and waveguide power sensors (100 kHz to 110 GHz; –70 dBm to +20 dBm)
N1918A Power Analysis Manager software
* Frequency and power ranges are wider with options. Please visit our Web site at www.agilent.com/find/powermeters to find out the options
available for each sensor.
15
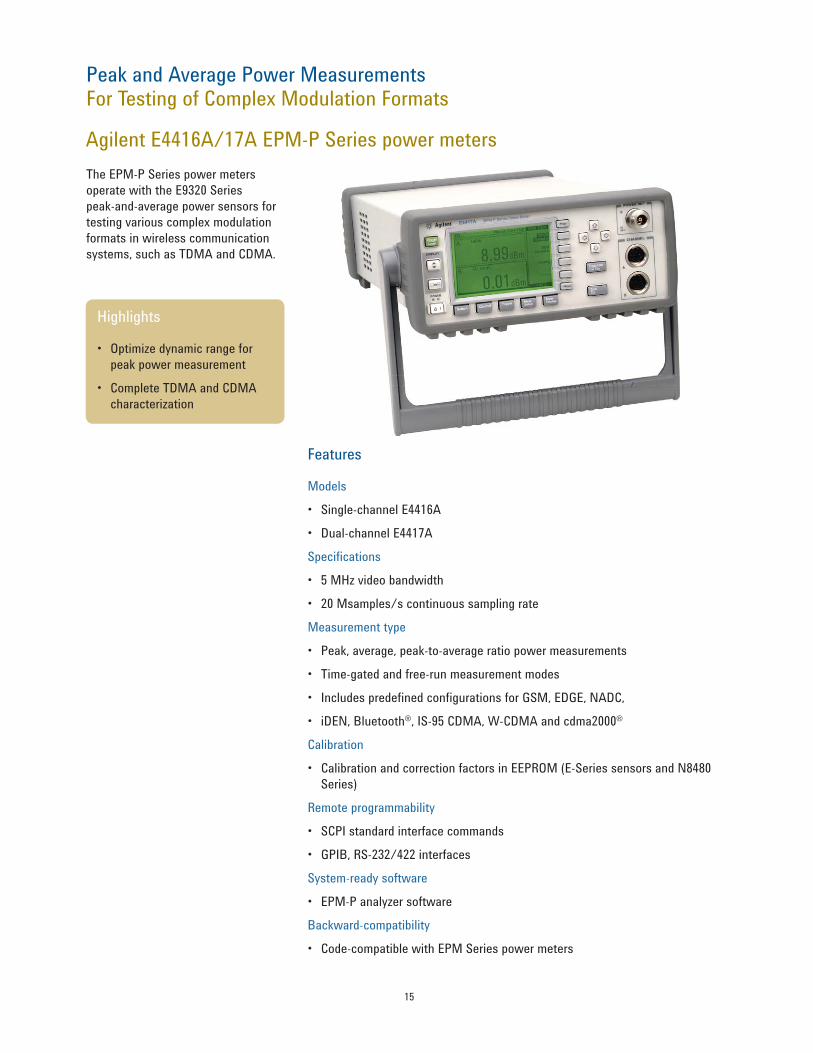
Peak and Average Power MeasurementsFor Testing of Complex Modulation Formats
The EPM-P Series power meters
operate with the E9320 Series
peak-and-average power sensors for
testing various complex modulation
formats in wireless communication
systems, such as TDMA and CDMA.
Features
Models
• Single-channel E4416A
• Dual-channel E4417A
Specifications
• 5 MHz video bandwidth
• 20 Msamples/s continuous sampling rate
Measurement type
• Peak, average, peak-to-average ratio power measurements
• Time-gated and free-run measurement modes
• Includes predefined configurations for GSM, EDGE, NADC,
• iDEN, Bluetooth®, IS-95 CDMA, W-CDMA and cdma2000®
Calibration
• Calibration and correction factors in EEPROM (E-Series sensors and N8480
Series)
Remote programmability
• SCPI standard interface commands
• GPIB, RS-232/422 interfaces
System-ready software
• EPM-P analyzer software
Backward-compatibility
• Code-compatible with EPM Series power meters
Highlights
• Optimize dynamic range for
peak power measurement
• Complete TDMA and CDMA
characterization
Agilent E4416A/17A EPM-P Series power meters
16
Peak and Average Power MeasurementsFor Testing of Complex Modulation Formats
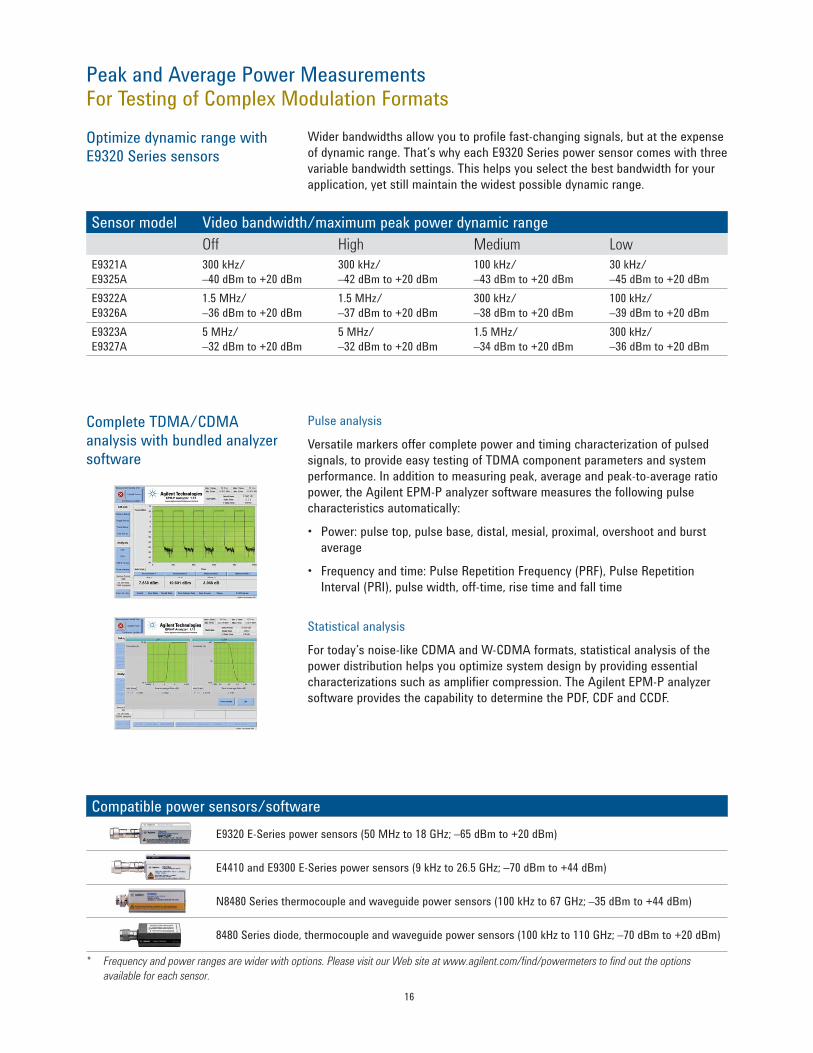
Optimize dynamic range with E9320 Series sensors
Wider bandwidths allow you to profile fast-changing signals, but at the expense
of dynamic range. That’s why each E9320 Series power sensor comes with three
variable bandwidth settings. This helps you select the best bandwidth for your
application, yet still maintain the widest possible dynamic range.
Sensor model Video bandwidth/maximum peak power dynamic range
Off High Medium LowE9321A
E9325A
300 kHz/
–40 dBm to +20 dBm
300 kHz/
–42 dBm to +20 dBm
100 kHz/
–43 dBm to +20 dBm
30 kHz/
–45 dBm to +20 dBm
E9322A
E9326A
1.5 MHz/
–36 dBm to +20 dBm
1.5 MHz/
–37 dBm to +20 dBm
300 kHz/
–38 dBm to +20 dBm
100 kHz/
–39 dBm to +20 dBm
E9323A
E9327A
5 MHz/
–32 dBm to +20 dBm
5 MHz/
–32 dBm to +20 dBm
1.5 MHz/
–34 dBm to +20 dBm
300 kHz/
–36 dBm to +20 dBm
Complete TDMA/CDMA analysis with bundled analyzer software
Pulse analysis
Versatile markers offer complete power and timing characterization of pulsed
signals, to provide easy testing of TDMA component parameters and system
performance. In addition to measuring peak, average and peak-to-average ratio
power, the Agilent EPM-P analyzer software measures the following pulse
characteristics automatically:
• Power: pulse top, pulse base, distal, mesial, proximal, overshoot and burst
average
• Frequency and time: Pulse Repetition Frequency (PRF), Pulse Repetition
Interval (PRI), pulse width, off-time, rise time and fall time
Statistical analysis
For today’s noise-like CDMA and W-CDMA formats, statistical analysis of the
power distribution helps you optimize system design by providing essential
characterizations such as amplifier compression. The Agilent EPM-P analyzer
software provides the capability to determine the PDF, CDF and CCDF.
Compatible power sensors/software
E9320 E-Series power sensors (50 MHz to 18 GHz; –65 dBm to +20 dBm)
E4410 and E9300 E-Series power sensors (9 kHz to 26.5 GHz; –70 dBm to +44 dBm)
N8480 Series thermocouple and waveguide power sensors (100 kHz to 67 GHz; –35 dBm to +44 dBm)
8480 Series diode, thermocouple and waveguide power sensors (100 kHz to 110 GHz; –70 dBm to +20 dBm)
* Frequency and power ranges are wider with options. Please visit our Web site at www.agilent.com/find/powermeters to find out the options
available for each sensor.
17
Peak and Average Power MeasurementsFor Testing of Complex Modulation Formats
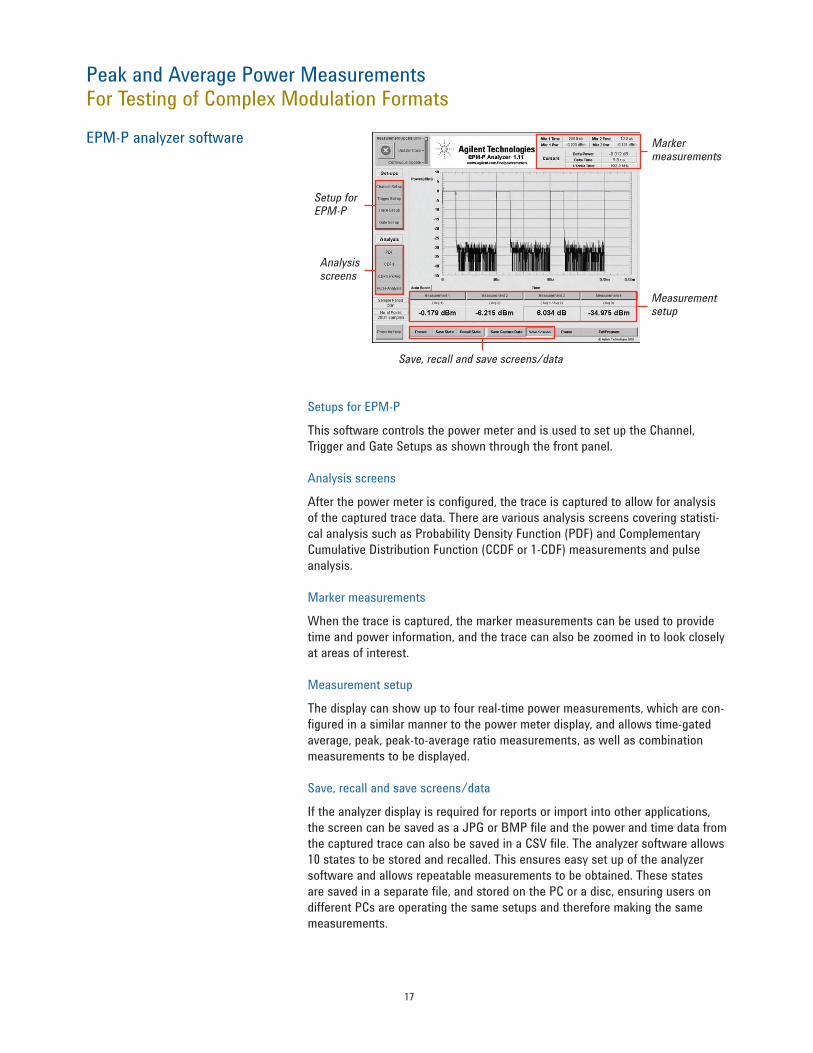
EPM-P analyzer software
Setups for EPM-P
This software controls the power meter and is used to set up the Channel,
Trigger and Gate Setups as shown through the front panel.
Analysis screens
After the power meter is configured, the trace is captured to allow for analysis
of the captured trace data. There are various analysis screens covering statisti-
cal analysis such as Probability Density Function (PDF) and Complementary
Cumulative Distribution Function (CCDF or 1-CDF) measurements and pulse
analysis.
Marker measurements
When the trace is captured, the marker measurements can be used to provide
time and power information, and the trace can also be zoomed in to look closely
at areas of interest.
Measurement setup
The display can show up to four real-time power measurements, which are con-
figured in a similar manner to the power meter display, and allows time-gated
average, peak, peak-to-average ratio measurements, as well as combination
measurements to be displayed.
Save, recall and save screens/data
If the analyzer display is required for reports or import into other applications,
the screen can be saved as a JPG or BMP file and the power and time data from
the captured trace can also be saved in a CSV file. The analyzer software allows
10 states to be stored and recalled. This ensures easy set up of the analyzer
software and allows repeatable measurements to be obtained. These states
are saved in a separate file, and stored on the PC or a disc, ensuring users on
different PCs are operating the same setups and therefore making the same
measurements.
Setup for EPM-P
Analysis screens
Save, recall and save screens/data
Marker measurements
Measurement setup
18
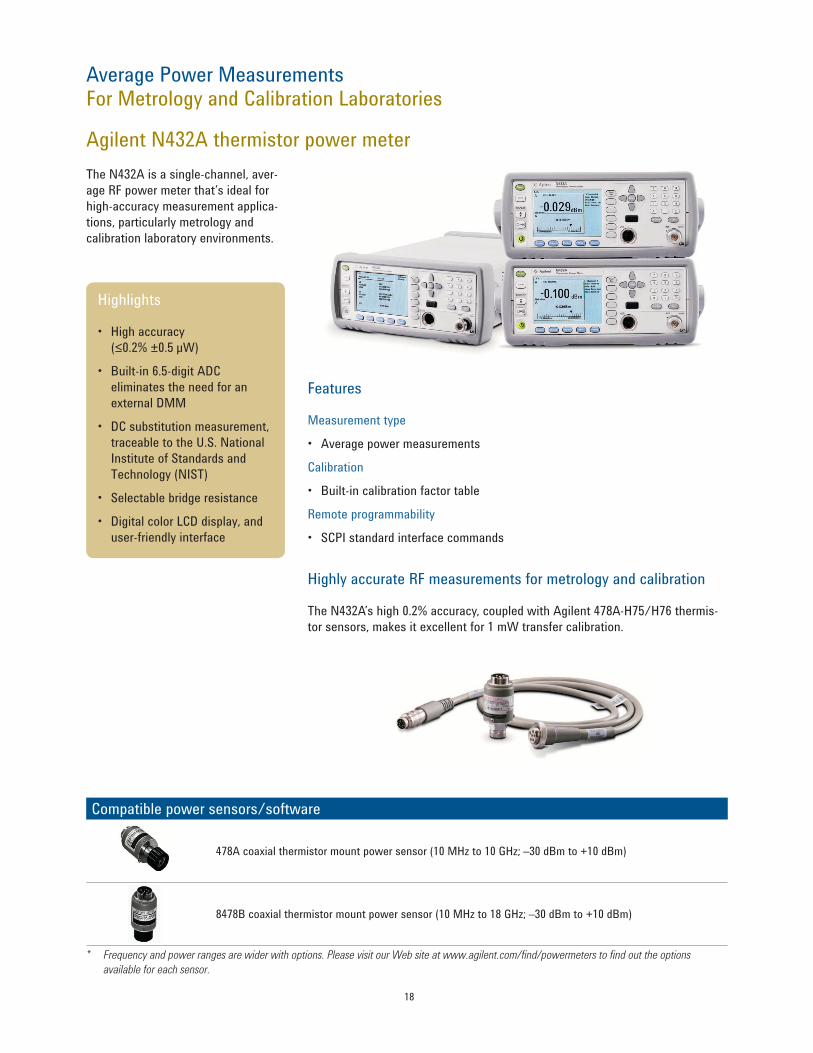
Average Power MeasurementsFor Metrology and Calibration Laboratories
The N432A is a single-channel, aver-
age RF power meter that’s ideal for
high-accuracy measurement applica-
tions, particularly metrology and
calibration laboratory environments.
Highlights
• High accuracy
(≤0.2% ±0.5 μW)
• Built-in 6.5-digit ADC
eliminates the need for an
external DMM
• DC substitution measurement,
traceable to the U.S. National
Institute of Standards and
Technology (NIST)
• Selectable bridge resistance
• Digital color LCD display, and
user-friendly interface
Features
Measurement type
• Average power measurements
Calibration
• Built-in calibration factor table
Remote programmability
• SCPI standard interface commands
Highly accurate RF measurements for metrology and calibration
The N432A’s high 0.2% accuracy, coupled with Agilent 478A-H75/H76 thermis-
tor sensors, makes it excellent for 1 mW transfer calibration.
Compatible power sensors/software
478A coaxial thermistor mount power sensor (10 MHz to 10 GHz; –30 dBm to +10 dBm)
8478B coaxial thermistor mount power sensor (10 MHz to 18 GHz; –30 dBm to +10 dBm)
* Frequency and power ranges are wider with options. Please visit our Web site at www.agilent.com/find/powermeters to find out the options
available for each sensor.
Agilent N432A thermistor power meter
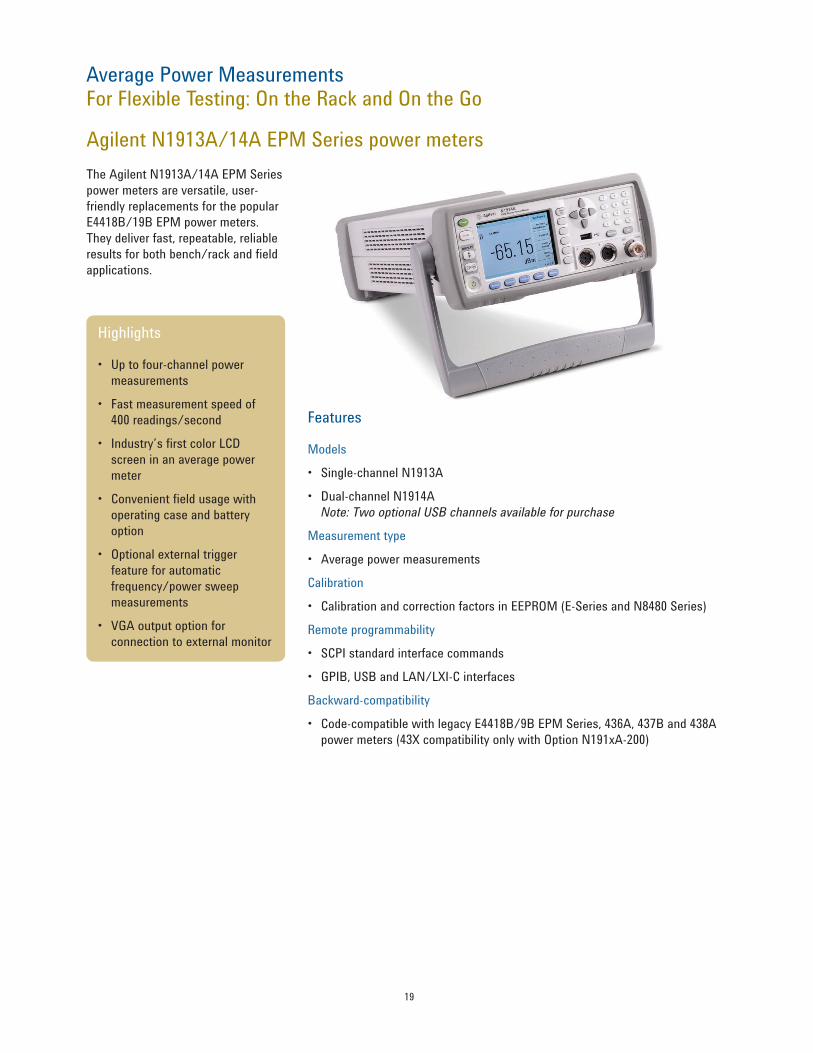
19
The Agilent N1913A/14A EPM Series
power meters are versatile, user-
friendly replacements for the popular
E4418B/19B EPM power meters.
They deliver fast, repeatable, reliable
results for both bench/rack and field
applications.
Highlights
• Up to four-channel power
measurements
• Fast measurement speed of
400 readings/second
• Industry’s first color LCD
screen in an average power
meter
• Convenient field usage with
operating case and battery
option
• Optional external trigger
feature for automatic
frequency/power sweep
measurements
• VGA output option for
connection to external monitor
Features
Models
• Single-channel N1913A
• Dual-channel N1914A
Note: Two optional USB channels available for purchase
Measurement type
• Average power measurements
Calibration
• Calibration and correction factors in EEPROM (E-Series and N8480 Series)
Remote programmability
• SCPI standard interface commands
• GPIB, USB and LAN/LXI-C interfaces
Backward-compatibility
• Code-compatible with legacy E4418B/9B EPM Series, 436A, 437B and 438A
power meters (43X compatibility only with Option N191xA-200)
Average Power MeasurementsFor Flexible Testing: On the Rack and On the Go
Agilent N1913A/14A EPM Series power meters
20
Average Power MeasurementsFor Flexible Testing: On the Rack and On the Go
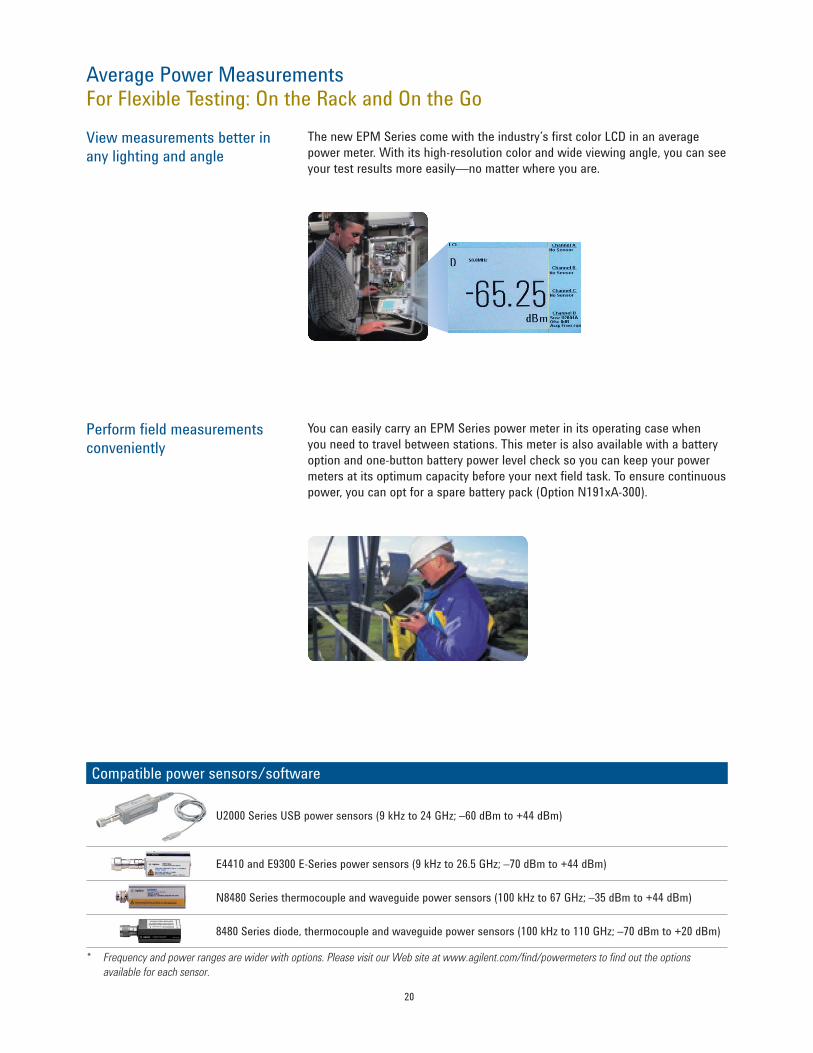
View measurements better in any lighting and angle
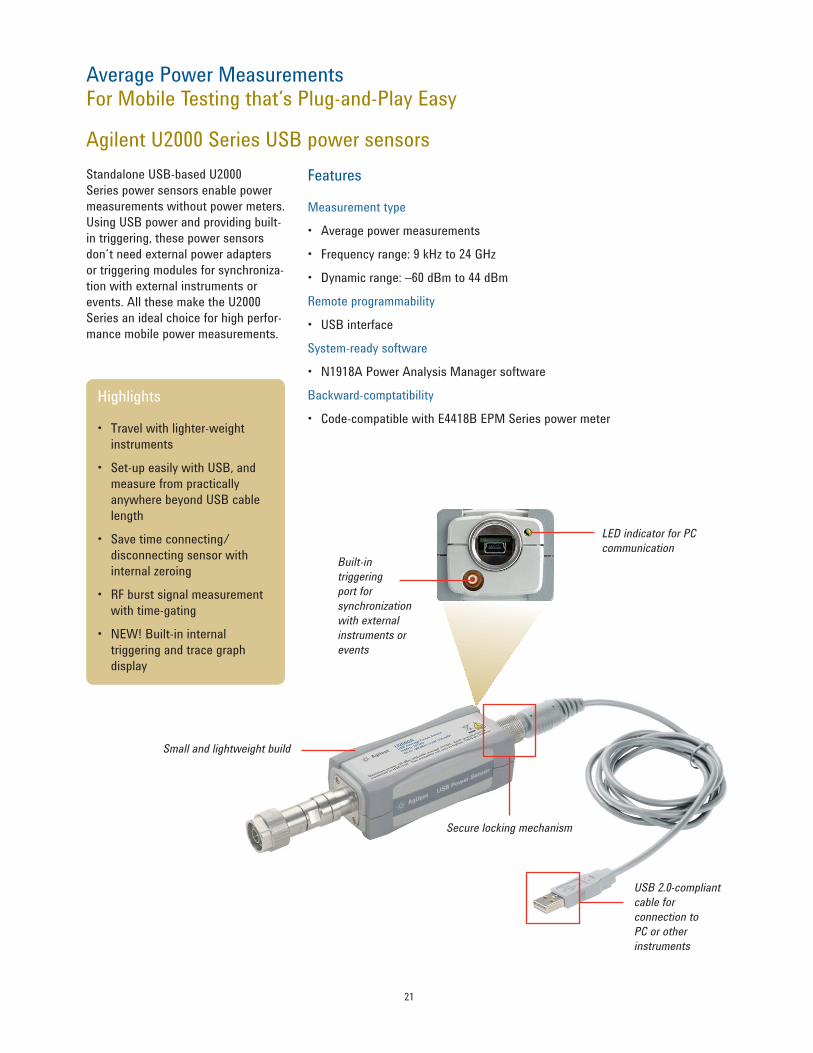
Perform field measurements conveniently
You can easily carry an EPM Series power meter in its operating case when
you need to travel between stations. This meter is also available with a battery
option and one-button battery power level check so you can keep your power
meters at its optimum capacity before your next field task. To ensure continuous
power, you can opt for a spare battery pack (Option N191xA-300).
The new EPM Series come with the industry’s first color LCD in an average
power meter. With its high-resolution color and wide viewing angle, you can see
your test results more easily—no matter where you are.
Compatible power sensors/software
U2000 Series USB power sensors (9 kHz to 24 GHz; –60 dBm to +44 dBm)
E4410 and E9300 E-Series power sensors (9 kHz to 26.5 GHz; –70 dBm to +44 dBm)
N8480 Series thermocouple and waveguide power sensors (100 kHz to 67 GHz; –35 dBm to +44 dBm)
8480 Series diode, thermocouple and waveguide power sensors (100 kHz to 110 GHz; –70 dBm to +20 dBm)
* Frequency and power ranges are wider with options. Please visit our Web site at www.agilent.com/find/powermeters to find out the options
available for each sensor.
21
Average Power MeasurementsFor Mobile Testing that’s Plug-and-Play Easy
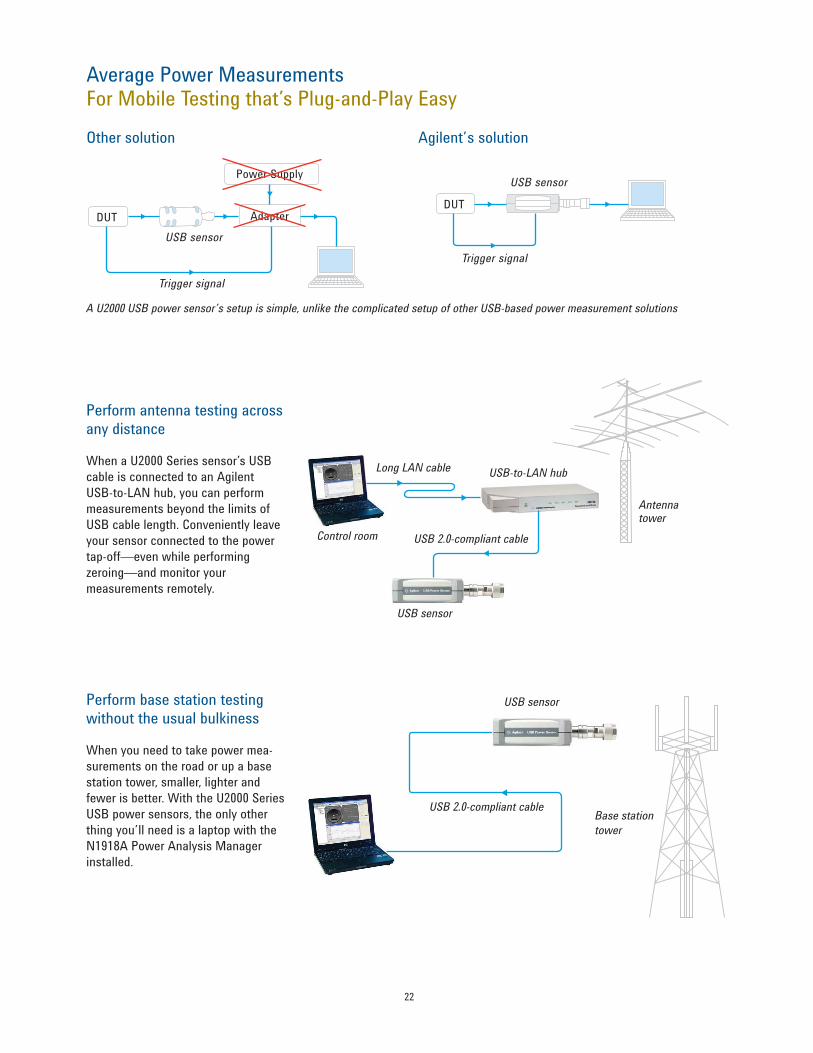
Standalone USB-based U2000
Series power sensors enable power
measurements without power meters.
Using USB power and providing built-
in triggering, these power sensors
don’t need external power adapters
or triggering modules for synchroniza-
tion with external instruments or
events. All these make the U2000
Series an ideal choice for high perfor-
mance mobile power measurements.
Built-in
triggering
port for
synchronization
with external
instruments or
events
LED indicator for PC
communication
Small and lightweight build
Secure locking mechanism
USB 2.0-compliant
cable for
connection to
PC or other
instruments
Features
Measurement type
• Average power measurements
• Frequency range: 9 kHz to 24 GHz
• Dynamic range: –60 dBm to 44 dBm
Remote programmability
• USB interface
System-ready software
• N1918A Power Analysis Manager software
Backward-comptatibility
• Code-compatible with E4418B EPM Series power meter
Highlights
• Travel with lighter-weight
instruments
• Set-up easily with USB, and
measure from practically
anywhere beyond USB cable
length
• Save time connecting/
disconnecting sensor with
internal zeroing
• RF burst signal measurement
with time-gating
• NEW! Built-in internal
triggering and trace graph
display
Agilent U2000 Series USB power sensors
22
Average Power MeasurementsFor Mobile Testing that’s Plug-and-Play Easy
A U2000 USB power sensor’s setup is simple, unlike the complicated setup of other USB-based power measurement solutions
Perform antenna testing across any distance
When a U2000 Series sensor’s USB
cable is connected to an Agilent
USB-to-LAN hub, you can perform
measurements beyond the limits of
USB cable length. Conveniently leave
your sensor connected to the power
tap-off—even while performing
zeroing—and monitor your
measurements remotely.
Perform base station testing without the usual bulkiness
When you need to take power mea-
surements on the road or up a base
station tower, smaller, lighter and
fewer is better. With the U2000 Series
USB power sensors, the only other
thing you’ll need is a laptop with the
N1918A Power Analysis Manager
installed.
USB sensor
USB 2.0-compliant cableBase station
tower
USB sensor
USB 2.0-compliant cable
Long LAN cable USB-to-LAN hub
Control room
Antenna tower
USB sensor
DUT
Power Supply
Adapter
Trigger signal
USB sensor
DUT
Trigger signal
Other solution Agilent’s solution
23
Average Power MeasurementsFor Mobile Testing that’s Plug-and-Play Easy
Reduce sensor connection/disconnection
With a U2000 Series sensor’s internal
zeroing capability, you don’t need to
poweroff the device-under-test or dis-
connect the sensor. This saves test
time and reduces sensor wear-and-
tear—advantages that are especially
crucial in applications where every
second counts, such as manufactur-
ing test. With internal zeroing, the
sensor can be left connected to the
test fixture.
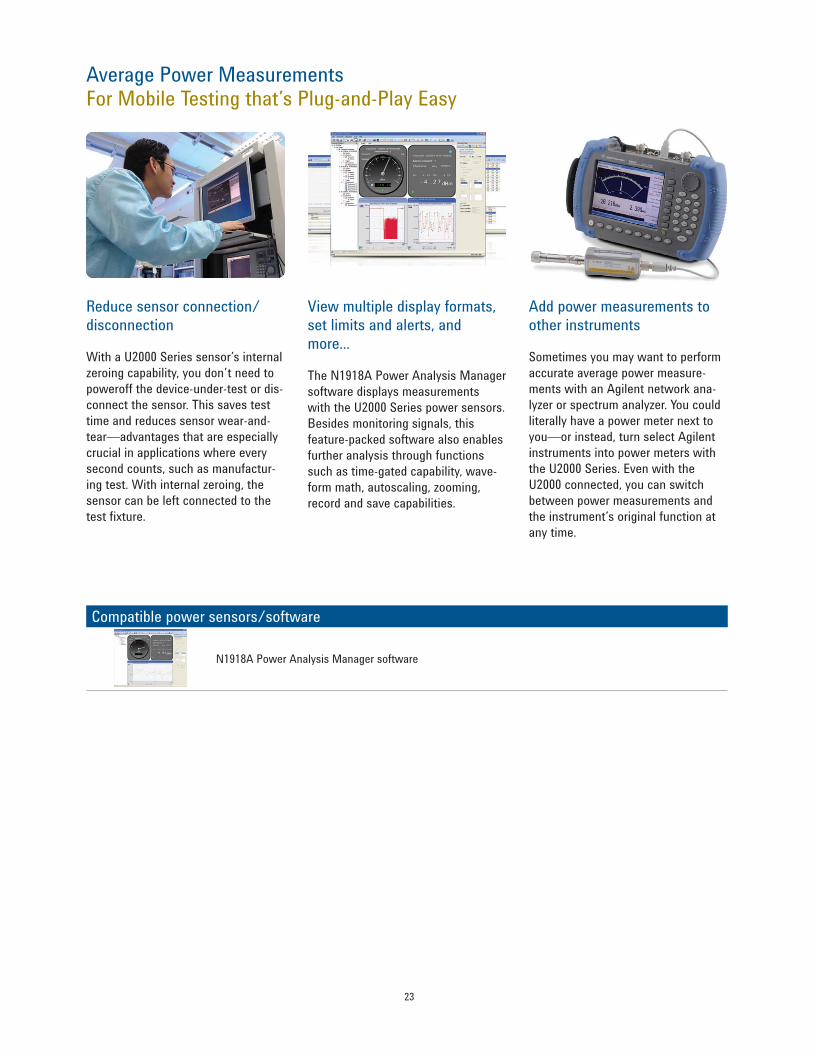
View multiple display formats, set limits and alerts, and more...
The N1918A Power Analysis Manager
software displays measurements
with the U2000 Series power sensors.
Besides monitoring signals, this
feature-packed software also enables
further analysis through functions
such as time-gated capability, wave-
form math, autoscaling, zooming,
record and save capabilities.
Add power measurements to other instruments
Sometimes you may want to perform
accurate average power measure-
ments with an Agilent network ana-
lyzer or spectrum analyzer. You could
literally have a power meter next to
you—or instead, turn select Agilent
instruments into power meters with
the U2000 Series. Even with the
U2000 connected, you can switch
between power measurements and
the instrument’s original function at
any time.
Compatible power sensors/software
N1918A Power Analysis Manager software
24
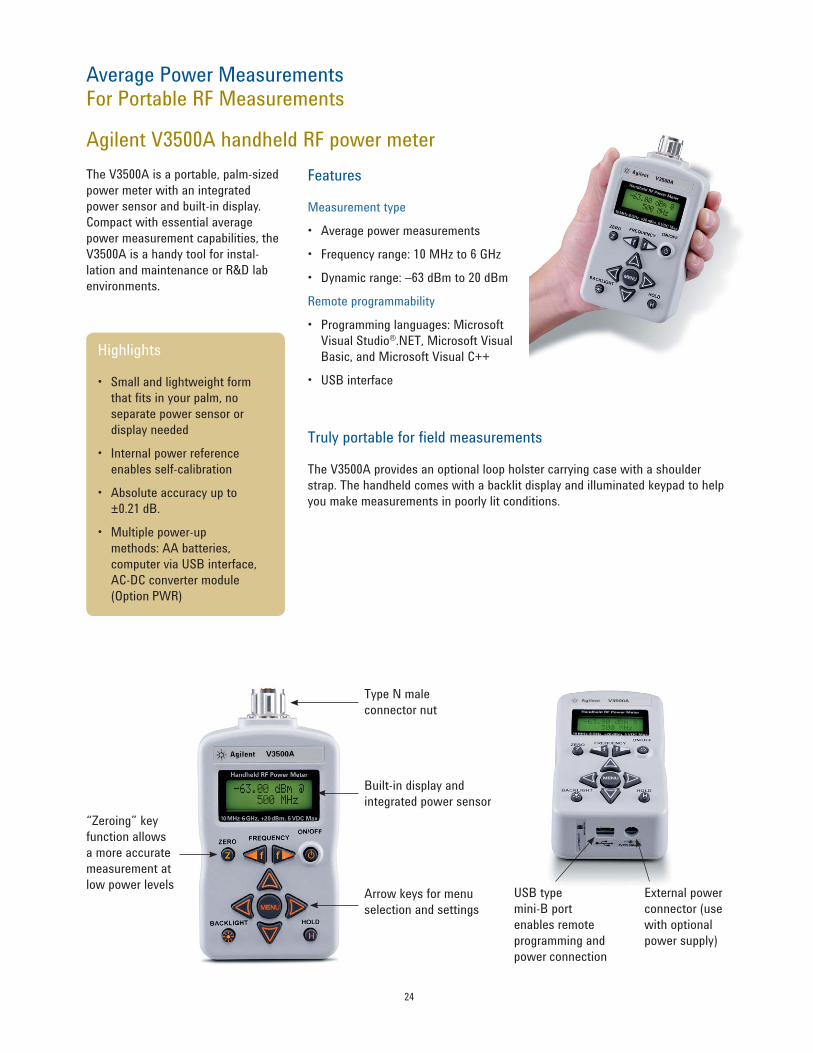
Average Power MeasurementsFor Portable RF Measurements
The V3500A is a portable, palm-sized
power meter with an integrated
power sensor and built-in display.
Compact with essential average
power measurement capabilities, the
V3500A is a handy tool for instal-
lation and maintenance or R&D lab
environments.
Highlights
• Small and lightweight form
that fits in your palm, no
separate power sensor or
display needed
• Internal power reference
enables self-calibration
• Absolute accuracy up to
±0.21 dB.
• Multiple power-up
methods: AA batteries,
computer via USB interface,
AC-DC converter module
(Option PWR)
Features
Measurement type
• Average power measurements
• Frequency range: 10 MHz to 6 GHz
• Dynamic range: –63 dBm to 20 dBm
Remote programmability
• Programming languages: Microsoft
Visual Studio®.NET, Microsoft Visual
Basic, and Microsoft Visual C++
• USB interface
Truly portable for field measurements
The V3500A provides an optional loop holster carrying case with a shoulder
strap. The handheld comes with a backlit display and illuminated keypad to help
you make measurements in poorly lit conditions.
Built-in display and
integrated power sensor
Type N male
connector nut
“Zeroing” key
function allows
a more accurate
measurement at
low power levelsArrow keys for menu
selection and settings
USB type
mini-B port
enables remote
programming and
power connection
External power
connector (use
with optional
power supply)
Agilent V3500A handheld RF power meter
25
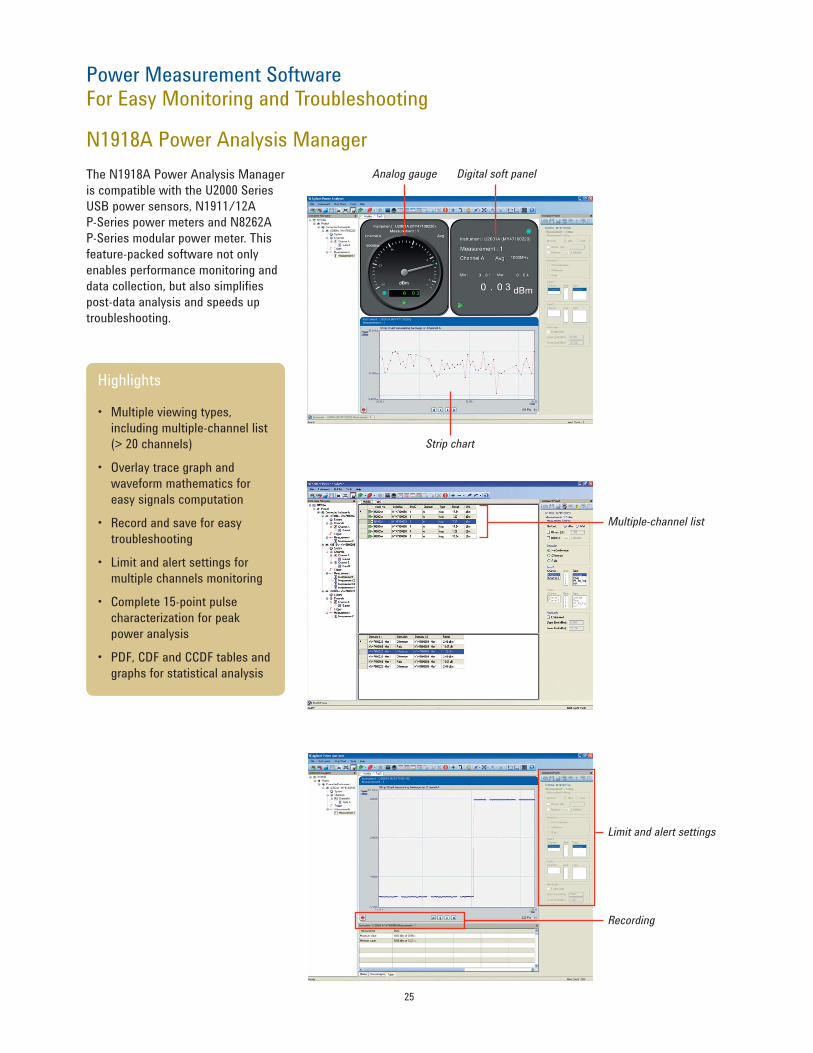
Power Measurement SoftwareFor Easy Monitoring and Troubleshooting
The N1918A Power Analysis Manager
is compatible with the U2000 Series
USB power sensors, N1911/12A
P-Series power meters and N8262A
P-Series modular power meter. This
feature-packed software not only
enables performance monitoring and
data collection, but also simplifies
post-data analysis and speeds up
troubleshooting.
Highlights
• Multiple viewing types,
including multiple-channel list
(> 20 channels)
• Overlay trace graph and
waveform mathematics for
easy signals computation
• Record and save for easy
troubleshooting
• Limit and alert settings for
multiple channels monitoring
• Complete 15-point pulse
characterization for peak
power analysis
• PDF, CDF and CCDF tables and
graphs for statistical analysis
Limit and alert settings
Recording
Multiple-channel list
Analog gauge Digital soft panel
Strip chart
N1918A Power Analysis Manager
26
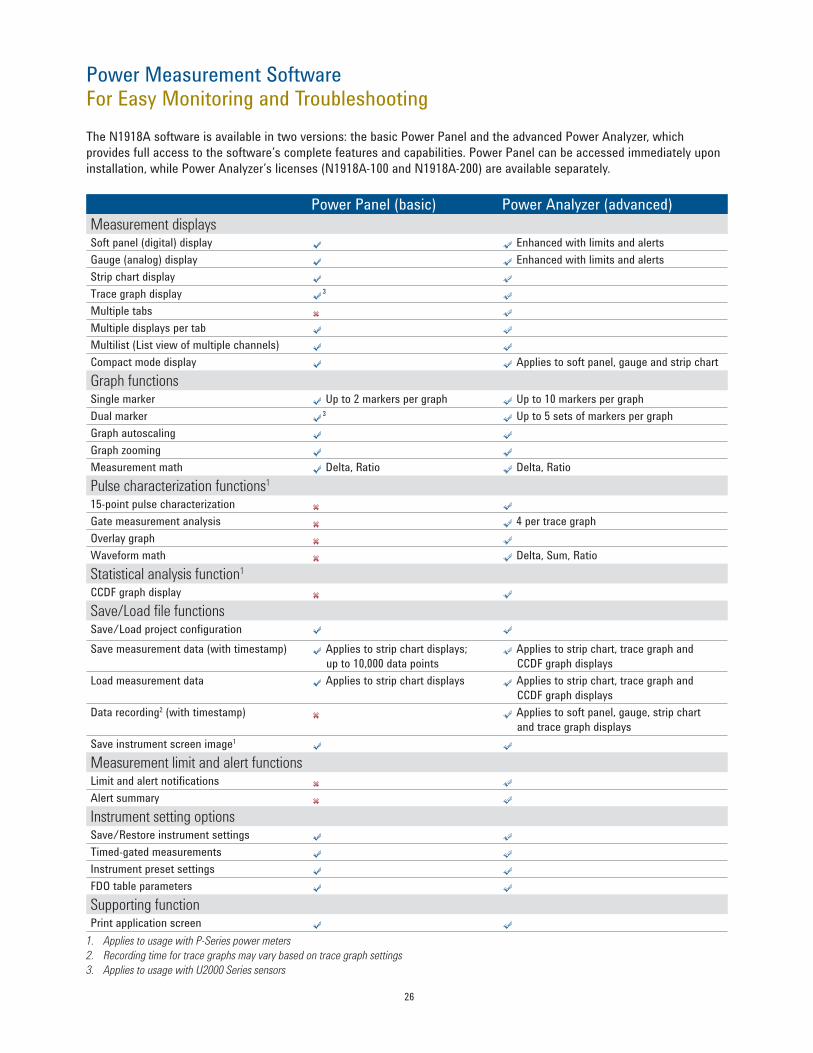
Power Measurement SoftwareFor Easy Monitoring and Troubleshooting
The N1918A software is available in two versions: the basic Power Panel and the advanced Power Analyzer, which
provides full access to the software’s complete features and capabilities. Power Panel can be accessed immediately upon
installation, while Power Analyzer’s licenses (N1918A-100 and N1918A-200) are available separately.
Power Panel (basic) Power Analyzer (advanced)
Measurement displaysSoft panel (digital) display Enhanced with limits and alerts
Gauge (analog) display Enhanced with limits and alerts
Strip chart display
Trace graph display 3
Multiple tabs
Multiple displays per tab
Multilist (List view of multiple channels)
Compact mode display Applies to soft panel, gauge and strip chart
Graph functionsSingle marker Up to 2 markers per graph Up to 10 markers per graph
Dual marker 3 Up to 5 sets of markers per graph
Graph autoscaling
Graph zooming
Measurement math Delta, Ratio Delta, Ratio
Pulse characterization functions1
15-point pulse characterization
Gate measurement analysis 4 per trace graph
Overlay graph
Waveform math Delta, Sum, Ratio
Statistical analysis function1
CCDF graph display
Save/Load file functionsSave/Load project configuration
Save measurement data (with timestamp) Applies to strip chart displays;
up to 10,000 data points
Applies to strip chart, trace graph and
CCDF graph displays
Load measurement data Applies to strip chart displays Applies to strip chart, trace graph and
CCDF graph displays
Data recording2 (with timestamp) Applies to soft panel, gauge, strip chart
and trace graph displays
Save instrument screen image1
Measurement limit and alert functionsLimit and alert notifications
Alert summary
Instrument setting optionsSave/Restore instrument settings
Timed-gated measurements
Instrument preset settings
FDO table parameters
Supporting functionPrint application screen
1. Applies to usage with P-Series power meters
2. Recording time for trace graphs may vary based on trace graph settings
3. Applies to usage with U2000 Series sensors
27
Nav
igat
ion
Bro
adba
nd
Mobi
le
Bro
adca
stC
ellu
lar
Tw
o-W
ayTru
nke
dP
erso
nal
Are
a N
etw
ork
GSM/GPRS/EDGE
Video BW 5 MHz 20 MHz 30 MHz 100 MHz 150 MHz
W-CDMA
HSDPA/HSUPA (FDD)
LTE
TD-SCDMA
HSDPA (TD-SCDMA)
cdmaOne
cdma2000®
1xEV-DO
iDEN/WiDEN
TETRA/TEDS
APCO 25
RFID
ZigBee
Bluetooth 1.2 & EDR
Ultra-Wideband (Bluetooth Future)
DVB-H
ISDB-T
MediaFLO
T-DMB
WiBro
WiMAX
WLAN
MMDS
LMDS
MIMO
GPS
Pt-Pt
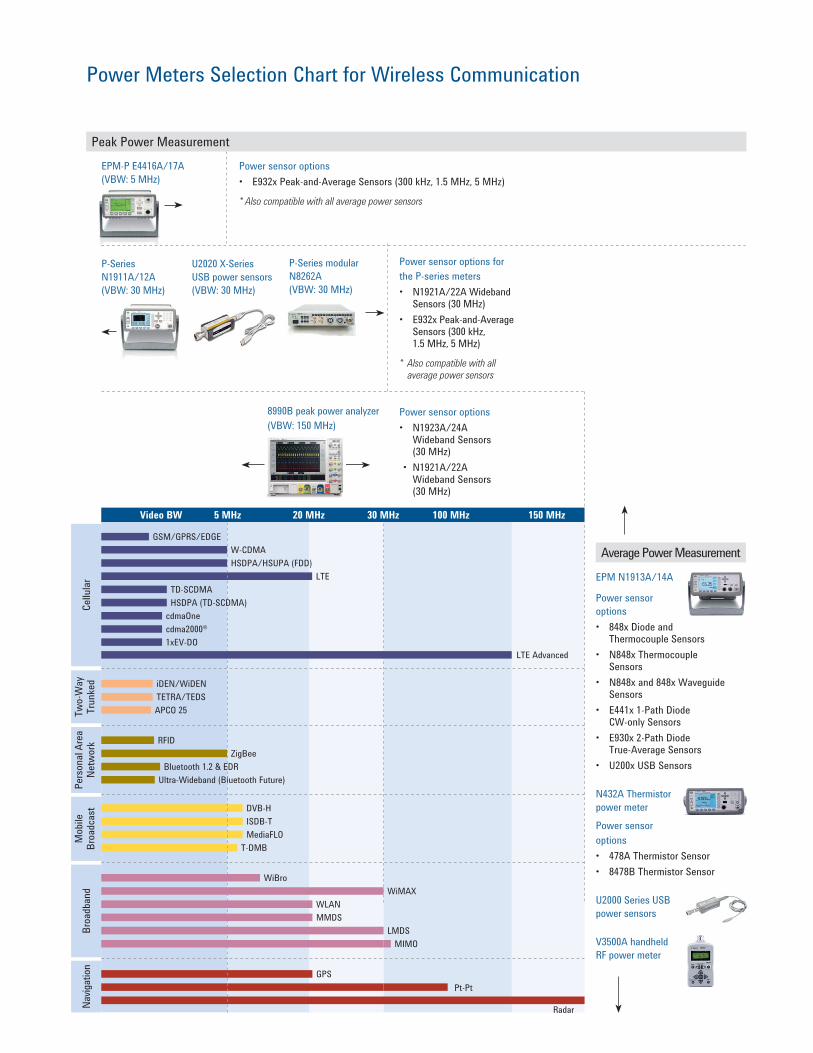
Power sensor options
• E932x Peak-and-Average Sensors (300 kHz, 1.5 MHz, 5 MHz)
* Also compatible with all average power sensors
EPM-P E4416A/17A
(VBW: 5 MHz)
P-Series
N1911A/12A
(VBW: 30 MHz)
U2020 X-Series
USB power sensors
(VBW: 30 MHz)
P-Series modular
N8262A
(VBW: 30 MHz)
Power sensor options for
the P-series meters
• N1921A/22A Wideband Sensors (30 MHz)
• E932x Peak-and-Average Sensors (300 kHz, 1.5 MHz, 5 MHz)
* Also compatible with all average power sensors
Power sensor options
• N1923A/24A Wideband Sensors (30 MHz)
• N1921A/22A Wideband Sensors (30 MHz)
Average Power Measurement
EPM N1913A/14A
Power sensor
options
• 848x Diode and Thermocouple Sensors
• N848x Thermocouple Sensors
• N848x and 848x Waveguide Sensors
• E441x 1-Path Diode CW-only Sensors
• E930x 2-Path Diode True-Average Sensors
• U200x USB Sensors
N432A Thermistor
power meter
Power sensor
options
• 478A Thermistor Sensor
• 8478B Thermistor Sensor
U2000 Series USB
power sensors
V3500A handheld
RF power meter
Peak Power Measurement
Power Meters Selection Chart for Wireless Communication
8990B peak power analyzer
(VBW: 150 MHz)
LTE Advanced
Radar
28
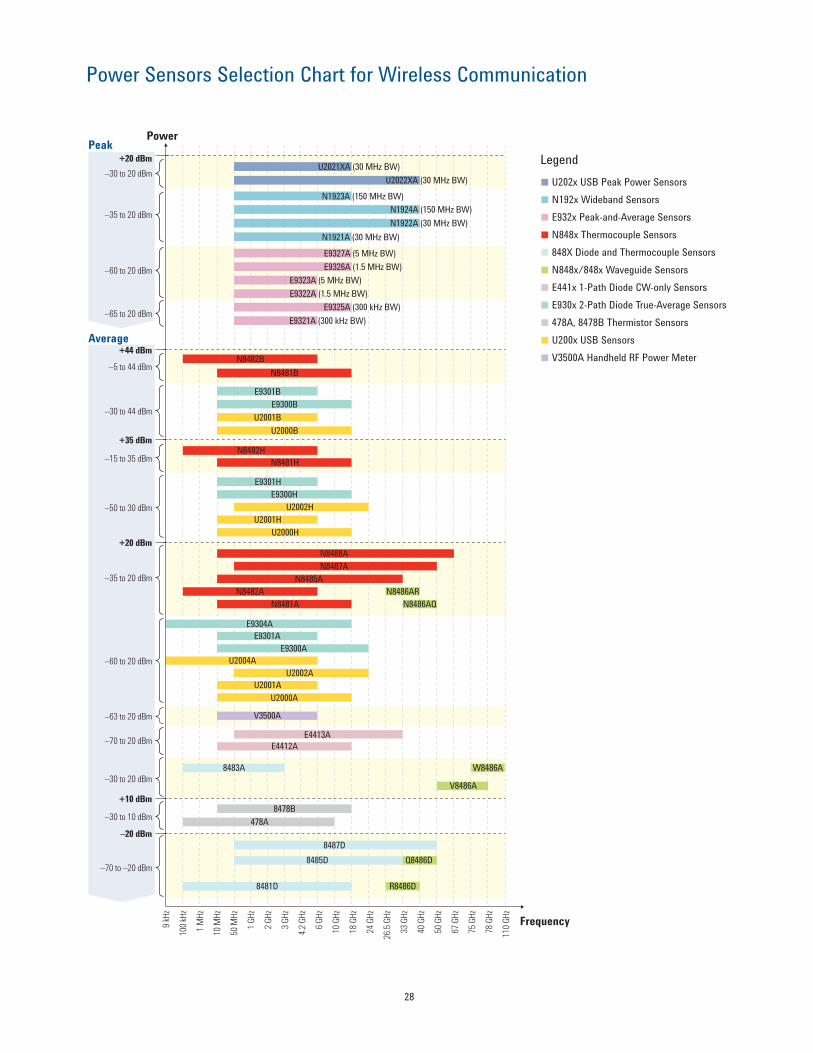
Power Sensors Selection Chart for Wireless Communication
PowerPeak
Average
9 kH
z
100
kHz
1 M
Hz
10 M
Hz
50 M
Hz
1 G
Hz
2 G
Hz
3 G
Hz
4.2
GH
z
6 G
Hz
10 G
Hz
18 G
Hz
24 G
Hz
26.5
GH
z
33 G
Hz
40 G
Hz
50 G
Hz
67 G
Hz
75 G
Hz
78 G
Hz
110
GH
z
–70 to –20 dBm
–20 dBm
–30 to 10 dBm
+10 dBm
–30 to 20 dBm
–70 to 20 dBm
–63 to 20 dBm
–60 to 20 dBm
–35 to 20 dBm
–50 to 30 dBm
–15 to 35 dBm
–30 to 44 dBm
–5 to 44 dBm
–30 to 20 dBm
–65 to 20 dBm
–60 to 20 dBm
–35 to 20 dBm
+20 dBm
+35 dBm
+44 dBm
+20 dBm
Frequency
N1922A (30 MHz BW)
N1921A (30 MHz BW)
N1924A (150 MHz BW)
N1923A (150 MHz BW)
U2022XA (30 MHz BW)
U2021XA (30 MHz BW)
E9327A (5 MHz BW)
E9321A (300 kHz BW)
E9325A (300 kHz BW)
E9322A (1.5 MHz BW)
E9323A (5 MHz BW)
E9326A (1.5 MHz BW)
N8481B
N8482B
E9300B
E9301B
U2001B
U2000B
N8481H
N8482H
E9300H
E9301H
U2002H
U2001H
U2000H
N8488A
N8485A
N8487A
N8482A
N8481A
N8486AR
N8486AQ
U2004A
U2002A
U2000A
U2001A
V3500A
E9300A
E9301A
E4413A
E4412A
E9304A
8487D
Q8486D8485D
R8486D8481D
8483A
8478B
478A
V8486A
W8486A
Legend
■ U202x USB Peak Power Sensors
■ N192x Wideband Sensors
■ E932x Peak-and-Average Sensors
■ N848x Thermocouple Sensors
■ 848X Diode and Thermocouple Sensors
■ N848x/848x Waveguide Sensors
■ E441x 1-Path Diode CW-only Sensors
■ E930x 2-Path Diode True-Average Sensors
■ 478A, 8478B Thermistor Sensors
■ U200x USB Sensors
■ V3500A Handheld RF Power Meter
29
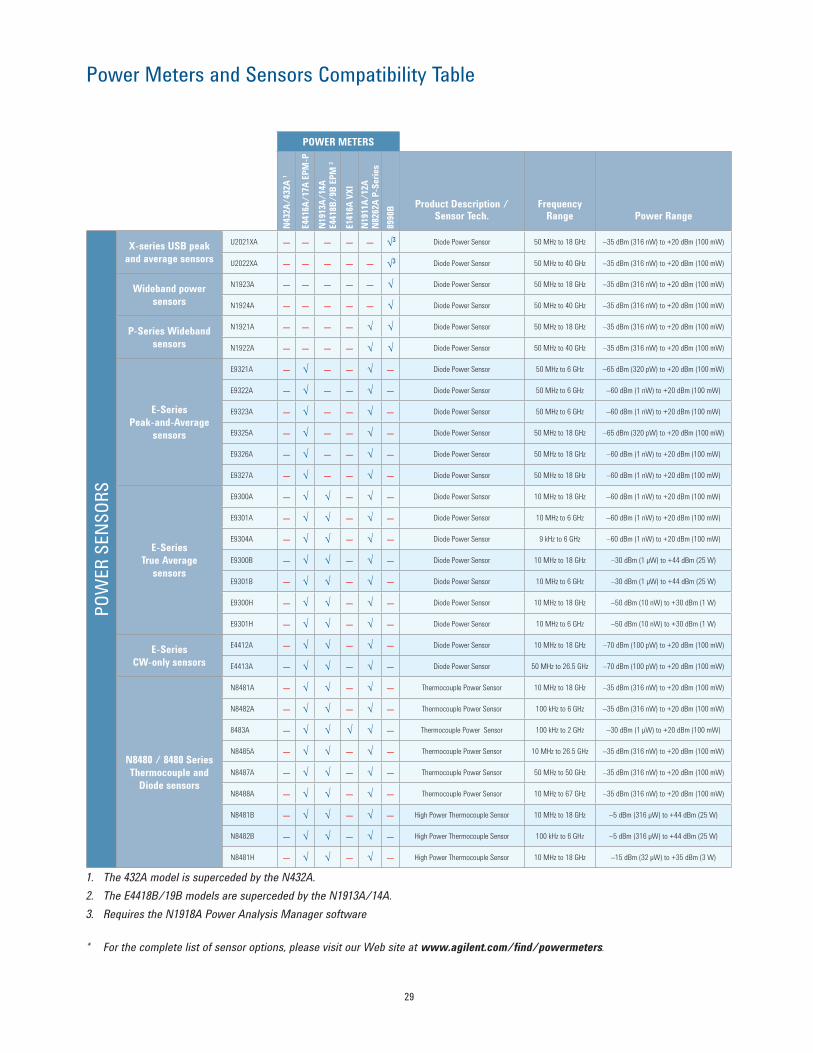
Power Meters and Sensors Compatibility Table
POWER METERS
N43
2A/
432A
1
E441
6A/
17A
EP
M-P
N19
13A
/14
A
E441
8B/
9B E
PM
2
E141
6A V
XI
N19
11A
/12
AN
8262
A P
-Ser
ies
8990
B Product Description /Sensor Tech.
FrequencyRange Power Range
PO
WER
SEN
SO
RS
X-series USB peak
and average sensors
U2021XA – – – – – √3 Diode Power Sensor 50 MHz to 18 GHz –35 dBm (316 nW) to +20 dBm (100 mW)
U2022XA – – – – – √3 Diode Power Sensor 50 MHz to 40 GHz –35 dBm (316 nW) to +20 dBm (100 mW)
Wideband power
sensors
N1923A – – – – – √ Diode Power Sensor 50 MHz to 18 GHz –35 dBm (316 nW) to +20 dBm (100 mW)
N1924A – – – – – √ Diode Power Sensor 50 MHz to 40 GHz –35 dBm (316 nW) to +20 dBm (100 mW)
P-Series Wideband
sensors
N1921A – – – – √ √ Diode Power Sensor 50 MHz to 18 GHz –35 dBm (316 nW) to +20 dBm (100 mW)
N1922A – – – – √ √ Diode Power Sensor 50 MHz to 40 GHz –35 dBm (316 nW) to +20 dBm (100 mW)
E-Series
Peak-and-Average
sensors
E9321A – √ – – √ – Diode Power Sensor 50 MHz to 6 GHz –65 dBm (320 pW) to +20 dBm (100 mW)
E9322A – √ – – √ – Diode Power Sensor 50 MHz to 6 GHz –60 dBm (1 nW) to +20 dBm (100 mW)
E9323A – √ – – √ – Diode Power Sensor 50 MHz to 6 GHz –60 dBm (1 nW) to +20 dBm (100 mW)
E9325A – √ – – √ – Diode Power Sensor 50 MHz to 18 GHz –65 dBm (320 pW) to +20 dBm (100 mW)
E9326A – √ – – √ – Diode Power Sensor 50 MHz to 18 GHz –60 dBm (1 nW) to +20 dBm (100 mW)
E9327A – √ – – √ – Diode Power Sensor 50 MHz to 18 GHz –60 dBm (1 nW) to +20 dBm (100 mW)
E-Series
True Average
sensors
E9300A – √ √ – √ – Diode Power Sensor 10 MHz to 18 GHz –60 dBm (1 nW) to +20 dBm (100 mW)
E9301A – √ √ – √ – Diode Power Sensor 10 MHz to 6 GHz –60 dBm (1 nW) to +20 dBm (100 mW)
E9304A – √ √ – √ – Diode Power Sensor 9 kHz to 6 GHz –60 dBm (1 nW) to +20 dBm (100 mW)
E9300B – √ √ – √ – Diode Power Sensor 10 MHz to 18 GHz –30 dBm (1 µW) to +44 dBm (25 W)
E9301B – √ √ – √ – Diode Power Sensor 10 MHz to 6 GHz –30 dBm (1 µW) to +44 dBm (25 W)
E9300H – √ √ – √ – Diode Power Sensor 10 MHz to 18 GHz –50 dBm (10 nW) to +30 dBm (1 W)
E9301H – √ √ – √ – Diode Power Sensor 10 MHz to 6 GHz –50 dBm (10 nW) to +30 dBm (1 W)
E-Series
CW-only sensors
E4412A – √ √ – √ – Diode Power Sensor 10 MHz to 18 GHz –70 dBm (100 pW) to +20 dBm (100 mW)
E4413A – √ √ – √ – Diode Power Sensor 50 MHz to 26.5 GHz –70 dBm (100 pW) to +20 dBm (100 mW)
N8480 / 8480 Series
Thermocouple and
Diode sensors
N8481A – √ √ – √ – Thermocouple Power Sensor 10 MHz to 18 GHz –35 dBm (316 nW) to +20 dBm (100 mW)
N8482A – √ √ – √ – Thermocouple Power Sensor 100 kHz to 6 GHz –35 dBm (316 nW) to +20 dBm (100 mW)
8483A – √ √ √ √ – Thermocouple Power Sensor 100 kHz to 2 GHz –30 dBm (1 µW) to +20 dBm (100 mW)
N8485A – √ √ – √ – Thermocouple Power Sensor 10 MHz to 26.5 GHz –35 dBm (316 nW) to +20 dBm (100 mW)
N8487A – √ √ – √ – Thermocouple Power Sensor 50 MHz to 50 GHz –35 dBm (316 nW) to +20 dBm (100 mW)
N8488A – √ √ – √ – Thermocouple Power Sensor 10 MHz to 67 GHz –35 dBm (316 nW) to +20 dBm (100 mW)
N8481B – √ √ – √ – High Power Thermocouple Sensor 10 MHz to 18 GHz –5 dBm (316 µW) to +44 dBm (25 W)
N8482B – √ √ – √ – High Power Thermocouple Sensor 100 kHz to 6 GHz –5 dBm (316 µW) to +44 dBm (25 W)
N8481H – √ √ – √ – High Power Thermocouple Sensor 10 MHz to 18 GHz –15 dBm (32 µW) to +35 dBm (3 W)
1. The 432A model is superceded by the N432A.
2. The E4418B/19B models are superceded by the N1913A/14A.
3. Requires the N1918A Power Analysis Manager software
* For the complete list of sensor options, please visit our Web site at www.agilent.com/find/powermeters.
30
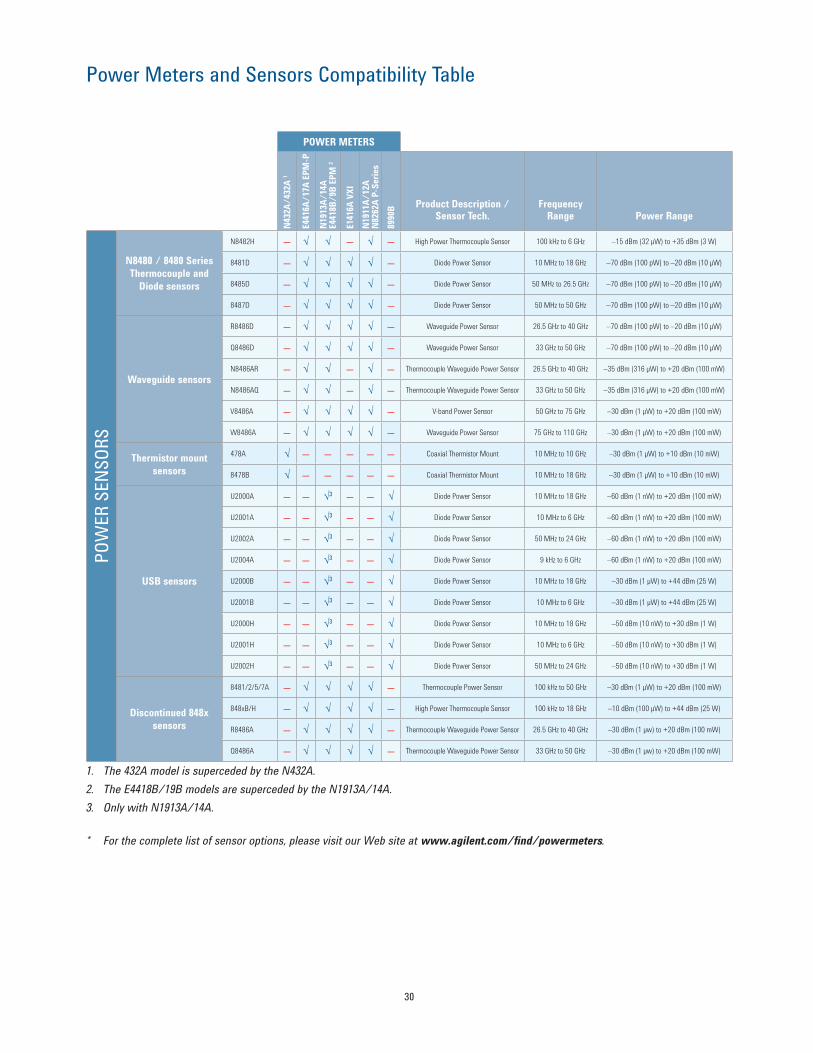
Power Meters and Sensors Compatibility Table
POWER METERS
N43
2A/
432A
1
E441
6A/
17A
EP
M-P
N19
13A
/14
A
E441
8B/
9B E
PM
2
E141
6A V
XI
N19
11A
/12
AN
8262
A P
-Ser
ies
8990
B Product Description /Sensor Tech.
FrequencyRange Power Range
PO
WER
SEN
SO
RS
N8480 / 8480 Series
Thermocouple and
Diode sensors
N8482H – √ √ – √ – High Power Thermocouple Sensor 100 kHz to 6 GHz –15 dBm (32 µW) to +35 dBm (3 W)
8481D – √ √ √ √ – Diode Power Sensor 10 MHz to 18 GHz –70 dBm (100 pW) to –20 dBm (10 µW)
8485D – √ √ √ √ – Diode Power Sensor 50 MHz to 26.5 GHz –70 dBm (100 pW) to –20 dBm (10 µW)
8487D – √ √ √ √ – Diode Power Sensor 50 MHz to 50 GHz –70 dBm (100 pW) to –20 dBm (10 µW)
Waveguide sensors
R8486D – √ √ √ √ – Waveguide Power Sensor 26.5 GHz to 40 GHz –70 dBm (100 pW) to –20 dBm (10 µW)
Q8486D – √ √ √ √ – Waveguide Power Sensor 33 GHz to 50 GHz –70 dBm (100 pW) to –20 dBm (10 µW)
N8486AR – √ √ – √ – Thermocouple Waveguide Power Sensor 26.5 GHz to 40 GHz –35 dBm (316 µW) to +20 dBm (100 mW)
N8486AQ – √ √ – √ – Thermocouple Waveguide Power Sensor 33 GHz to 50 GHz –35 dBm (316 µW) to +20 dBm (100 mW)
V8486A – √ √ √ √ – V-band Power Sensor 50 GHz to 75 GHz –30 dBm (1 µW) to +20 dBm (100 mW)
W8486A – √ √ √ √ – Waveguide Power Sensor 75 GHz to 110 GHz –30 dBm (1 µW) to +20 dBm (100 mW)
Thermistor mount
sensors
478A √ – – – – – Coaxial Thermistor Mount 10 MHz to 10 GHz –30 dBm (1 µW) to +10 dBm (10 mW)
8478B √ – – – – – Coaxial Thermistor Mount 10 MHz to 18 GHz –30 dBm (1 µW) to +10 dBm (10 mW)
USB sensors
U2000A – – √3 – – √ Diode Power Sensor 10 MHz to 18 GHz –60 dBm (1 nW) to +20 dBm (100 mW)
U2001A – – √3 – – √ Diode Power Sensor 10 MHz to 6 GHz –60 dBm (1 nW) to +20 dBm (100 mW)
U2002A – – √3 – – √ Diode Power Sensor 50 MHz to 24 GHz –60 dBm (1 nW) to +20 dBm (100 mW)
U2004A – – √3 – – √ Diode Power Sensor 9 kHz to 6 GHz –60 dBm (1 nW) to +20 dBm (100 mW)
U2000B – – √3 – – √ Diode Power Sensor 10 MHz to 18 GHz –30 dBm (1 µW) to +44 dBm (25 W)
U2001B – – √3 – – √ Diode Power Sensor 10 MHz to 6 GHz –30 dBm (1 µW) to +44 dBm (25 W)
U2000H – – √3 – – √ Diode Power Sensor 10 MHz to 18 GHz –50 dBm (10 nW) to +30 dBm (1 W)
U2001H – – √3 – – √ Diode Power Sensor 10 MHz to 6 GHz –50 dBm (10 nW) to +30 dBm (1 W)
U2002H – – √3 – – √ Diode Power Sensor 50 MHz to 24 GHz –50 dBm (10 nW) to +30 dBm (1 W)
Discontinued 848x
sensors
8481/2/5/7A – √ √ √ √ – Thermocouple Power Sensor 100 kHz to 50 GHz –30 dBm (1 µW) to +20 dBm (100 mW)
848xB/H – √ √ √ √ – High Power Thermocouple Sensor 100 kHz to 18 GHz –10 dBm (100 µW) to +44 dBm (25 W)
R8486A – √ √ √ √ – Thermocouple Waveguide Power Sensor 26.5 GHz to 40 GHz –30 dBm (1 µw) to +20 dBm (100 mW)
Q8486A – √ √ √ √ – Thermocouple Waveguide Power Sensor 33 GHz to 50 GHz –30 dBm (1 µw) to +20 dBm (100 mW)
1. The 432A model is superceded by the N432A.
2. The E4418B/19B models are superceded by the N1913A/14A.
3. Only with N1913A/14A.
* For the complete list of sensor options, please visit our Web site at www.agilent.com/find/powermeters.
31
Publication title Pub number
Application Notes
Agilent P-Series Power Sensor Internal Zeroing and Calibration for RF Power Sensors
Application Note5989-6509EN
Agilent N1911A/N1912A P-Series Power Meters For WiMAX™ Signal Measurements Demo Guide 5989-6423EN
Agilent 4 Steps for Making Better Power Measurements Application Note 64-4D 5965-8167E
Agilent Choosing the Right Power Meter and Sensor Product Note 5968-7150E
Agilent Fundamentals of RF and Microwave Power Measurements Application
Notes 1449-1/2/3/45988-9213/4/5/6EN
Agilent EPM-P Series Power Meters Used in Radar and Pulse Applications Application Note 1438 5988-8522EN
Agilent Compatibility of the U2000 Series USB Power Sensors with Agilent Instruments
Application Note5989-8743EN
Agilent N1918A Radar Pulse Measurement Application Note 5990-3415EN
MIMO Measurement Tips with Agilent P-Series Power Meters and U2000 Series USB Power
Sensors Application Note5990-3546EN
Agilent P-Series and EPM-P Power Meters for Bluetooth Testing Technical Overview and
Self-Guided Demonstration5989-8459EN
Agilent Maximizing Measurement Speed Using P-Series Power Meters Application Note 5989-7678EN
Agilent Using Linux® To Control the U2000 Series USB Power Sensors Product Note 5989-8744EN
Related Agilent Literature
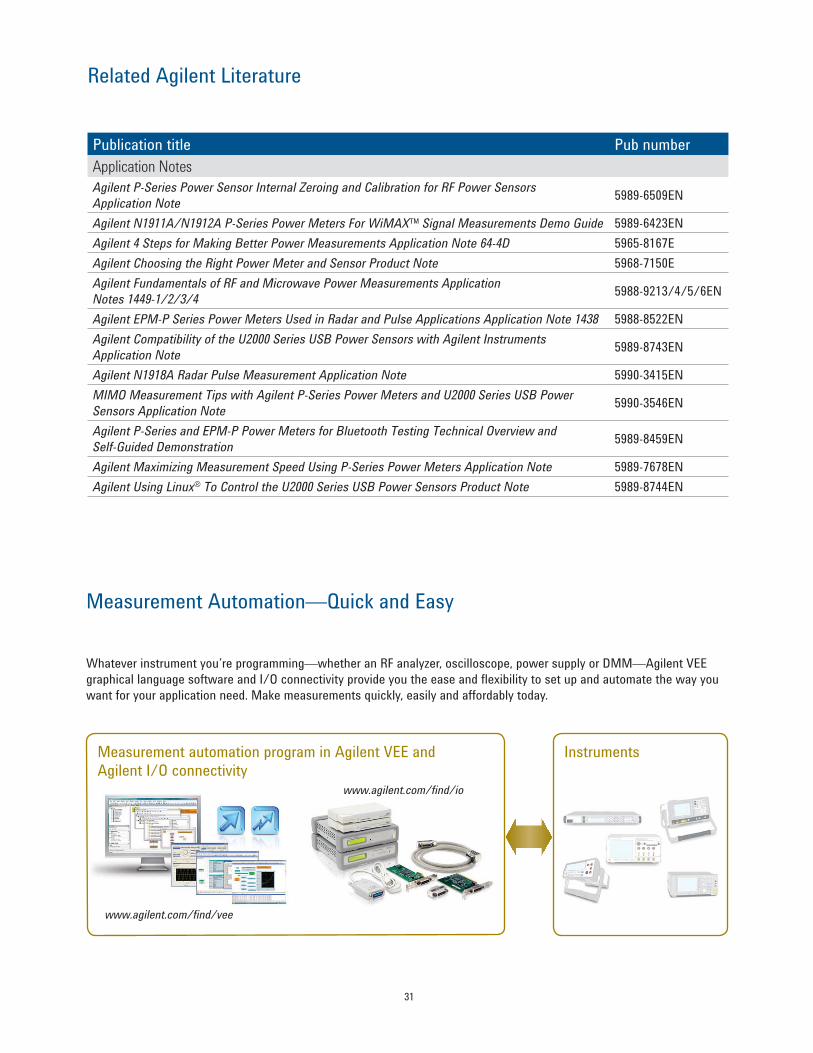
Measurement Automation—Quick and Easy
Whatever instrument you’re programming—whether an RF analyzer, oscilloscope, power supply or DMM—Agilent VEE
graphical language software and I/O connectivity provide you the ease and flexibility to set up and automate the way you
want for your application need. Make measurements quickly, easily and affordably today.
Measurement automation program in Agilent VEE and Agilent I/O connectivity
www.agilent.com/find/vee
www.agilent.com/find/io
Instruments
Microsoft is a registered trademark of
Microsoft Corporation in the United States
and/or other countries.
Visual Basic is a registered trademark of
Microsoft Corporation in the United States
and/or other countries.
Visual Studio is a registered trademark of
Microsoft Corporation in the United States
and/or other countries.
MATLAB is a registered trademark of The
MathWorks, Inc.
Bluetooth is a trademark owned by Bluetooth
SIG, Inc., U.S.A. and licensed to Agilent
Technologies, Inc.
cdma2000 is a registered certification mark of
the Telecommunications Industry Association.
Used under license.
WiMAX is a trademark of the WiMAX Forum.
Agilent Email Updates
www.agilent.com/find/emailupdates
Get the latest information on the
products and applications you select.
www.lxistandard.org
LAN eXtensions for Instruments puts
the power of Ethernet and the Web
inside your test systems. Agilent
is a founding member of the LXI
consortium.
Agilent Channel Partners
www.agilent.com/find/channelpartners
Get the best of both worlds: Agilent’s
measurement expertise and product
breadth, combined with channel
partner convenience.
For more information on Agilent Technologies’ products, applications or services, please contact your local Agilent
office. The complete list is available at:
www.agilent.com/find/contactus
AmericasCanada (877) 894 4414 Brazil (11) 4197 3600Mexico 01800 5064 800 United States (800) 829 4444
Asia PacificAustralia 1 800 629 485China 800 810 0189Hong Kong 800 938 693India 1 800 112 929Japan 0120 (421) 345Korea 080 769 0800Malaysia 1 800 888 848Singapore 1 800 375 8100Taiwan 0800 047 866Other AP Countries (65) 375 8100
Europe & Middle EastBelgium 32 (0) 2 404 93 40 Denmark 45 45 80 12 15Finland 358 (0) 10 855 2100France 0825 010 700* *0.125 €/minute
Germany 49 (0) 7031 464 6333 Ireland 1890 924 204Israel 972-3-9288-504/544Italy 39 02 92 60 8484Netherlands 31 (0) 20 547 2111Spain 34 (91) 631 3300Sweden 0200-88 22 55United Kingdom 44 (0) 118 927 6201
For other unlisted countries: www.agilent.com/find/contactusRevised: January 6, 2012
Product specifications and descriptions in this document subject to change without notice.
© Agilent Technologies, Inc. 2012Published in USA, June 13, 20125989-6240EN
www.agilent.com
Agilent Advantage Services is committed
to your success throughout your equip-
ment’s lifetime. To keep you competitive,
we continually invest in tools and
processes that speed up calibration and
repair and reduce your cost of ownership.
You can also use Infoline Web Services
to manage equipment and services more
effectively. By sharing our measurement
and service expertise, we help you create
the products that change our world.
www.agilent.com/quality
www.agilent.com/find/advantageservices
www.axiestandard.org
AdvancedTCA® Extensions for
Instrumentation and Test (AXIe) is
an open standard that extends the
AdvancedTCA for general purpose
and semiconductor test. Agilent
is a founding member of the AXIe
consortium.
www.pxisa.org
PCI eXtensions for Instrumentation
(PXI) modular instrumentation
delivers a rugged, PC-based high-
performance measurement and
automation system.
Quality Management SystemQuality Management SysISO 9001:2008
Agilent Electronic Measurement Group
DEKRA Certified
www.agilent.com/find/powermeter