Embed Size (px)
Citation preview
18 April 2023
An Overview of Measurement Models and Perceptions of Ad Effectiveness.
Hannah Bewley, Research Manager, IAB
iabuk.net/hannah
Agenda
•Setting the scene – size of the market
•Say no to CTR’s!
•Measuring ad effectiveness
•Examples from our research
•Summary and conclusions
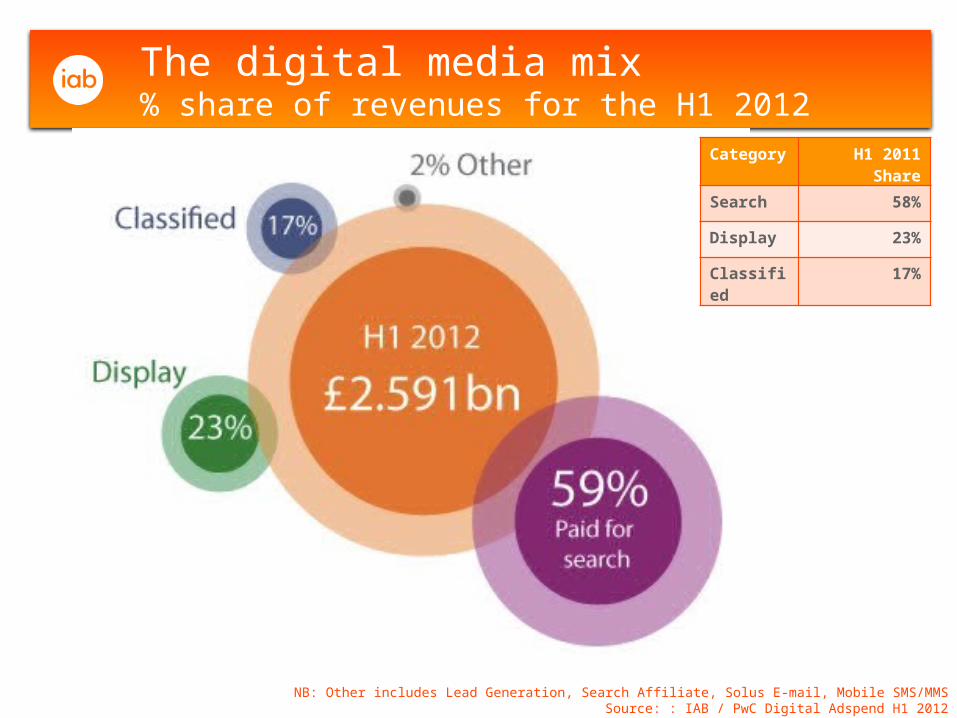
The digital media mix% share of revenues for the H1 2012
NB: Other includes Lead Generation, Search Affiliate, Solus E-mail, Mobile SMS/MMSSource: : IAB / PwC Digital Adspend H1 2012
Category
H1 2011 Share
Search 58%
Display 23%
Classified
17%
CTR
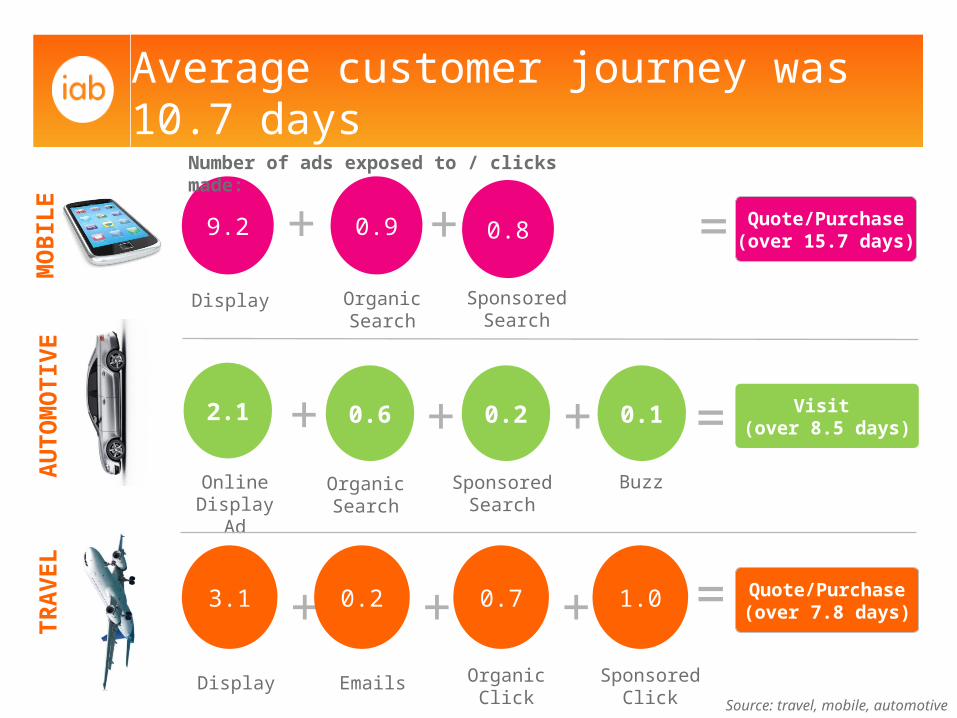
Average customer journey was 10.7 days
Source: travel, mobile, automotive
9.2 0.9 0.8
Display OrganicSearch
SponsoredSearch
+ + =
MO
BIL
E
2.1 0.6 0.2 0.1
Online Display Ad
OrganicSearch
SponsoredSearch
Buzz
+ + + = Visit (over 8.5 days)
AU
TO
MO
TIV
E
3.1
Display Emails
+ + + = Quote/Purchase(over 7.8 days)
0.2 0.7 1.0
OrganicClick
SponsoredClick
TR
AV
EL
Quote/Purchase(over 15.7 days)
Number of ads exposed to / clicks made:
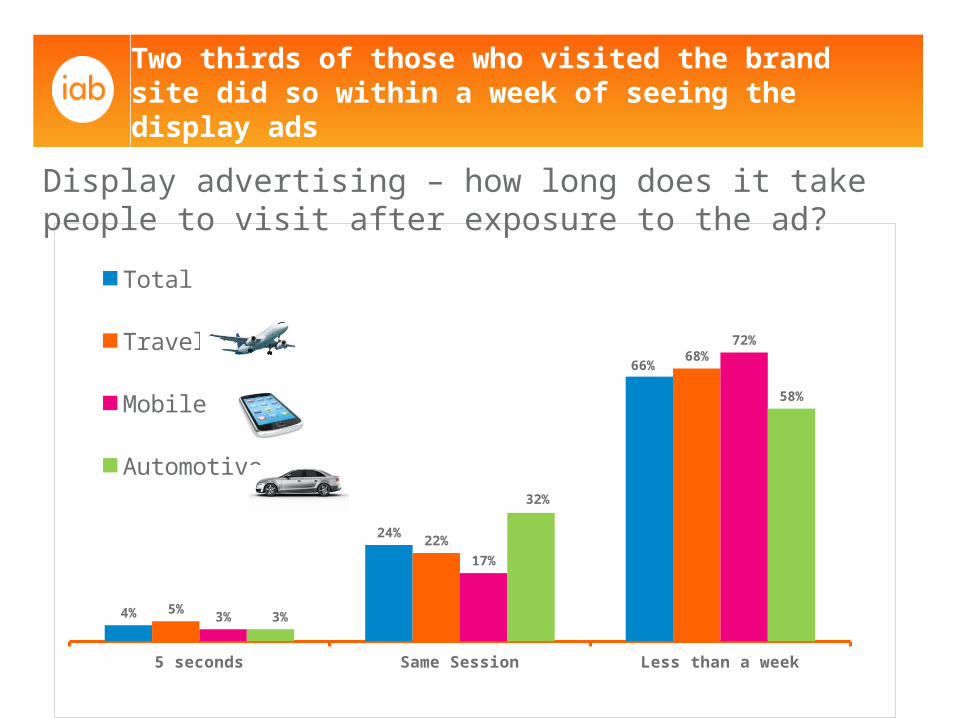
5 seconds Same Session Less than a week
4%
24%
66%
5%
22%
68%
3%
17%
72%
3%
32%
58%
Total
Travel
Mobile
Automotive
Two thirds of those who visited the brand site did so within a week of seeing the display ads
Display advertising – how long does it take people to visit after exposure to the ad?
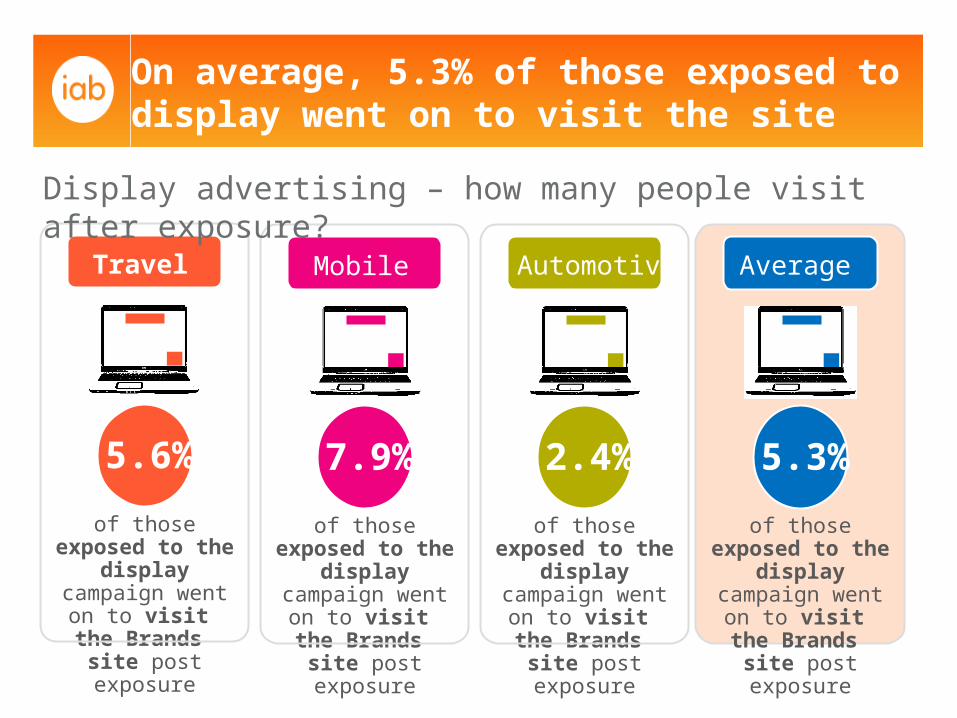
On average, 5.3% of those exposed to display went on to visit the site
of those exposed to the display
campaign went on to visit the
Brands site post exposure
Travel
5.6%
of those exposed to the display
campaign went on to visit the
Brands site post exposure
Mobile
7.9%
of those exposed to the display
campaign went on to visit the
Brands site post exposure
Automotive
2.4%
of those exposed to the display
campaign went on to visit the
Brands site post exposure
Average
5.3%
Display advertising – how many people visit after exposure?
So what should we measure?
It depends what is the advertising is trying to achieve!
Measurement should: • Match up with the objectives of the advertising.•Capture the impact on the consumer.
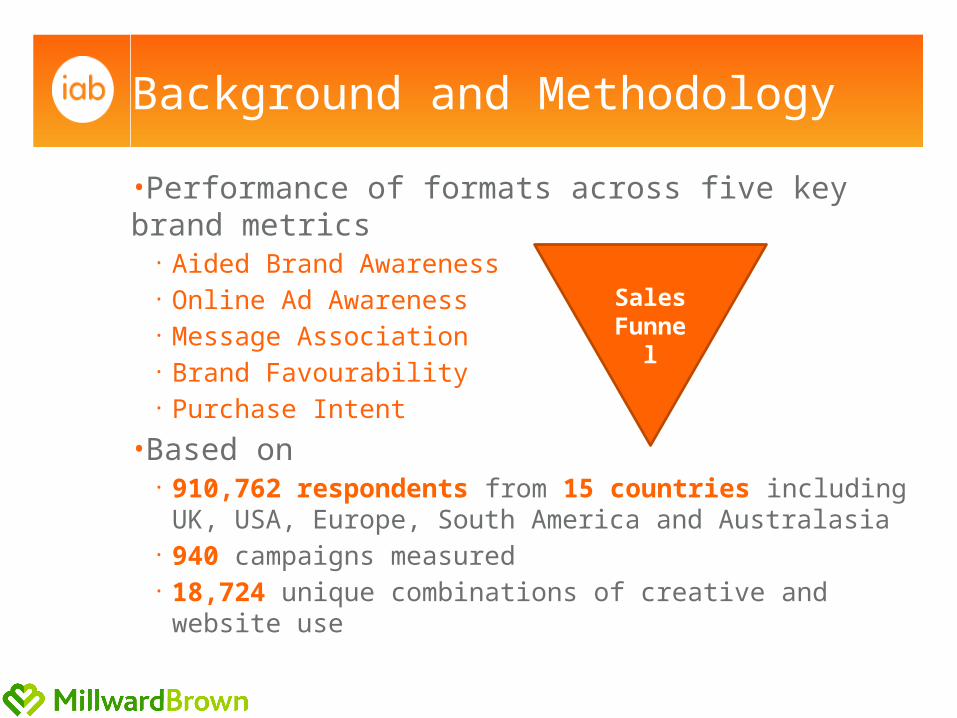
Background and Methodology
•Performance of formats across five key brand metrics
• Aided Brand Awareness• Online Ad Awareness• Message Association• Brand Favourability• Purchase Intent
•Based on • 910,762 respondents from 15 countries including UK,
USA, Europe, South America and Australasia • 940 campaigns measured• 18,724 unique combinations of creative and website use
SalesFunnel
iabuk.net/contact
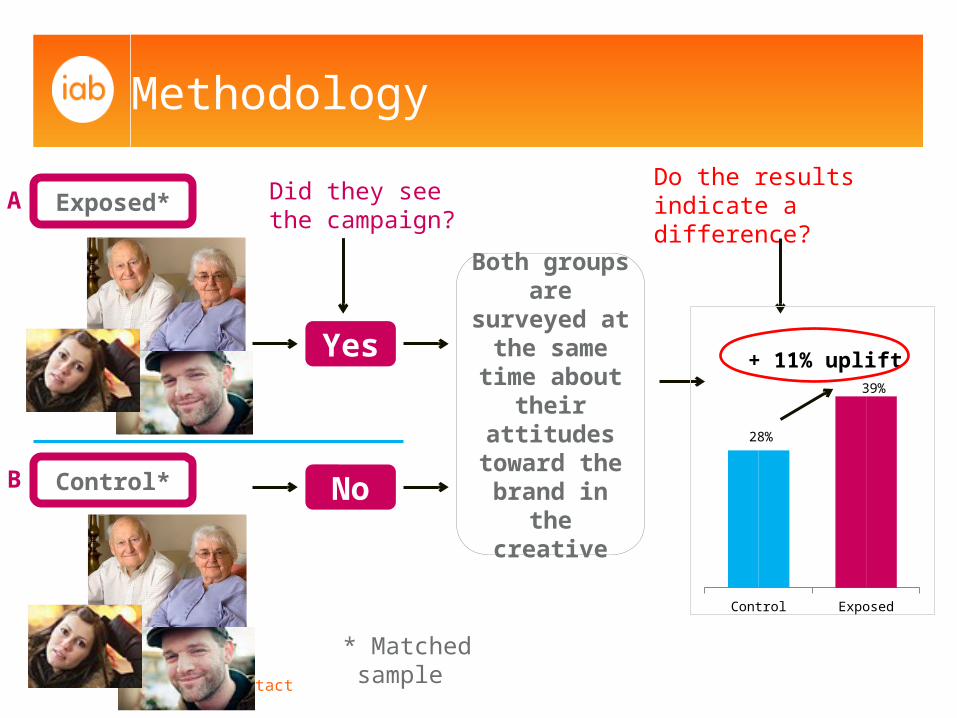
Methodology
A Exposed*
YesBoth groups are surveyed at the same time about
their attitudes toward the
brand in the creative
No
Did they see the campaign?
Control*
Do the results indicate a difference?
* Matched sample
B
Control Exposed
28%
39%
+ 11% uplift
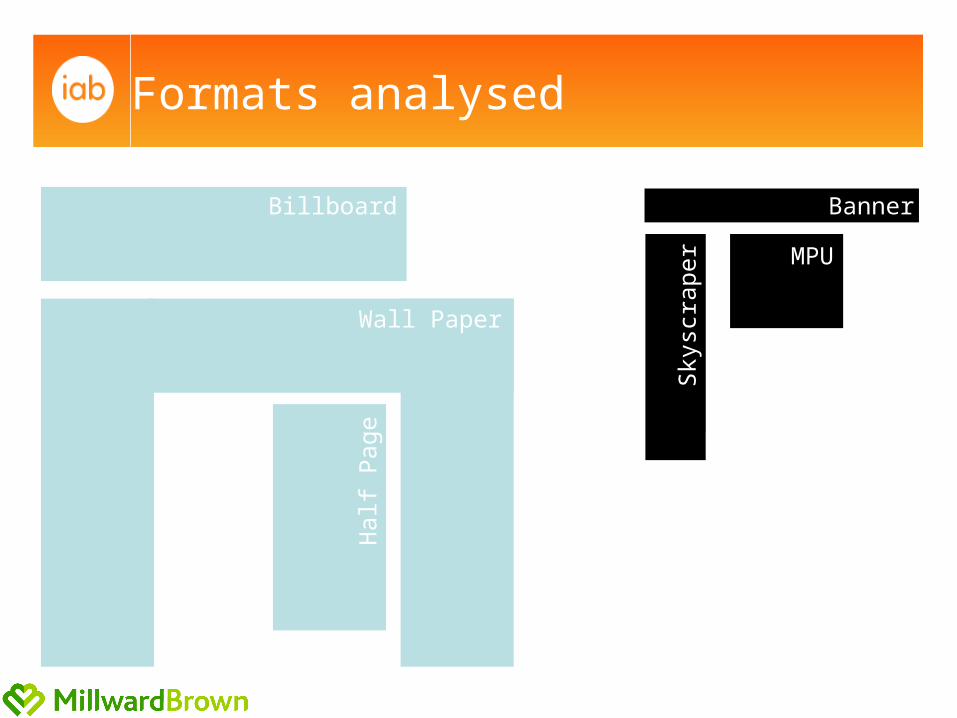
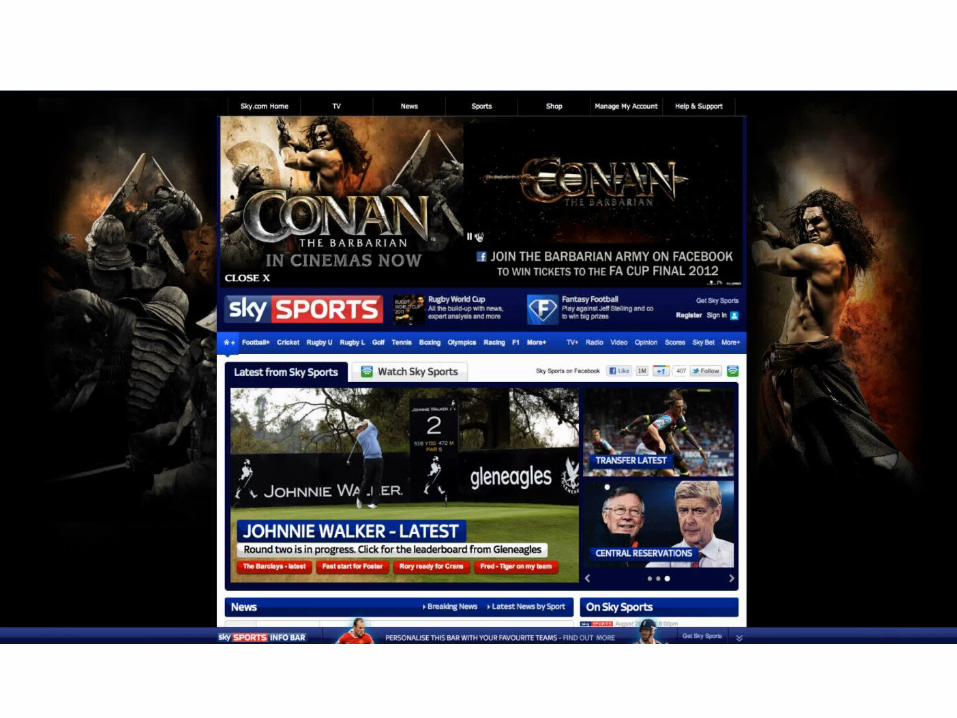
Formats analysed
Wall Paper
Billboard
Hal
f P
age
MPU
Banner
Sky
scra
per
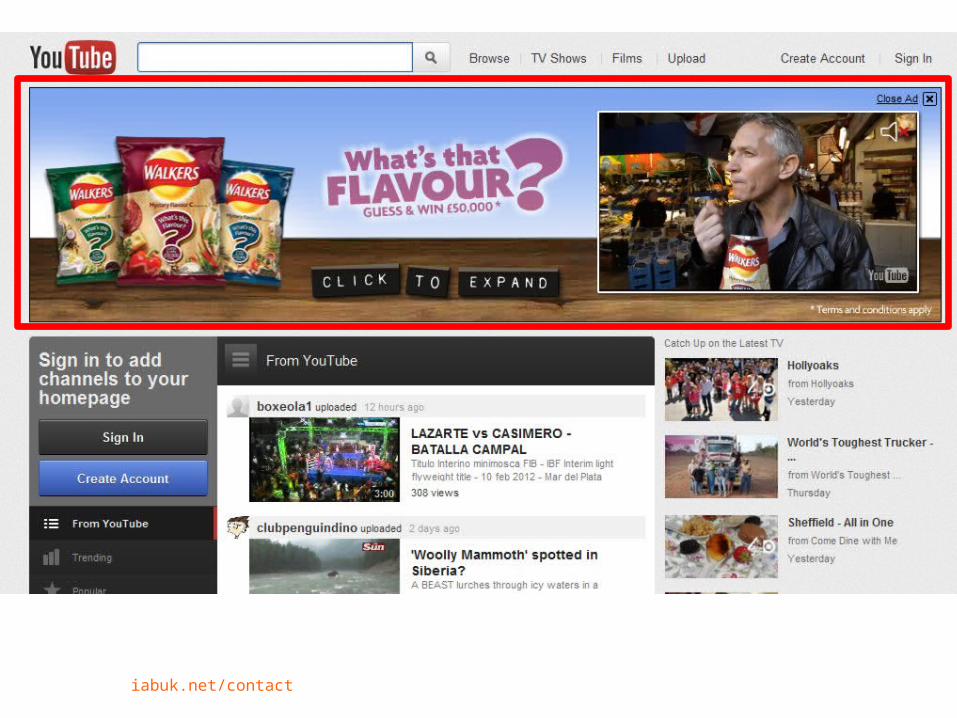
iabuk.net/contact
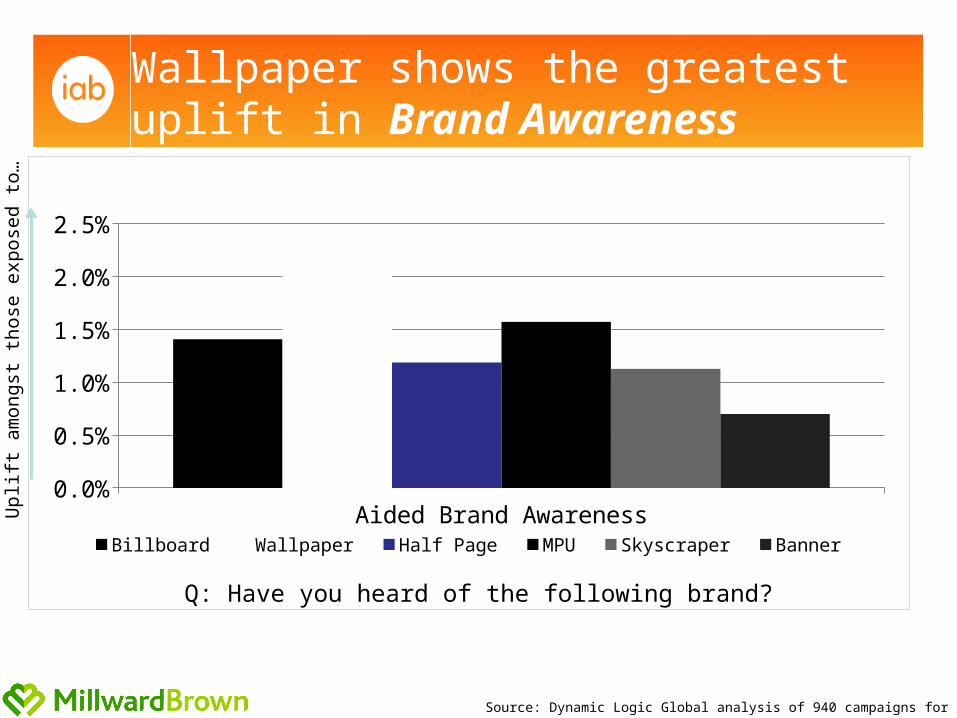
Aided Brand Awareness0.0%
0.5%
1.0%
1.5%
2.0%
2.5%
Billboard Wallpaper Half Page MPU Skyscraper Banner
Wallpaper shows the greatest uplift in Brand Awareness
Source: Dynamic Logic Global analysis of 940 campaigns for IAB UK
Upl
ift a
mon
gst
tho
se e
xpos
ed t
o…
Q: Have you heard of the following brand?
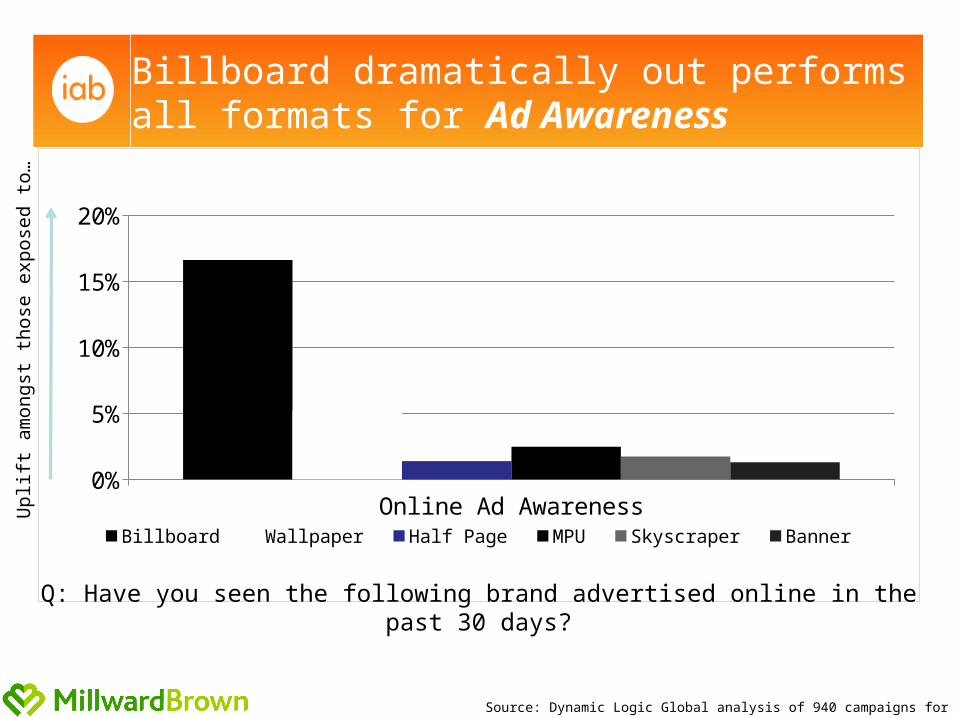
Online Ad Awareness0%2%4%6%8%
10%12%14%16%18%
Billboard Wallpaper Half Page MPU Skyscraper Banner
Billboard dramatically out performs all formats for Ad Awareness
Source: Dynamic Logic Global analysis of 940 campaigns for IAB UK
Upl
ift a
mon
gst
tho
se e
xpos
ed t
o…
Q: Have you seen the following brand advertised online in the past 30 days?
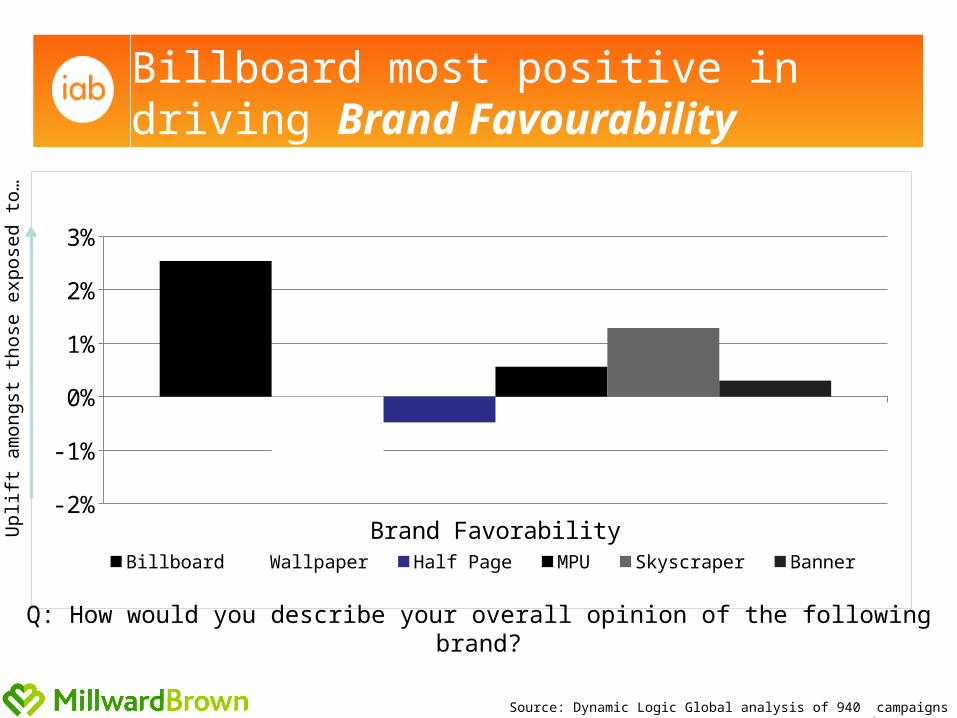
Brand Favorability-2%
-1%
0%
1%
2%
3%
Billboard Wallpaper Half Page MPU Skyscraper Banner
Billboard most positive in driving Brand Favourability
Source: Dynamic Logic Global analysis of 940 campaigns for IAB UK
Upl
ift a
mon
gst
tho
se e
xpos
ed t
o…
Q: How would you describe your overall opinion of the following brand?
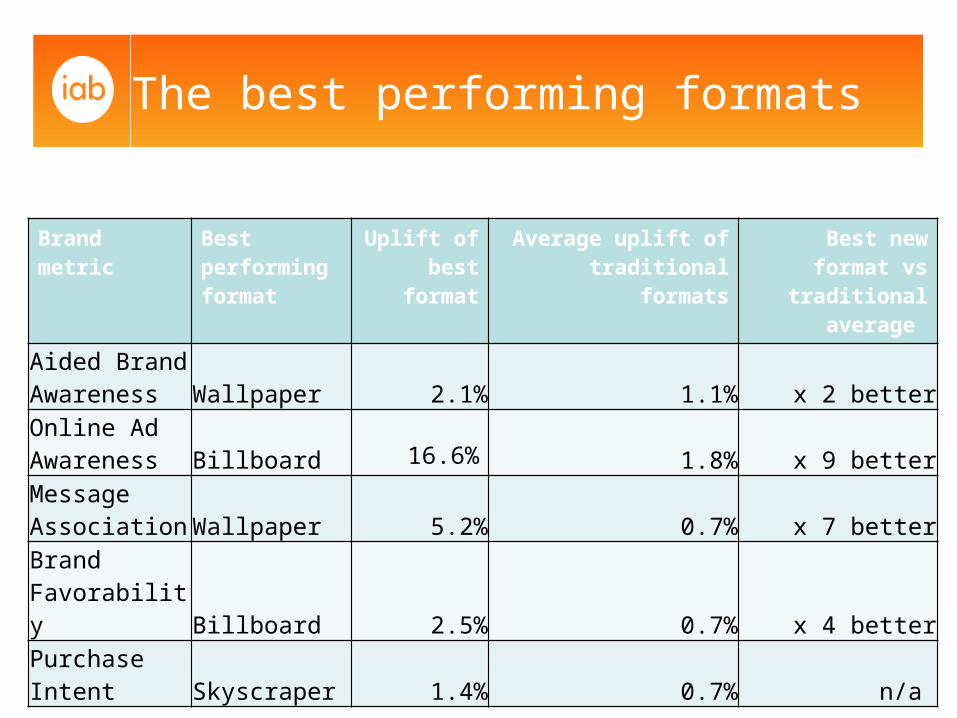
The best performing formats
Brand metric Best performing format
Uplift of best format
Average uplift of traditional formats
Best new format vs traditional
average
Aided Brand Awareness Wallpaper 2.1% 1.1% x 2 betterOnline Ad Awareness Billboard 16.6% 1.8% x 9 betterMessage Association Wallpaper 5.2% 0.7% x 7 betterBrand Favorability Billboard 2.5% 0.7% x 4 betterPurchase Intent Skyscraper 1.4% 0.7% n/a
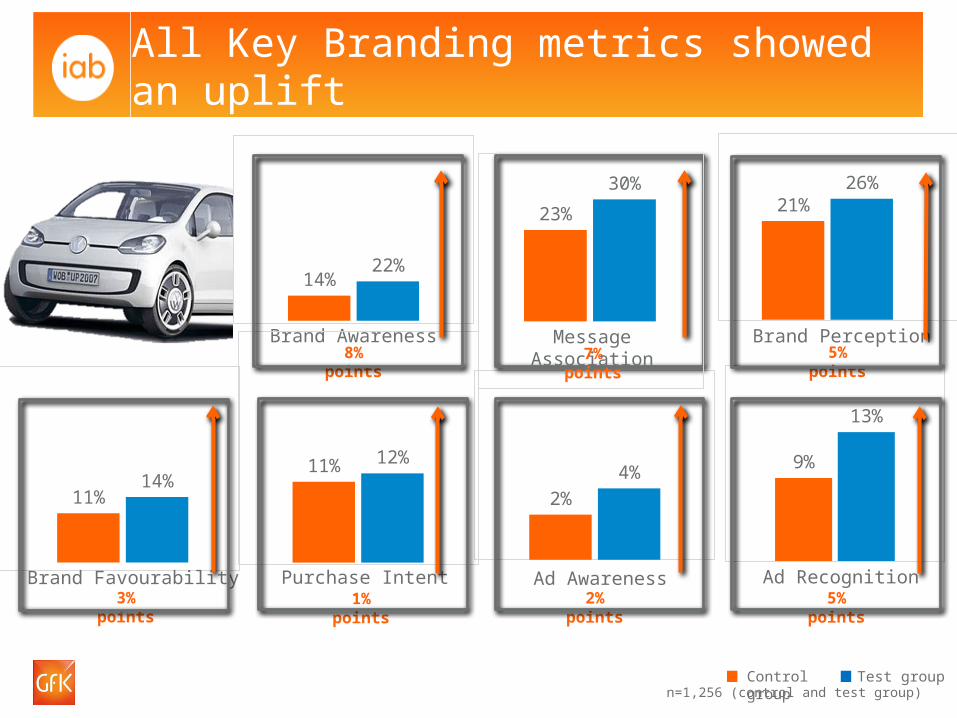
All Key Branding metrics showed an uplift
14%22%
Brand Awareness
11%14%
Brand Favourability
Control group Test group
21%26%
Brand Perception
2%
4%
Ad Awareness
9%
13%
Ad Recognition
11% 12%
Purchase Intent
n=1,256 (control and test group)
2% points
8% points
3% points
5% points
1% points 5% points
23%
30%
7% pointsMessage Association
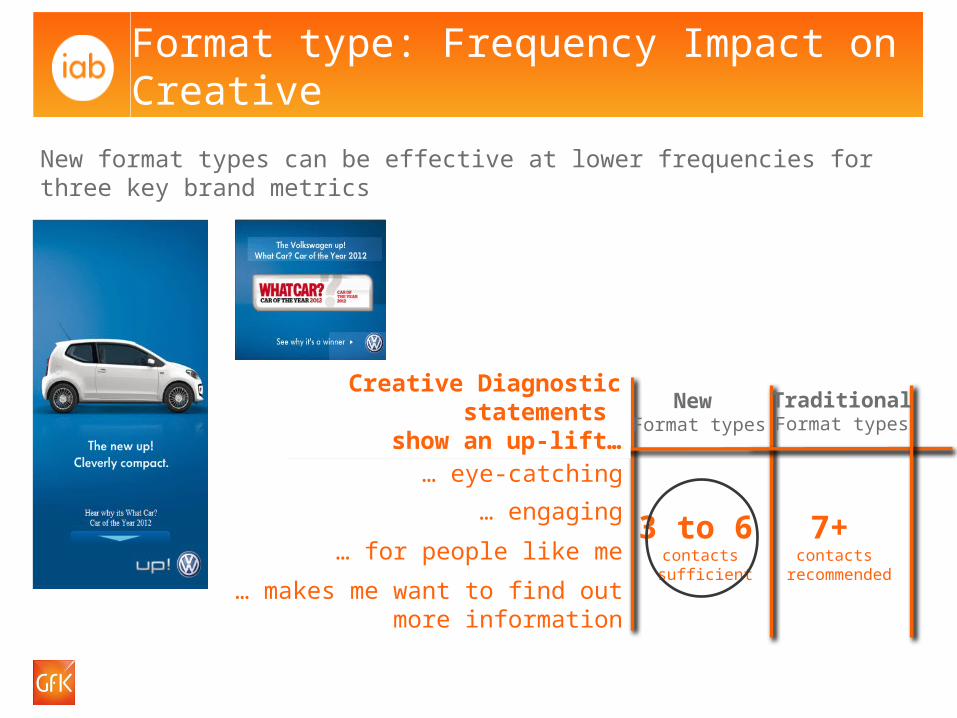
Creative diagnostic
3 to 6 contacts sufficient
… eye-catching
… engaging
… makes me want to find out more information
7+ contacts
recommended
New Format types
Traditional Format types
… for people like me
Format type: Frequency Impact on Creative
Creative Diagnostic statements
show an up-lift…
New format types can be effective at lower frequencies for three key brand metrics
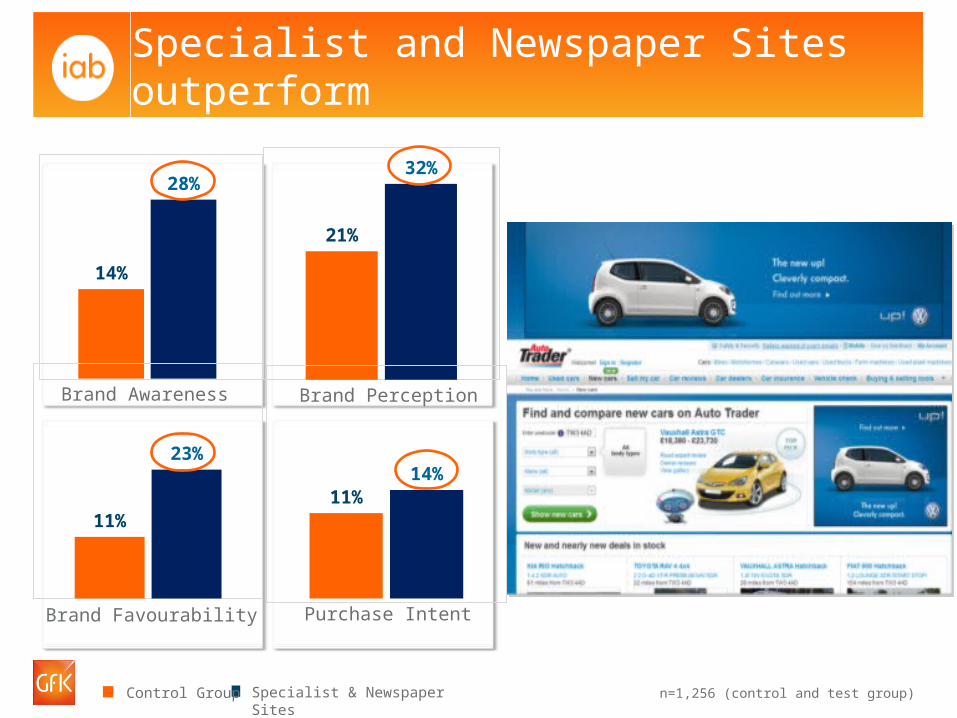
n=1,256 (control and test group)
14%
28%
21%
32%
Specialist and Newspaper Sites outperform
11%
23%
11%14%
Specialist & Newspaper SitesControl Group
Brand Awareness
Brand Favourability
Brand Perception
Purchase Intent
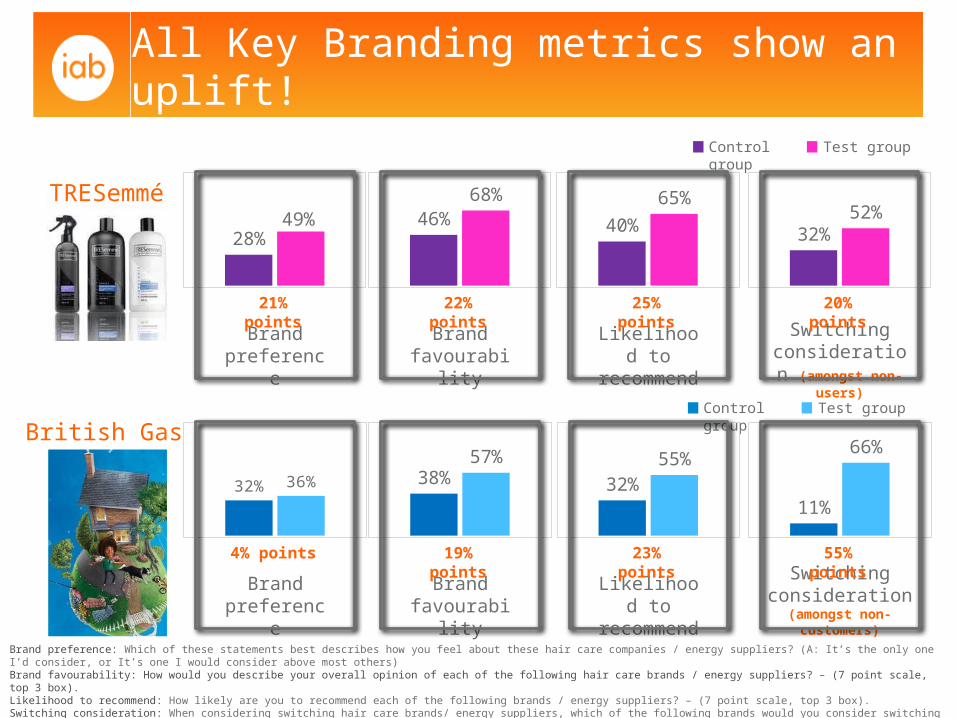
All Key Branding metrics show an uplift!
Control group Test group
28%
49%
Brand preference
21% points
46%
68%
Brand favourability
22% points
40%
65%
Likelihood to recommend
25% points
32%
52%
Switching consideration
(amongst non-users)
20% points
32% 36%
Brand preference
4% points
38%
57%
Brand favourability
19% points
32%
55%
Likelihood to recommend
23% points
11%
66%
Switching consideration
(amongst non-customers)
55% points
Control group Test group
TRESemmé
British Gas
Brand preference: Which of these statements best describes how you feel about these hair care companies / energy suppliers? (A: It’s the only one I’d consider, or It’s one I would consider above most others) Brand favourability: How would you describe your overall opinion of each of the following hair care brands / energy suppliers? – (7 point scale, top 3 box). Likelihood to recommend: How likely are you to recommend each of the following brands / energy suppliers? – (7 point scale, top 3 box).Switching consideration: When considering switching hair care brands/ energy suppliers, which of the following brands would you consider switching to? - (7 point scale, top 3 box).Source: comScore Marketing Solutions
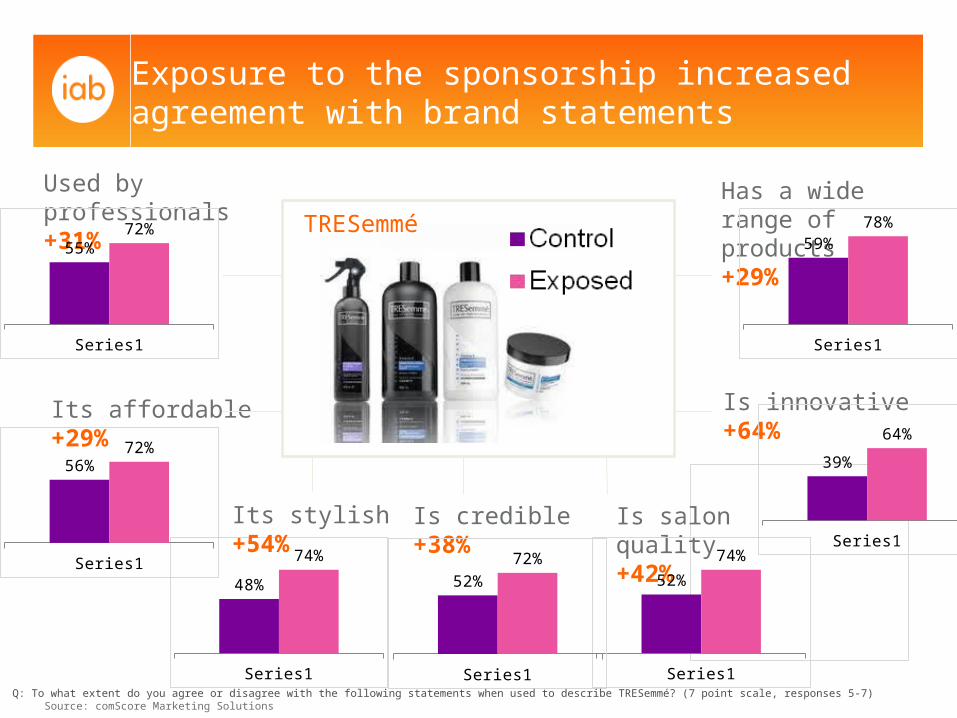
Exposure to the sponsorship increased agreement with brand statements
Used by professionals +31%
Series1
55%72%
Series1
48%
74%
Its affordable+29%
Series1
56%72%
Its stylish+54%
Has a wide range of products+29%
Series1
59%
78%
Is salon quality +42%
Series1
52%
74%
Is innovative+64%
Series1
39%
64%
Is credible+38%
Series1
52%
72%
TRESemmé
Q: To what extent do you agree or disagree with the following statements when used to describe TRESemmé? (7 point scale, responses 5-7) Source: comScore Marketing Solutions
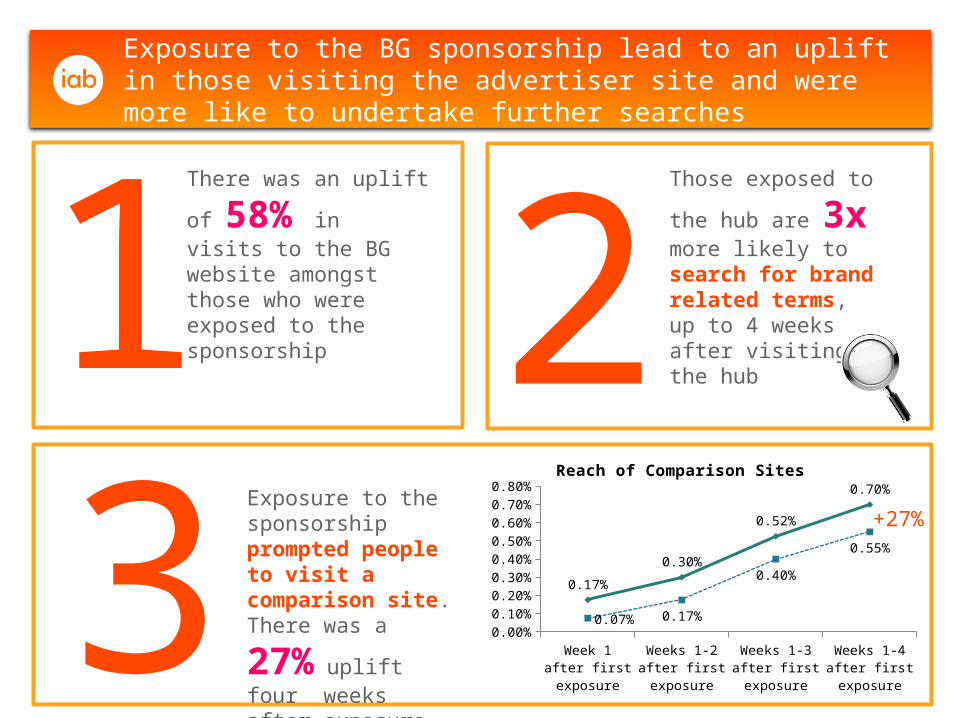
Exposure to the BG sponsorship lead to an uplift in those visiting the advertiser site and were more like to undertake further searches
There was an uplift of
58% in visits to the BG website amongst those who were exposed to the sponsorship1
Those exposed to the
hub are 3x more likely to search for brand related terms, up to 4 weeks after visiting the hub2
Exposure to the sponsorship prompted people to visit a comparison site. There was a
27% uplift four weeks after exposure3 Week 1
after first exposure
Weeks 1-2after first exposure
Weeks 1-3after first exposure
Weeks 1-4after first exposure
0.00%0.10%0.20%0.30%0.40%0.50%0.60%0.70%0.80%
0.07% 0.17%
0.40%
0.55%
0.17%
0.30%
0.52%
0.70%
Reach of Comparison Sites
+27%
Summary
•CTR’s only tell a very small part of the story!
•Online is an effective brand building medium.
•Ad effectiveness studies need to measure the impact of the ad on the
consumers.
Select metrics that reflect the objectives of the advertising Measure the impact amongst the campaign target audience Use techniques that can link passive behaviour with attitudes,
and if possible, outcome data Don’t underestimate the impact of environment, size and content
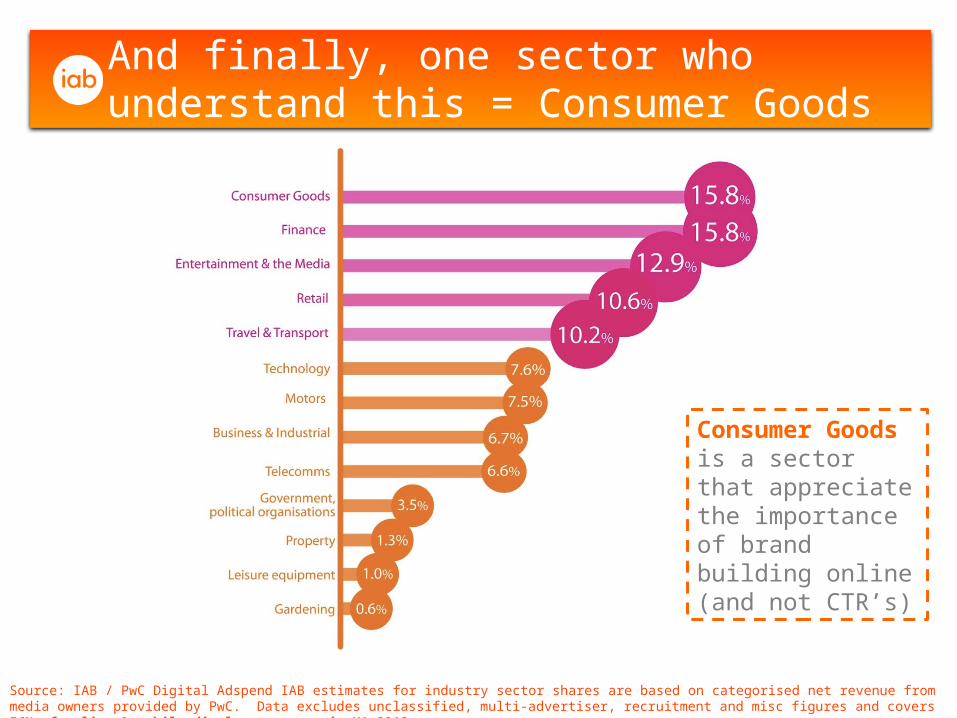
Source: IAB / PwC Digital Adspend IAB estimates for industry sector shares are based on categorised net revenue from media owners provided by PwC. Data excludes unclassified, multi-advertiser, recruitment and misc figures and covers 56% of online & mobile display revenues in H1 2012.
And finally, one sector who understand this = Consumer Goods
Consumer Goods is a sector that appreciate the importance of brand building online (and not CTR’s)