Embed Size (px)
Citation preview
KIRENZ STRATEGY & MARKETING CONSULTING
Mehr Insights auf kirenz.de Kontakt: [email protected]
KIRENZ STRATEGY & MARKETING CONSULTING
Balanced Scorecard & Strategy MappingStrategie
Insig
hts
KIRENZ CONSULTING Kundengewinnung & Kundenbindung im digitalen Zeitalter
KIRENZ STRATEGY & MARKETING CONSULTING
„Strategy is the creation of a unique and valuable position, involving a different set of
[combined] activities“ - Michael E. Porter -
Source: Porter, M. E. (1996). What is Strategy? Harvard Business Review, November-December, p. 3-22 ; Picture: forbes.com
KIRENZ STRATEGY & MARKETING CONSULTING
KIRENZ STRATEGY & MARKETING CONSULTING
balanced scorecard
Der Balanced-Scorecard-Ansatz stellt den Vorschlag eines umsetzungsorientierten Managementsystems dar, mit dem eine an der Unternehmensstrategie ausgerichtete
Steuerung ermöglicht werden soll.
Quelle: Horvath, P. & Kaufmann, L. (1998). Balanced Scorecard - ein Werkzeug zur Umsetzung von Strategie. Harvard Business Manager (5).
KIRENZ STRATEGY & MARKETING CONSULTING
balanced scorecard
Balanced Scorecards dienen der Implementierung von Unternehmensstrategien.
Besonderheiten:
Drastische Komplexitätsreduktion. ︎Übersetzung der individuellen Geschäftsstrategie in operationale Meßgrößen.
Aufdecken der Wirkungszusammenhänge zwischen den Meßgrößen.
Quelle: Horvath, P. & Kaufmann, L. (1998). Balanced Scorecard - ein Werkzeug zur Umsetzung von Strategie. Harvard Business Manager (5).
KIRENZ STRATEGY & MARKETING CONSULTING
balanced scorecard
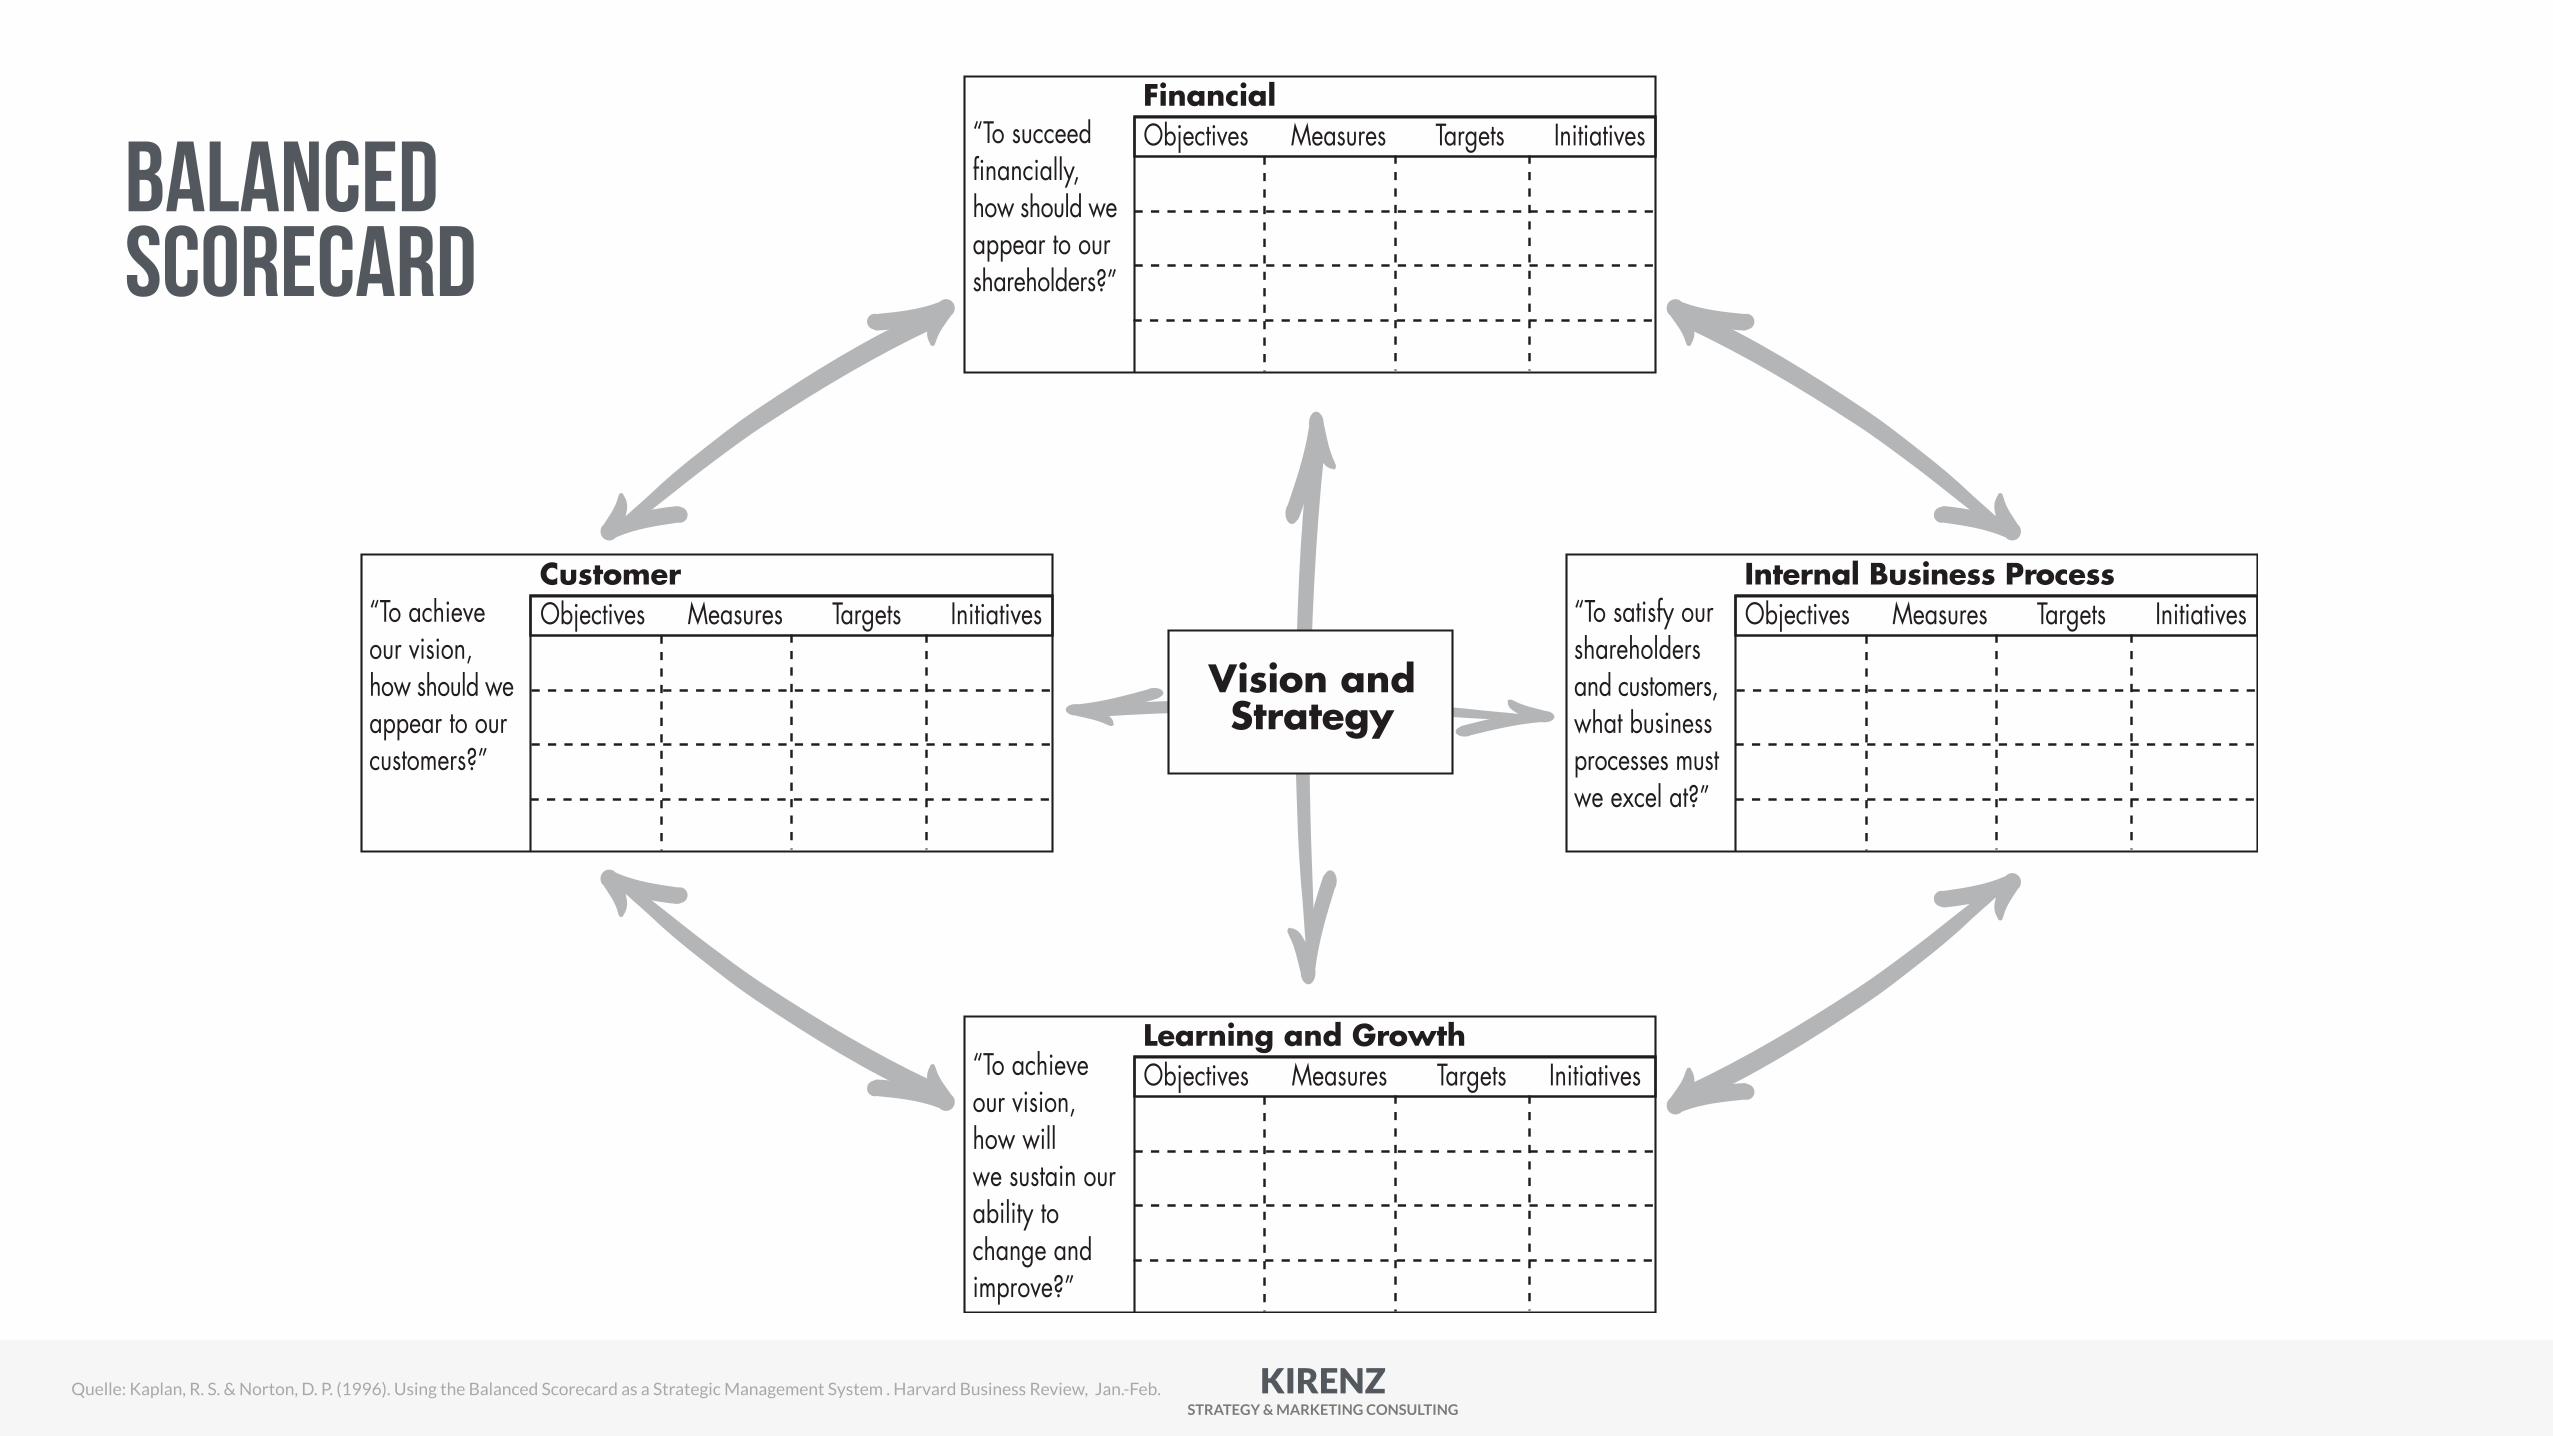
Finanziellen Zielsetzungen werden mit den Leistungsperspektiven hinsichtlich
der (2) Kunden, der (3) internen Prozesse sowie des (4) Lernens
strategie- und visionsfokussiert verbunden.
Die Leistung einer Organisation im ganzen wird damit als Gleichgewicht („Balance“) zwischen den vier Perspektiven auf einer übersichtlichen
Anzeigetafel („Scorecard“) abgebildet – daher der Name „Balanced Scorecard“
Quelle: Horvath, P. & Kaufmann, L. (1998). Balanced Scorecard - ein Werkzeug zur Umsetzung von Strategie. Harvard Business Manager (5).
KIRENZ STRATEGY & MARKETING CONSULTING
Using the Balanced Scorecard as a Strategic Management System
harvard business review • january–february 1996 page 39
mission statement, got a phone call from aproject manager in the field. “I want you toknow,” the distraught manager said, “that Ibelieve in the mission statement. I want to actin accordance with the mission statement. I’mhere with my customer. What am I supposedto do?”
The mission statement, like those of manyother organizations, had declared an intentionto “use high-quality employees to provide ser-vices that surpass customers’ needs.” But theproject manager in the field with his employ-ees and his customer did not know how totranslate those words into the appropriate ac-tions. The phone call convinced the CEO that alarge gap existed between the mission state-ment and employees’ knowledge of how theirday-to-day actions could contribute to realiz-ing the company’s vision.
Metro Bank (not its real name), the result ofa merger of two competitors, encountered asimilar gap while building its balanced score-card. The senior executive group thought it
had reached agreement on the new organiza-tion’s overall strategy: “to provide superior ser-vice to targeted customers.” Research had re-vealed five basic market segments amongexisting and potential customers, each withdifferent needs. While formulating the mea-sures for the customer-perspective portion oftheir balanced scorecard, however, it becameapparent that although the 25 senior execu-tives agreed on the words of the strategy, eachone had a different definition of superior ser-vice and a different image of the targeted cus-tomers.
The exercise of developing operationalmeasures for the four perspectives on thebank’s scorecard forced the 25 executives toclarify the meaning of the strategy statement.Ultimately, they agreed to stimulate revenuegrowth through new products and services andalso agreed on the three most desirable cus-tomer segments. They developed scorecardmeasures for the specific products and servicesthat should be delivered to customers in the
Quelle: Kaplan, R. S. & Norton, D. P. (1996). Using the Balanced Scorecard as a Strategic Management System . Harvard Business Review, Jan.-Feb.
balanced scorecard
KIRENZ STRATEGY & MARKETING CONSULTING
Quelle: Kaplan, R. S. & Norton, D. P. (1993). Putting the Balanced Scorecard to Work. Harvard Business Review, September-October.
Putting the Balanced Scorecard to Work
harvard business review • september–october 1993 page 7
classify all undesired events with the potentialfor harm to people, property, or process.
The Rockwater team deliberated about thechoice of metric for the identification stage. Itrecognized that hours spent with key prospectsdiscussing new work was an input or processmeasure rather than an output measure. Themanagement team wanted a metric thatwould clearly communicate to all members ofthe organization the importance of buildingrelationships with and satisfying customers.The team believed that spending quality timewith key customers was a prerequisite for in-fluencing results. This input measure was de-liberately chosen to educate employees aboutthe importance of working closely to identifyand satisfy customer needs.
Innovation and Improvement:
The inno-vation and learning objectives are intended todrive improvement in financial, customer,and internal process performance. At Rockwa-ter, such improvements came from productand service innovation that would create newsources of revenue and market expansion, aswell as from continuous improvement in in-
ternal work processes. The first objective wasmeasured by percent revenue from new ser-vices and the second objective by a continuousimprovement index that represented the rateof improvement of several key operationalmeasures, such as safety and rework. But inorder to drive both product/service innovationand operational improvements, a supportiveclimate of empowered, motivated employeeswas believed necessary. A staff attitude surveyand a metric for the number of employee sug-gestions measured whether or not such a cli-mate was being created. Finally, revenue peremployee measured the outcomes of em-ployee commitment and training programs.
The balanced scorecard has helped Rockwa-ter’s management emphasize a process view ofoperations, motivate its employees, and incor-porate client feedback into its operations. Itdeveloped a consensus on the necessity of cre-ating partnerships with key customers, the im-portance of order-of-magnitude reductions insafety-related incidents, and the need for im-proved management at every phase of multi-year projects. Chambers sees the scorecard as
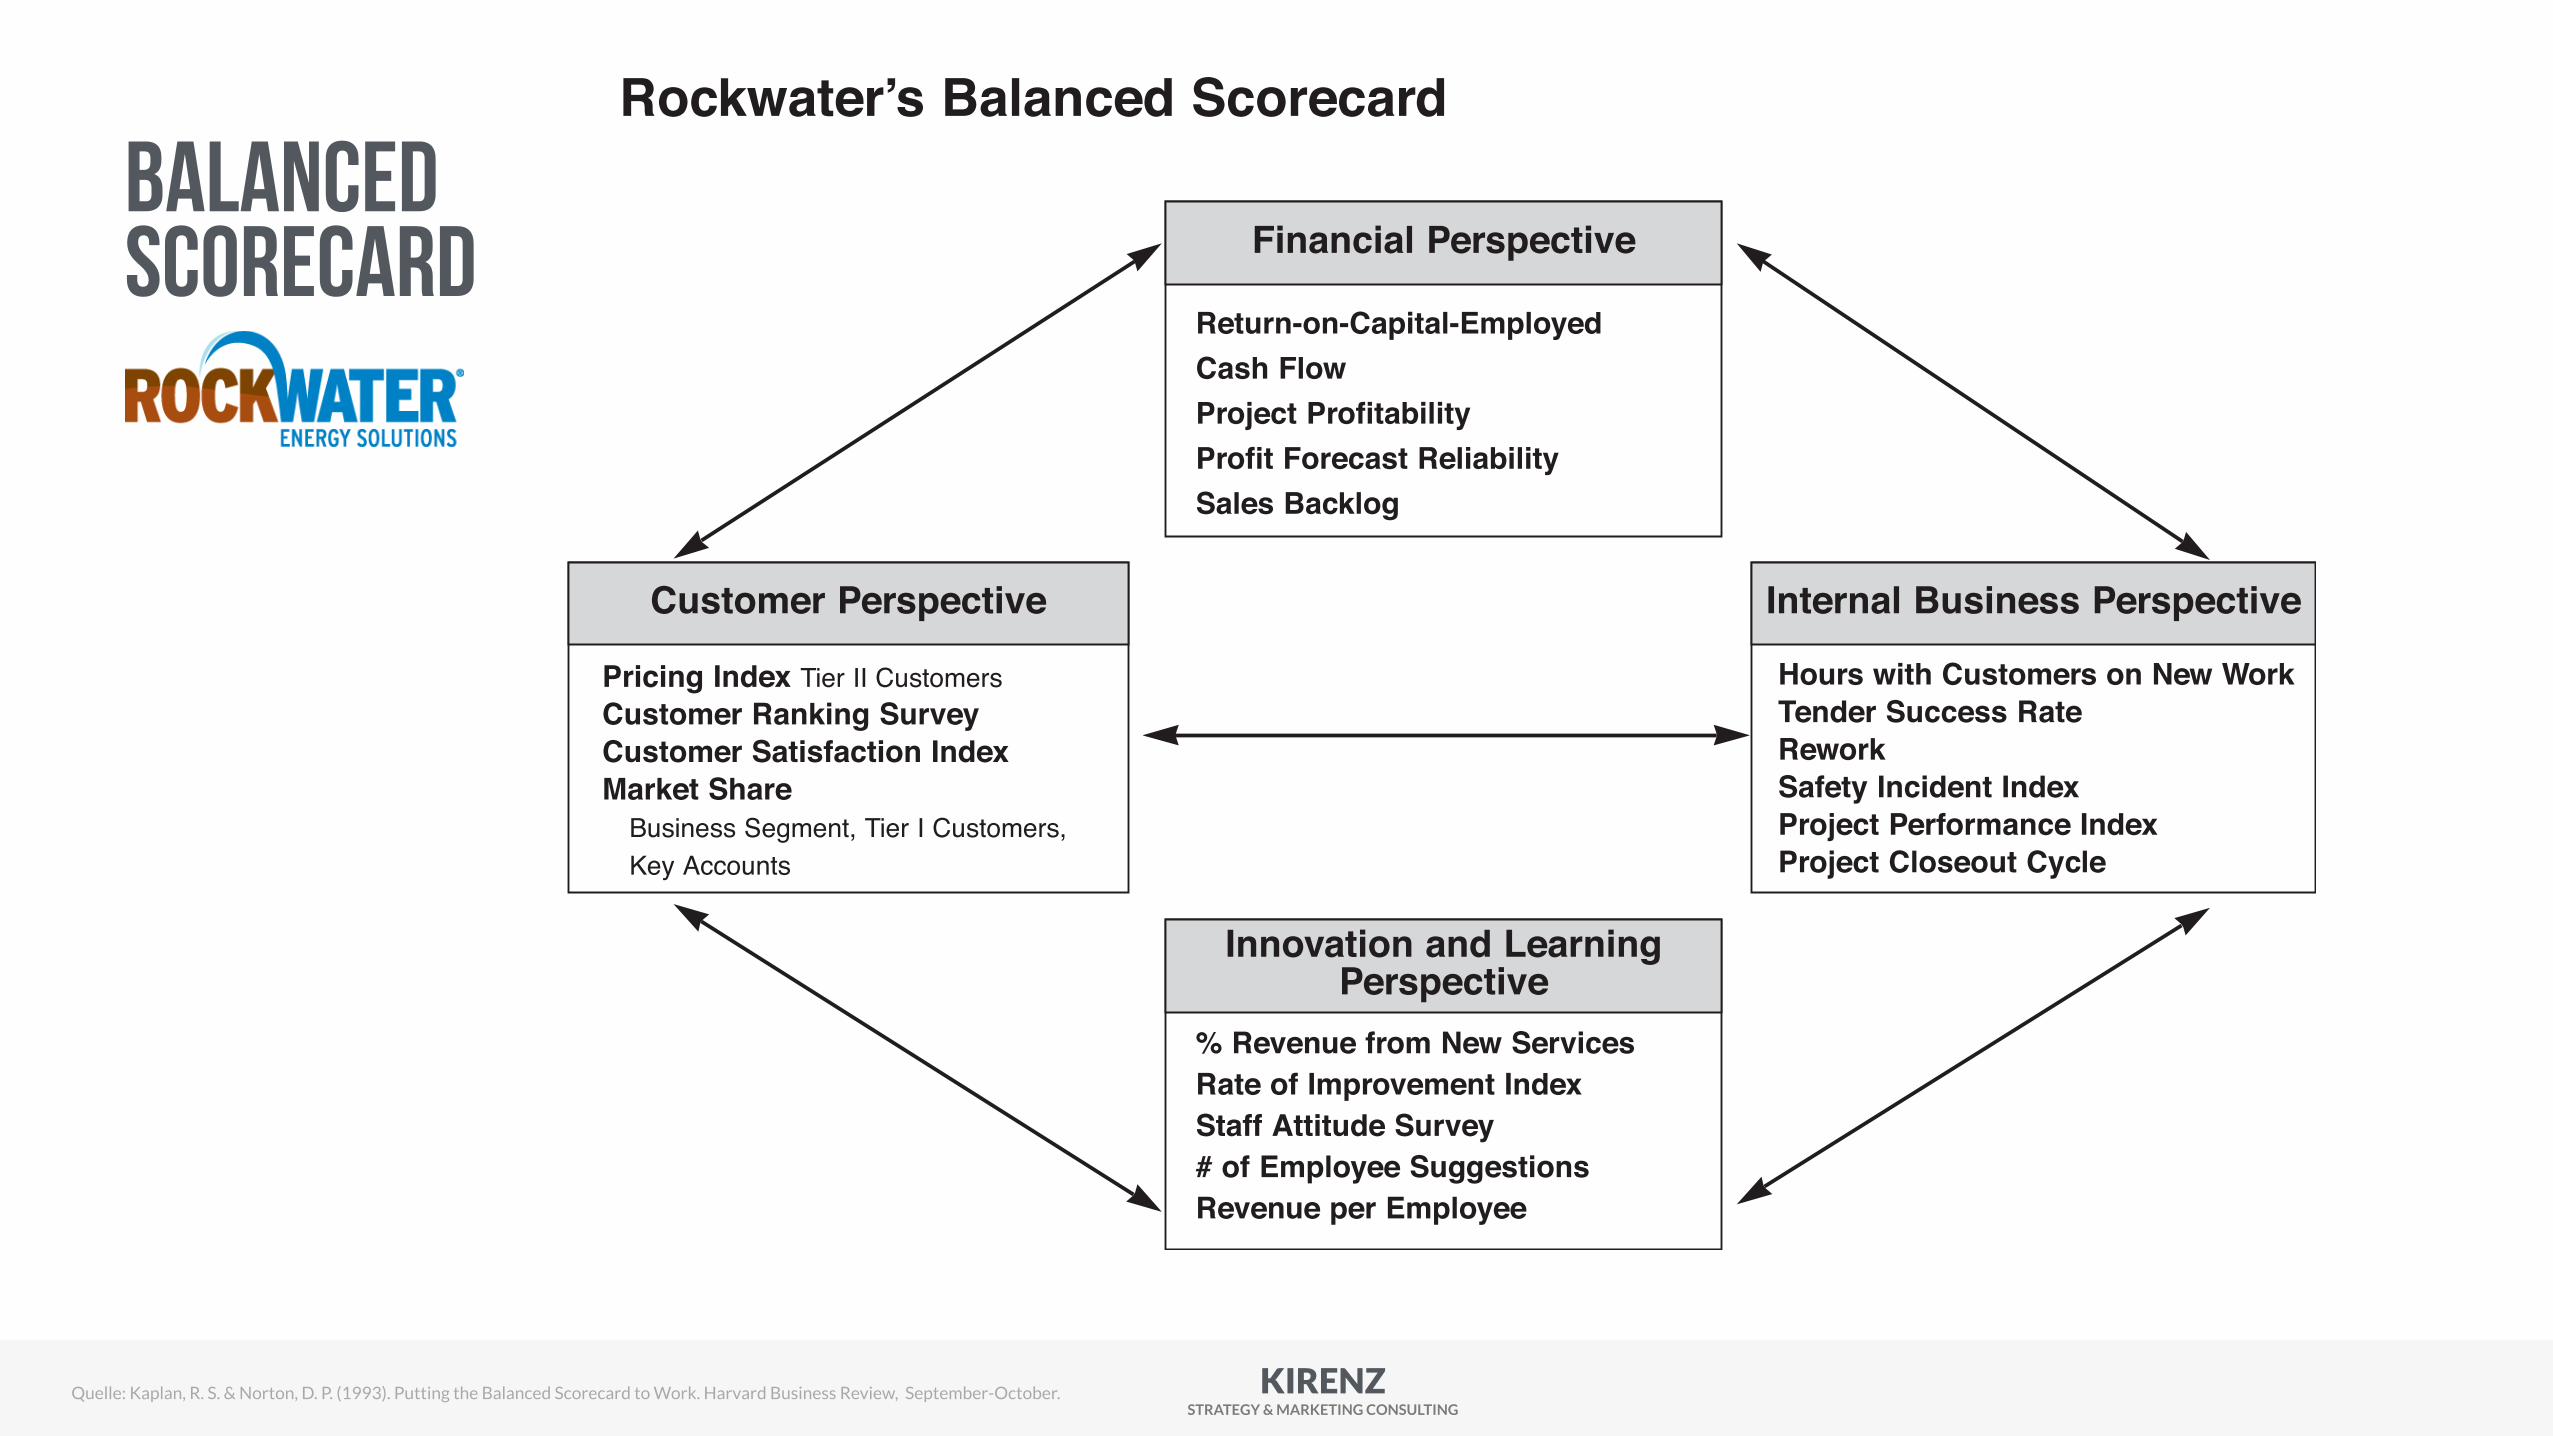
Rockwater’s Balanced Scorecard
Customer Perspective
Financial Perspective
Internal Business Perspective
Innovation and LearningPerspective
Pricing Index Tier II CustomersCustomer Ranking SurveyCustomer Satisfaction IndexMarket Share
Business Segment, Tier I Customers, Key Accounts
Return-on-Capital-EmployedCash FlowProject ProfitabilityProfit Forecast ReliabilitySales Backlog
Hours with Customers on New WorkTender Success RateReworkSafety Incident IndexProject Performance IndexProject Closeout Cycle
% Revenue from New ServicesRate of Improvement IndexStaff Attitude Survey# of Employee SuggestionsRevenue per Employee
balanced scorecard
KIRENZ STRATEGY & MARKETING CONSULTING
Putting the Balanced Scorecard to Work
harvard business review • september–october 1993 page 6
price index, incorporating the best availableintelligence on competitive position, was in-cluded to ensure that Rockwater could still re-tain Tier II customers’ business when requiredby competitive conditions.
The company’s strategy, however, was toemphasize value-based business. An indepen-dent organization conducted an annual surveyto rank customers’ perceptions of Rockwater’sservices compared to those of its competitors.In addition, Tier I customers were asked tosupply monthly satisfaction and performanceratings. Rockwater executives felt that imple-menting these ratings gave them a direct tie totheir customers and a level of market feedbackunsurpassed in most industries. Finally, mar-ket share by key accounts provided objectiveevidence that improvements in customer satis-faction were being translated into tangiblebenefits.
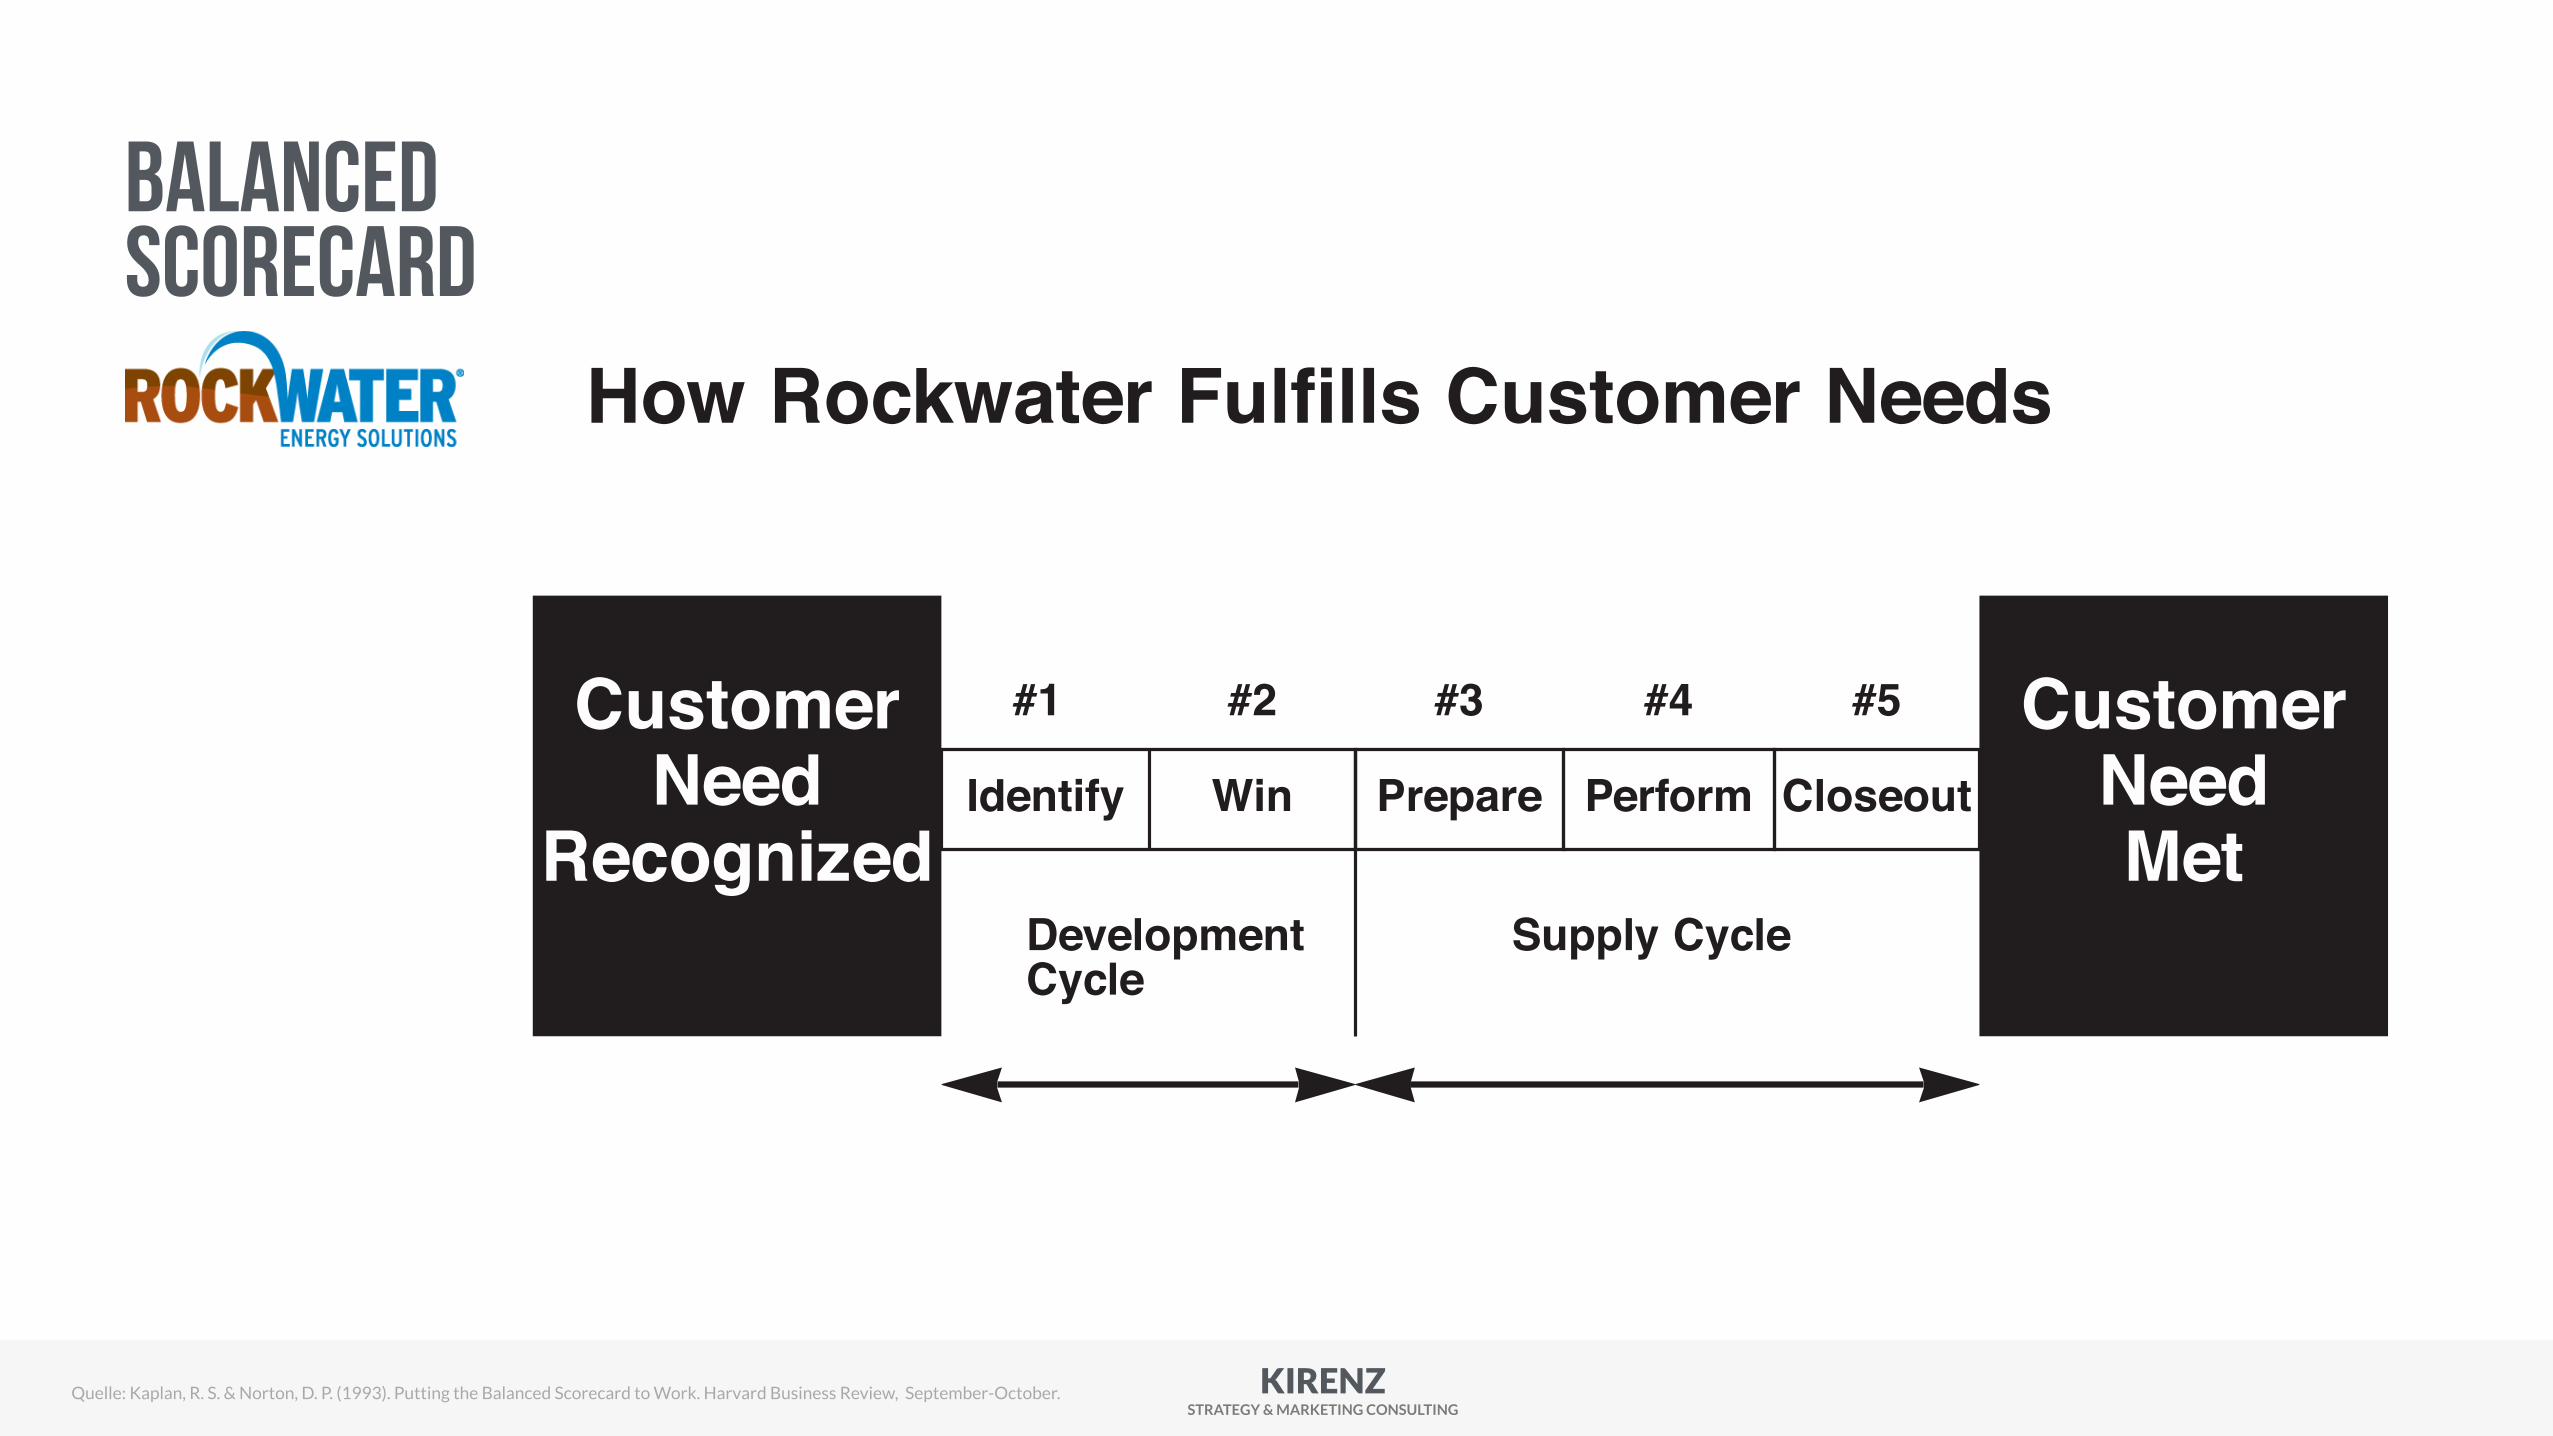
Internal Processes:
To develop measures ofinternal processes, Rockwater executives de-fined the life cycle of a project from launch(when a customer need was recognized) tocompletion (when the customer need had
been satisfied). Measures were formulated foreach of the five business-process phases in thisproject cycle (see the chart “How RockwaterFulfills Customer Needs”):
•
Identify:
number of hours spent with pros-pects discussing new work;
•
Win:
tender success rate;•
Prepare and Deliver:
project performanceeffectiveness index, safety/loss control, rework;
•
Closeout
: length of project closeout cycle.The internal business measures emphasized
a major shift in Rockwater’s thinking. For-merly, the company stressed performance foreach functional department. The new focusemphasized measures that integrated key busi-ness processes. The development of a compre-hensive and timely index of project perfor-mance effectiveness was viewed as a key corecompetency for the company. Rockwater feltthat safety was also a major competitive factor.Internal studies had revealed that the indirectcosts from an accident could be 5 to 50 timesthe direct costs. The scorecard included a safetyindex, derived from a comprehensive safetymeasurement system, that could identify and
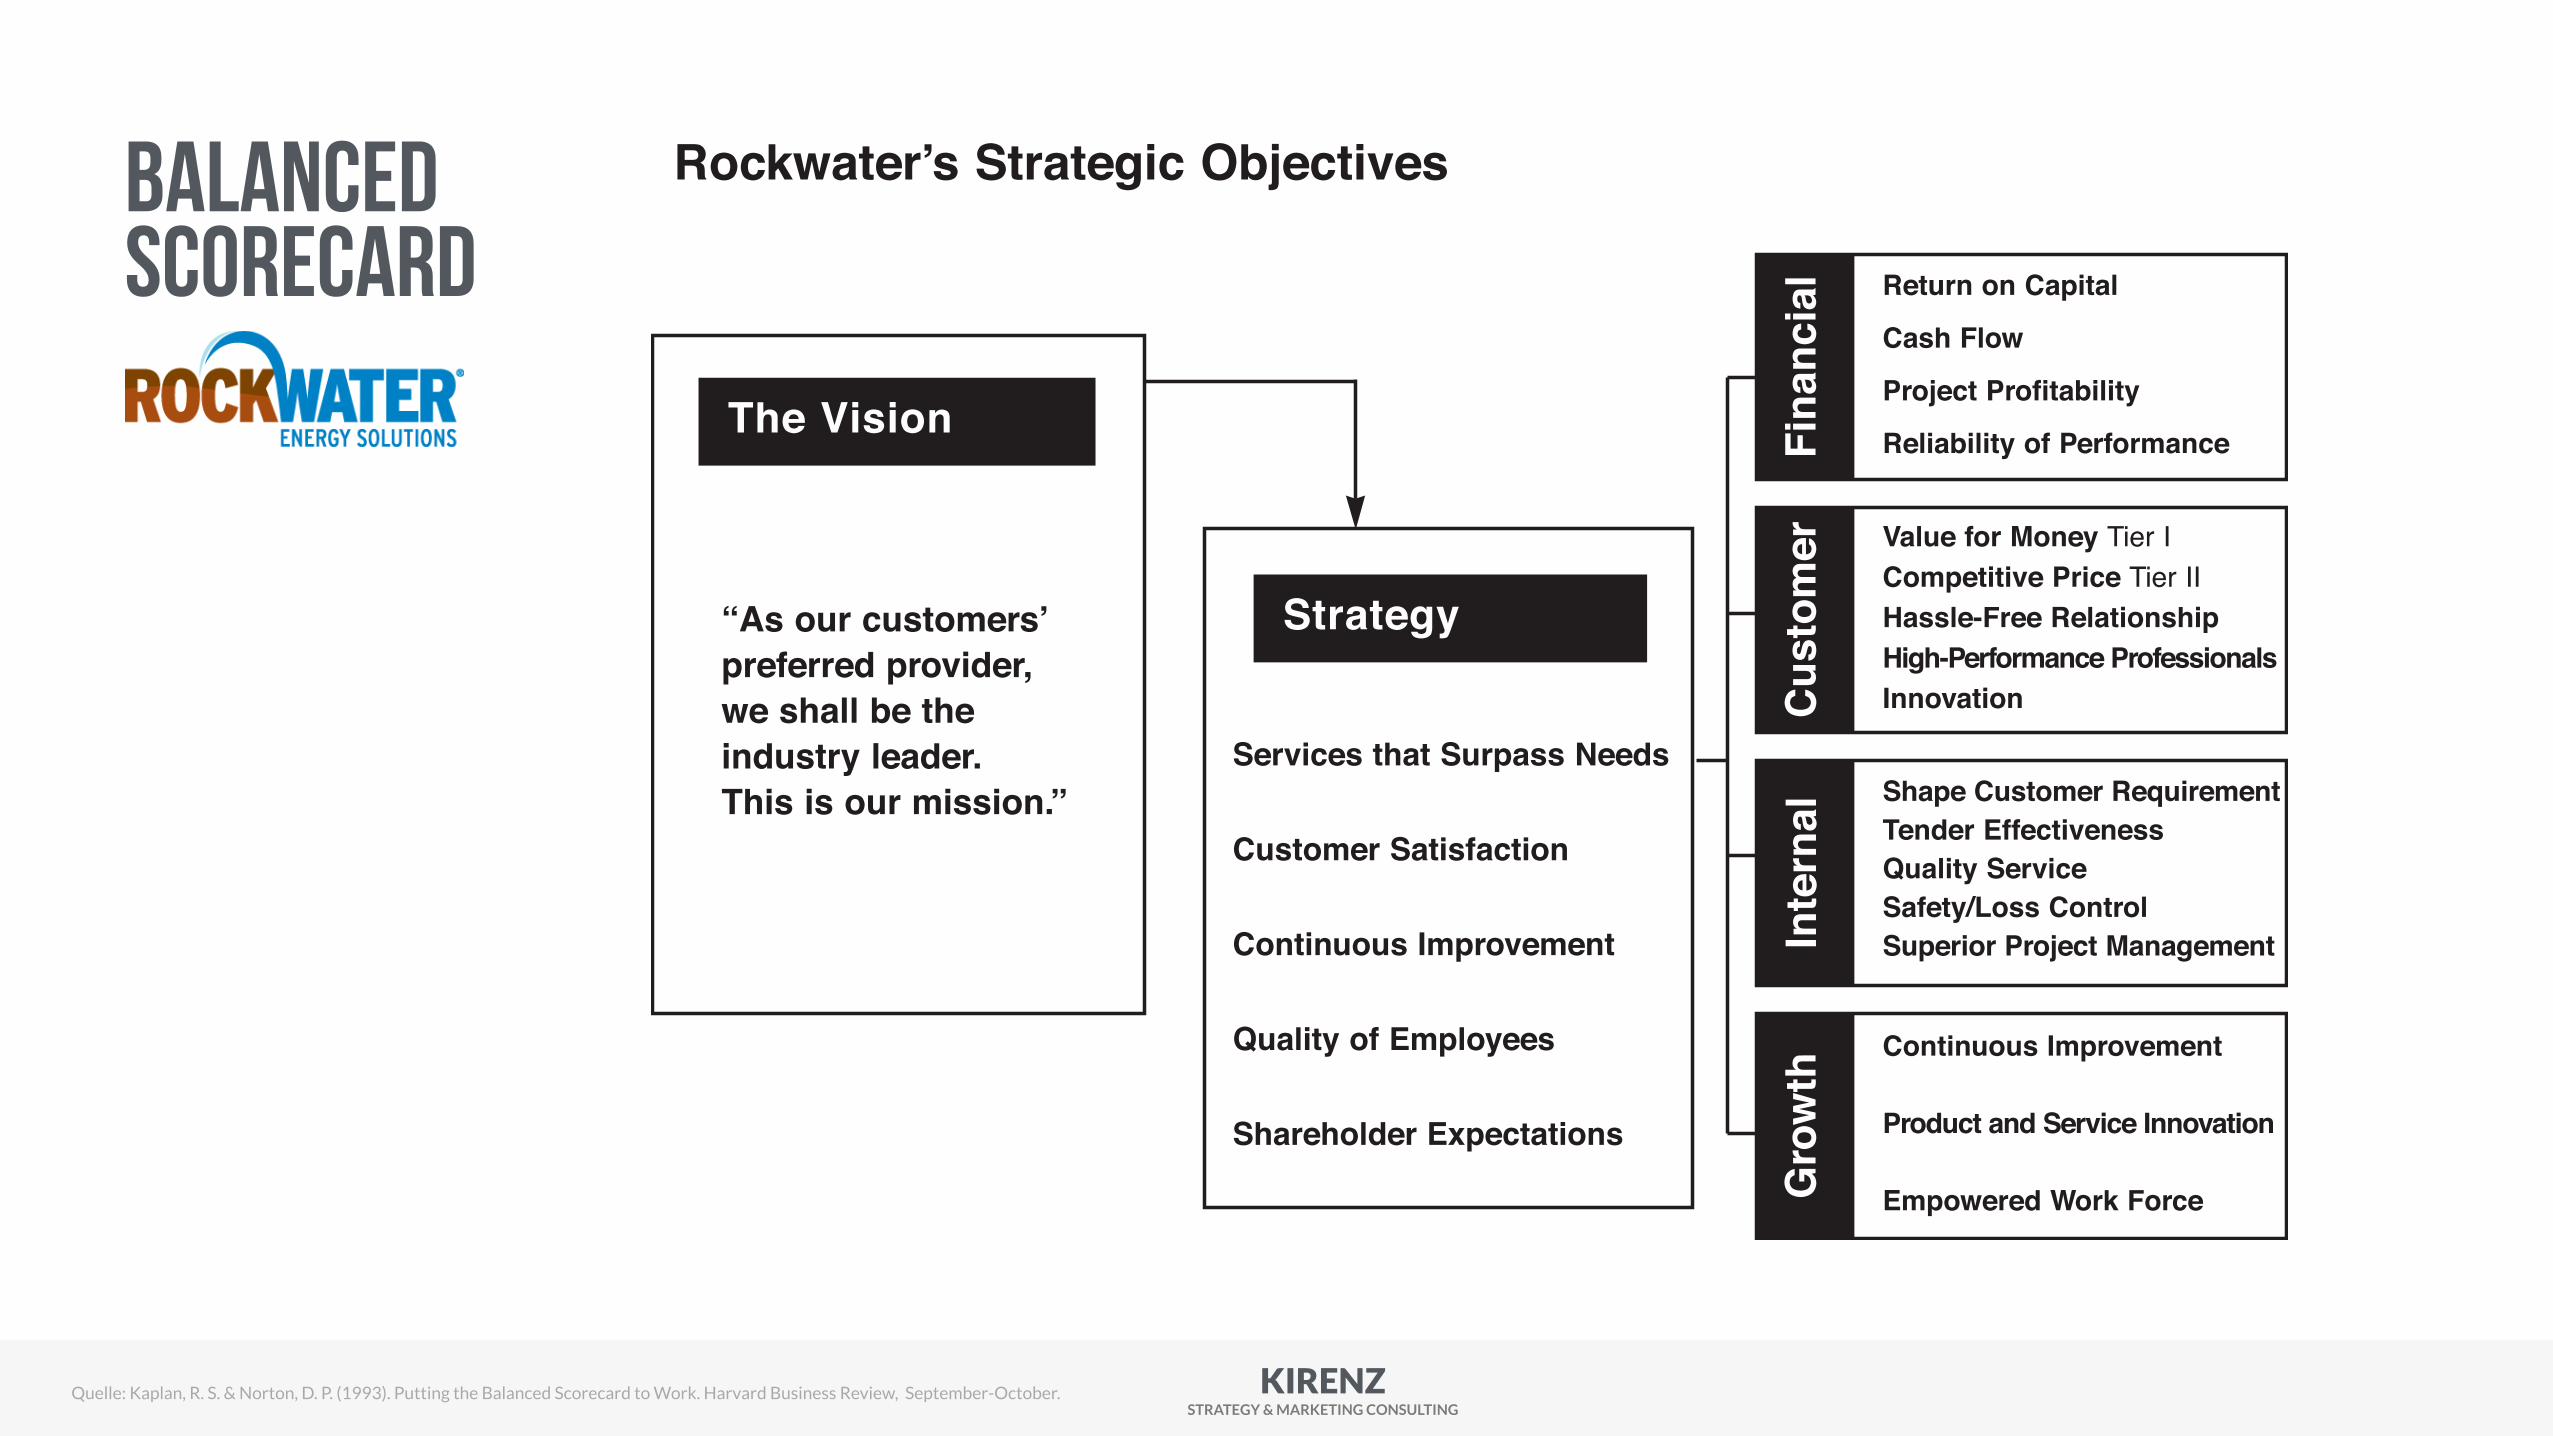
Rockwater’s Strategic Objectives
The Vision
“As our customers’preferred provider,we shall be theindustry leader.This is our mission.”
Strategy
Services that Surpass Needs
Customer Satisfaction
Continuous Improvement
Quality of Employees
Shareholder Expectations
Fina
ncia
lCu
stom
erIn
tern
alG
row
th
Return on Capital
Cash Flow
Project Profitability
Reliability of Performance
Value for Money Tier ICompetitive Price Tier IIHassle-Free RelationshipHigh-Performance ProfessionalsInnovation
Shape Customer RequirementTender EffectivenessQuality ServiceSafety/Loss ControlSuperior Project Management
Continuous Improvement
Product and Service Innovation
Empowered Work Force
balanced scorecard
Quelle: Kaplan, R. S. & Norton, D. P. (1993). Putting the Balanced Scorecard to Work. Harvard Business Review, September-October.
KIRENZ STRATEGY & MARKETING CONSULTING
Putting the Balanced Scorecard to Work
harvard business review • september–october 1993 page 8
an invaluable tool to help his company ulti-mately achieve its mission: to be number onein the industry.
Apple Computer: Adjusting Long-Term Performance
Apple Computer developed a balanced score-card to focus senior management on a strat-egy that would expand discussions beyondgross margin, return on equity, and marketshare. A small steering committee, intimatelyfamiliar with the deliberations and strategicthinking of Apple’s Executive ManagementTeam, chose to concentrate on measurementcategories within each of the four perspectivesand to select multiple measurements withineach category. For the financial perspective,Apple emphasized shareholder value; for thecustomer perspective, market share and cus-tomer satisfaction; for the internal processperspective, core competencies; and, finally,for the innovation and improvement perspec-tive, employee attitudes. Apple’s manage-ment stressed these categories in the follow-ing order:
Customer Satisfaction:
Historically, Applehad been a technology- and product-focusedcompany that competed by designing bettercomputers. Customer satisfaction metrics arejust being introduced to orient employees to-ward becoming a customer-driven company.J.D. Power & Associates, a customer-surveycompany, now works for the computer indus-try. However, because it recognized that itscustomer base was not homogeneous, Applefelt that it had to go beyond J.D. Power & As-sociates and develop its own independent sur-veys in order to track its key market segmentsaround the world.
Core Competencies:
Company executiveswanted employees to be highly focused on a
few key competencies: for example, user-friendly interfaces, powerful software archi-tectures, and effective distribution systems.However, senior executives recognized thatmeasuring performance along these compe-tency dimensions could be difficult. As a re-sult, the company is currently experimentingwith obtaining quantitative measures of thesehard-to-measure competencies.
Employee Commitment and Alignment:
Apple conducts a comprehensive employeesurvey in each of its organizations every twoyears; surveys of randomly selected employeesare performed more frequently. The surveyquestions are concerned with how well em-ployees understand the company’s strategy aswell as whether or not they are asked to de-liver results that are consistent with that strat-egy. The results of the survey are displayed interms of both the actual level of employee re-sponses and the overall trend of responses.
Market Share:
Achieving a critical thresh-old of market share was important to seniormanagement not only for the obvious salesgrowth benefits but also to attract and retainsoftware developers to Apple platforms.
Shareholder Value:
Shareholder value is in-cluded as a performance indicator, eventhough this measure is a result—not adriver—of performance. The measure is in-cluded to offset the previous emphasis ongross margin and sales growth, measures thatignored the investments required today togenerate growth for tomorrow. In contrast,the shareholder value metric quantifies theimpact of proposed investments for businesscreation and development. The majority ofApple’s business is organized on a functionalbasis—sales, product design, and worldwidemanufacturing and operations—so share-holder value can be calculated only for the en-tire company instead of at a decentralizedlevel. The measure, however, helps seniormanagers in each major organizational unitassess the impact of their activities on the en-tire company’s valuation and evaluate newbusiness ventures.
While these five performance indicatorshave only recently been developed, they havehelped Apple’s senior managers focus theirstrategy in a number of ways. First of all, thebalanced scorecard at Apple serves primarilyas a planning device, instead of as a control de-vice. To put it another way, Apple uses the
How Rockwater Fulfills Customer Needs
CustomerNeed
Recognized
CustomerNeedMet
Identify Win Prepare Perform Closeout
#1 #2 #3 #4 #5
DevelopmentCycle
Supply Cycle
balanced scorecard
Quelle: Kaplan, R. S. & Norton, D. P. (1993). Putting the Balanced Scorecard to Work. Harvard Business Review, September-October.
KIRENZ STRATEGY & MARKETING CONSULTING
Putting the Balanced Scorecard to Work
harvard business review • september–october 1993 page 10
7. Implementation
A newly formed team develops an implementation plan for the score-card, including linking the measures to databases and information sys-tems, communicating the balanced scorecard throughout the organiza-tion, and encouraging and facilitat-ing the development of second-level metrics for decentralized units. As a
result of this process, for instance, an entirely new executive information system that links top-level business unit metrics down through shop floor and site-specific operational measures could be developed.
8. Periodic Reviews
Each quarter or month, a blue book of information on the balanced
scorecard measures is prepared for both top management review and discussion with managers of decen-tralized divisions and departments. The balanced scorecard metrics are revisited annually as part of the stra-tegic planning, goal setting, and re-source allocation processes.
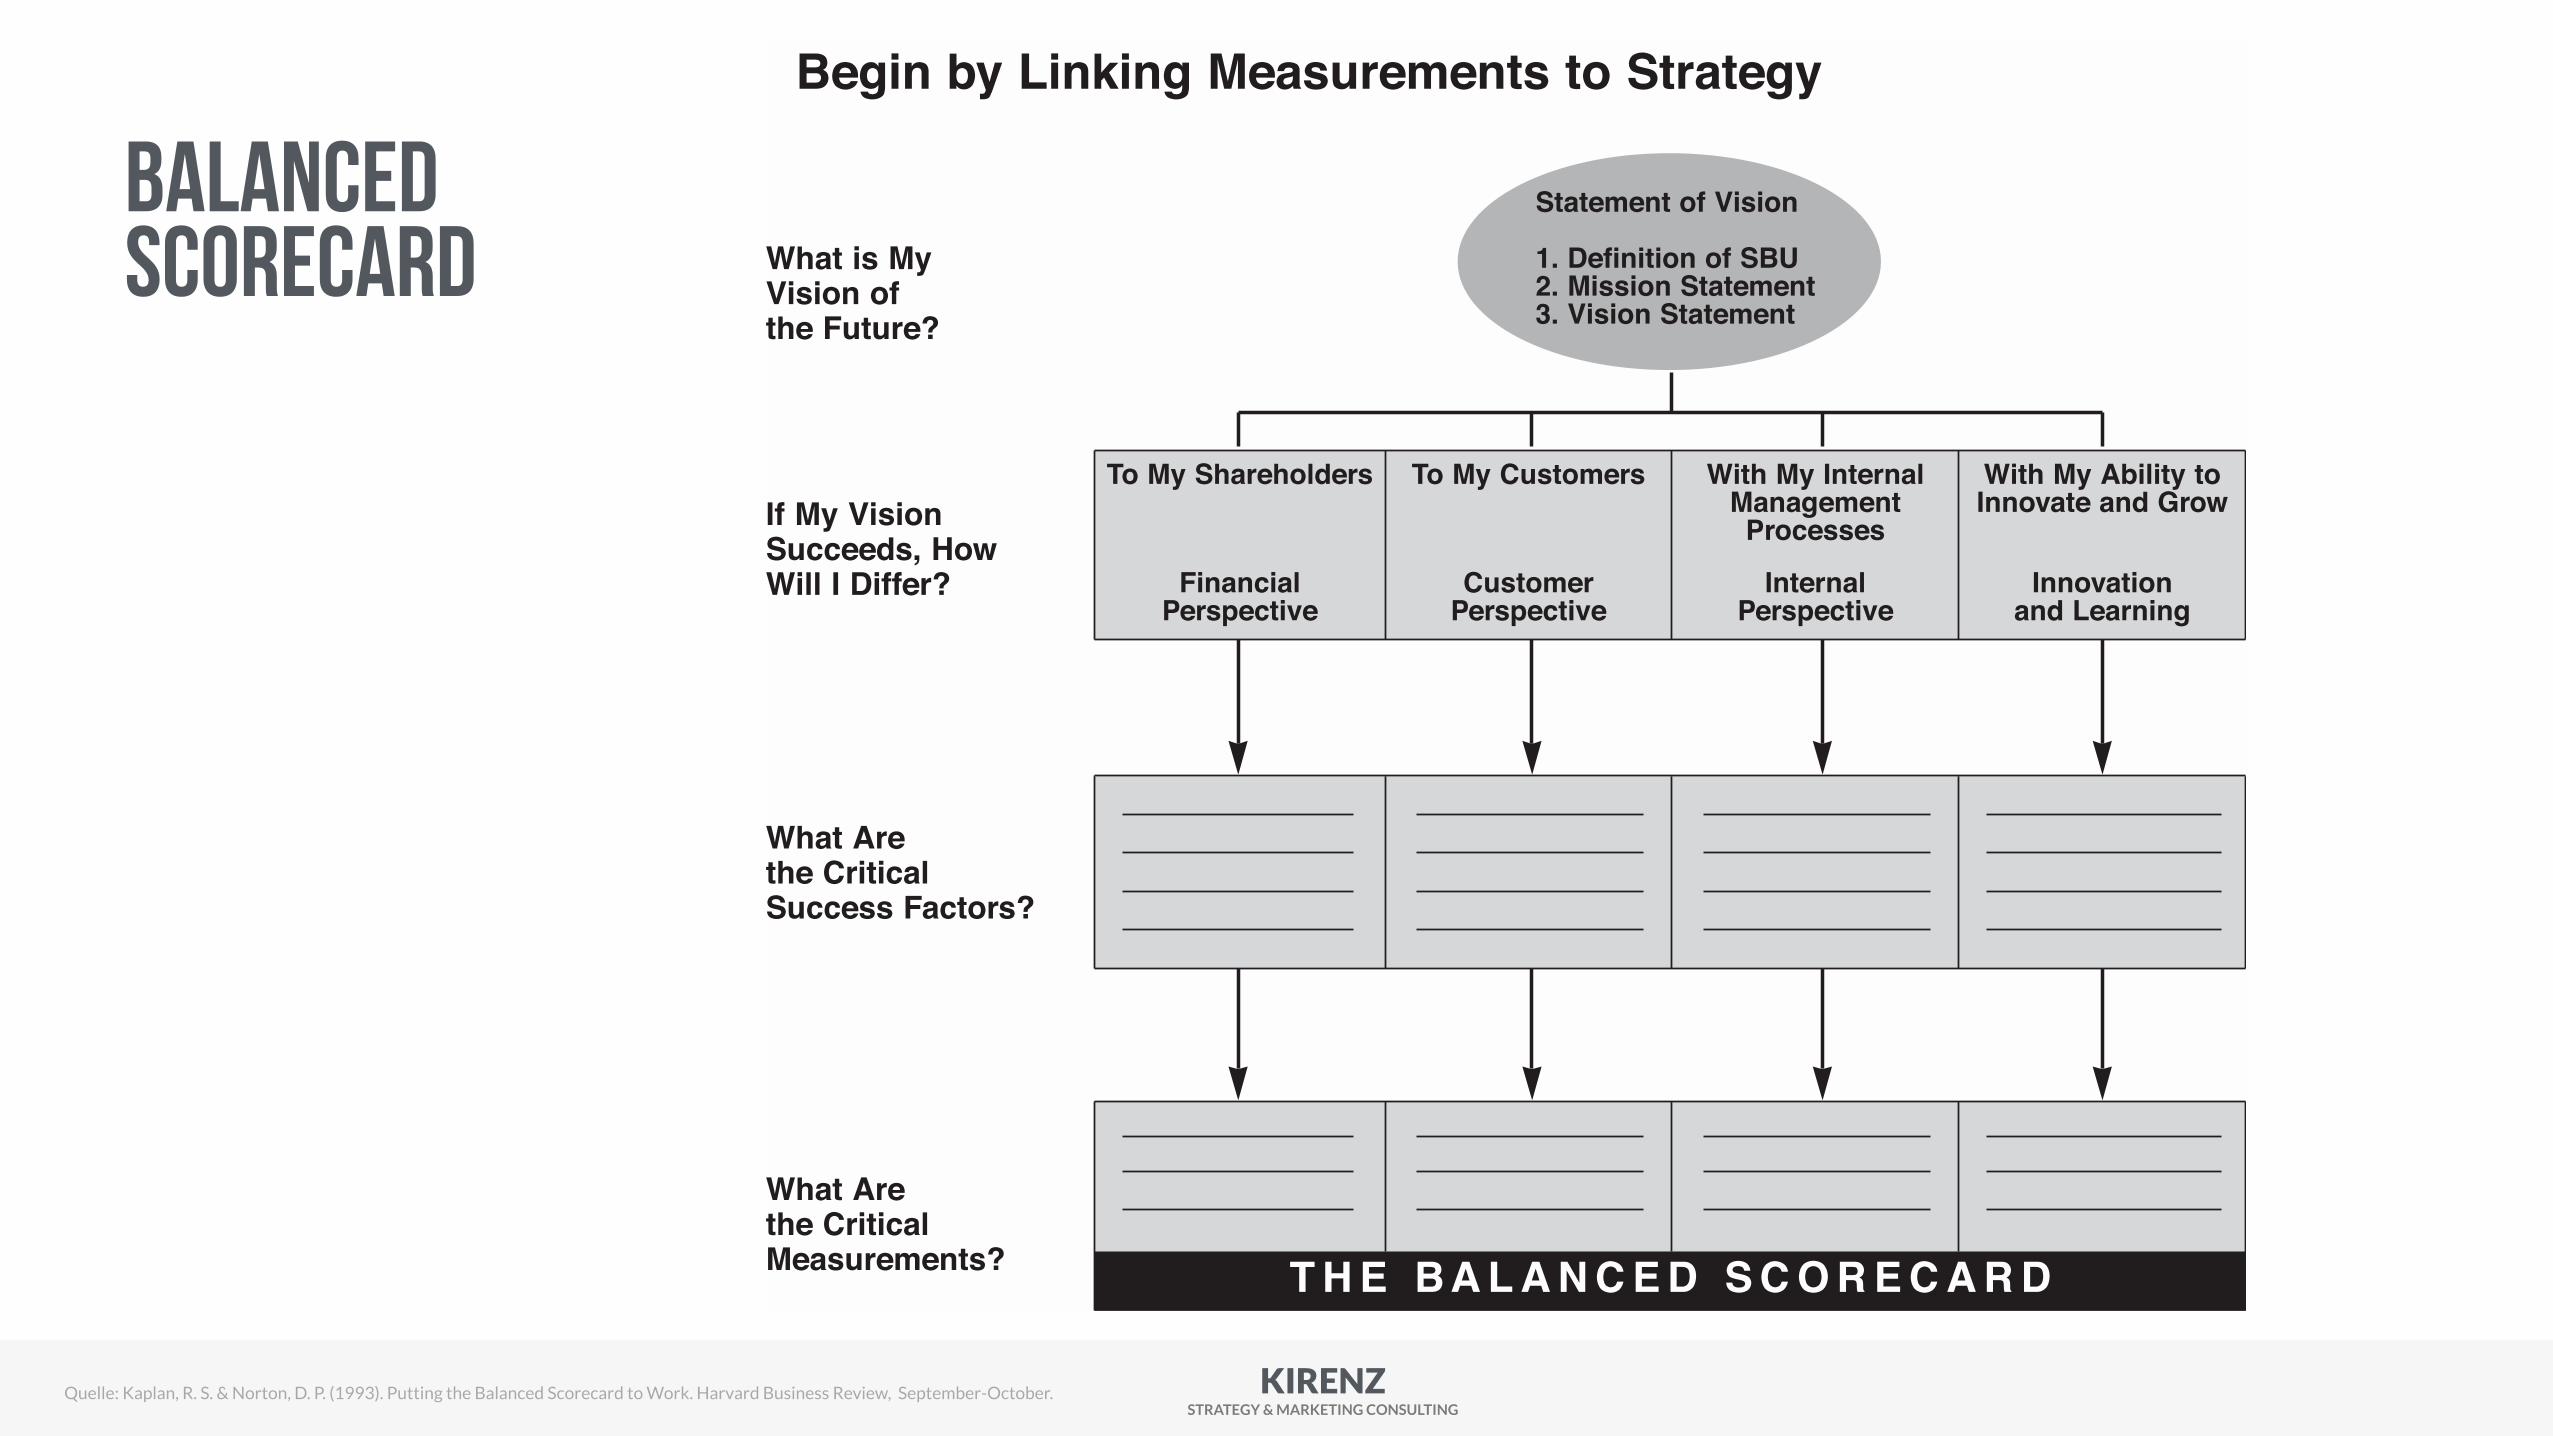
With My Ability toInnovate and Grow
Innovationand Learning
To My Shareholders
FinancialPerspective
With My InternalManagement
Processes
Internal Perspective
To My Customers
CustomerPerspective
Begin by Linking Measurements to Strategy
T H E BA L A N C E D S C O R E C A R D
If My VisionSucceeds, HowWill I Differ?
What is MyVision ofthe Future?
What Arethe CriticalSuccess Factors?
What Arethe CriticalMeasurements?
Statement of Vision
1. Definition of SBU2. Mission Statement3. Vision Statement
balanced scorecard
Quelle: Kaplan, R. S. & Norton, D. P. (1993). Putting the Balanced Scorecard to Work. Harvard Business Review, September-October.
KIRENZ STRATEGY & MARKETING CONSULTING
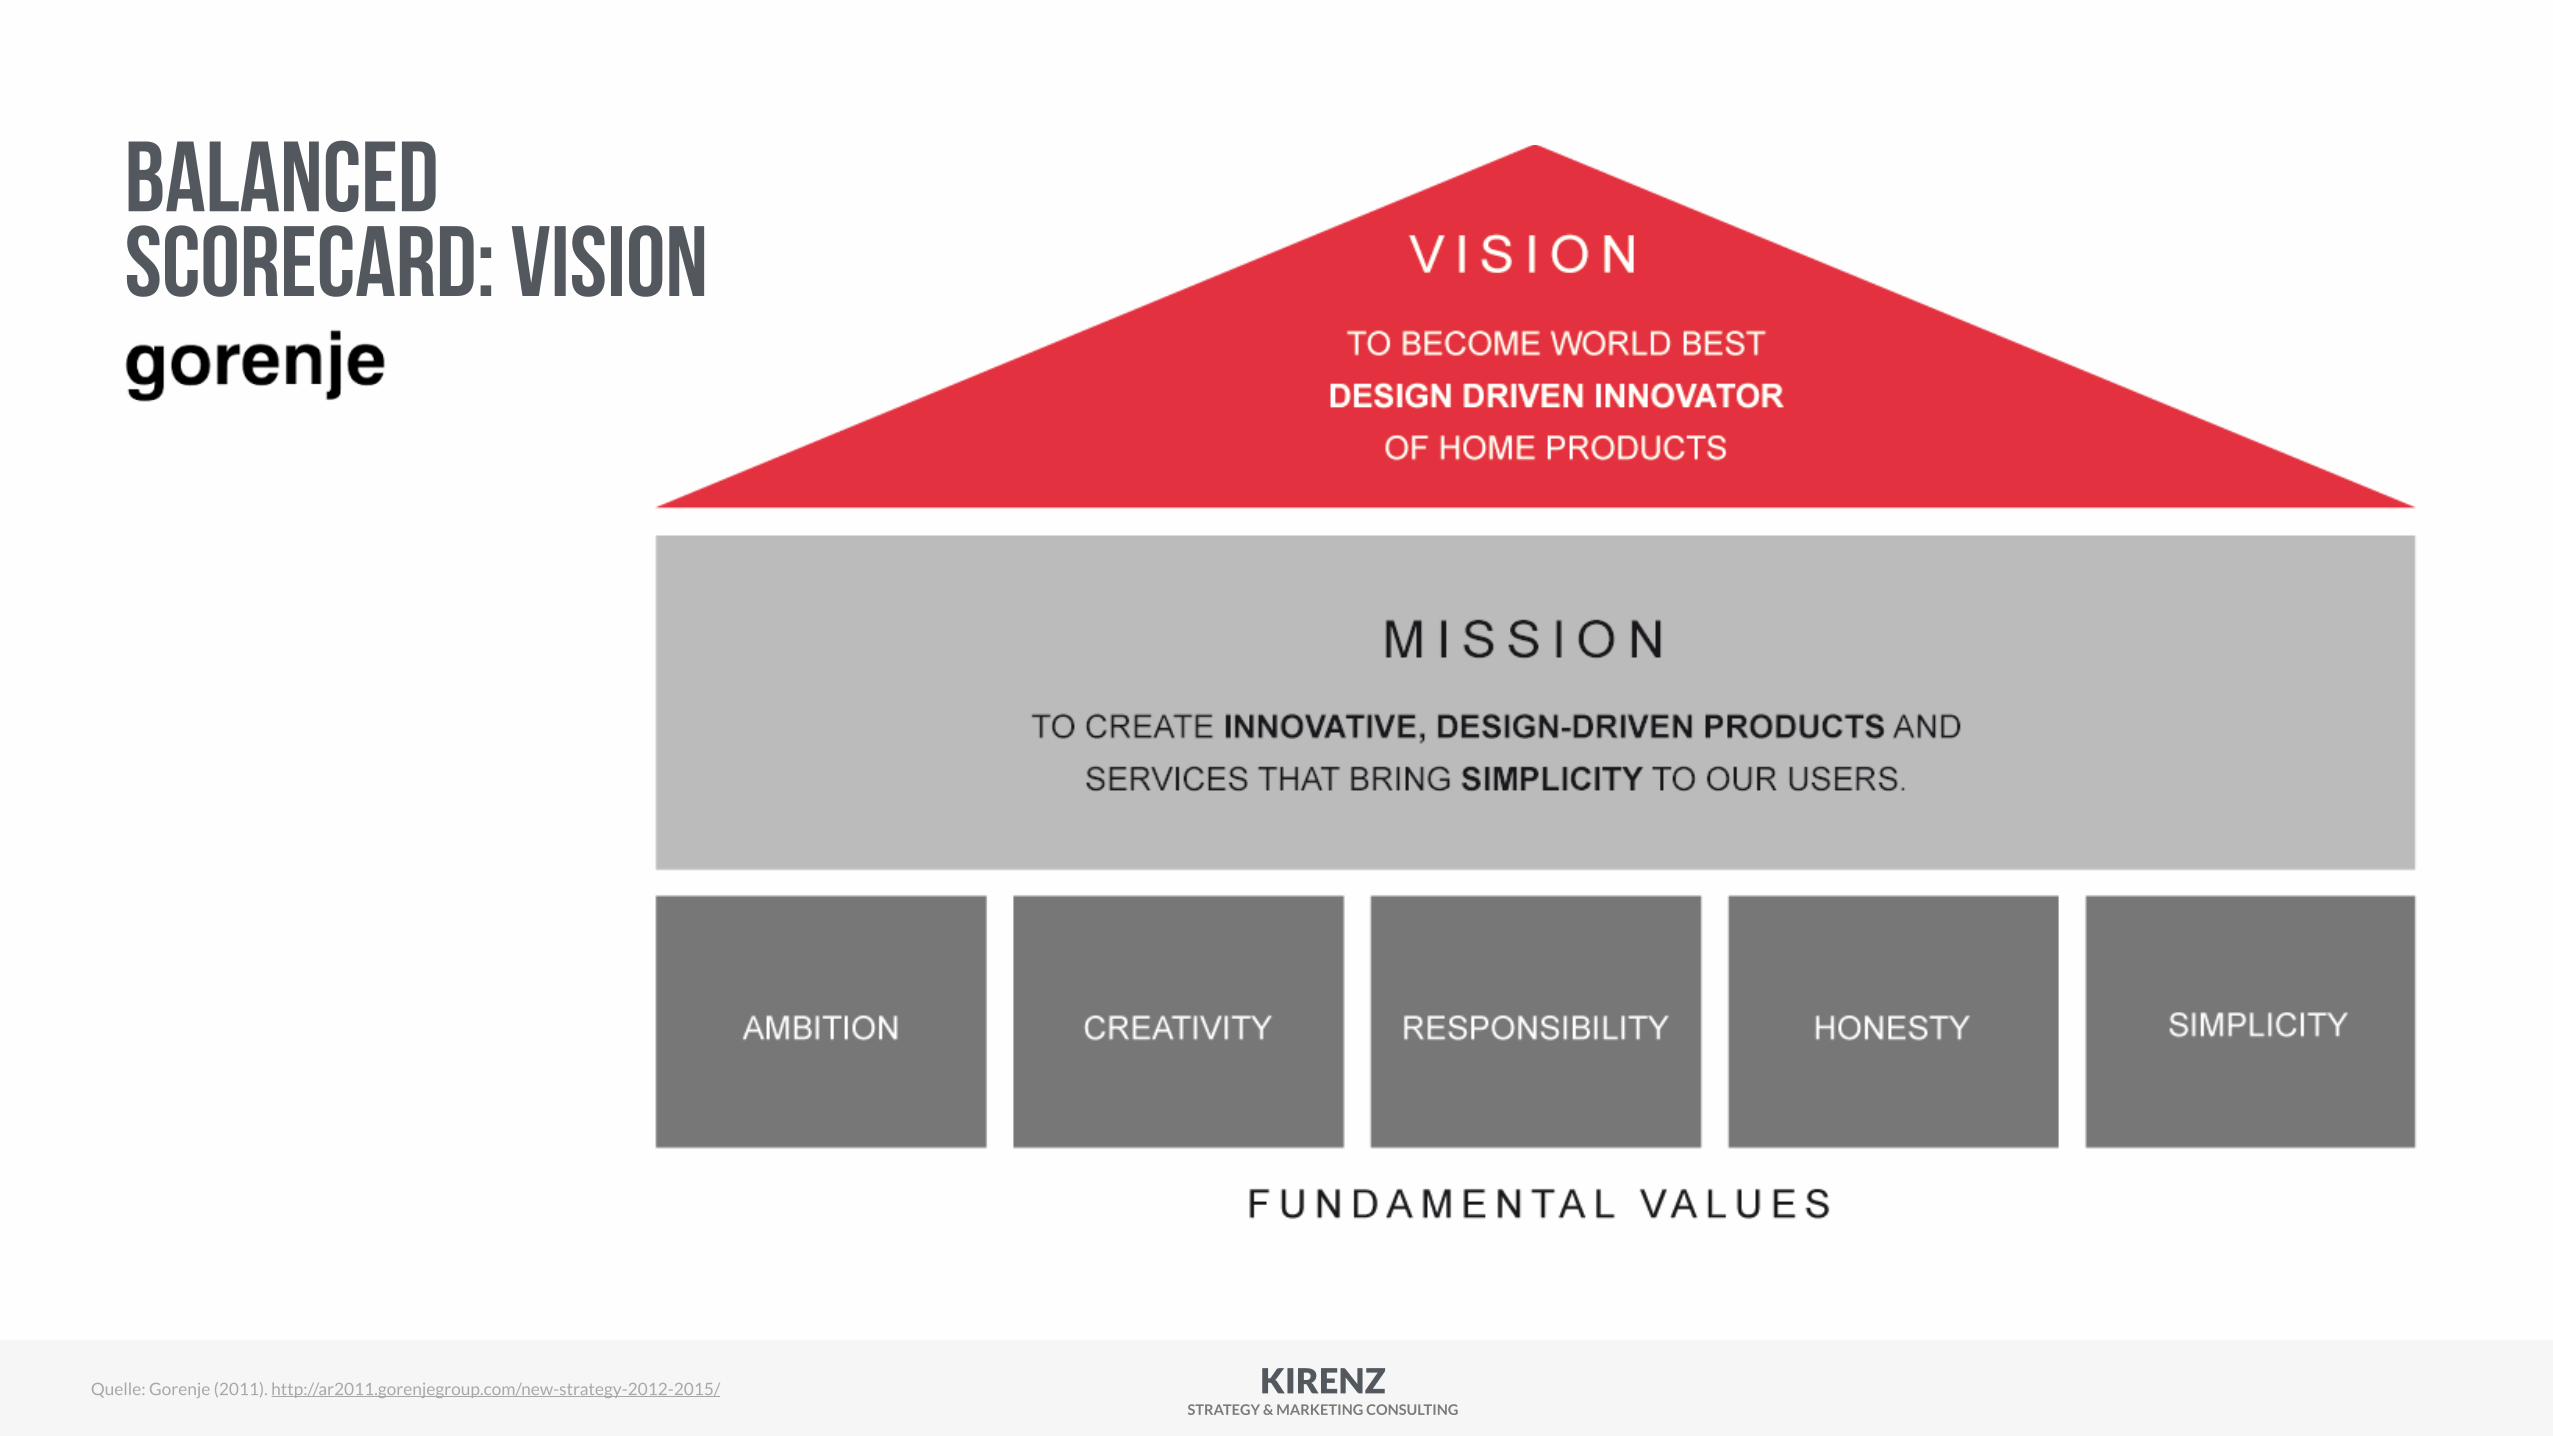
Quelle: Gorenje (2011). http://ar2011.gorenjegroup.com/new-strategy-2012-2015/
balanced scorecard: Vision
KIRENZ STRATEGY & MARKETING CONSULTING
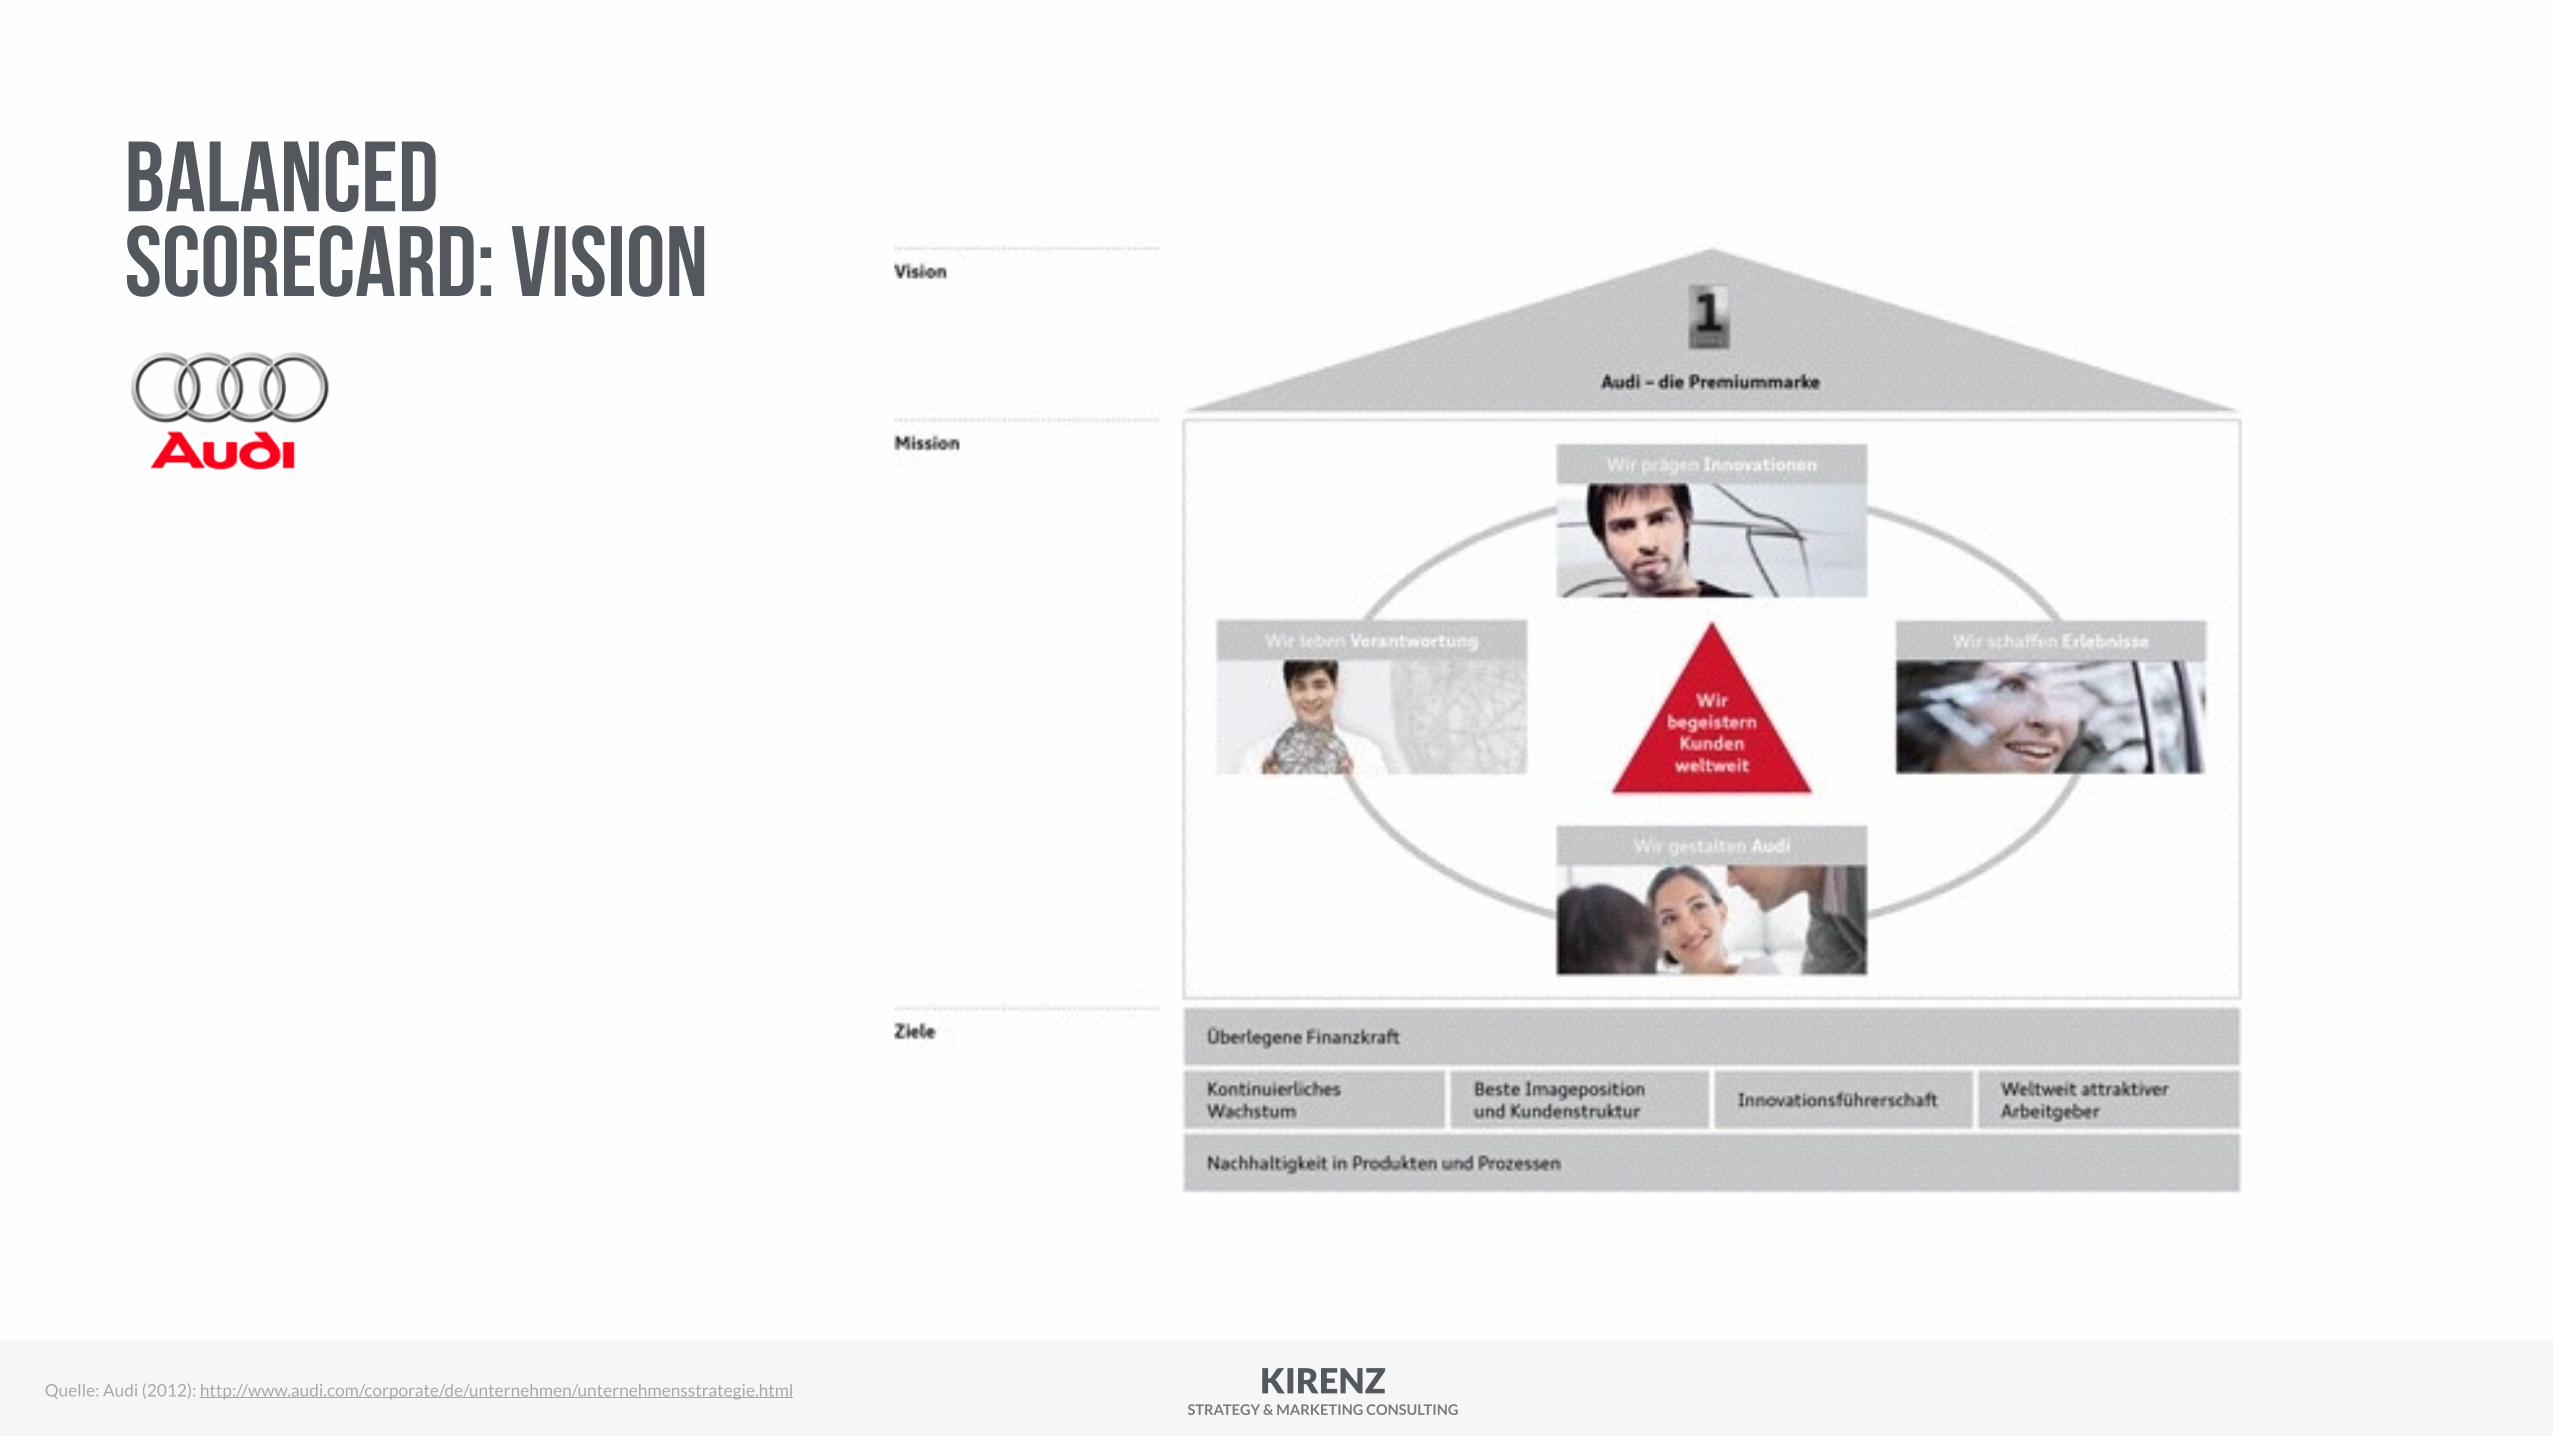
Quelle: Audi (2012): http://www.audi.com/corporate/de/unternehmen/unternehmensstrategie.html
balanced scorecard: Vision
KIRENZ STRATEGY & MARKETING CONSULTING
Using the Balanced Scorecard as a Strategic Management System
harvard business review • january–february 1996 page 46
First, it articulates the company’s shared vi-sion, defining in clear and operational termsthe results that the company, as a team, is try-ing to achieve. The scorecard communicates aholistic model that links individual efforts andaccomplishments to business unit objectives.
Second, the scorecard supplies the essentialstrategic feedback system. A business strategycan be viewed as a set of hypotheses aboutcause-and-effect relationships. A strategic feed-back system should be able to test, validate,and modify the hypotheses embedded in abusiness unit’s strategy. By establishing short-term goals, or milestones, within the business
planning process, executives are forecastingthe relationship between changes in perfor-mance drivers and the associated changes inone or more specified goals. For example, exec-utives at Metro Bank estimated the amount oftime it would take for improvements in train-ing and in the availability of information sys-tems before employees could sell multiple fi-nancial products effectively to existing andnew customers. They also estimated how greatthe effect of that selling capability would be.
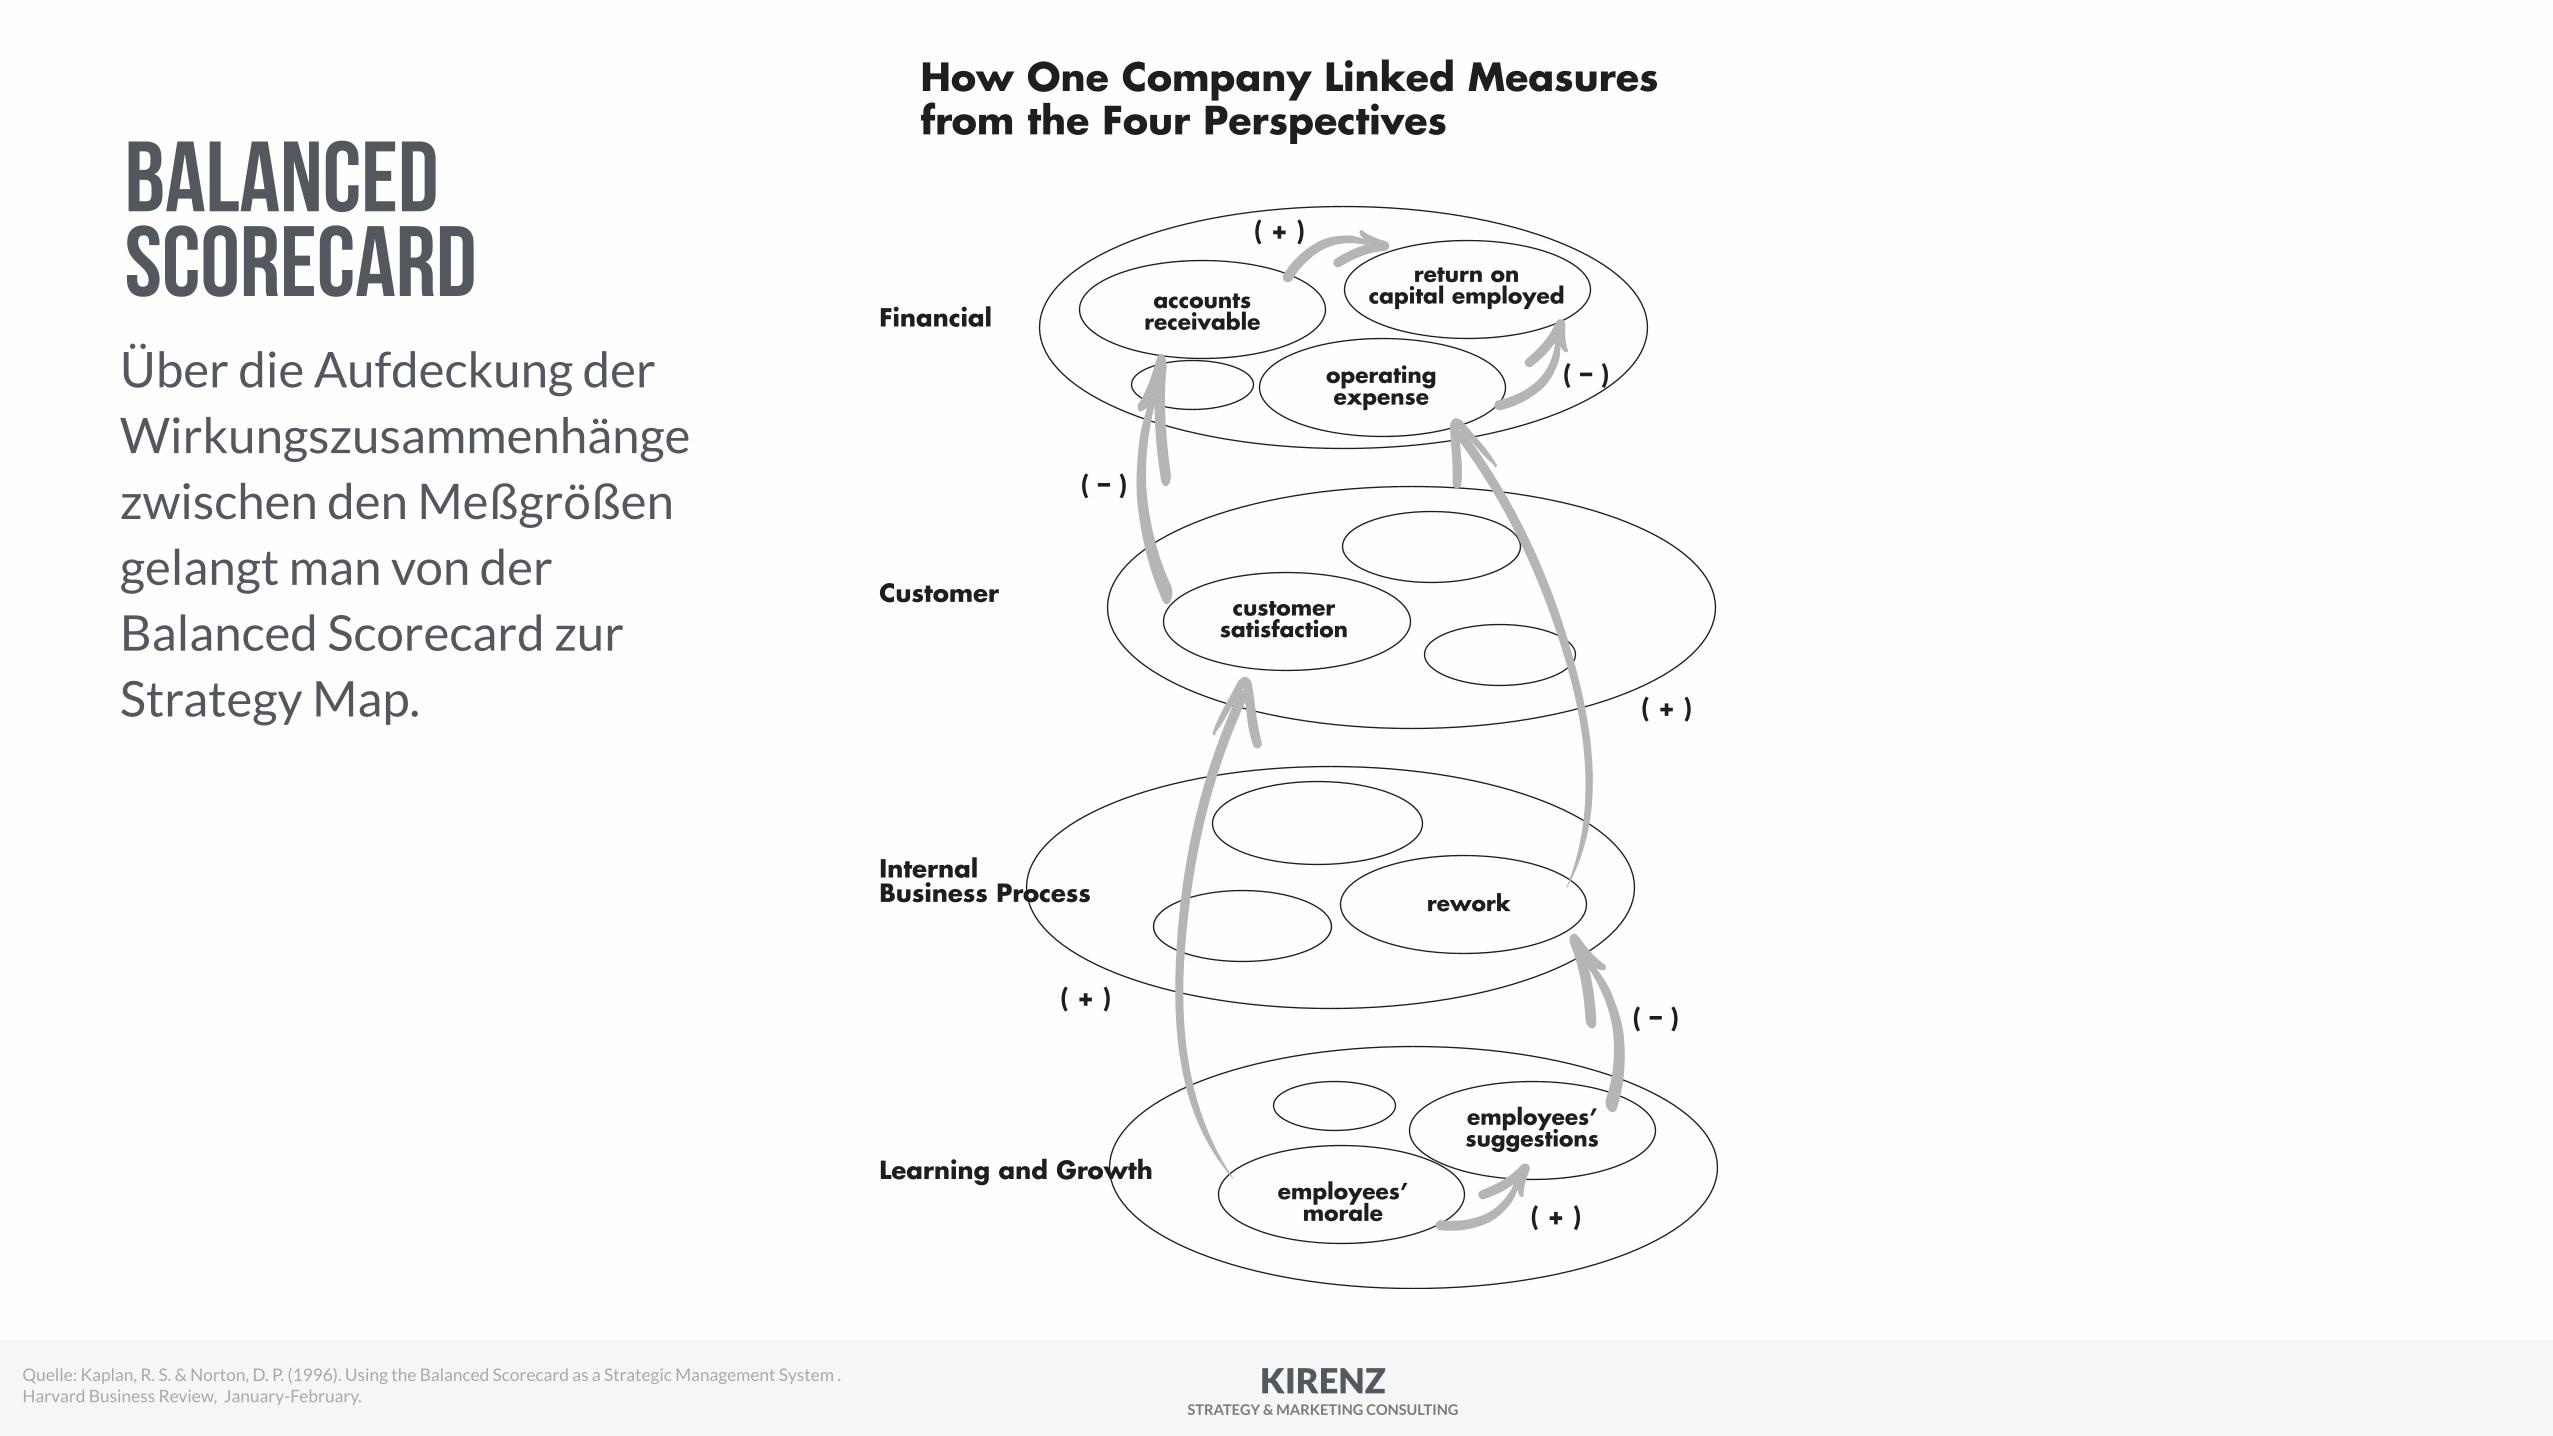
Another organization attempted to validateits hypothesized cause-and-effect relationshipsin the balanced scorecard by measuring thestrength of the linkages among measures inthe different perspectives. (See the chart “HowOne Company Linked Measures from the FourPerspectives.”) The company found significantcorrelations between employees’ morale, ameasure in the learning-and-growth perspec-tive, and customer satisfaction, an importantcustomer perspective measure. Customer satis-faction, in turn, was correlated with faster pay-ment of invoices—a relationship that led to asubstantial reduction in accounts receivableand hence a higher return on capital em-ployed. The company also found correlationsbetween employees’ morale and the numberof suggestions made by employees (twolearning-and-growth measures) as well as be-tween an increased number of suggestions andlower rework (an internal-business-processmeasure). Evidence of such strong correlationshelp to confirm the organization’s businessstrategy. If, however, the expected correlationsare not found over time, it should be an indica-tion to executives that the theory underlyingthe unit’s strategy may not be working as theyhad anticipated.
Especially in large organizations, accumulat-ing sufficient data to document significant cor-relations and causation among balanced score-card measures can take a long time—months oryears. Over the short term, managers’ assess-ment of strategic impact may have to rest onsubjective and qualitative judgments. Eventu-ally, however, as more evidence accumulates,organizations may be able to provide more ob-jectively grounded estimates of cause-and-effectrelationships. But just getting managers tothink systematically about the assumptions un-derlying their strategy is an improvement overthe current practice of making decisions basedon short-term operational results.
Quelle: Kaplan, R. S. & Norton, D. P. (1996). Using the Balanced Scorecard as a Strategic Management System . Harvard Business Review, January-February.
balanced scorecardÜber die Aufdeckung der Wirkungszusammenhänge zwischen den Meßgrößen gelangt man von der Balanced Scorecard zur Strategy Map.
KIRENZ STRATEGY & MARKETING CONSULTING
Strategy MapPING
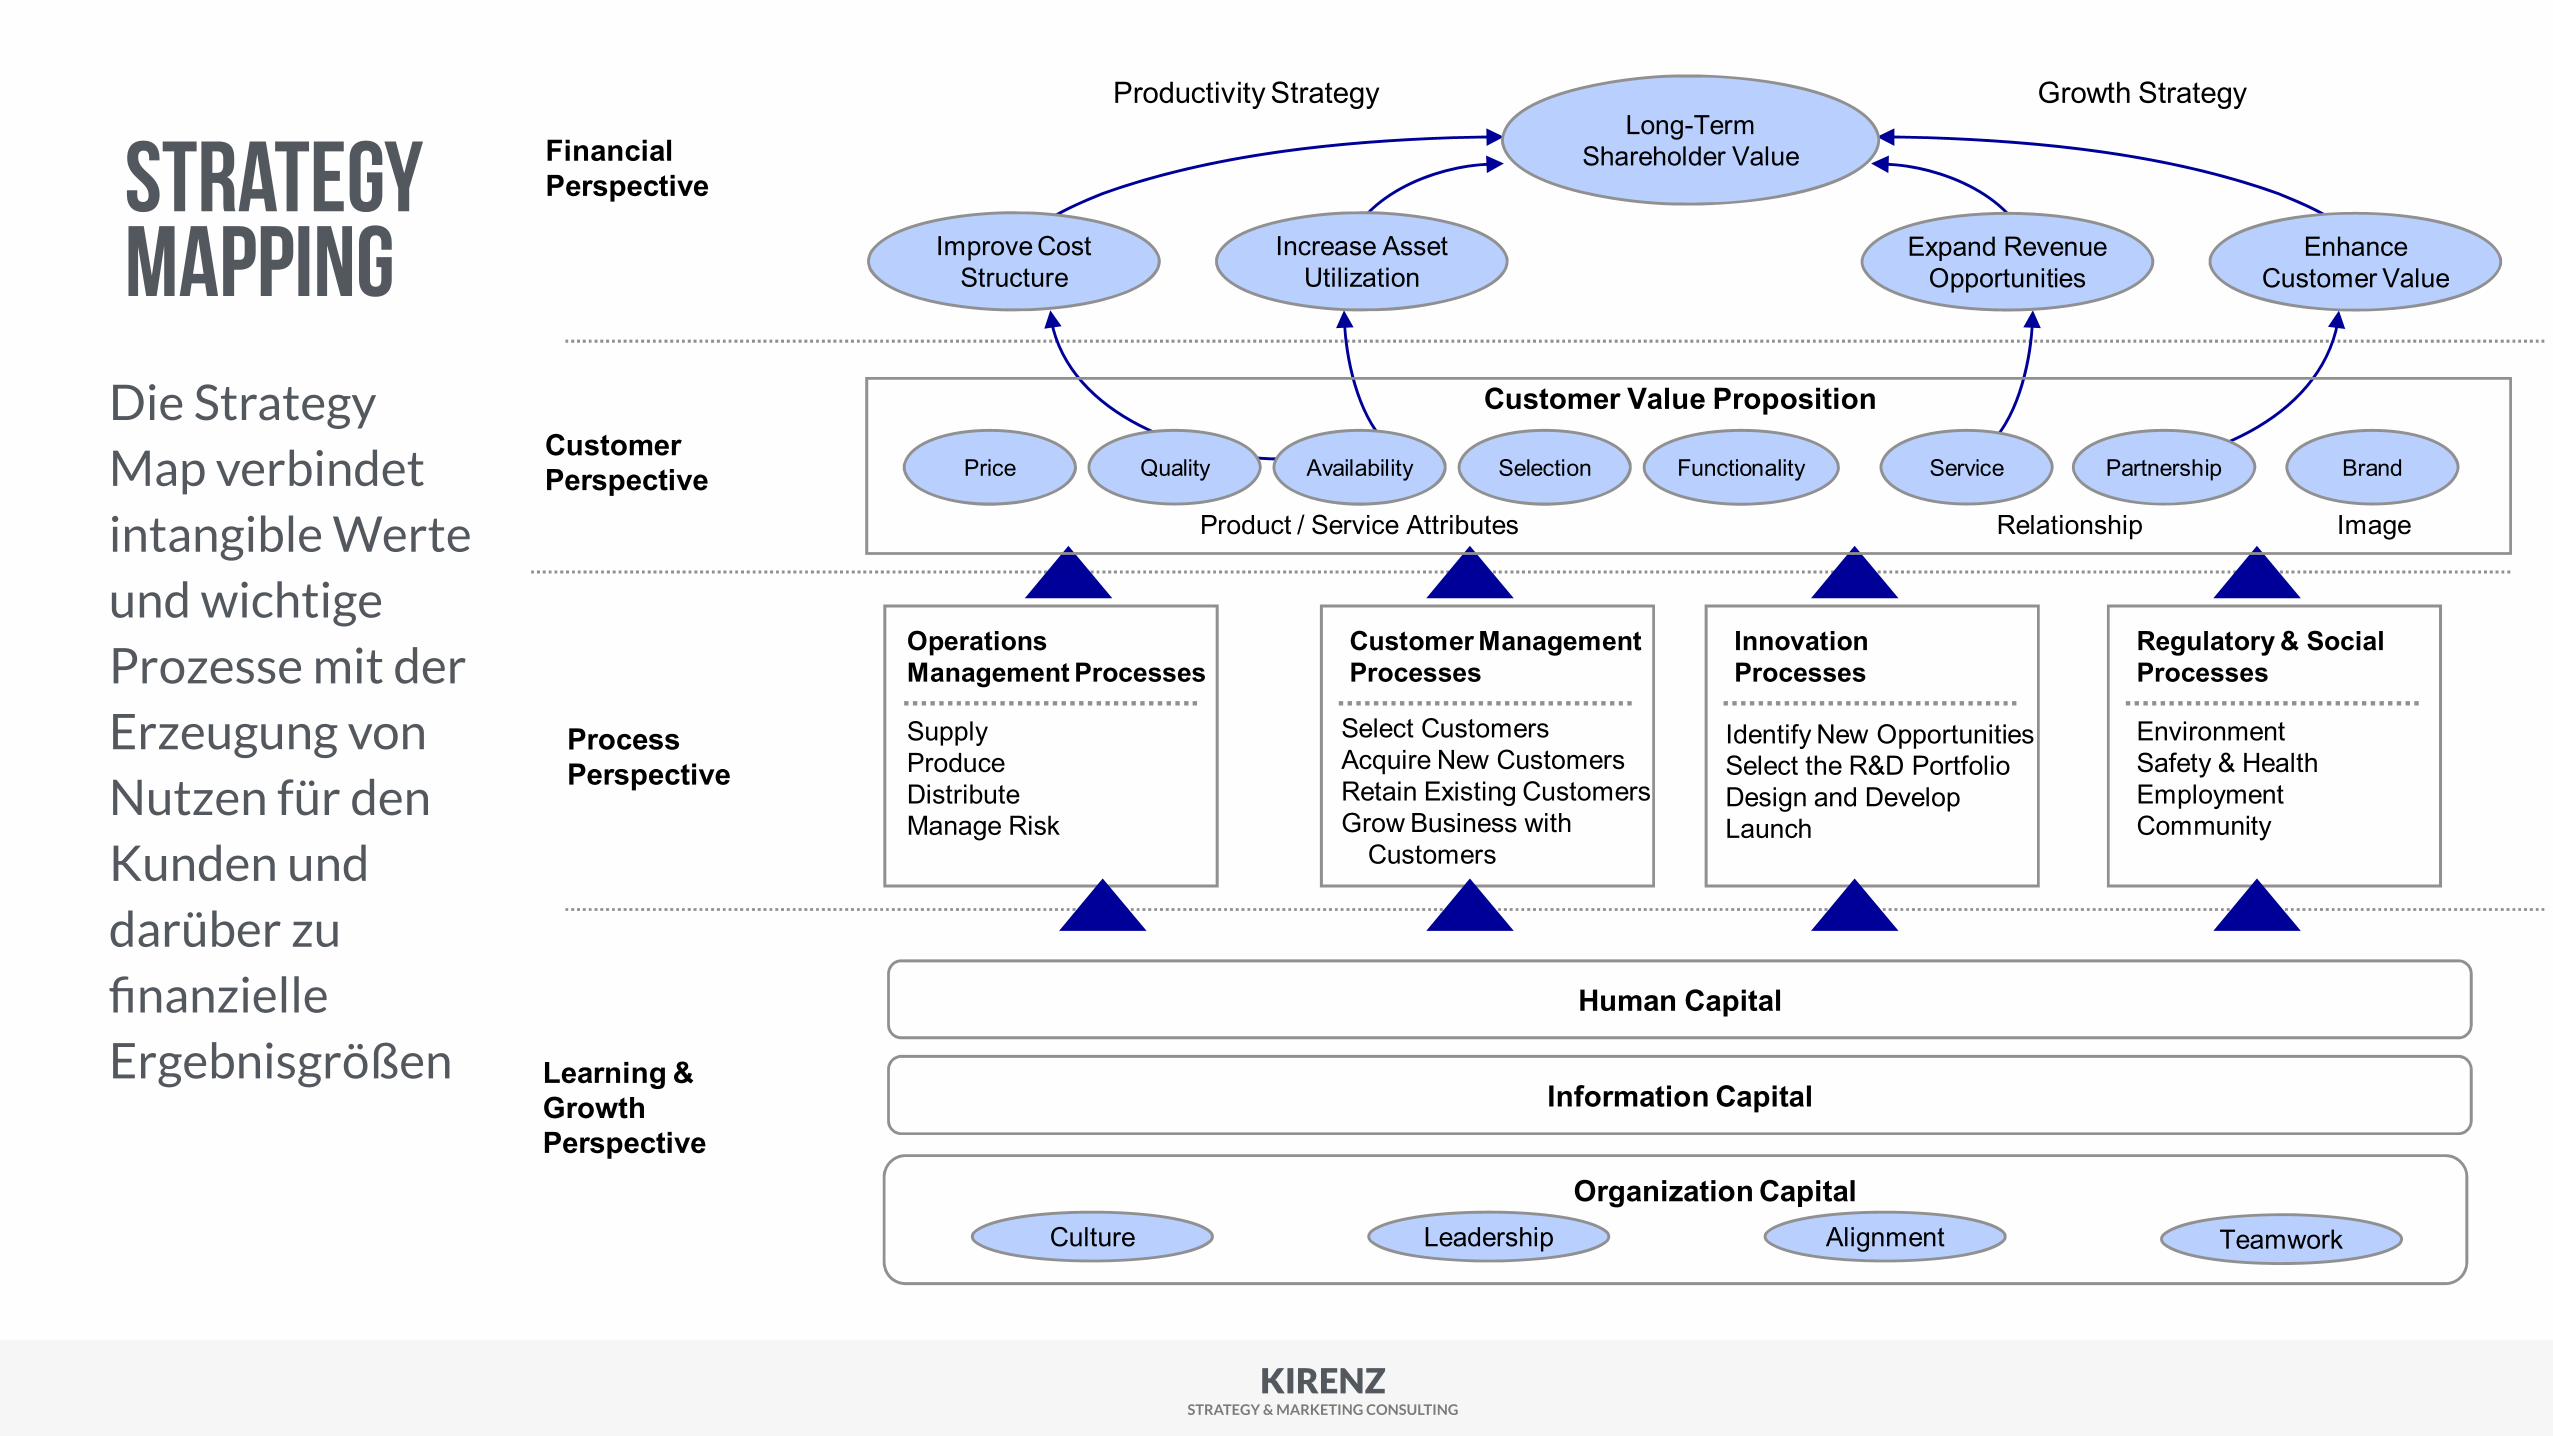
Die Strategy Map verbindet intangible Werte und wichtige Prozesse mit der Erzeugung von Nutzen für den Kunden und darüber zu finanzielle Ergebnisgrößen
22
SupplyProduceDistributeManage Risk
OperationsManagement Processes
Process Perspective
EnvironmentSafety & HealthEmploymentCommunity
Regulatory & Social Processes
Select CustomersAcquire New CustomersRetain Existing CustomersGrow Business with
Customers
Customer ManagementProcesses
Information Capital
Organization CapitalCulture Leadership TeamworkAlignment
Identify New OpportunitiesSelect the R&D PortfolioDesign and DevelopLaunch
InnovationProcesses
Learning & Growth Perspective
Human Capital
Relationship Image
Customer Perspective
Customer Value Proposition
Price Quality Availability Selection Functionality Service Partnership Brand
Product / Service Attributes
Financial Perspective
Long-Term Shareholder Value
Productivity Strategy Growth Strategy
Enhance Customer Value
Improve Cost Structure
Increase Asset Utilization
Expand Revenue Opportunities
Figure 2: The strategy map links intangible assets and critical processes to the value proposition and customer and financial outcomes
We recognized that the weakest link in a strategy map and Balanced Scorecard was the
learning and growth perspective. For many years, as one executive described it, the learning and
growth perspective was “the black hole of the Balanced Scorecard.” While companies had some
generic measures for employees, such as employee satisfaction and morale, turnover, absenteeism
and lateness (probably growing out of the stakeholder movement of the previous decade), none
had metrics that linked their employee capabilities to the strategy. A few scholars had
investigated the connection between improvements in human resources and improved financial
performance (e.g. Huselid, 1995; Becker et al., 1998)
Dave Norton led a research project in 2002 and 2003 with senior HR professionals to
explore how to better link the measurement of human resources to strategic objectives. From this
work came the concepts of strategic human capital readiness and strategic job families and, by
extension, the linkages to information capital and organizational capital. These important
extensions to embed the capabilities of a company’s most important intangible assets were
described in an HBR article and a book (Kaplan & Norton, 2004a&b)
KIRENZ STRATEGY & MARKETING CONSULTING
Measuring the Strategic Readiness of Intangible Assets
harvard business review • february 2004 page 23
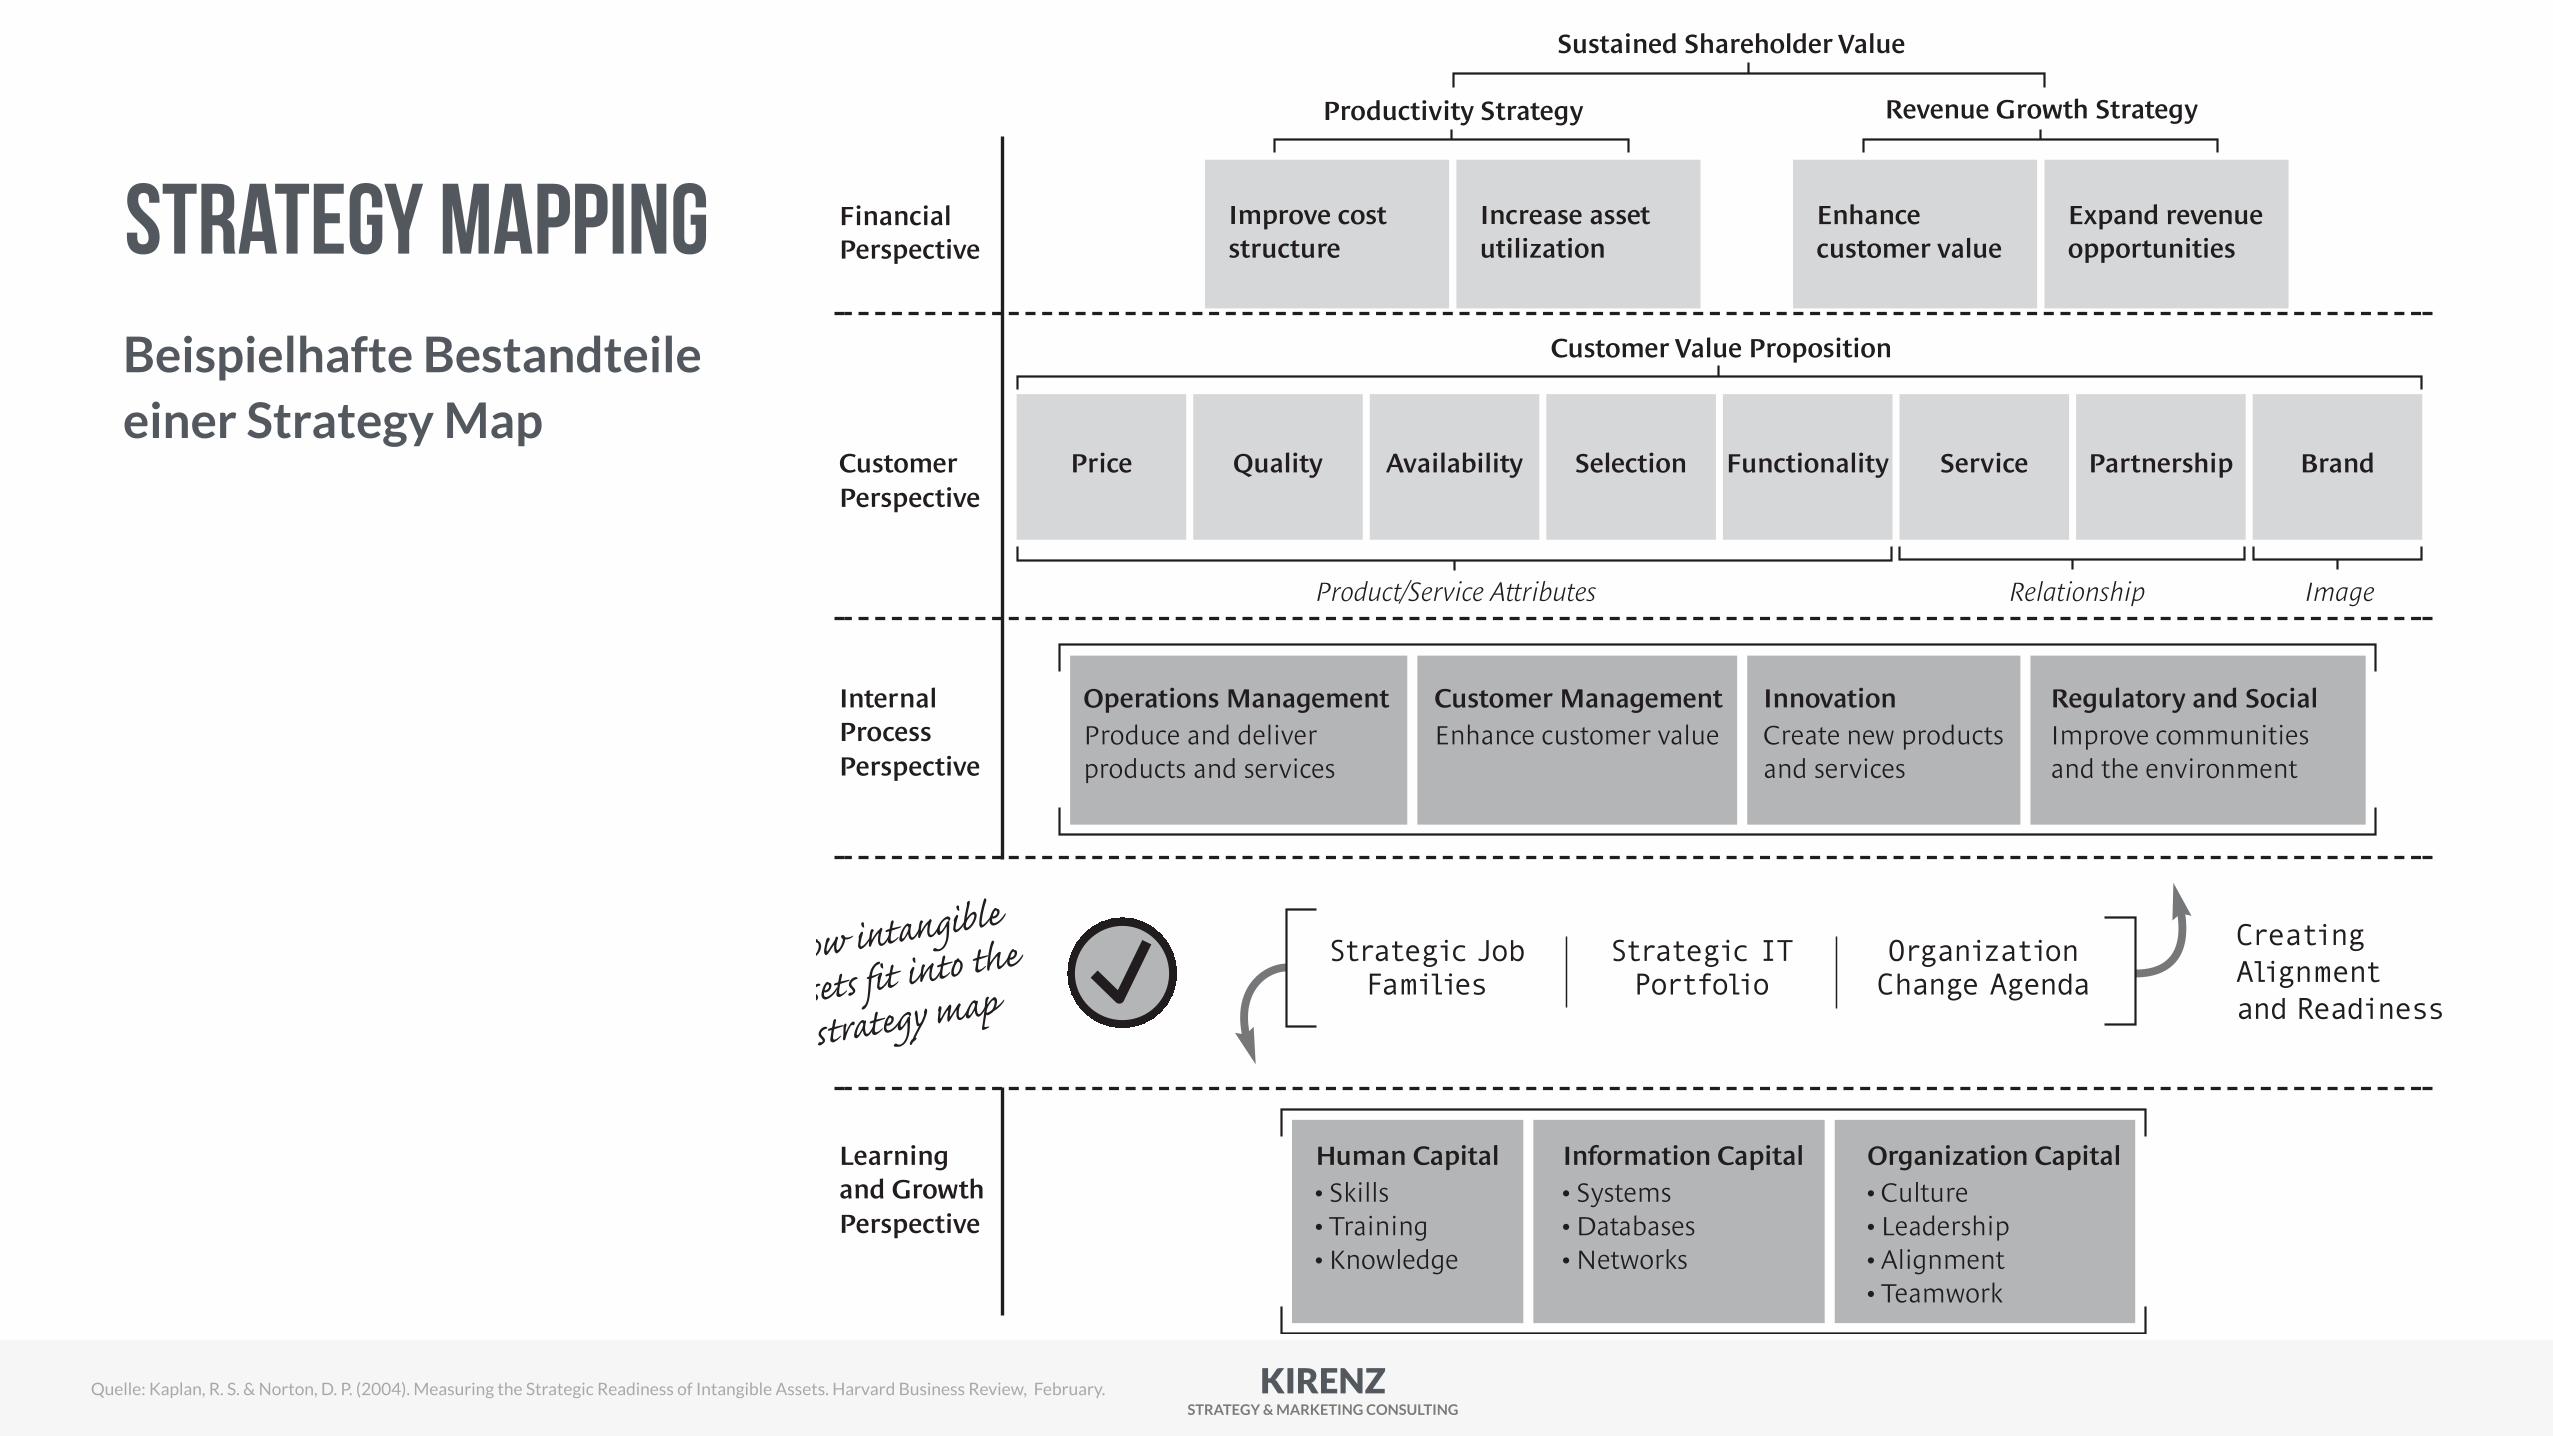
The Strategy MapThe strategy map provides a frame-work for linking intangible assets to shareholder value creation through four interrelated perspectives. The fi-nancial perspective describes the tangi-ble outcomes of the strategy in tradi-tional financial terms, such as ROI, shareholder value, profitability, reve-nue growth, and lower unit costs. The customer perspective defines the value proposition the organization intends
to use to generate sales and loyalty from targeted customers. This value proposition forms the context in which the intangible assets create value. The internal process perspective identifies the critical few processes that create and deliver the differentiating cus-tomer value proposition. At the foun-dation of the map, we have the learn-ing and growth perspective, which identifies the intangible assets that are
most important to the strategy. The objectives in this perspective identify which jobs (the human capital), which systems (the information capital), and what kind of climate (the organization capital) are required to support the value-creating internal processes. These intangible assets must be inte-grated and aligned with the critical in-ternal processes.
Learning and GrowthPerspective
Productivity Strategy Revenue Growth Strategy
Sustained Shareholder Value
Operations Management Produce and deliver products and services
Customer Management Enhance customer value
InnovationCreate new products and services
Regulatory and SocialImprove communities and the environment
Customer Value Proposition
Human Capital• Skills• Training• Knowledge
Information Capital• Systems• Databases• Networks
Organization Capital• Culture• Leadership• Alignment• Teamwork
Financial Perspective
CustomerPerspective
Internal ProcessPerspective
Improve cost structure
BrandPrice Quality Availability Selection Functionality Service Partnership
Relationship ImageProduct/Service Attributes
Increase assetutilization
Enhance customer value
Expand revenueopportunities
Strategic JobFamilies
Strategic ITPortfolio
CreatingAlignment and Readiness
OrganizationChange Agenda
Copy
right
© 2
004
Harv
ard
Busin
ess S
choo
l Pub
lishi
ng C
orpo
ratio
n. A
ll rig
hts r
eser
ved.
Quelle: Kaplan, R. S. & Norton, D. P. (2004). Measuring the Strategic Readiness of Intangible Assets. Harvard Business Review, February.
Strategy MappingBeispielhafte Bestandteile einer Strategy Map
KIRENZ STRATEGY & MARKETING CONSULTING
Measuring the Strategic Readiness of Intangible Assets
harvard business review • february 2004 page 31
and empowering individual initiative in anunaligned organization leads to chaos, as theinnovative risk takers pull the organization incontradictory directions.
Achieving alignment is a two-step process.First, managers communicate the high-levelstrategic objectives in ways that all employeescan understand. This involves using a widerange of communication mechanisms: bro-chures, newsletters, town meetings, orienta-tion and training programs, executive talks,company intranets, and bulletin boards. Thegoal of this step is to create intrinsic motiva-tion, to inspire employees to internalize the or-ganization’s values and objectives so that theywant to help the organization succeed. Thenext step uses extrinsic motivation. The orga-nization has employees set explicit personaland team objectives aligned to the strategy
and establishes incentives that reward employ-ees when they meet personal, departmental,business unit, and corporate targets.
Measuring alignment readiness is relativelystraightforward. Many survey instruments arealready available for assessing how much em-ployees know about and how well they under-stand high-level strategic objectives. It is alsofairly easy to see whether or not individuals’personal objectives and the company’s existingincentive schemes are consistent with thehigh-level strategy.
For example, a large property and casualtyinsurance company adopted a new strategy in-tended to reduce its underwriting losses by cre-ating a tighter link between the underwriters,who decide whether to accept a new piece ofbusiness, and the claims agents, who deal withthe consequences from poor underwriting de-
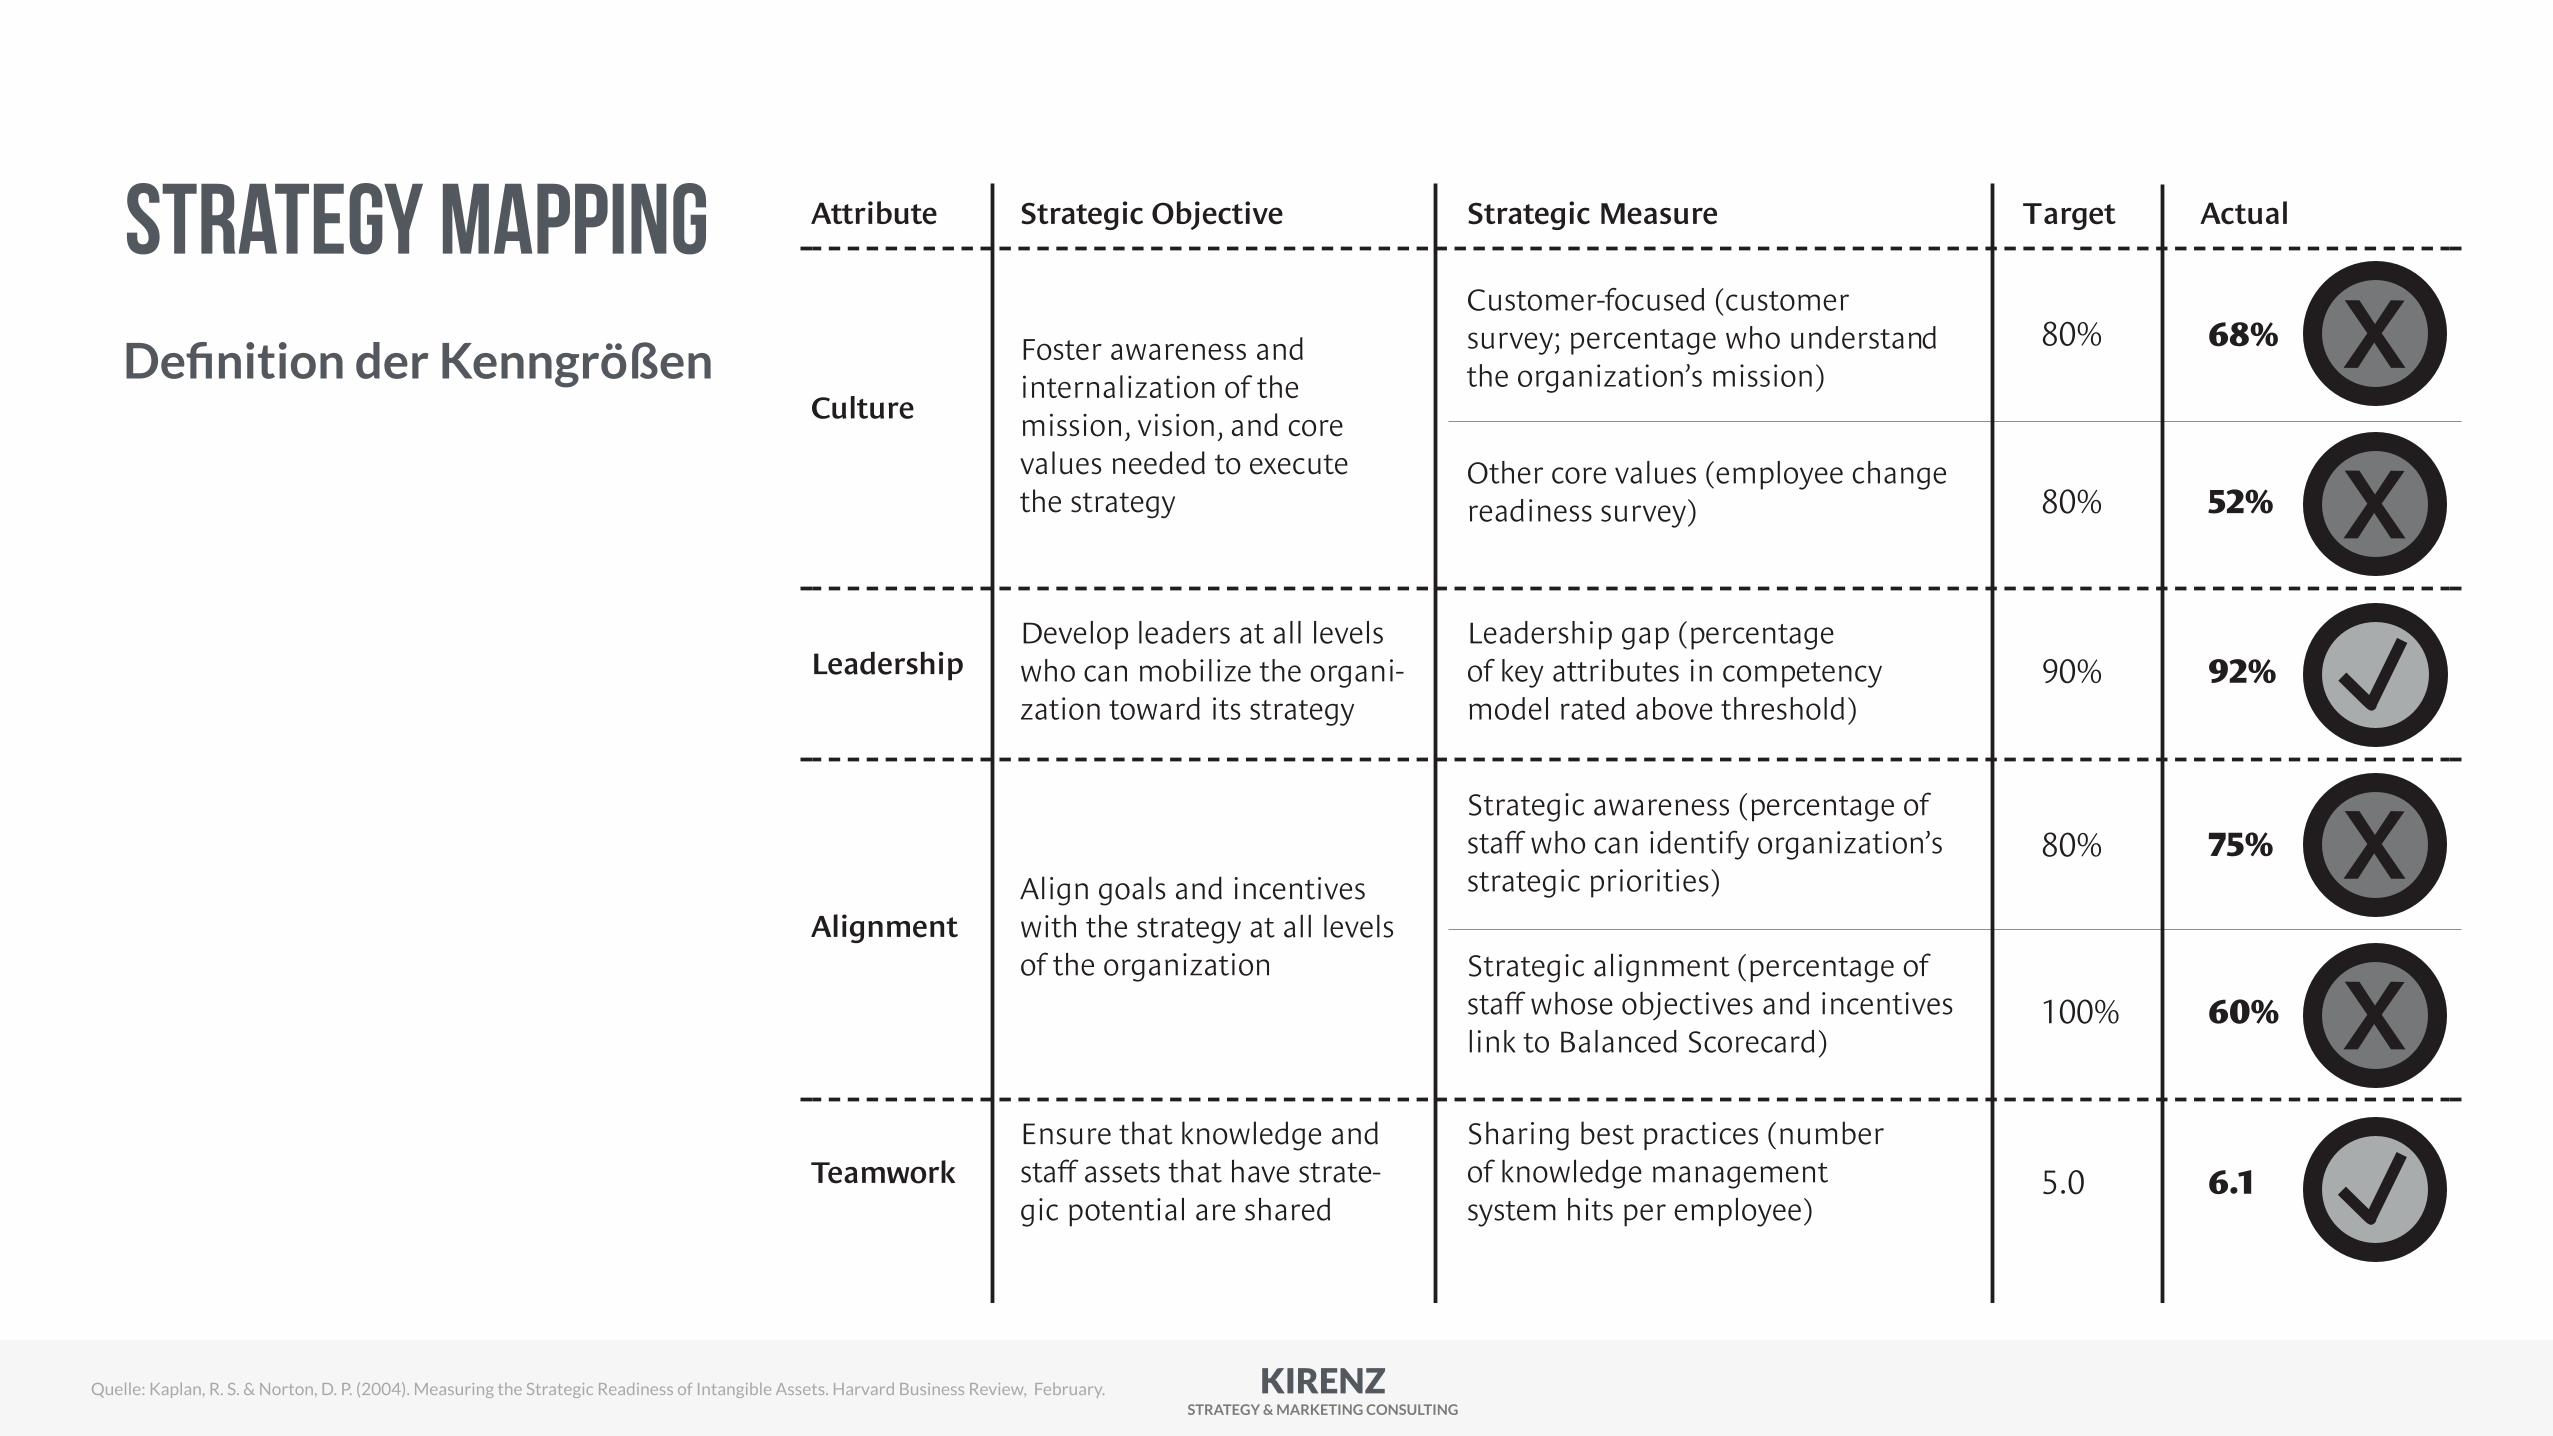
The various measures for organization capital readiness should be put together in a readiness
report, which shows, for all the components of organization capital, where the company needs to
introduce changes to its behaviors and policies. The report shown here is a simplified version of
one prepared by a company in our Balanced Scorecard database.
Teamwork
Develop leaders at all levelswho can mobilize the organi-zation toward its strategy
Alignment
Attribute
Leadership
Culture
x
Strategic Objective Strategic Measure Target Actual
Foster awareness and internalization of the mission, vision, and corevalues needed to executethe strategy
Align goals and incentiveswith the strategy at all levelsof the organization
Ensure that knowledge andstaff assets that have strate-gic potential are shared
Leadership gap (percentage of key attributes in competencymodel rated above threshold)
Customer-focused (customer survey; percentage who understandthe organization’s mission)
Strategic awareness (percentage ofstaff who can identify organization’sstrategic priorities)
Sharing best practices (numberof knowledge management system hits per employee)
80%
80%
68%
52%
90% 92%
80% 75%
100% 60%
5.0 6.1
Other core values (employee changereadiness survey)
Strategic alignment (percentage ofstaff whose objectives and incentiveslink to Balanced Scorecard)
Organization Capital Readiness Report
x
xx
Copy
right
© 2
004
Harv
ard
Busin
ess S
choo
l Pub
lishi
ng C
orpo
ratio
n. A
ll rig
hts
rese
rved
.
Strategy MappingDefinition der Kenngrößen
Quelle: Kaplan, R. S. & Norton, D. P. (2004). Measuring the Strategic Readiness of Intangible Assets. Harvard Business Review, February.
KIRENZ STRATEGY & MARKETING CONSULTING
Having Trouble with Your Strategy? Then Map It • TOOL KIT
harvard business review • september–october 2000 page 58
larger profit share of its sales of gasoline todealers.
For its customer intimacy strategy, Mobilhad to excel at understanding its consumersegments. And because Mobil doesn’t sell di-rectly to consumers, the company also had toconcentrate on building best-in-class franchiseteams.
Interestingly, Mobil placed a heavy empha-sis on objectives to improve its basic refiningand distribution operations, such as loweringoperating costs, reducing the downtime ofequipment, and improving product qualityand the number of on-time deliveries.
When a company such as Mobil adopts acustomer intimacy strategy, it usually focuseson its customer management processes. ButMobil’s differentiation occurred at the dealerlocations, not at its own facilities, which basi-cally produced commodity products (gasoline,heating oil, and jet fuel). So Mobil could notcharge its dealers higher prices to make up for
any higher costs incurred in its basic manufac-turing and distribution operations. Conse-quently, the company had to focus heavily onachieving operational excellence throughoutits value chain of operations.
Finally, as part of both its operational-excel-lence and corporate-citizen themes, Mobilwanted to eliminate environmental and safetyaccidents. Executives believed that if therewere injuries and other problems at work,then employees were probably not paying suf-ficient attention to their jobs.
Learning and Growth Perspective. Thefoundation of any strategy map is the learningand growth perspective, which defines thecore competencies and skills, the technolo-gies, and the corporate culture needed to sup-port an organization’s strategy. These objec-tives enable a company to align its humanresources and information technology with itsstrategy. Specifically, the organization mustdetermine how it will satisfy the requirements
Quelle: Kaplan, R. S. & Norton, D. P. (2000). Having Trouble with Your Strategy? Then Map It . Harvard Business Review, September-October.
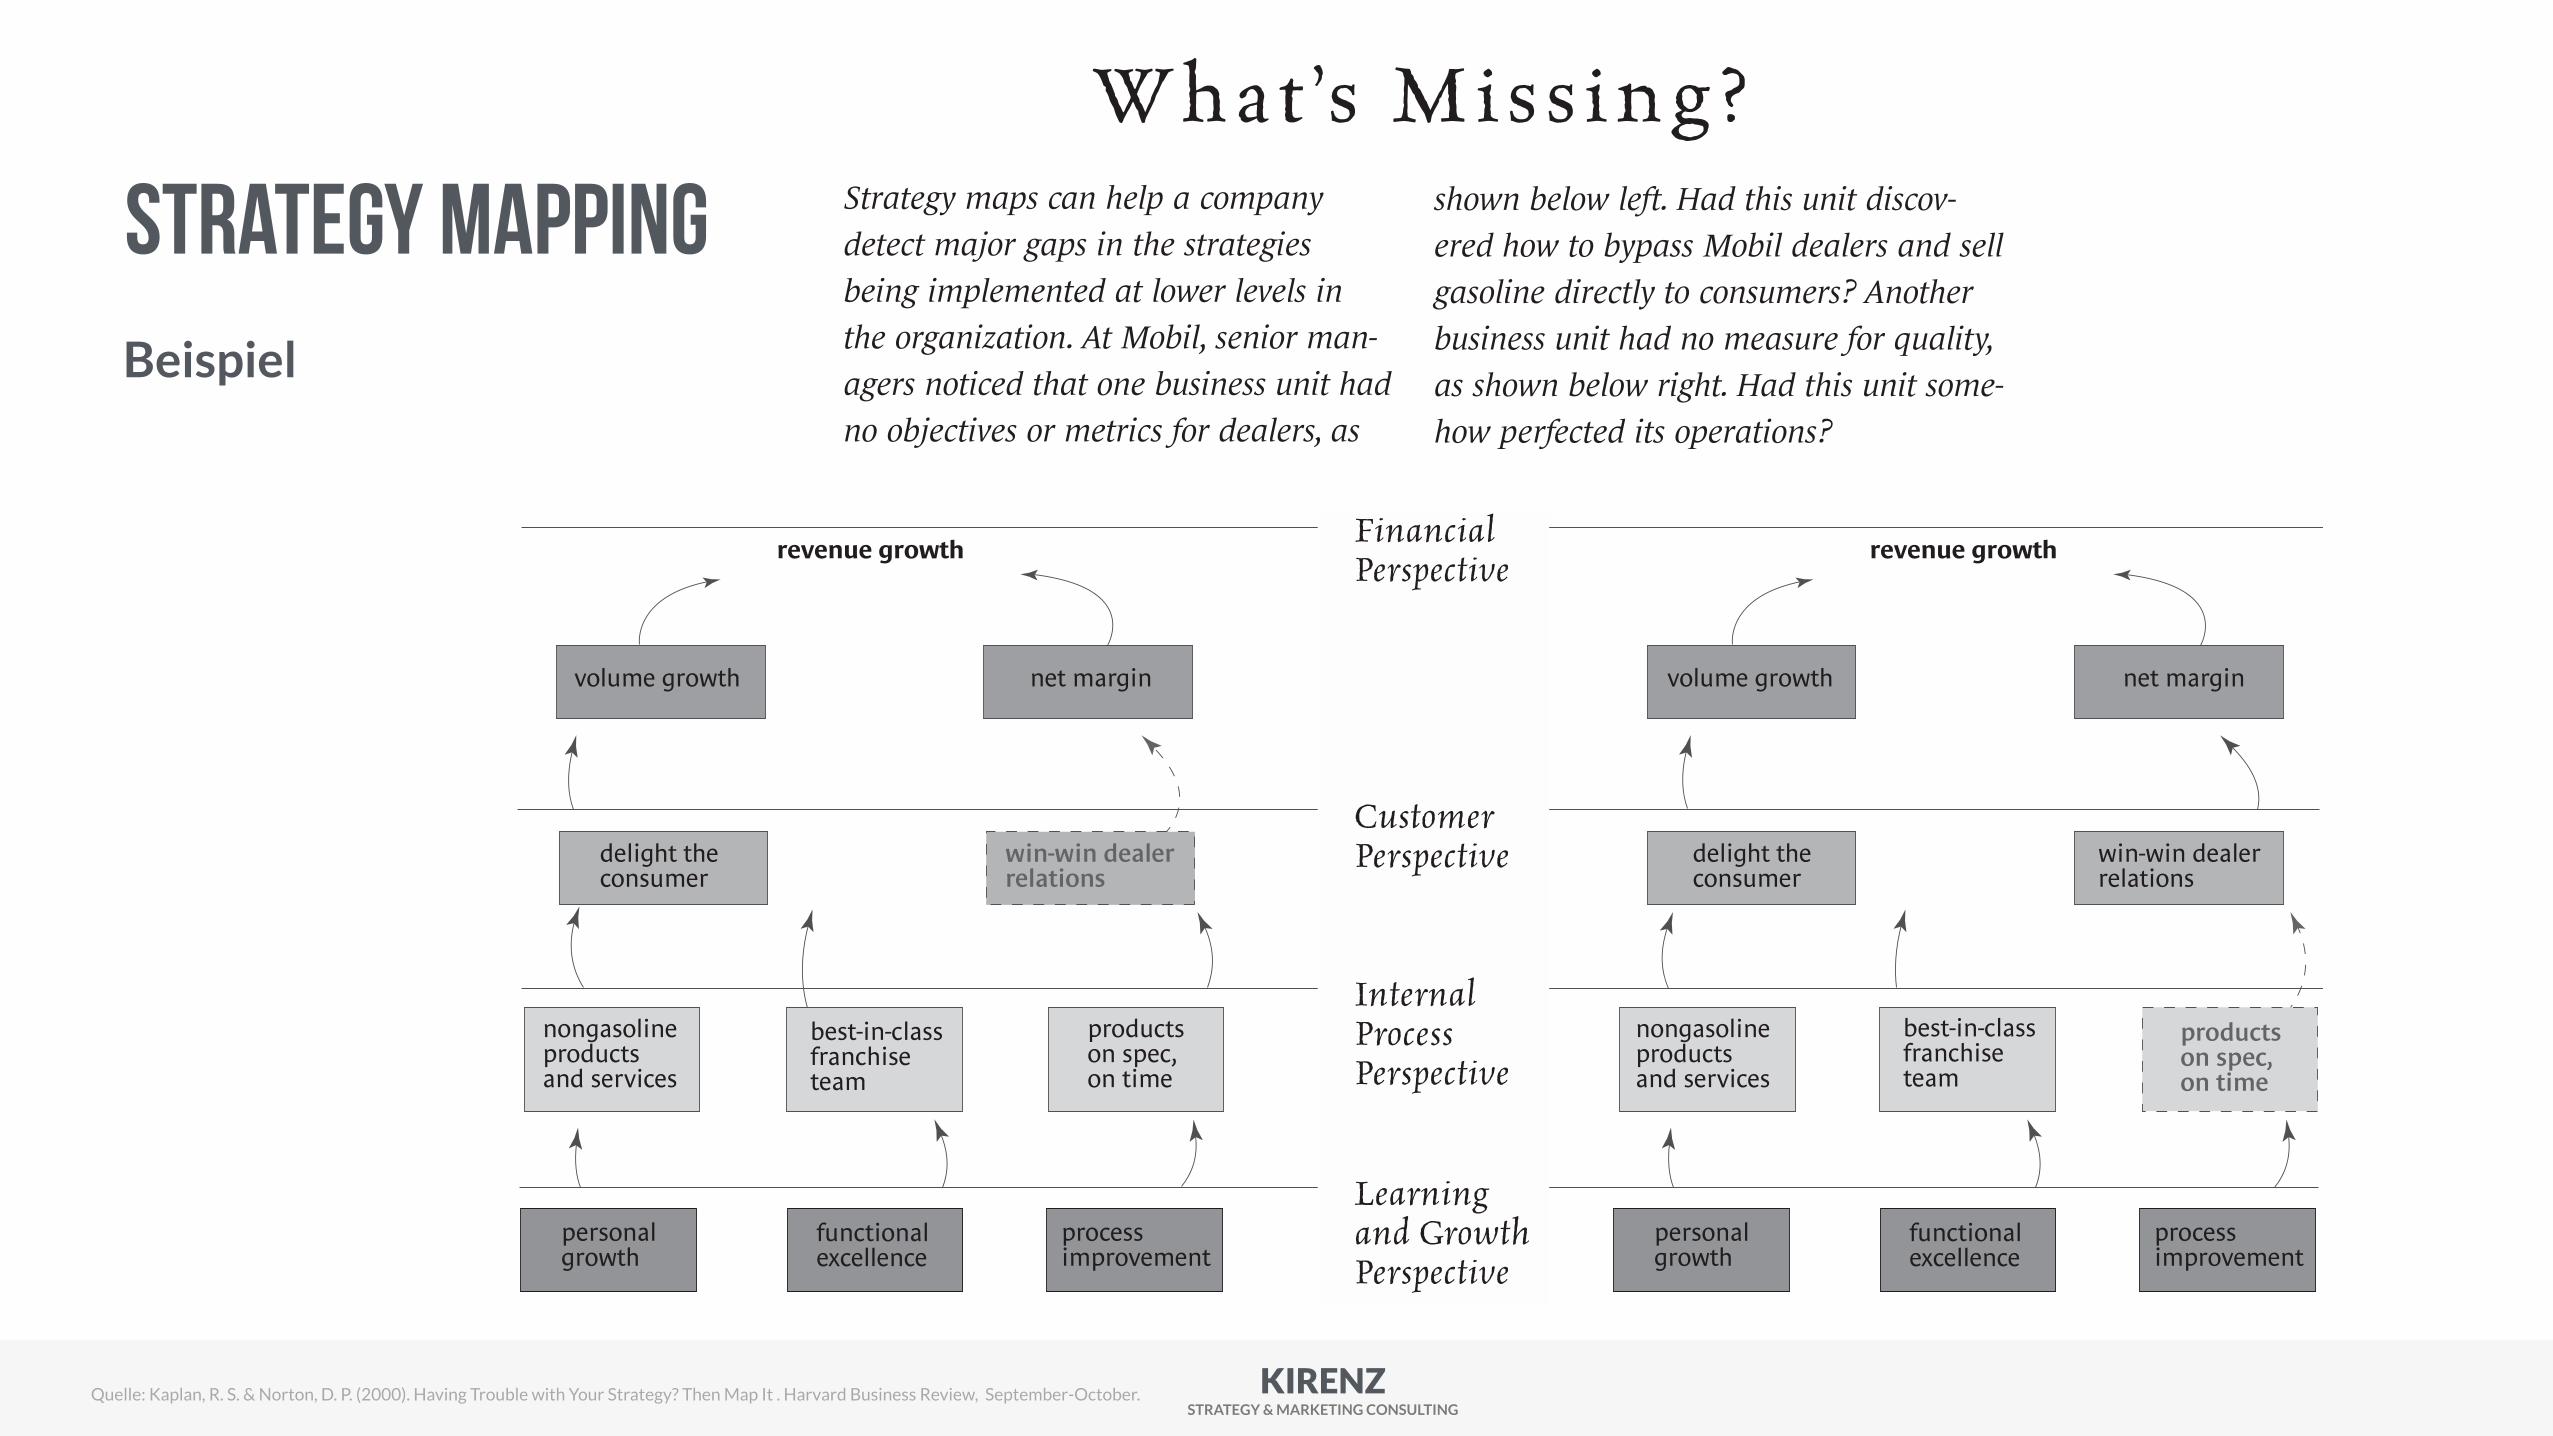
Strategy MappingBeispiel
KIRENZ STRATEGY & MARKETING CONSULTING
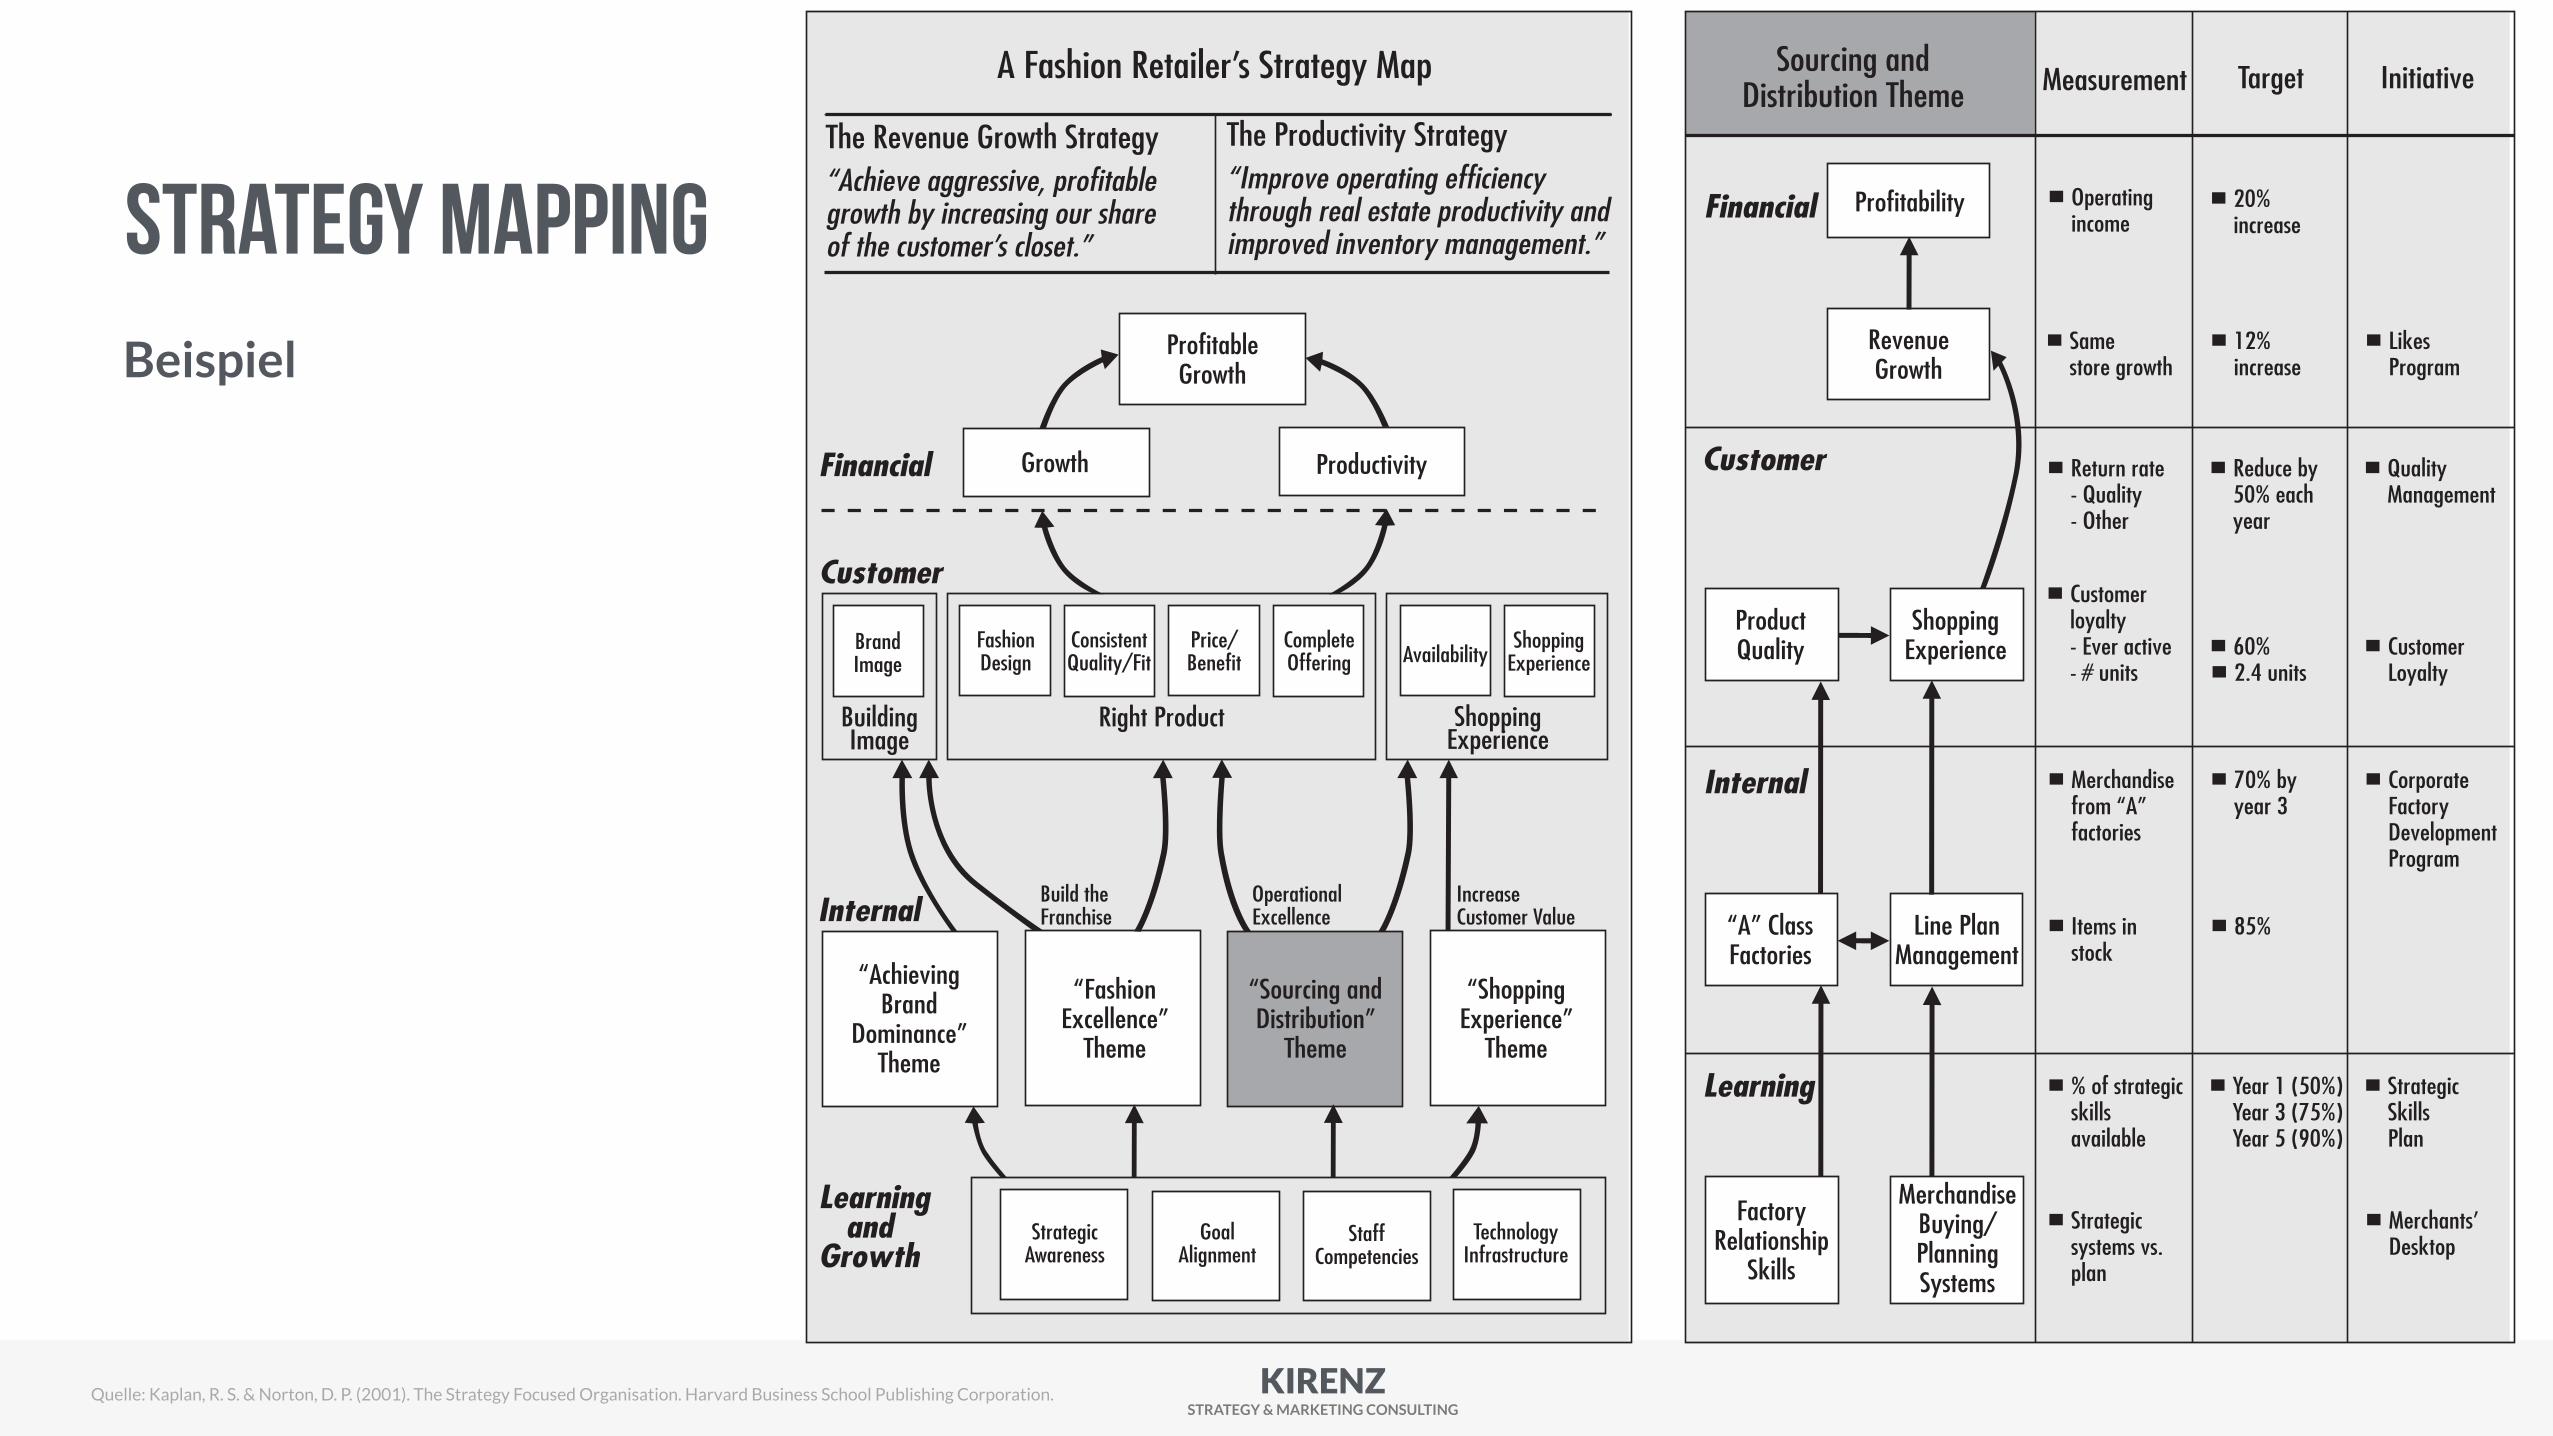
ties for various business processes, creating cus-tomer and shareholder satisfaction.
4. Learning and growth — the priorities to create aclimate that supports organizational change, inno-vation and growth.
The arrows in the strategy map show the cause-and-effect relationships between elements in each perspec-tive, clearly displaying how such intangible assets asstrategic awareness feed into themes that eventuallyyield tangible results.
Within each of the strategic themes, a second strategymap and Balanced Scorecard [on the right] breaks downinto detail how the theme affects the customer objec-tives that result from the theme. In this example, we seehow sourcing and distribution affect customer objec-tives of product quality and product availability that, in
turn, drive customer retention and revenue growth, aswell as the internal processes (factory management andline programming) that contribute to those objectives.
In Balanced Scorecards, value-creating processes andcritical roles for intangible assets are clearly portrayed,in the correct context of how those intangibles createvalue, providing the measurement and managementframework for knowledge-based strategies. ■
Principle 2: Align theOrganization to the Strategy
The Balanced Scorecard provides a powerful frame-work for business units to describe and implement theirstrategies. A Strategy-Focused Organization, however,requires more than just having each business unit use itsown Balanced Scorecard to manage a great strategy; thestrategies and scorecards for all such units should bealigned and linked with one another. Synergies can then
3
The Strategy-Focused Organization — SUMMARY
Soundview Executive Book Summaries®
Principle 1: Translate Strategy intoOperational Terms(continued from page 2)
(continued on page 4)
A Fashion Retailer’s Strategy Map
The Revenue Growth Strategy“Achieve aggressive, profitablegrowth by increasing our shareof the customer’s closet.”
Financial
The Productivity Strategy“Improve operating efficiencythrough real estate productivity andimproved inventory management.”
Customer
Internal
Learning andGrowth
ShoppingExperience
Right ProductBuildingImage
ProfitableGrowth
Growth Productivity
ShoppingExperienceAvailability
CompleteOffering
Price/Benefit
ConsistentQuality/Fit
FashionDesign
BrandImage
StrategicAwareness
GoalAlignment
StaffCompetencies
TechnologyInfrastructure
“Sourcing andDistribution”
Theme
“ShoppingExperience”
Theme
“FashionExcellence”
Theme
“AchievingBrand
Dominance”Theme
Build theFranchise
OperationalExcellence
IncreaseCustomer Value
➞➞
Financial
Customer
Internal
Learning
Profitability
RevenueGrowth
■ Operating income
Sourcing andDistribution Theme Measurement Target Initiative
■ 20% increase
■ Same store growth
■ 12% increase
■ Likes Program
ProductQuality
ShoppingExperience
“A” ClassFactories
Line PlanManagement
FactoryRelationship
Skills
MerchandiseBuying/PlanningSystems
■ Return rate - Quality - Other
■ Customer loyalty - Ever active - # units
■ Reduce by 50% each year
■ Quality Management
■ 60%■ 2.4 units
■ Customer Loyalty
■ Merchandise from “A” factories
■ Items in stock
■ 70% by year 3
■ 85%
■ Corporate Factory Development Program
■ % of strategic skills available
■ Strategic systems vs. plan
■ Year 1 (50%) Year 3 (75%) Year 5 (90%)
■ Strategic Skills Plan
■ Merchants’ Desktop
Quelle: Kaplan, R. S. & Norton, D. P. (2001). The Strategy Focused Organisation. Harvard Business School Publishing Corporation.
Strategy MappingBeispiel
KIRENZ STRATEGY & MARKETING CONSULTING
Mehr Insights auf kirenz.de Kontakt: [email protected]
KIRENZ STRATEGY & MARKETING CONSULTING Prof. Dr. Jan Kirenz Wesendonkstr. 44 81925 München
KIRENZ STRATEGY & MARKETING CONSULTING
Insig
hts
KIRENZ CONSULTING Kundengewinnung & Kundenbindung im digitalen Zeitalter
Wir unterstützen Unternehmen und Organisationen bei der Gewinnung und Bindung von Kunden im digitalen Zeitalter:
Wir liefern innovative Kunden- und Wettbewerbserkenntnisse, entwickeln nachhaltige Strategien, unterstützen beim Markenmanagement und konzipieren wirksame Markenkommunikationsstrategien.