Embed Size (px)
Citation preview

Developing innovation & technology acceleration in Poland
Ryszard Białecki, Silesian University of Technology
Gliwice, Poland

Poland in the last 25 yearseconomy
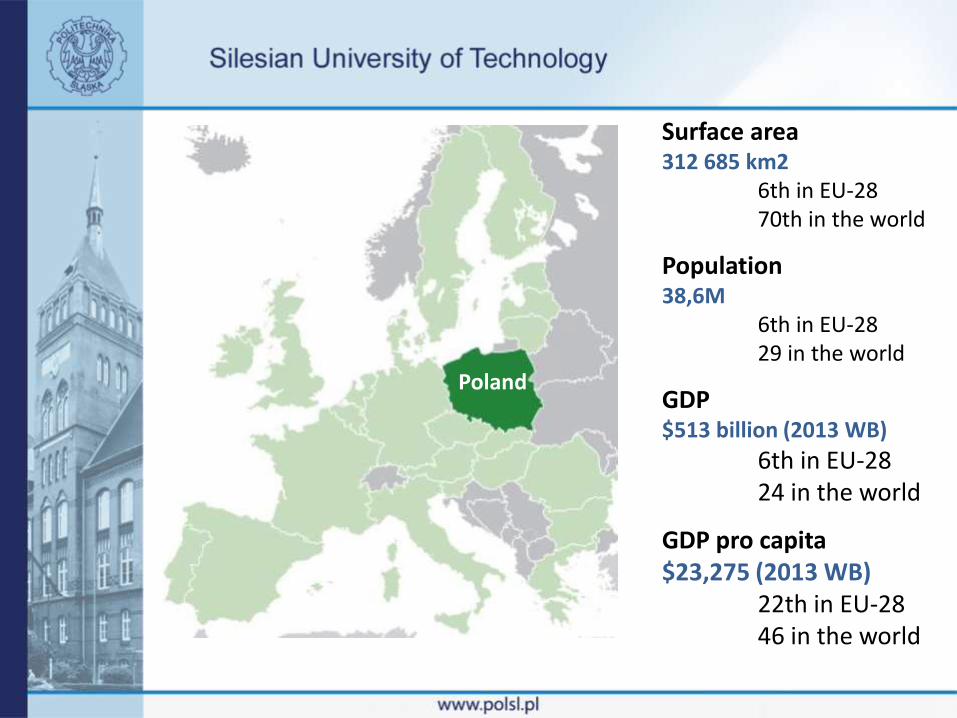
Poland
Surface area 312 685 km2
6th in EU-2870th in the world
Population38,6M
6th in EU-2829 in the world
GDP$513 billion (2013 WB)
6th in EU-2824 in the world
GDP pro capita$23,275 (2013 WB)
22th in EU-2846 in the world

1.8 1.6 2.1 2.3 2.3 2.73.6 4.1 4.1 4.5 4.3 4.5 5 5.2 5.7
6.68
9
11.2
13.9
11.312.3
13.412.7
13.4
19
89
19
90
19
91
19
92
19
93
19
94
19
95
19
96
19
97
19
98
19
99
20
00
20
01
20
02
20
03
20
04
20
05
20
06
20
07
20
08
20
09
20
10
20
11
20
12
20
13
GDP pro capita after 1989 in k€
increased by 760% in 22 years , average 31% a year
Source: GUS

inflation rate
1990 1995 2000 2005 2010 2013
585.80%
27.80% 10.10% 2.10% 2.60% 0.90%
Source: GUS

Ease of doing business, rank out of 189
Strong correlation between entrepreneurship and innovation
Source The World Bank
Barriers to entrepreneurship - reduced v 50% within last 10 years
PL CZ SK HU DK FIN S
45
75
49 54
5 12 14

social cost, unemployment
Poland
Source: Eurostat

social cost, people at risk of poverty or social exclusion
Source: Eurostat
Poland

Economic crisis in Europe did not dampen the ongoing convergence.
Poland has weathered the crisis better than any other country in Europe. It remains the only EU economy that avoided a recession in 2008-2010
Poland’s income levels are rapidly converging with the EU-15 income levels, reaching historically unprecedented highs.
Source: POLAND ENTERPRISE INNOVATION SUPPORT REVIEW: FROM CATCHING UP TO MOVING AHEAD. The World Bank

rapid, radical and effective reform in the economy
111 days shock therapyimplemented rapidly and decisively lower social costs
Sources of success
massive burst of entrepreneurship
economic barriers lifted1989-91 number of SMEs grew from 572k to 1.5M general spirit of enterprise – driving force

Poland in the last 25 yearshuman capital

Secondary education PISA tests, rank of Polish studentssignificant progress
Source Program for International Student Assessment, OECD
2325
99
1310
Science Math reading and writing
2006
2012

12.9
22.3
40.7
48.9
53.8
51.8
1990
1995
2000
2005
2010
2012
Human capital; gross enrolment ratio
Source: A. Matras-Bolibok, P. Bolibok: Evolution of Human Capital in Transition Economy, The case of Poland

Institutions of higher educationuniversities and equivalent
1990 120 public2010 453 total, 321 private IHE
2324 2300
4400
59175367
4938
1990 1950 2000 2005 2010 2011
doctor degrees conferred
Source: GUS
dynamics much lower than students

Human resources % of population aged 25-64
Source Jan Gmurczyk, Innovation of Polish economy, Present state and recommendation InstytutObywatelski 2014, in Polish
PL UE-28 Region Nordic
89.6
76.5
88.881.7
4.510
5.6
27.6
having completedtertiary education
participating in LLE

SOCIAL SCIENCES, ECONOMY, LAW37.6%
SERVICES8.5%
AGRICULTURE1,7%
SCIENCE8,3%
HUMANITIES AND ART.9,0%
HEALTH AND SOCIAL WELFARE7,6%
Human capital; fields of studies 2013
SOCIAL SCIENCES, ECONOMY, LAW37.6%
SERVICES8.5%
AGRICULTURE1,7%
SCIENCE8,3%
HUMANITIES AND ART.9,0%
HEALTH AND SOCIAL WELFARE7,6%
EDUCATION 11,2%
TECHNOLOGY16,0%
16.0%
8,3%
37,6%
8,5%
9,0%
7,6%
11,2%
Source: Higher Education in Poland 2013. Ministry of Science and Higher Education

Human capitalemployment in R&D sector
employment dropped

Innovation level of Polish economy

EU-28 Innovation Ranking
POLAND
Source: Innovation Union Scoreboard 2014

Poland innovation performance • slightly improved (0.9%) between 2006 and 2013 • relative performance to the EU declined from 54% in
2007 to about 50% in 2013.
Relative weaknesses • Non-EU doctorate students, • PCT patent applications • License and patent revenues from abroad.
Relative strengths • Non-R&D innovation expenditures • Youth with upper secondary level education.

High growth • Community designs, • Community trademarks • R&D expenditures in the business sector.
Strong declines • Innovative SMEs collaborating with others,• New doctorate graduates, • SMEs innovating in-house • Sales share of new innovations.
Source: Innovation Union Scoreboard 2014

1615.3
12
10.510.310.29.5
8.1 8.1 7.8 7.8 7.57.1 6.8
6.25.8
5.4 5.3 5.2 5.2 4.9 4.8 4.64.1
3.6 3.5 3.4 3.1 2.82.4 2.2 1.9
IC FI DK
LU NO FR SE PT
AU
UK BE
GE SL IR ES SP CZ
SW NE LT SK HU
GR IT HR PL
BG LV MA TR CR
RO
Researchers (FTE) per thousand labor force,
Source: DG Research and Innovation Monitor human resources policies and practices in research(LOT 1 Part 1) The Researchers Report 2012 Scorecards

0 1 2 3 4
FIN
SE
DK
CZ
HU
SK
PL
UE-28
business
gov. high. ed., non-profit
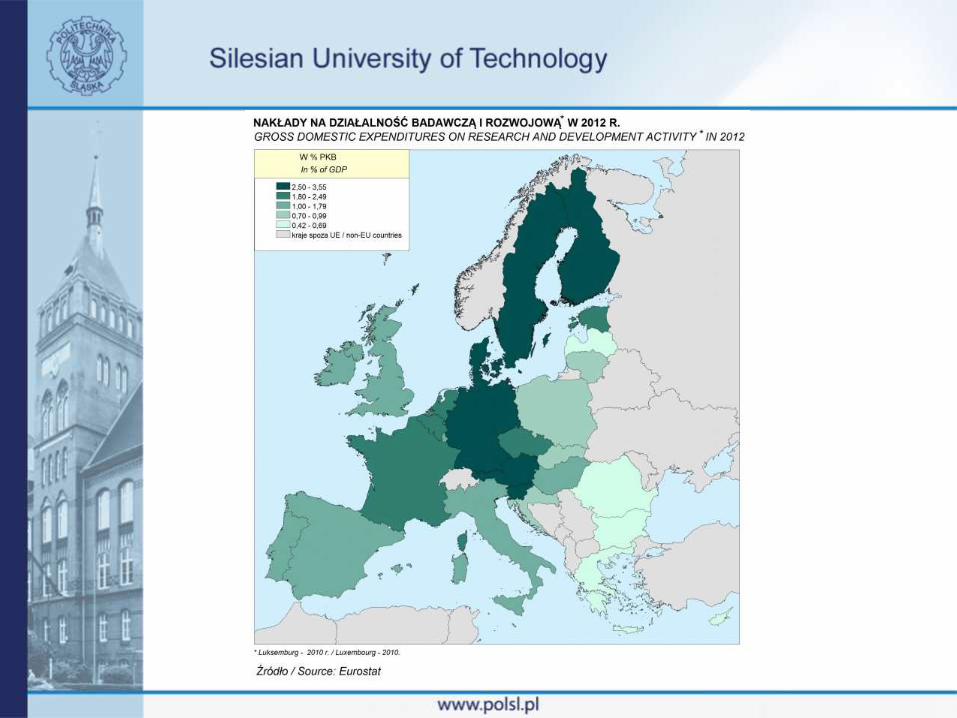
R&D expenditure % GDP
Total R&D expenditure in Poland increased from 0.6%GDP (2008) to 0.9%GDP (2012), mainly due to government involvement
Source Jan Gmurczyk, Innovation of Polish economy, Present state and recommendation InstytutObywatelski 2014, in Polish

Structural funds for innovation support , €10 billion 2007-2013
• research infrastructure significantly enhanced
• did not trigger a significant breakthrough in innovation level
• venture capital and public R&D infrastructure mainly from public funds. Limited impact on private R&D investment
• R&D-intensive foreign direct investment only 4.5% of total business R&D spending (HU 13%, SK 21%)

Non-R&D innovation
expenditures
Venture capital investments
PL 182 55
CZ 122 11
SK 115 lack of data
HU 71 32
DK 91 111
FIN 90 116
SE 113 166
Innovation investments by enterprises segment (EU-27=100)
Source Jan Gmurczyk, Innovation of Polish economy, Present state and recommendation Instytut Obywatelski 2014, in Polish

other measures of innovation
PL EU-28 NORDIC REGION
patent applications to the European Patent office per million inhabitants 9.9 79.1 236.1 13.3
% of high tech export in total export 5.9% 11.60% 9.90% 13.9%
% of innovative enterprises employing at least 10 persons 27% 47% 58% 39%
Source Jan Gmurczyk, Innovation of Polish economy, Present state and recommendation InstytutObywatelski 2014, in Polish

0
20
40
60
80
100
120
140
160
PL Cz SK HU DK FIN SE
other measures of innovation% of innovative SMEs collaborating with others
EU-27=100
Source: Jan Gmurczyk, Innovation of Polish economy, Present state and recommendation Instytut Obywatelski 2014, in Polish, after Innovation Union Scoreboard 2013

3,167
1138 1138
146585
657
270 221
9
25
Public HEItotal
univerisities universitiesof technolgy
universitiesof economy
Private HEI
income fromresearch
income fromteaching
structure of income in HE

Diagnosis• competitive advantage of Polish companies resulted from
cheap labor force, not capital intensive investments in development of new technology
• institutional infrastructure supporting innovation system Fragmentation Unevenly distributed strategy and implementation (5
agencies and ministries) managing 22 innovation support programs.
Regions own innovation support initiatives.
• risk-averse selection for public funding favoring large and mature firms and medium-low technology industries
• lack of venture capital
• limited number of SMEs involved in new technologies

• international corporations seldom locate R&D centers in new EU countries
• low population of research staff
• brain drainage (salaries)
• HE atomized, teaching - main source of income
• Innovation funding – technology absorption rather than breakthrough innovation
• research staff reluctant to be involved in commercial activities

Measures taken to enhance innovationStrategy for innovation and efficiency of the economy, 2013 Ministry of Economy.
Objective 1 Adjustment of the regulatory and financial environment to the needs of innovative and efficient economy
Objective 2 Stimulating innovation through increase in knowledge and work efficiency
Objective 3 More efficient use of natural resources and raw materials
Objective 4 Enhanced internationalization of Polish economy
Budget allocation

Council of Ministers (April 8, 2014) adapted the Enterprise Development Program, which is an integral part of theNational Smart Specialization Project
HEALTHY SOCIETY1. medical engineering technologies, including biotechnologies, medical2. Diagnosis and treatment of lifestyle diseases and personalized medicine3. Production of medicinal productsAGRI-FOOD bio-economy, the forest-TREE AND ENVIRONMENTAL4. Innovative technologies, processes and products of the agri-food and forestry-wood5. Healthy food (high quality and performance of production)6.Biotechnologiczne processes and specialty chemicals and environmental engineeringSUSTAINABLE ENERGY
7. High efficiency, low-emission and integrated systems of production, storage, transmission and distribution of8. Smart and energy efficient building9. Environmentally friendly transport solutions

NATURAL RESOURCES AND WASTE MANAGEMENT10. Modern technology sourcing, processing and use of natural resources and the production of substitutes11. Minimize the generation of waste, including unfit for processing and use of materials and energy waste (recycling and other recovery methods)12. Innovative technologies of water treatment and recovery and reducing its consumptionINNOVATIVE TECHNOLOGIES AND INDUSTRIAL PROCESSES (ACCORDING HORIZONTAL)13. The multifunctional materials and composites with advanced features, including nanoprocesses and nanoproducts14. sensors (including biosensors) and intelligent sensor networks15. Smart grids and geo-information technologies16. Electronics based on conductive polymers17. Automation and Robotics processes18. Optoelectronic systems and materials

• 2007 - establishment of National Center for Research and Development budget €1.1 billion↑ , applied research
• 2009 – establishment of National Science Center Budget €202M, fundamental research
• NCRD – financial schemes where contribution from business reaches 50% and the coordination is with the industrial partner
• amendment to the bill on Higher Education - Intellectual Properties Rights with individual researchers

• creation of a network of technology parks
• 2009 – establishment of National Science Center Budget €202M, fundamental research
• NCRD – financial schemes where contribution from business reaches 50% and the coordination is with the industrial partner

National Center for Research and Development
commissioned 2007, implementing agency of the Minister of Science and Higher Education.
AIMstrengthen cooperation between Polish business and scientists and promote the commercialization of the research results
ALSO intermediary for operational programmes financed by structural funds : • Innovative Economy, • Human Capital • Infrastructure and Environment, ADDITIONALLY grants• European Economic Area• Norwegian Financial Mechanism

National Center for Research and Development
Budget 2013€1.1 billion – direct Ministry contribution € 0.24 billion – entrepreneur own contribution€ 5.2 billion – total served project
59 calls for proposals, 844 contracts
2014 increase by 20%

National Center for Research and Development
2009-14 in billion €
0.11 0.12
0.61
1.10 1.07
1.27
source: NCRD Annual Report

Other 15 projects with the greatest potential funded
GRAF-TECH program. Bundle of graphen projects
Prof. Włodzimierz Strupiński, first in the world industrial method of production of graphene plates, patented in 2010.
Nano Carbon started commercial production and sales in December 2013.
• Ceramic composites with graphene• Epitaxial growth of graphene on metallic surfaces • Graphene magnetic field sensors with industrial applications • Graphene pastes and inks for printing conductive paths• Graphene coating of sprockets and plain bearings •
•
•


Public-private support for commercialization of R&D results with the participation of capital funds.

innovation centers in Poland

technological parks, incubators, technology transfer centers etc.

Gliwice,a successful and innovation friendly city

Gliwice – seat of Silesian University of Technology
Cracow
Warsaw
Gliwice
A1A4
www.polsl.pl
Vienna
Berlin
Kiev
• Population: 190k
• part of 2.5 M conurbation
• Member of World
Technopolis Association
• Successful
transformation into high
tech region- 300k jobs
lost in mining
• SUT enrolment 30k
• numerous R&D institutes
• unemployment 7.8% vs
14.0% country average
Jan. 2014)

Gliwice - life cycle of innovation
Scientific Technological Park Technopark Ltd
Joint venture of City of Gliwice, SUT and Katowice Special Economic Zone
2011 – National Leader on Innovation
2012 – National Best Municipal Corporation
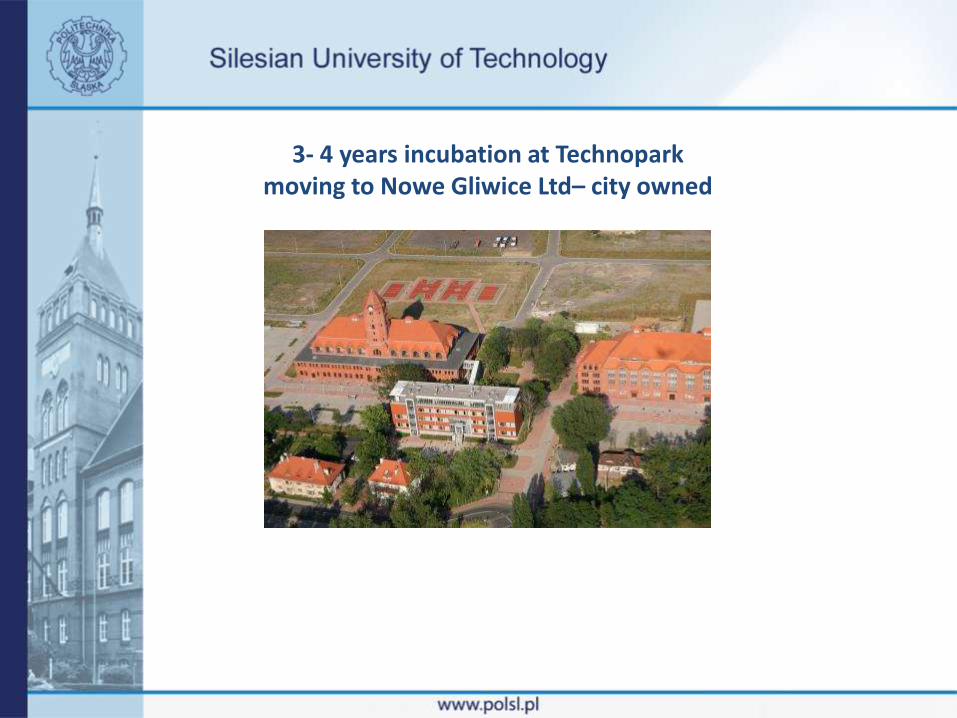
3- 4 years incubation at Technoparkmoving to Nowe Gliwice Ltd– city owned
mobile and console applications Nintendo, 3rd best sold IPAD application in US
Microsoft GOLD Independent Software Vendor

Financial Times – second best Special Economic Zone in Europe and 11th in the world
Special Economic Zone
17.5 jobs 65 enterprises€1.7 billion investments