Embed Size (px)
Citation preview
The Business Model For the Subscription Economy
Tyler Sloat CFO

In The Subscription Economy, Focus Is On Relationships
Product Relationships
BUY NOW SUBSCRIBE
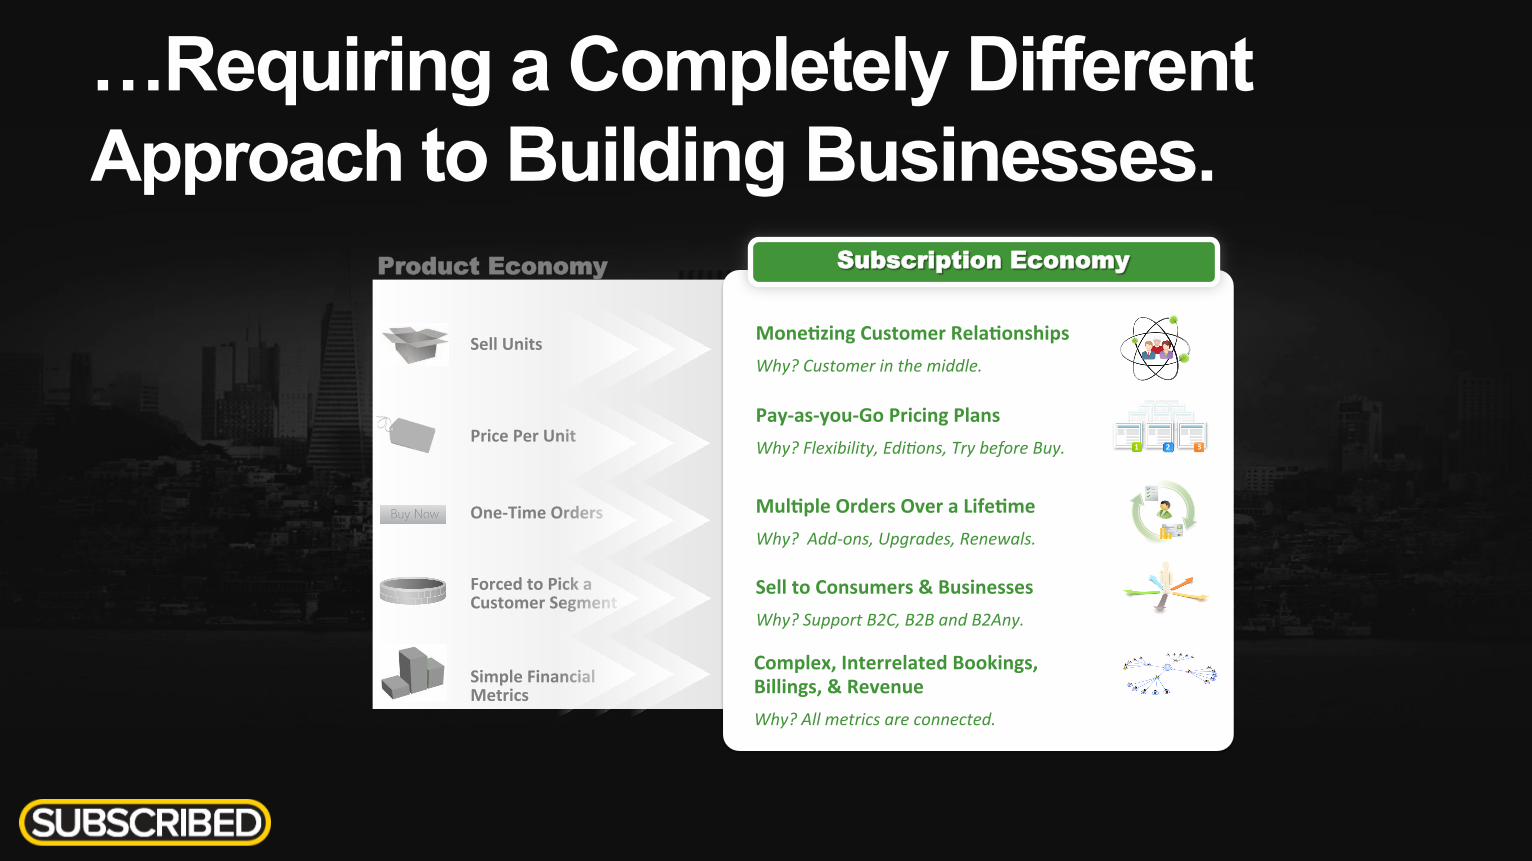
…Requiring a Completely Different Approach to Building Businesses.
Sell Units
Product Economy Subscription Economy
Mone,zing Customer Rela,onships Why? Customer in the middle.
Forced to Pick a Customer Segment
Price Per Unit
One-‐Time Orders
Simple Financial Metrics
Pay-‐as-‐you-‐Go Pricing Plans Why? Flexibility, Edi8ons, Try before Buy.
Mul,ple Orders Over a Life,me Why? Add-‐ons, Upgrades, Renewals.
Sell to Consumers & Businesses Why? Support B2C, B2B and B2Any.
Complex, Interrelated Bookings, Billings, & Revenue Why? All metrics are connected.
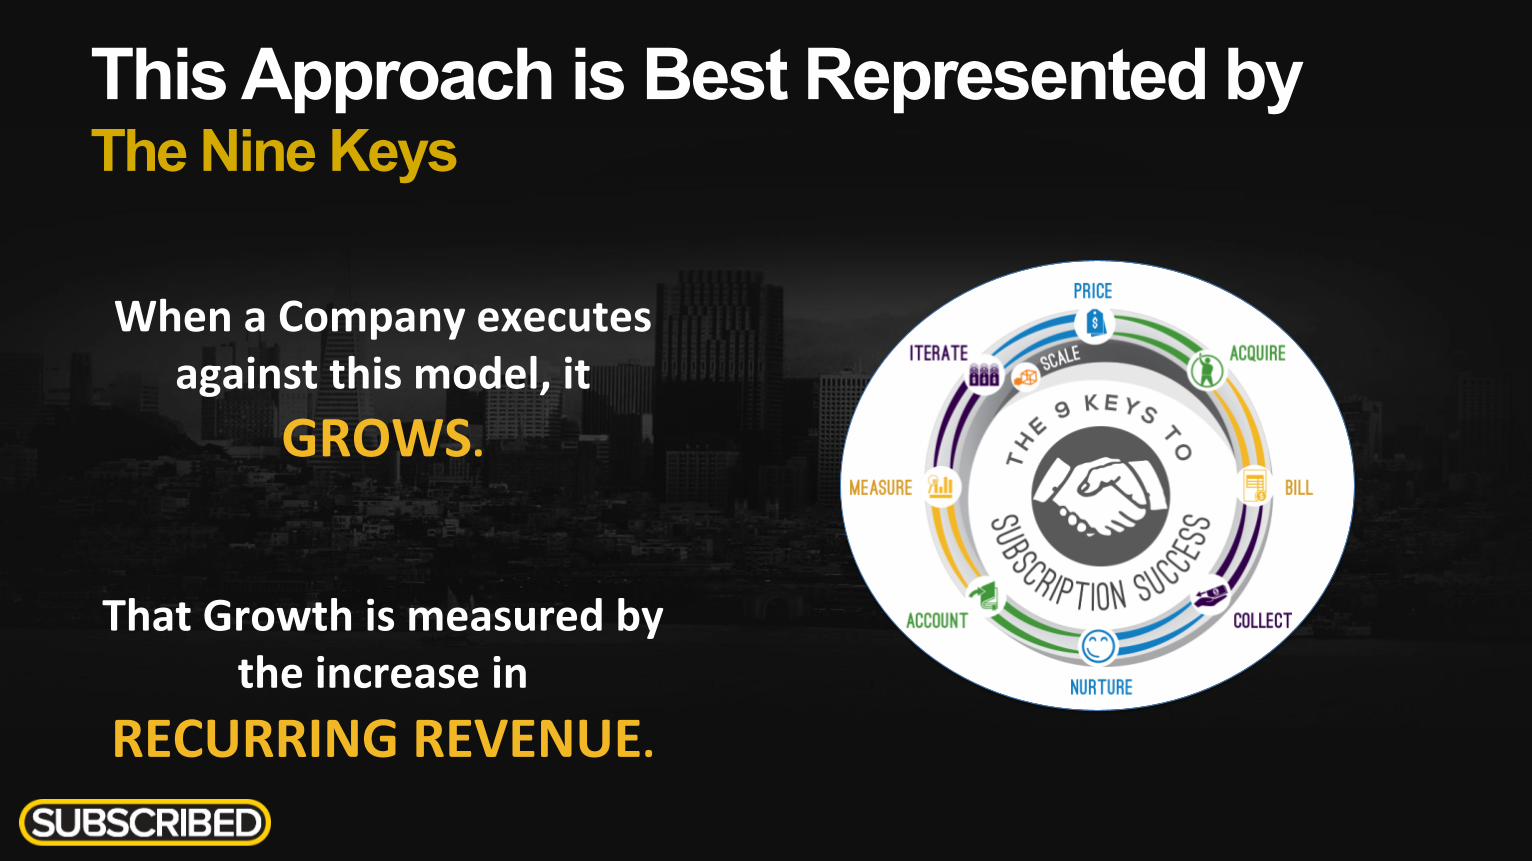
This Approach is Best Represented by The Nine Keys
When a Company executes against this model, it
GROWS.
That Growth is measured by the increase in
RECURRING REVENUE.
But there’s a problem(s).
We are s,ll using legacy financial formats to present our Company’s results and help our Execu,ves plan for
the future.
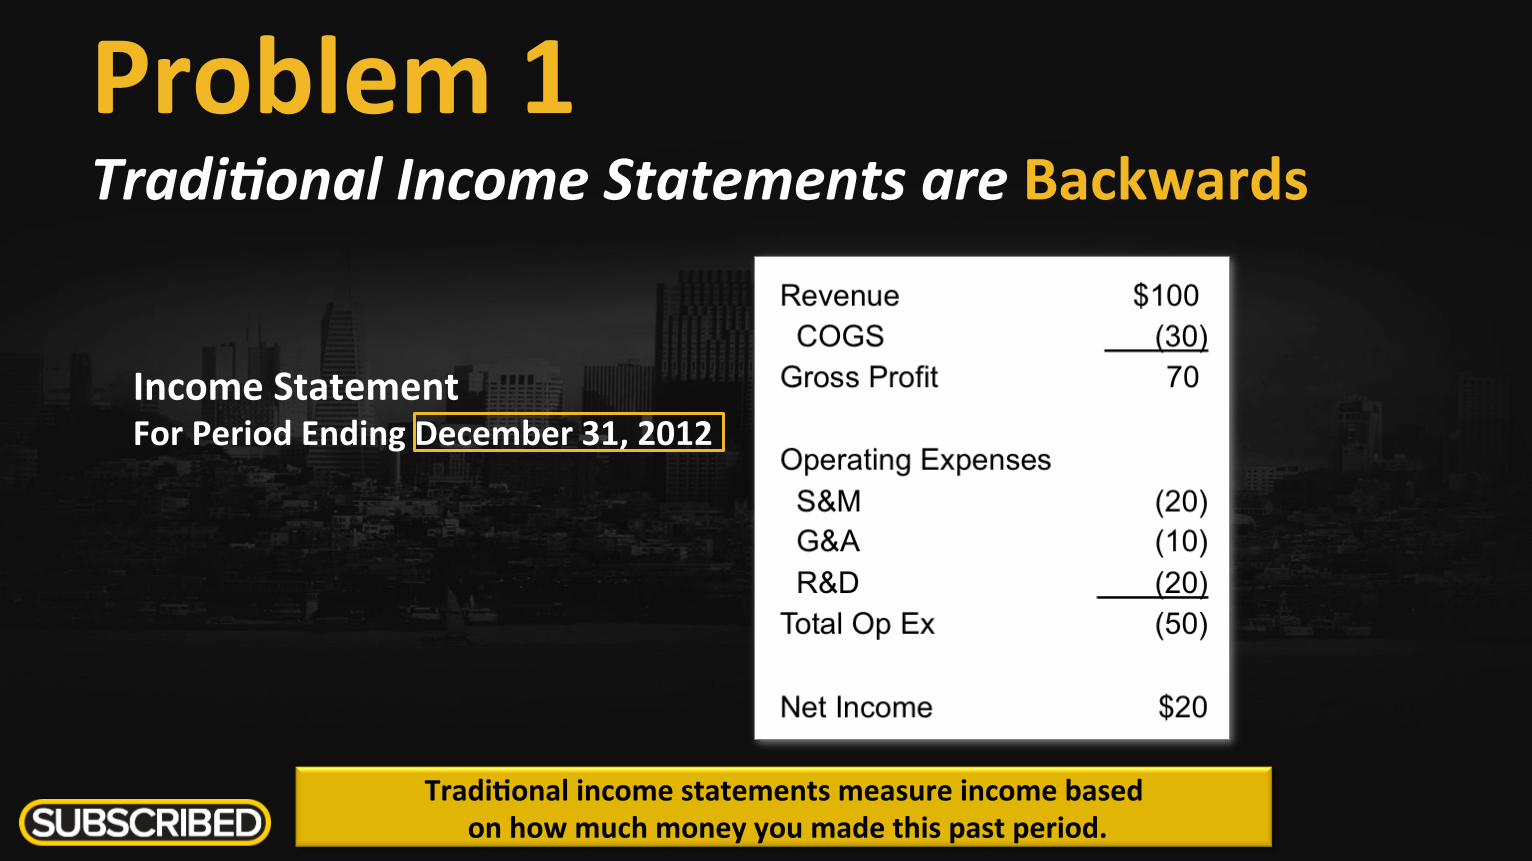
Problem 1 Tradi&onal Income Statements are Backwards
Income Statement For Period Ending December 31, 2012
Tradi,onal income statements measure income based on how much money you made this past period.
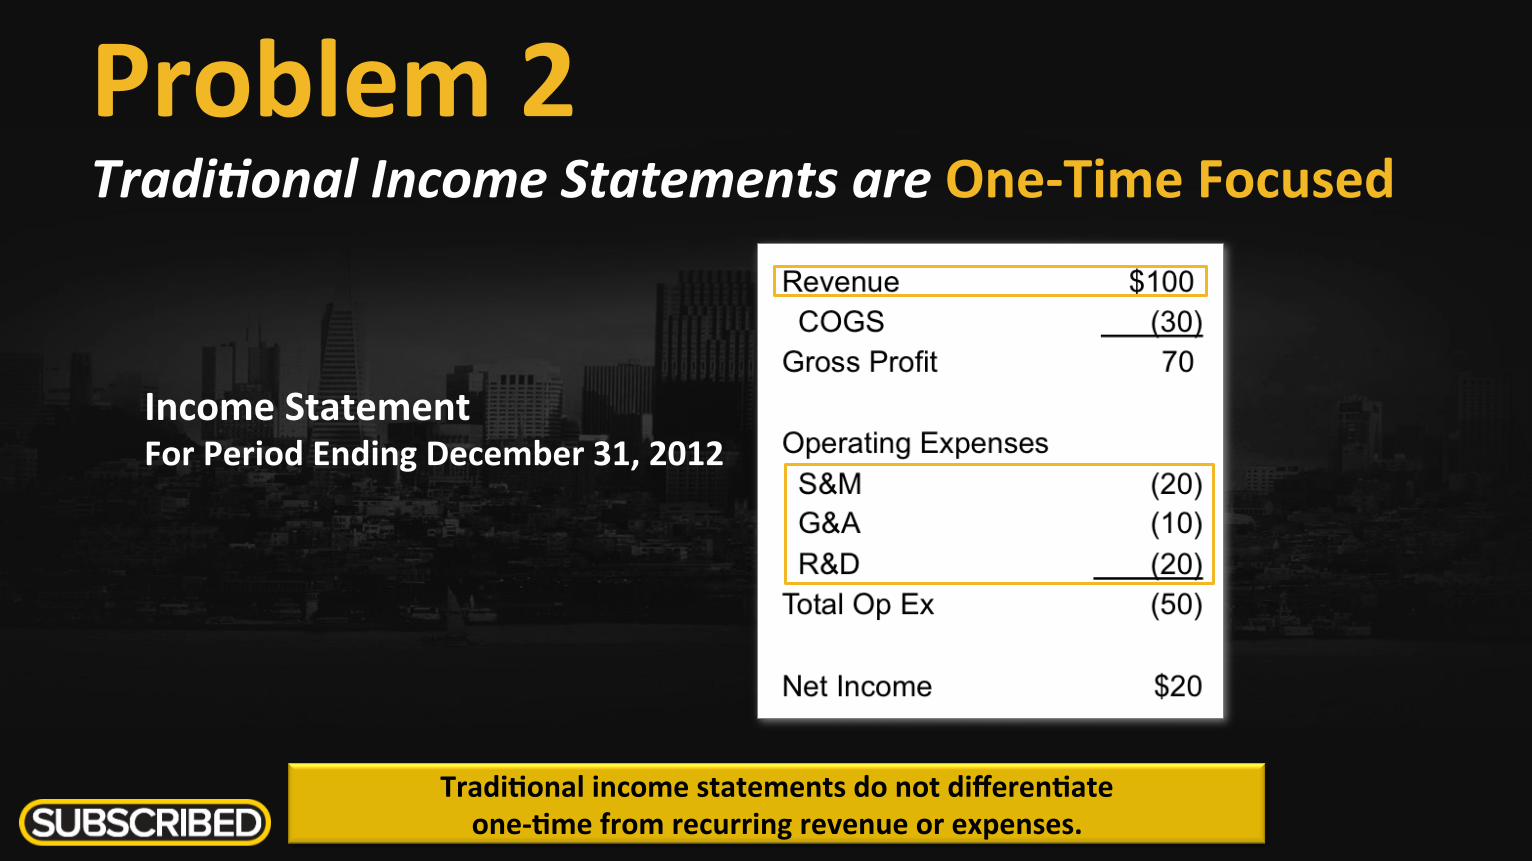
Problem 2 Tradi&onal Income Statements are One-‐Time Focused
Tradi,onal income statements do not differen,ate one-‐,me from recurring revenue or expenses.
Income Statement For Period Ending December 31, 2012
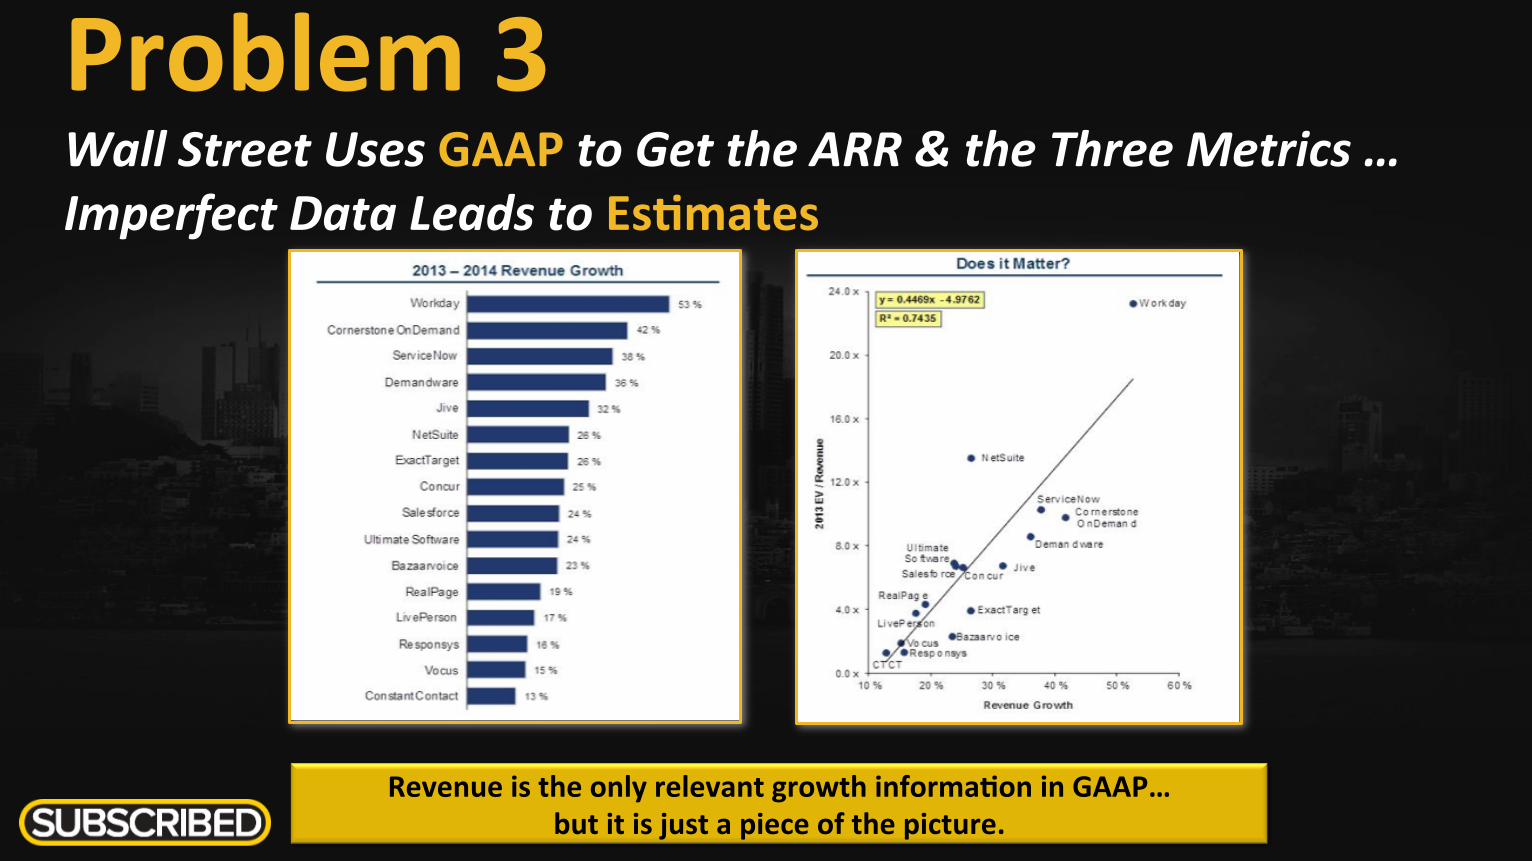
Problem 3 Wall Street Uses GAAP to Get the ARR & the Three Metrics … Imperfect Data Leads to Es,mates
Revenue is the only relevant growth informa,on in GAAP… but it is just a piece of the picture.
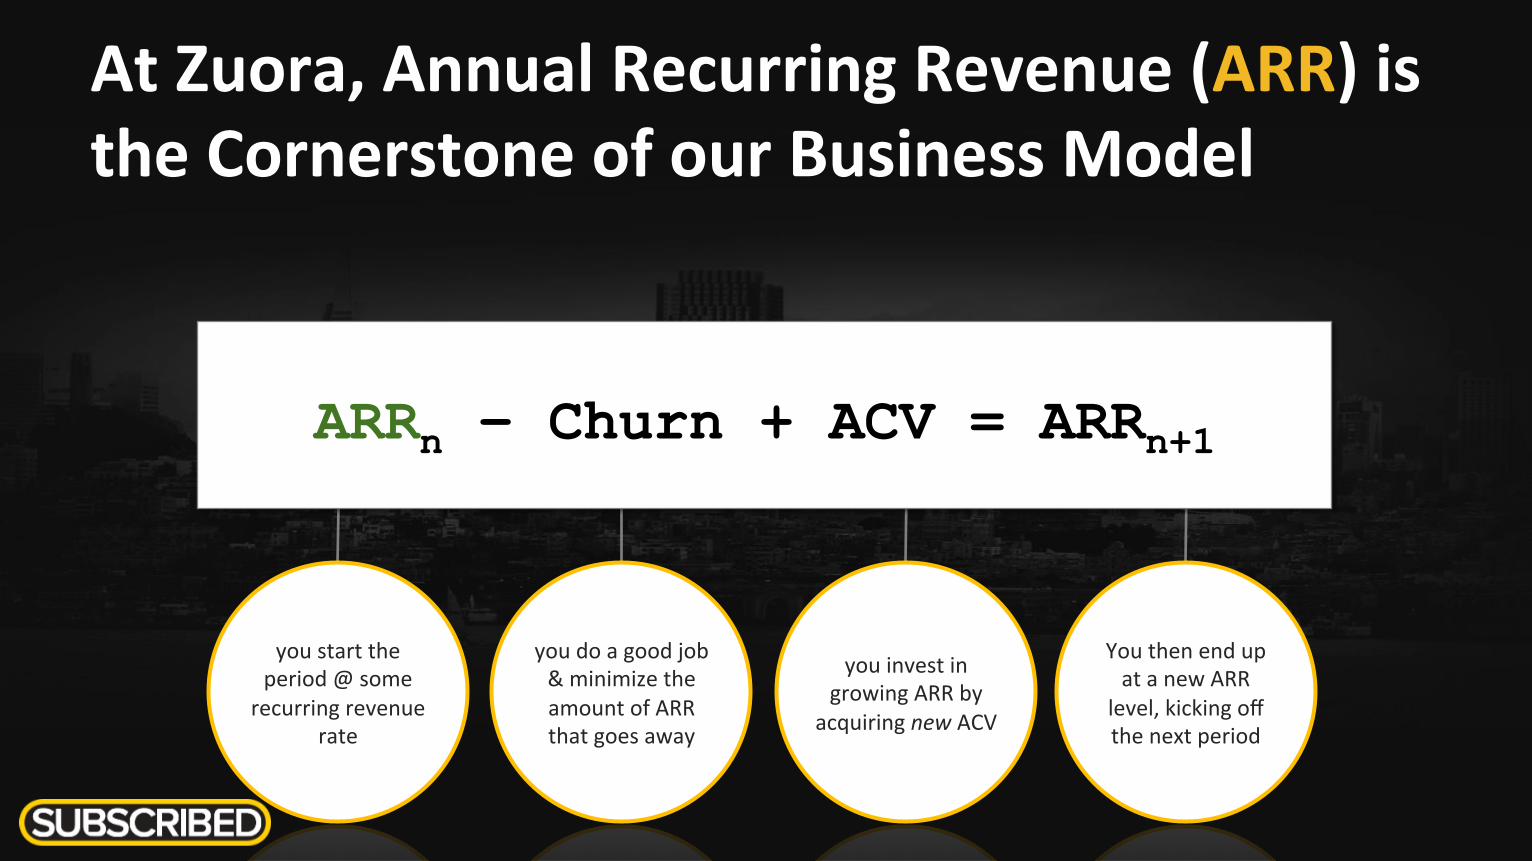
At Zuora, Annual Recurring Revenue (ARR) is the Cornerstone of our Business Model
You then end up at a new ARR
level, kicking off the next period
you invest in growing ARR by
acquiring new ACV
you do a good job & minimize the amount of ARR that goes away
ARRn – Churn + ACV = ARRn+1
you start the period @ some
recurring revenue rate
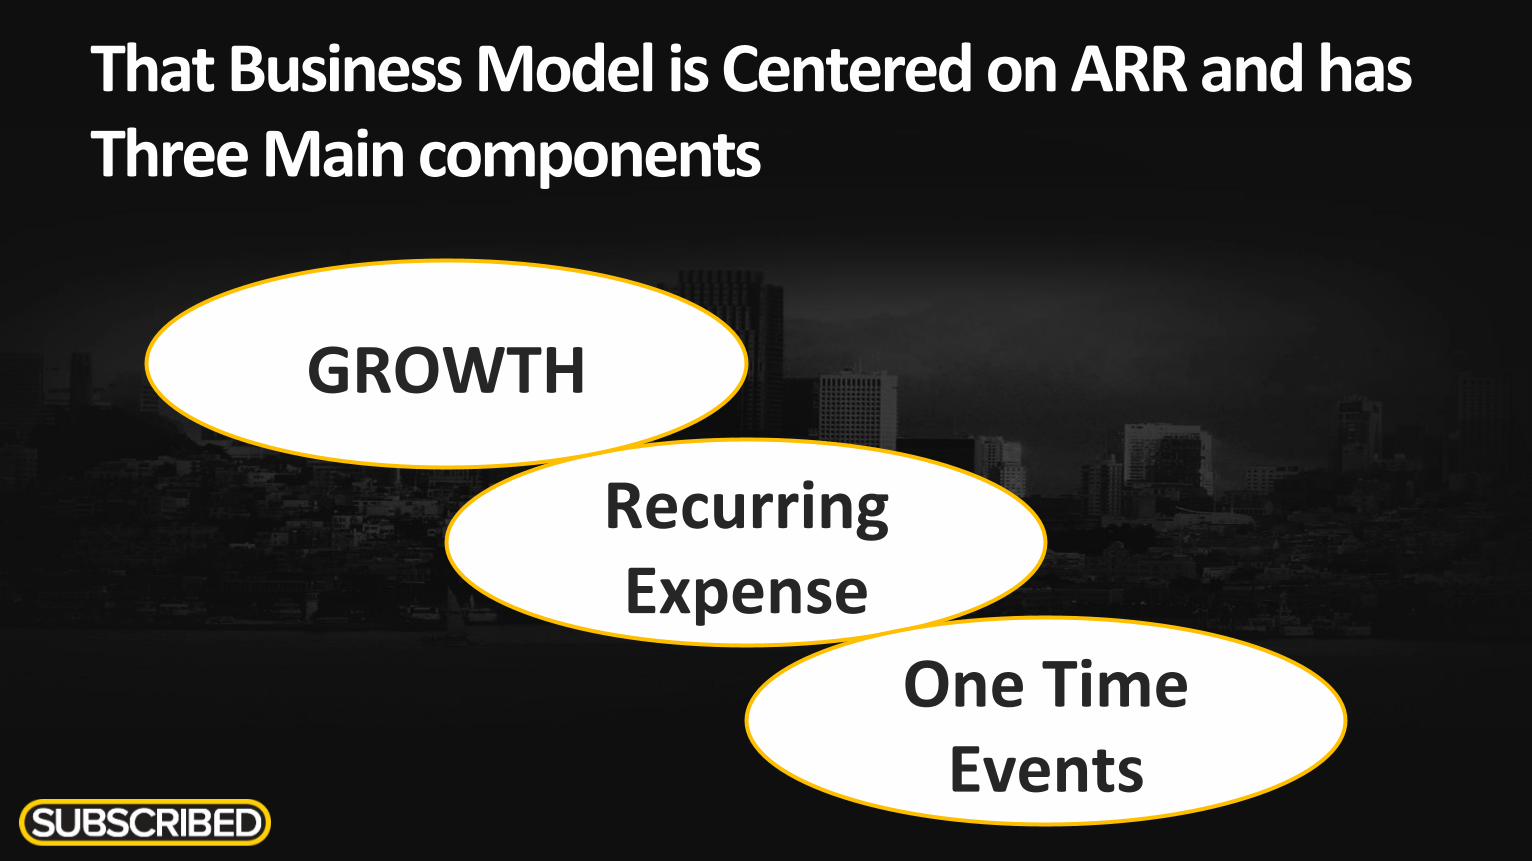
That Business Model is Centered on ARR and has Three Main components
Recurring Expense
GROWTH
One Time Events
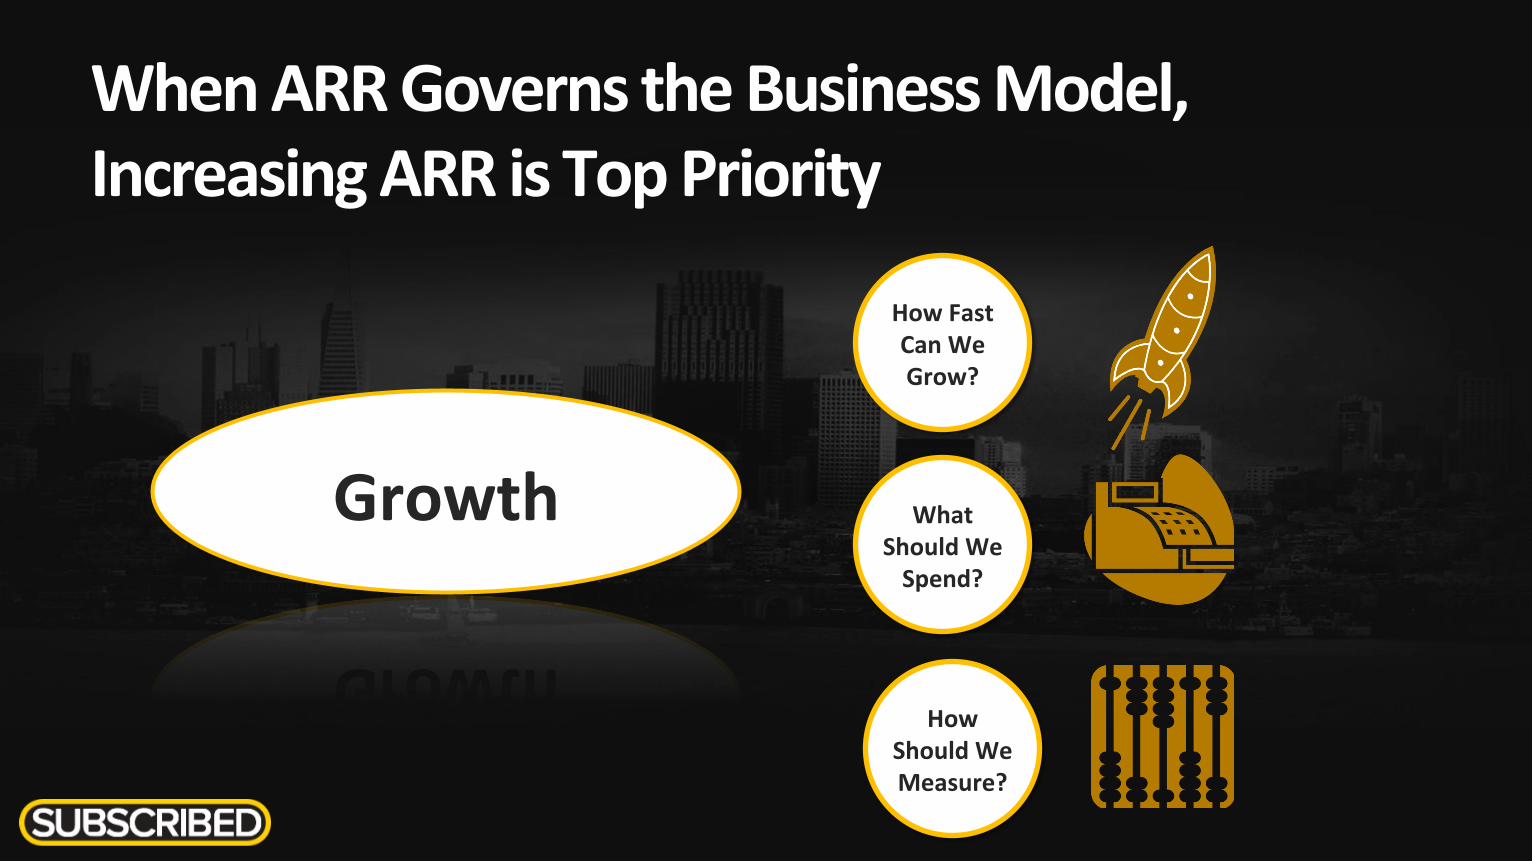
When ARR Governs the Business Model, Increasing ARR is Top Priority
Growth
How Fast Can We Grow?
What Should We Spend?
How Should We Measure?
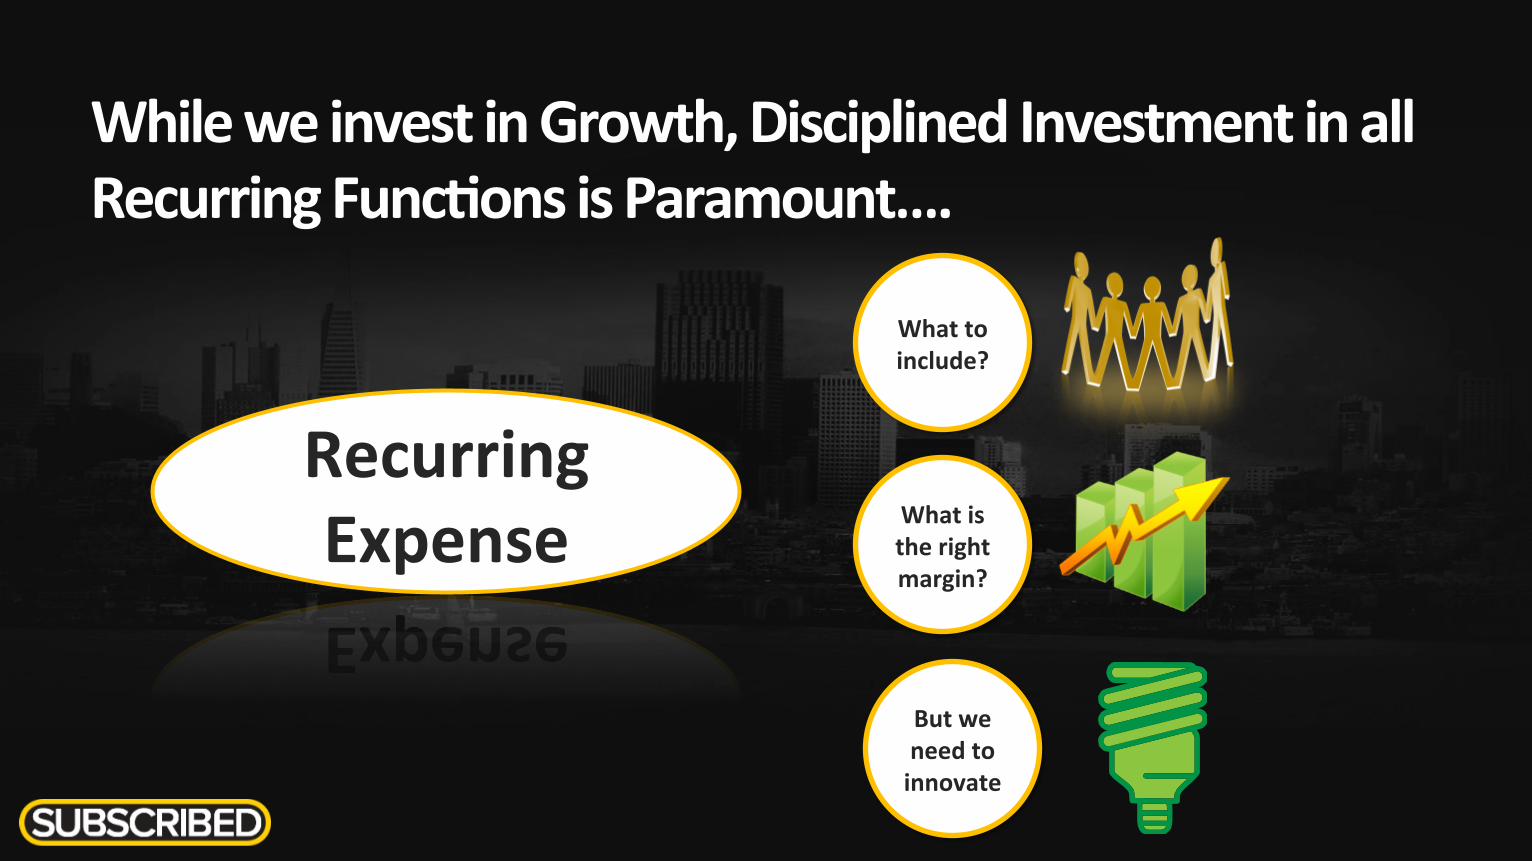
While we invest in Growth, Disciplined Investment in all Recurring Func,ons is Paramount….
Recurring Expense
What to include?
What is the right margin?
But we need to innovate
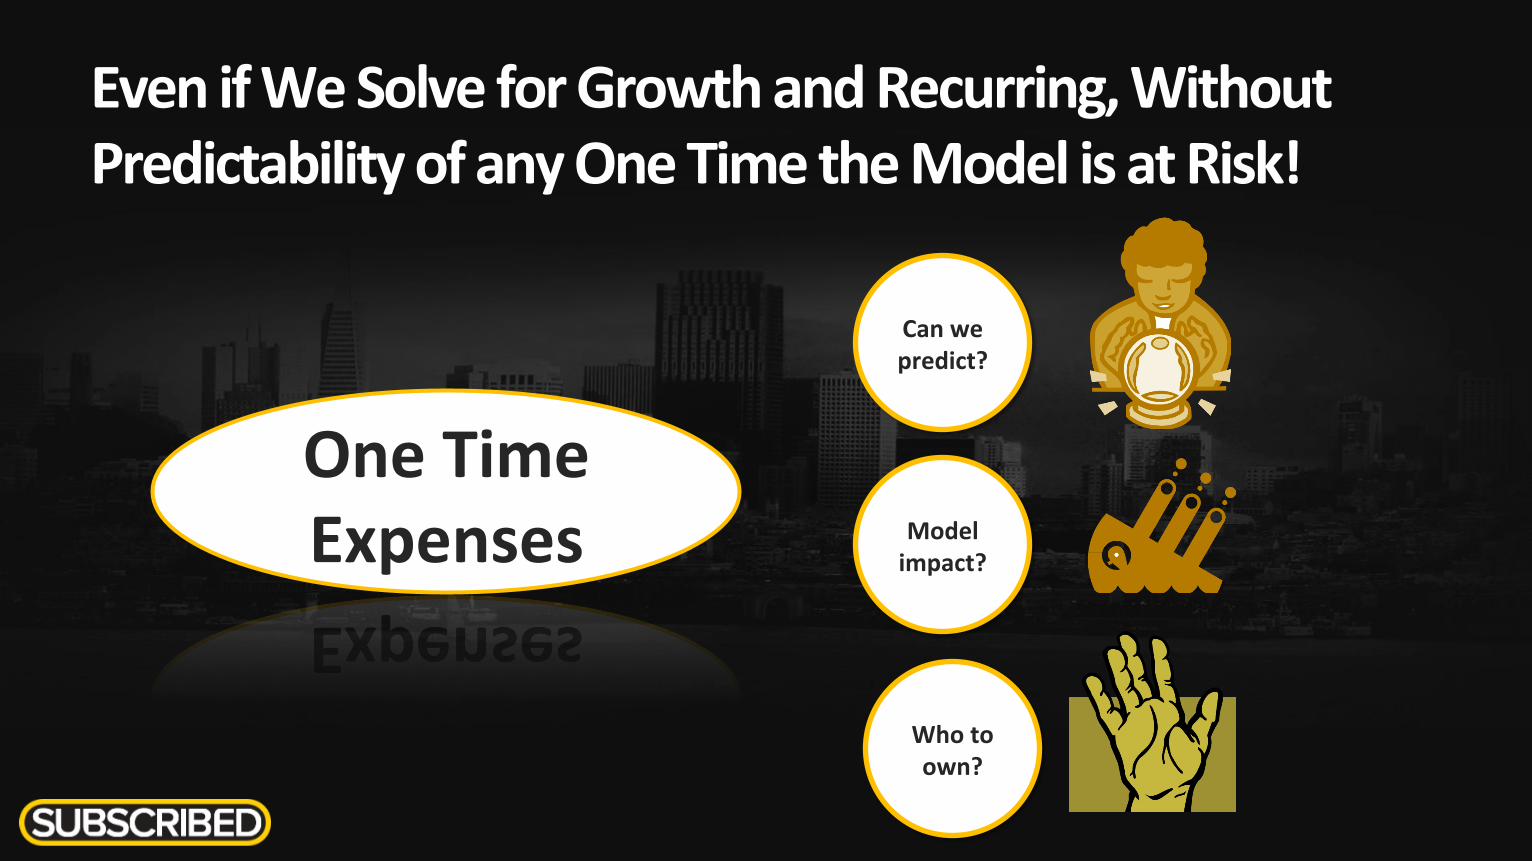
Even if We Solve for Growth and Recurring, Without Predictability of any One Time the Model is at Risk!
One Time Expenses
Can we predict?
Model impact?
Who to own?
A new Income Statement &
Three Metrics that represent the health of a business
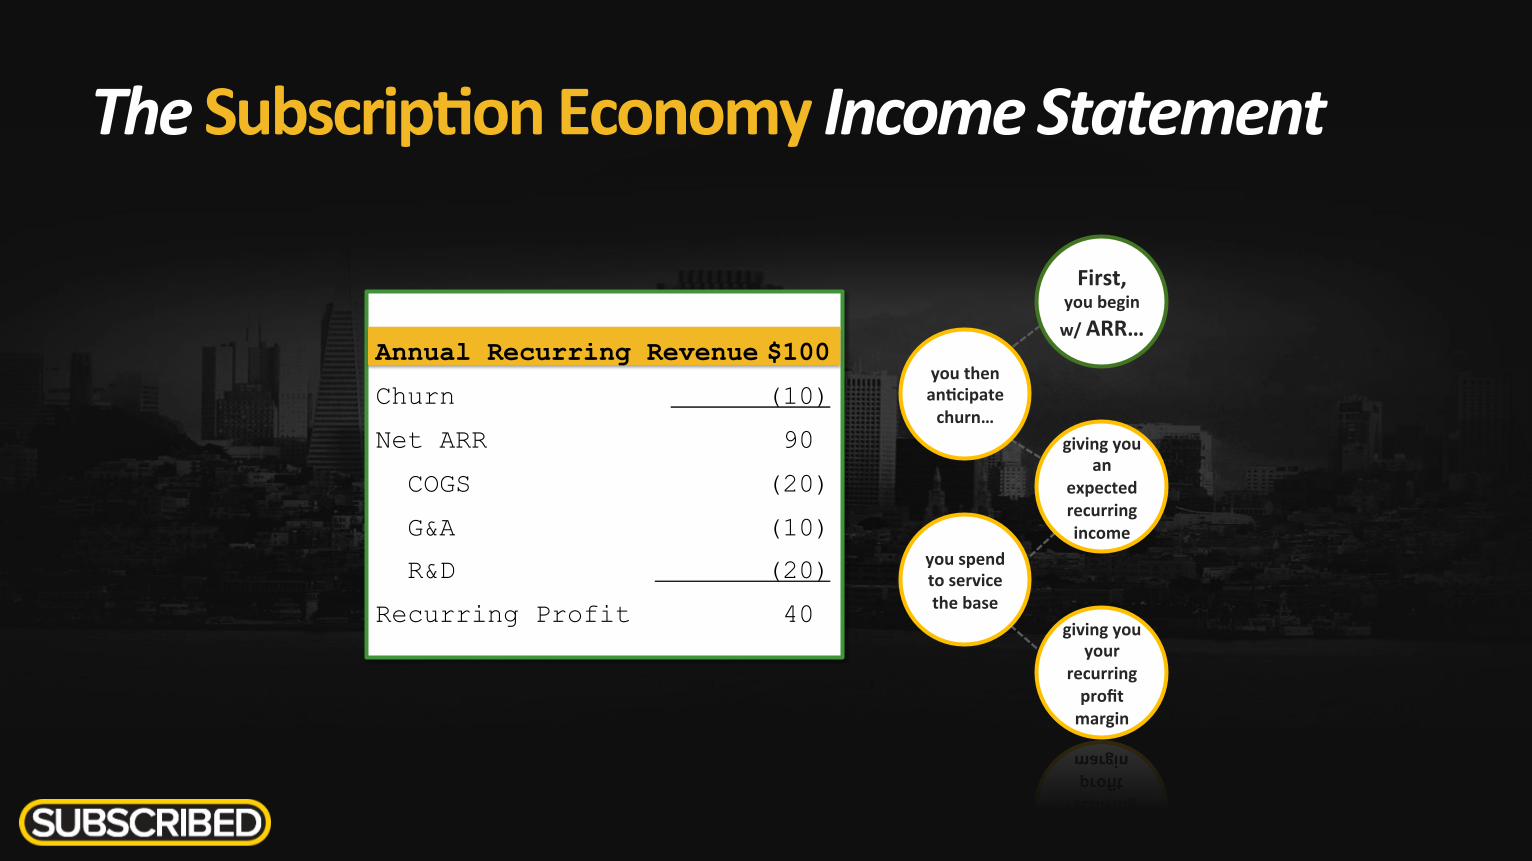
The Subscrip,on Economy Income Statement
giving you your
recurring profit margin
you spend to service the base
First, you begin w/ ARR…
you then an,cipate churn…
giving you an
expected recurring income
Annual Recurring Revenue $100
Churn (10)
Net ARR 90
COGS (20)
G&A (10)
R&D (20)
Recurring Profit 40
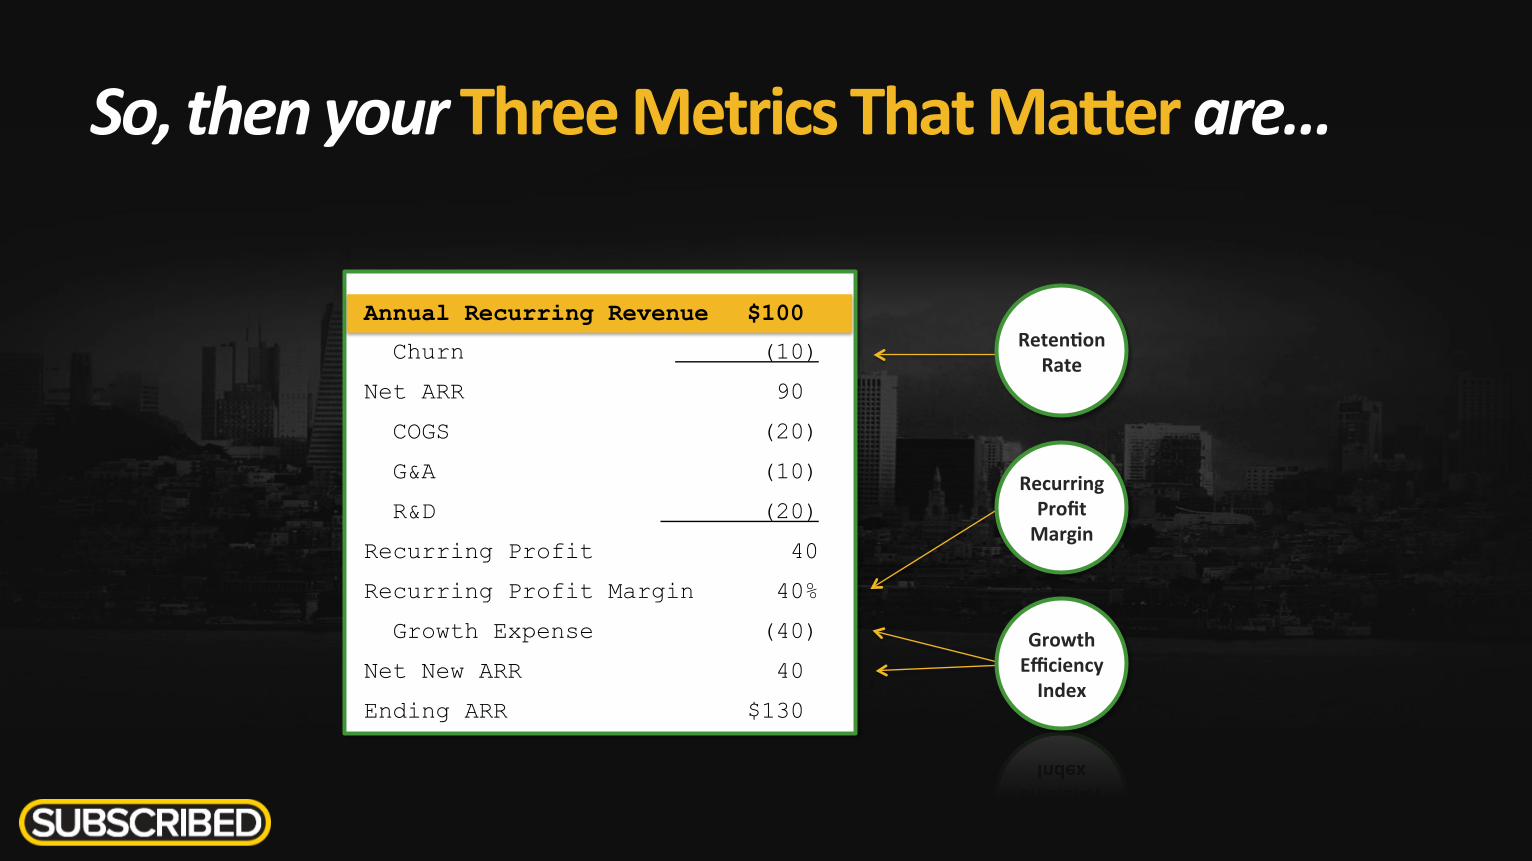
So, then your Three Metrics That Maber are…
Annual Recurring Revenue $100
Churn (10)
Net ARR 90
COGS (20)
G&A (10)
R&D (20)
Recurring Profit 40
Recurring Profit Margin 40%
Growth Expense (40)
Net New ARR 40
Ending ARR $130
Reten,on Rate
Recurring Profit Margin
Growth Efficiency Index
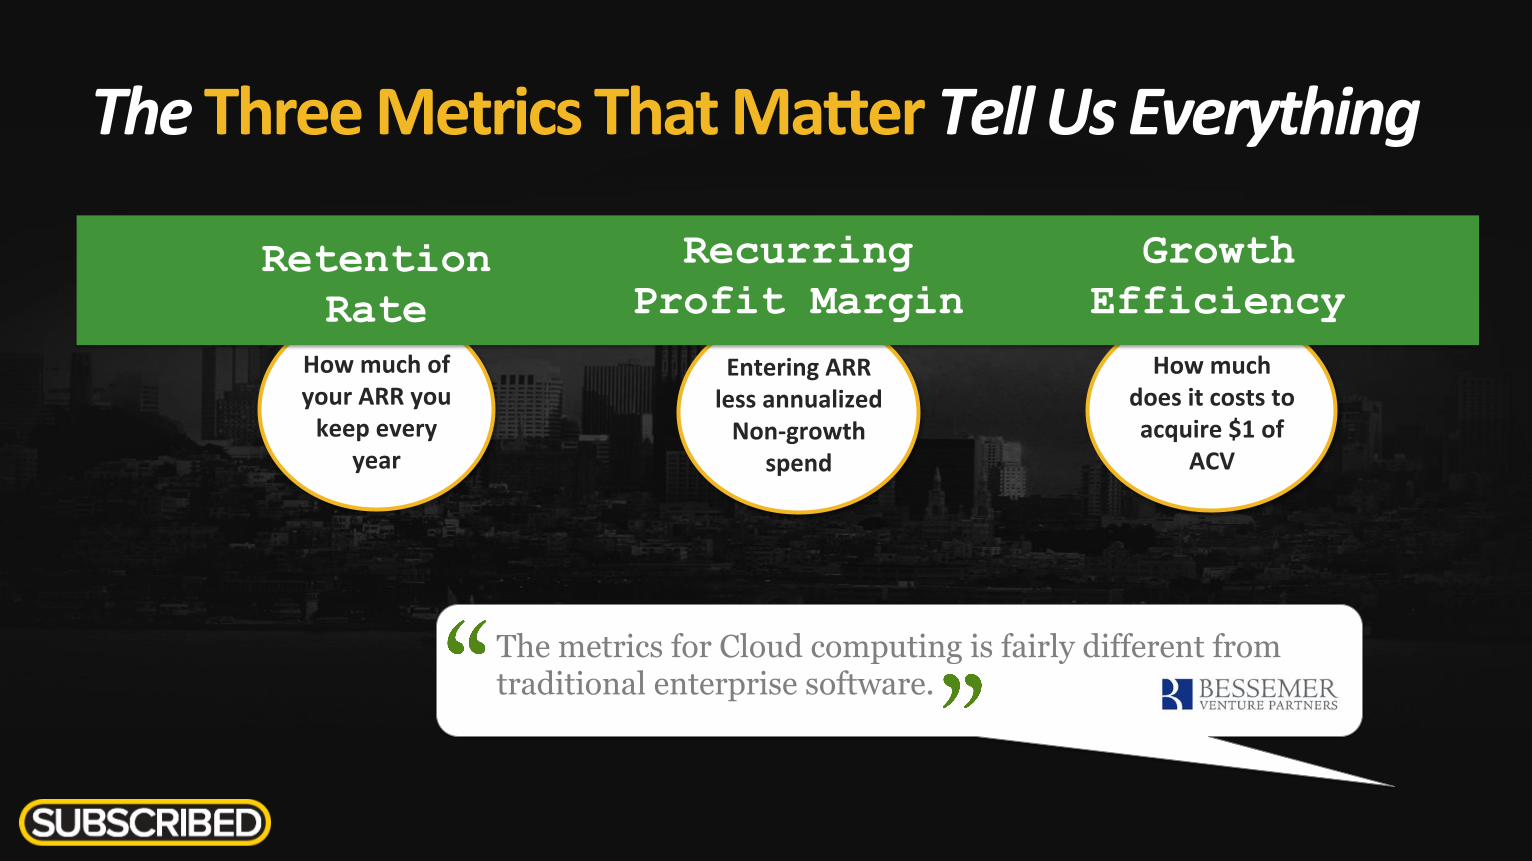
The Three Metrics That Maber Tell Us Everything
The metrics for Cloud computing is fairly different from traditional enterprise software.
How much of your ARR you keep every
year
Entering ARR less annualized Non-‐growth
spend
How much does it costs to acquire $1 of
ACV
Retention Rate
Recurring Profit Margin
Growth Efficiency
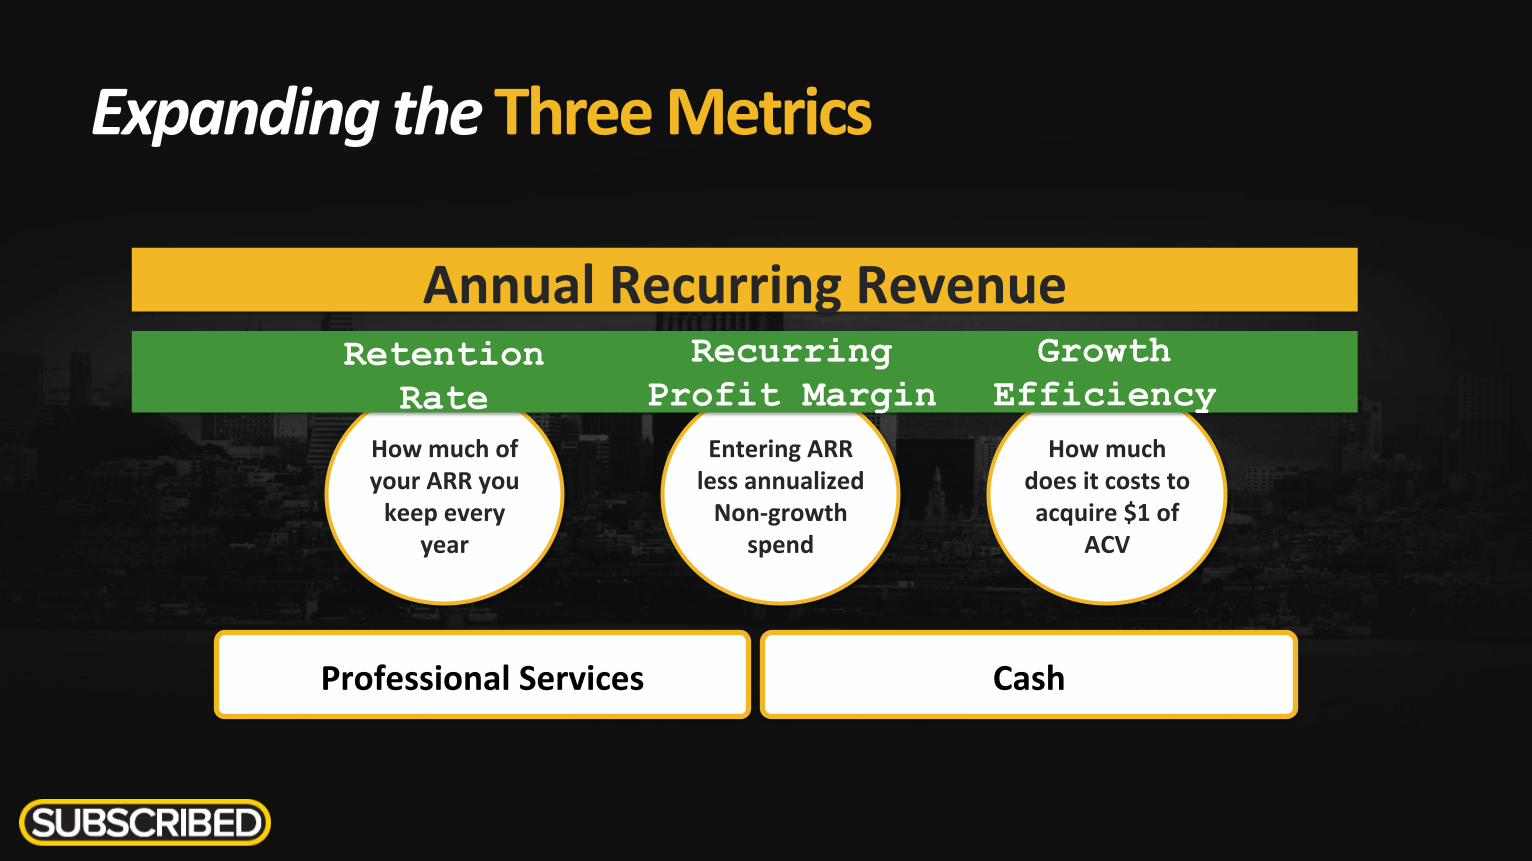
Expanding the Three Metrics
How much of your ARR you keep every
year
Entering ARR less annualized Non-‐growth
spend
How much does it costs to acquire $1 of
ACV
Annual Recurring Revenue
Professional Services Cash
Retention Rate
Recurring Profit Margin
Growth Efficiency
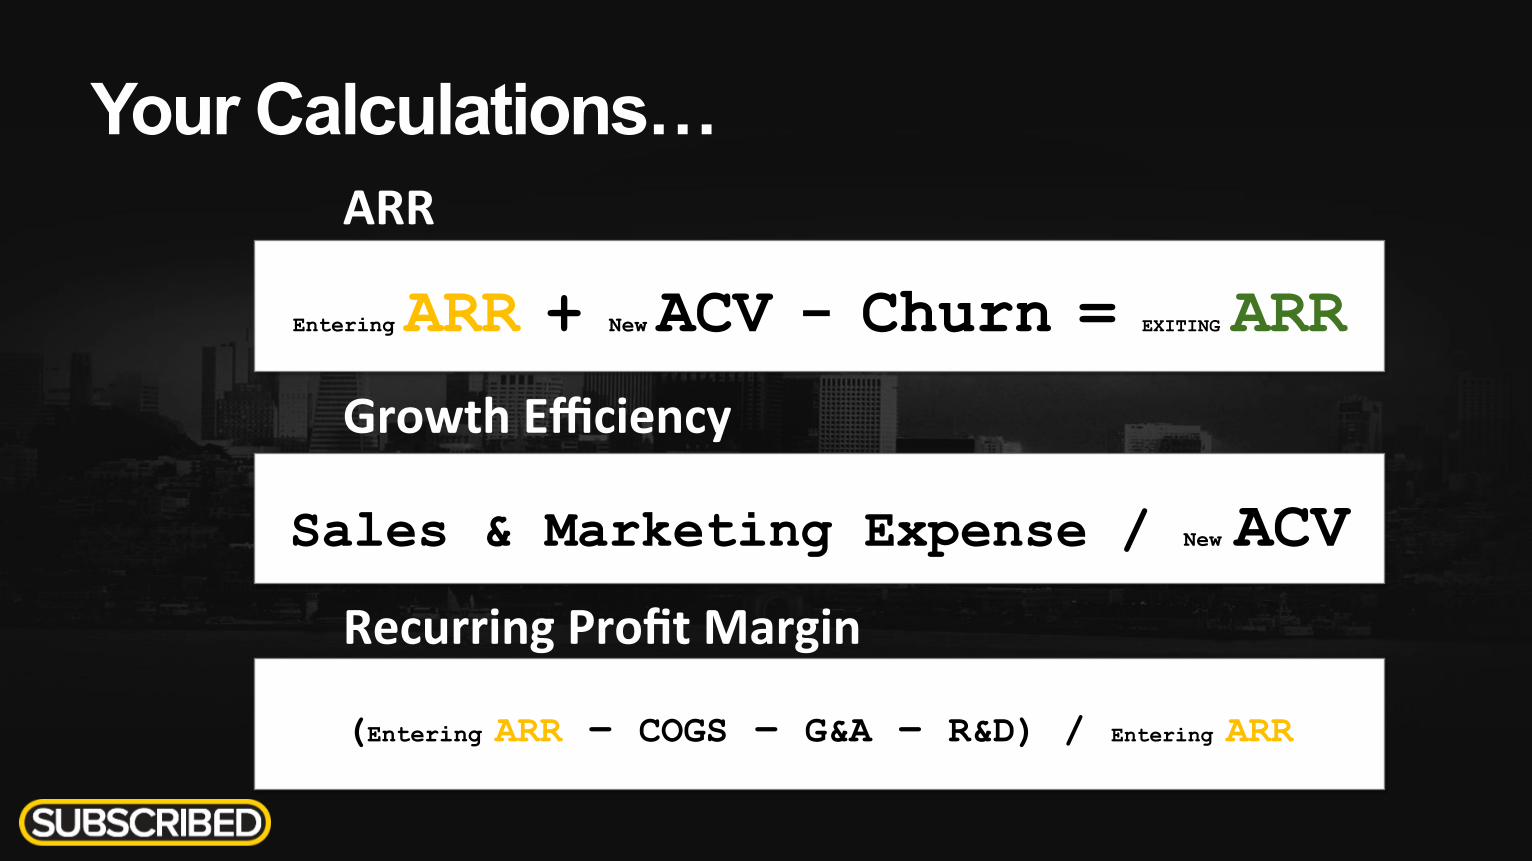
Your Calculations…
Entering ARR + New ACV - Churn = EXITING ARR
ARR
Growth Efficiency
Sales & Marketing Expense / New ACV Recurring Profit Margin
(Entering ARR – COGS – G&A – R&D) / Entering ARR
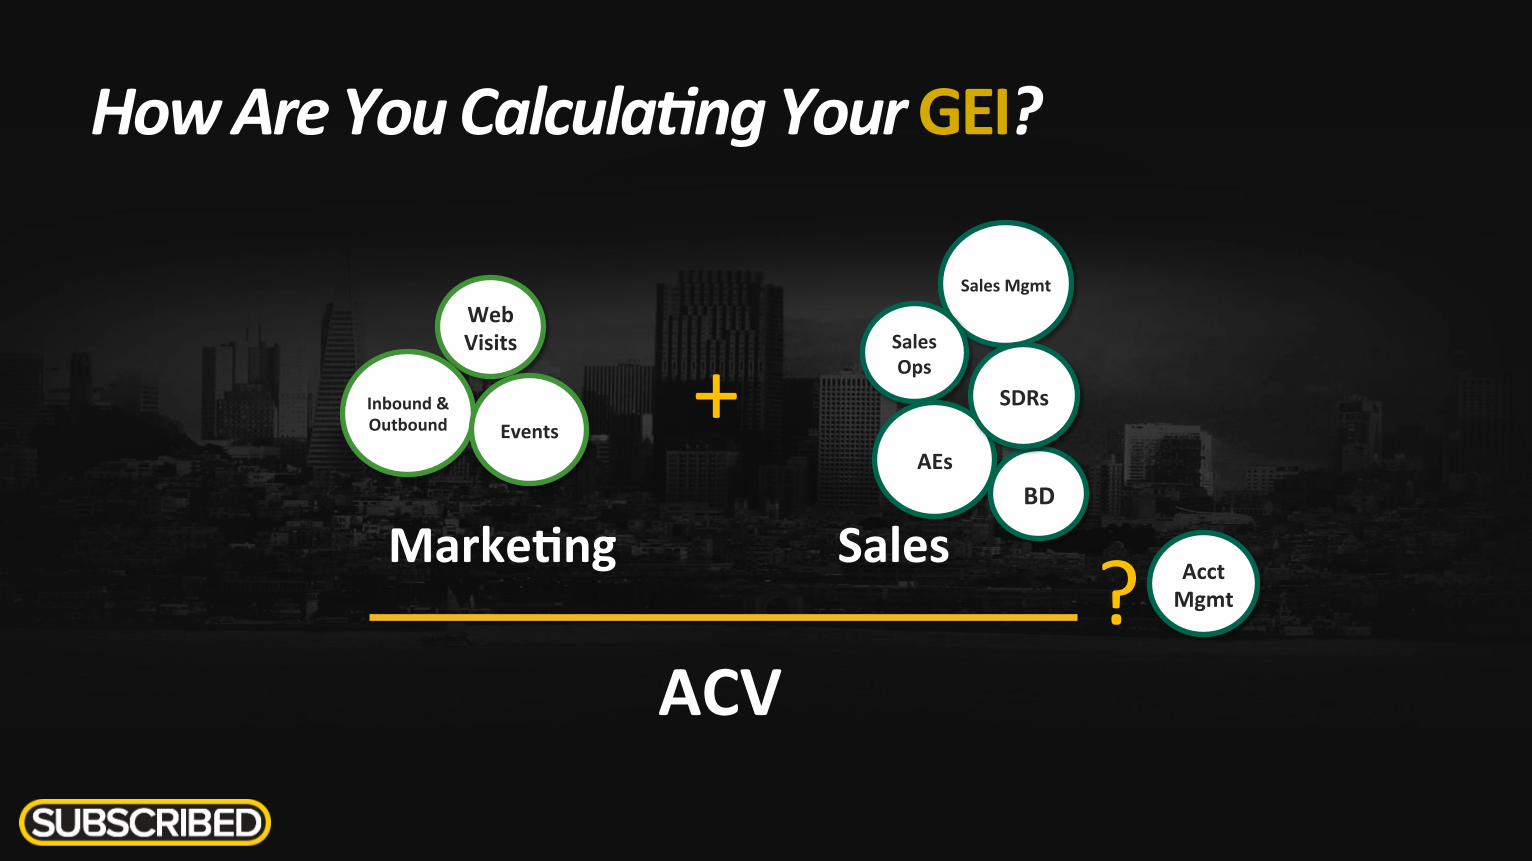
How Are You Calcula&ng Your GEI?
Web Visits
Inbound & Outbound Events
Sales Mgmt
Sales Ops
AEs BD
SDRs
Marke,ng Sales
+
ACV
Acct Mgmt ?
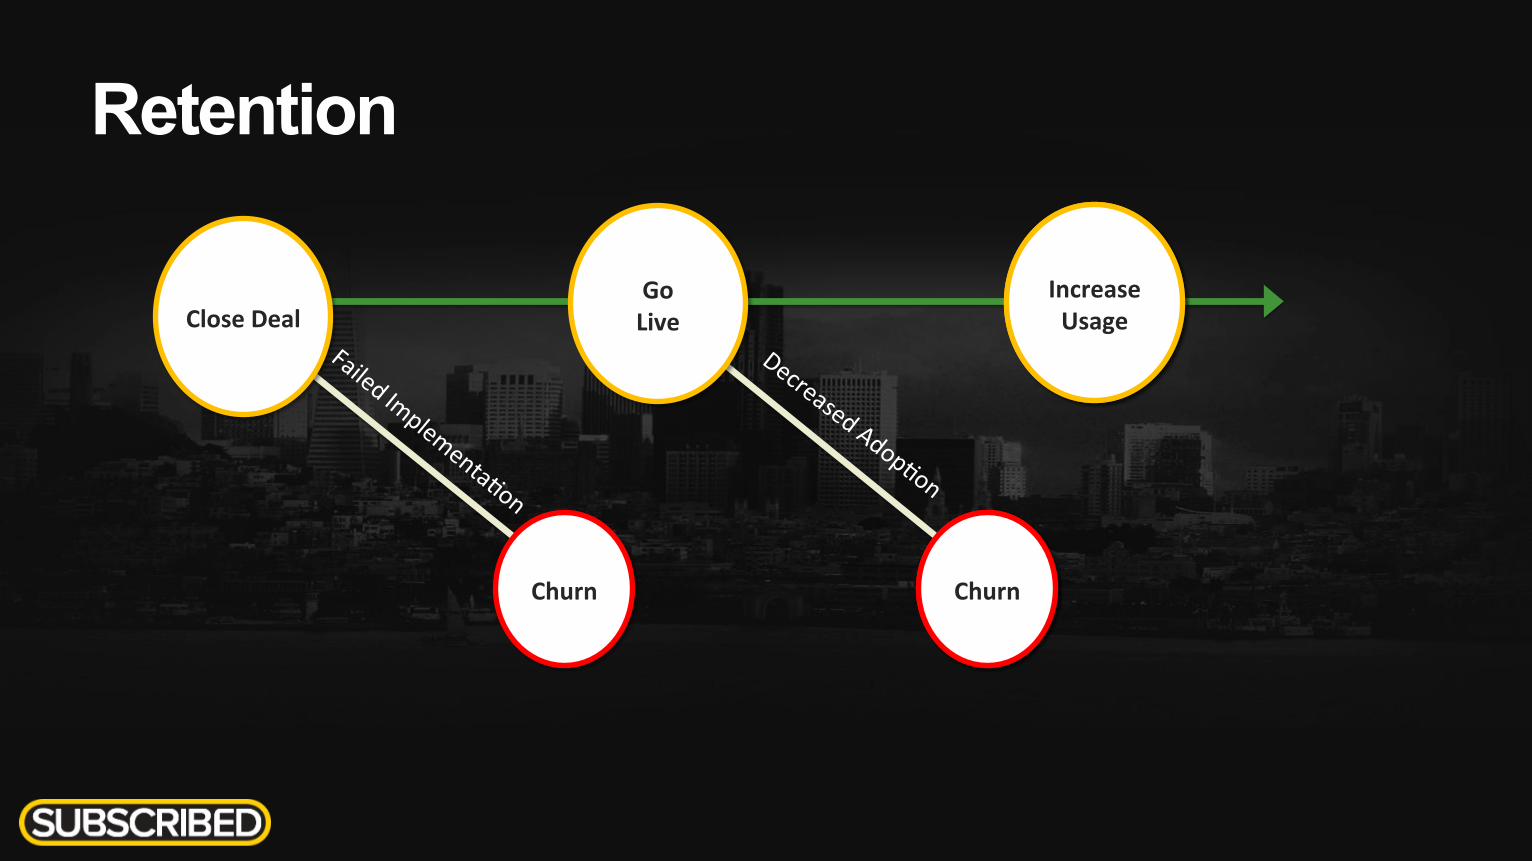
Retention
Churn
Go Live
Increase Usage Close Deal
Churn
Increase Usage
Churn
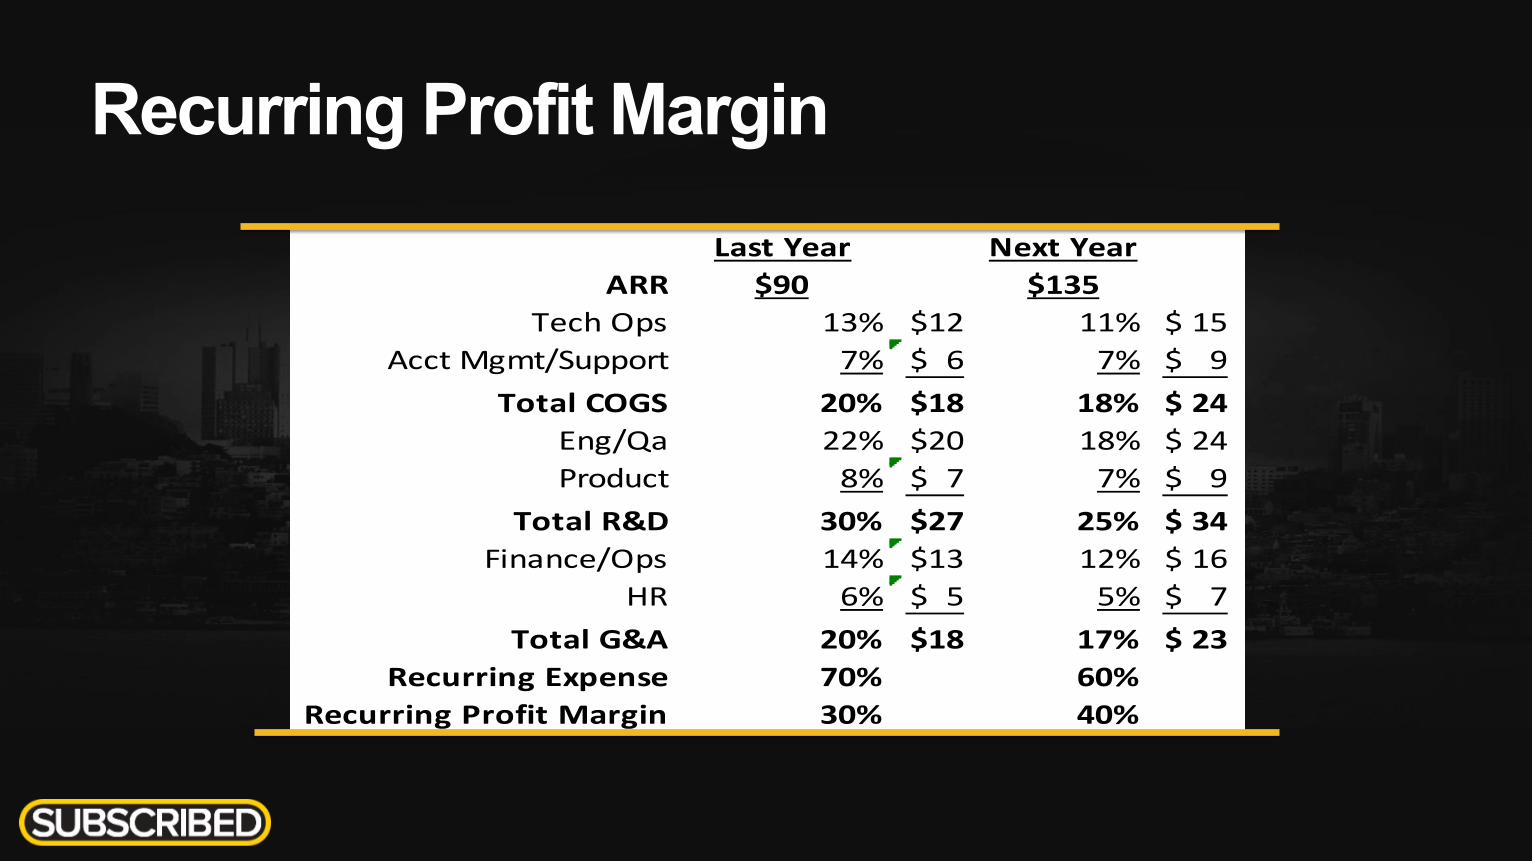
Recurring Profit Margin Last Year Next Year
ARR $90 $135Tech Ops 13% 12$ 11% 15$
Acct Mgmt/Support 7% 6$ 7% 9$ Total COGS 20% 18$ 18% 24$
Eng/Qa 22% 20$ 18% 24$ Product 8% 7$ 7% 9$
Total R&D 30% 27$ 25% 34$ Finance/Ops 14% 13$ 12% 16$
HR 6% 5$ 5% 7$ Total G&A 20% 18$ 17% 23$
Recurring Expense 70% 60%Recurring Profit Margin 30% 40%
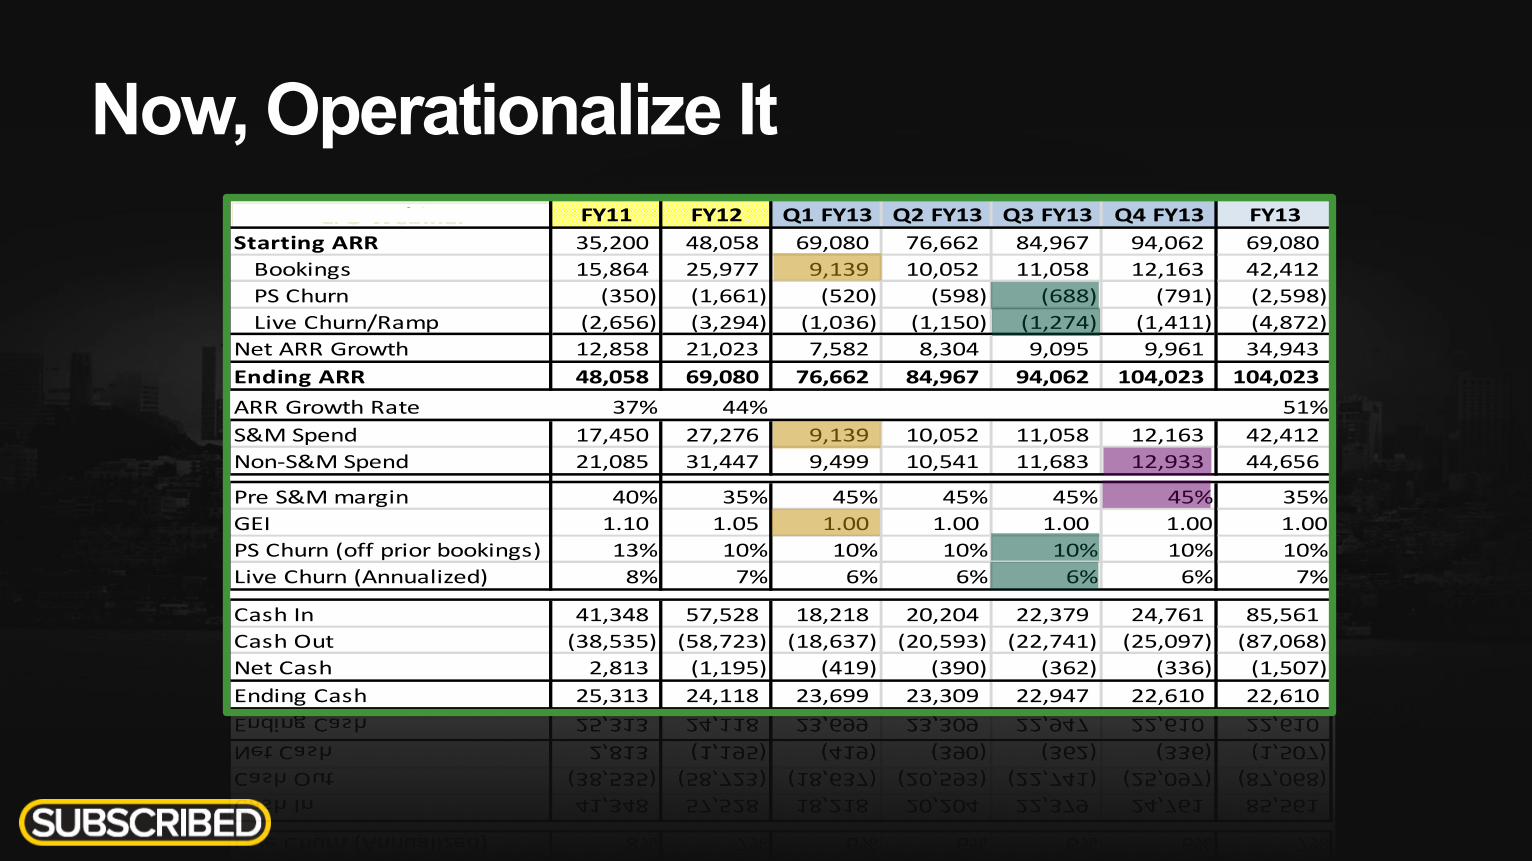
Now, Operationalize It CFO Webinar FY11 FY12 Q1 FY13 Q2 FY13 Q3 FY13 Q4 FY13 FY13
Starting ARR 35,200 48,058 69,080 76,662 84,967 94,062 69,080 Bookings 15,864 25,977 9,139 10,052 11,058 12,163 42,412 PS Churn (350) (1,661) (520) (598) (688) (791) (2,598) Live Churn/Ramp (2,656) (3,294) (1,036) (1,150) (1,274) (1,411) (4,872)
Net ARR Growth 12,858 21,023 7,582 8,304 9,095 9,961 34,943 Ending ARR 48,058 69,080 76,662 84,967 94,062 104,023 104,023 ARR Growth Rate 37% 44% 51%S&M Spend 17,450 27,276 9,139 10,052 11,058 12,163 42,412 Non-‐S&M Spend 21,085 31,447 9,499 10,541 11,683 12,933 44,656
Pre S&M margin 40% 35% 45% 45% 45% 45% 35%GEI 1.10 1.05 1.00 1.00 1.00 1.00 1.00PS Churn (off prior bookings) 13% 10% 10% 10% 10% 10% 10%Live Churn (Annualized) 8% 7% 6% 6% 6% 6% 7%
Cash In 41,348 57,528 18,218 20,204 22,379 24,761 85,561 Cash Out (38,535) (58,723) (18,637) (20,593) (22,741) (25,097) (87,068) Net Cash 2,813 (1,195) (419) (390) (362) (336) (1,507) Ending Cash 25,313 24,118 23,699 23,309 22,947 22,610 22,610
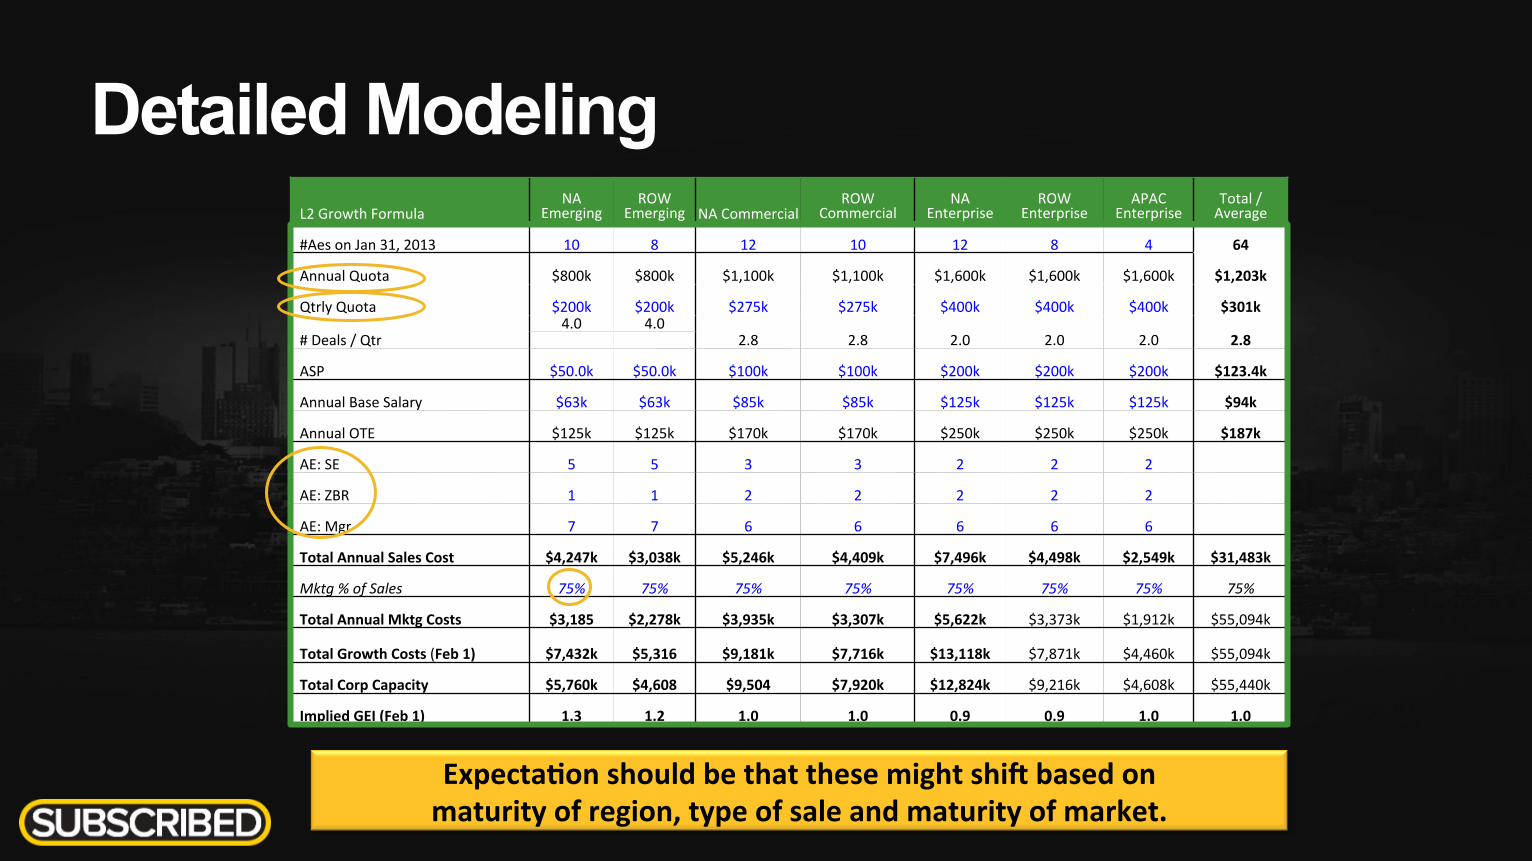
Detailed Modeling
Expecta,on should be that these might shif based on maturity of region, type of sale and maturity of market.
L2 Growth Formula NA
Emerging ROW
Emerging NA Commercial ROW
Commercial NA
Enterprise ROW
Enterprise APAC
Enterprise Total / Average
#Aes on Jan 31, 2013 10 8 12 10 12 8 4 64
Annual Quota $800k $800k $1,100k $1,100k $1,600k $1,600k $1,600k $1,203k
Qtrly Quota $200k $200k $275k $275k $400k $400k $400k $301k
# Deals / Qtr 4.0 4.0
2.8 2.8 2.0 2.0 2.0 2.8
ASP $50.0k $50.0k $100k $100k $200k $200k $200k $123.4k
Annual Base Salary $63k $63k $85k $85k $125k $125k $125k $94k
Annual OTE $125k $125k $170k $170k $250k $250k $250k $187k
AE: SE 5 5 3 3 2 2 2
AE: ZBR 1 1 2 2 2 2 2
AE: Mgr 7 7 6 6 6 6 6
Total Annual Sales Cost $4,247k $3,038k $5,246k $4,409k $7,496k $4,498k $2,549k $31,483k
Mktg % of Sales 75% 75% 75% 75% 75% 75% 75% 75%
Total Annual Mktg Costs $3,185 $2,278k $3,935k $3,307k $5,622k $3,373k $1,912k $55,094k
Total Growth Costs (Feb 1) $7,432k $5,316 $9,181k $7,716k $13,118k $7,871k $4,460k $55,094k
Total Corp Capacity $5,760k $4,608 $9,504 $7,920k $12,824k $9,216k $4,608k $55,440k
Implied GEI (Feb 1) 1.3 1.2 1.0 1.0 0.9 0.9 1.0 1.0
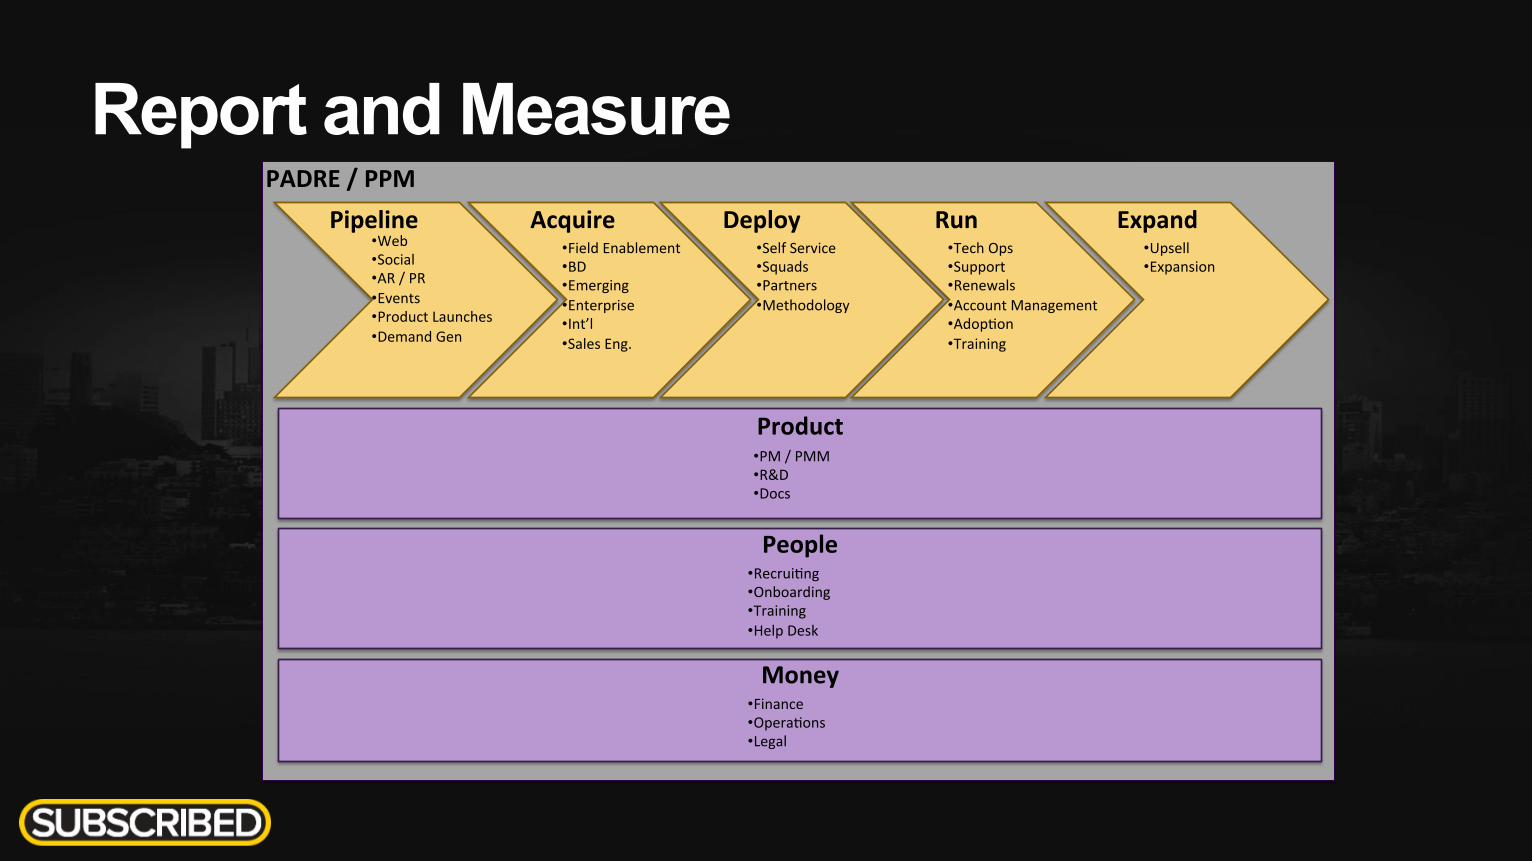
Report and Measure
Product
People • Recruigng • Onboarding • Training • Help Desk
Money • Finance • Operagons • Legal
• PM / PMM • R&D • Docs
Pipeline Acquire Deploy Run Expand • Field Enablement • BD • Emerging • Enterprise • Int’l • Sales Eng.
• Self Service • Squads • Partners • Methodology
• Tech Ops • Support • Renewals • Account Management • Adopgon • Training
• Upsell • Expansion
• Web • Social • AR / PR • Events • Product Launches • Demand Gen
PADRE / PPM
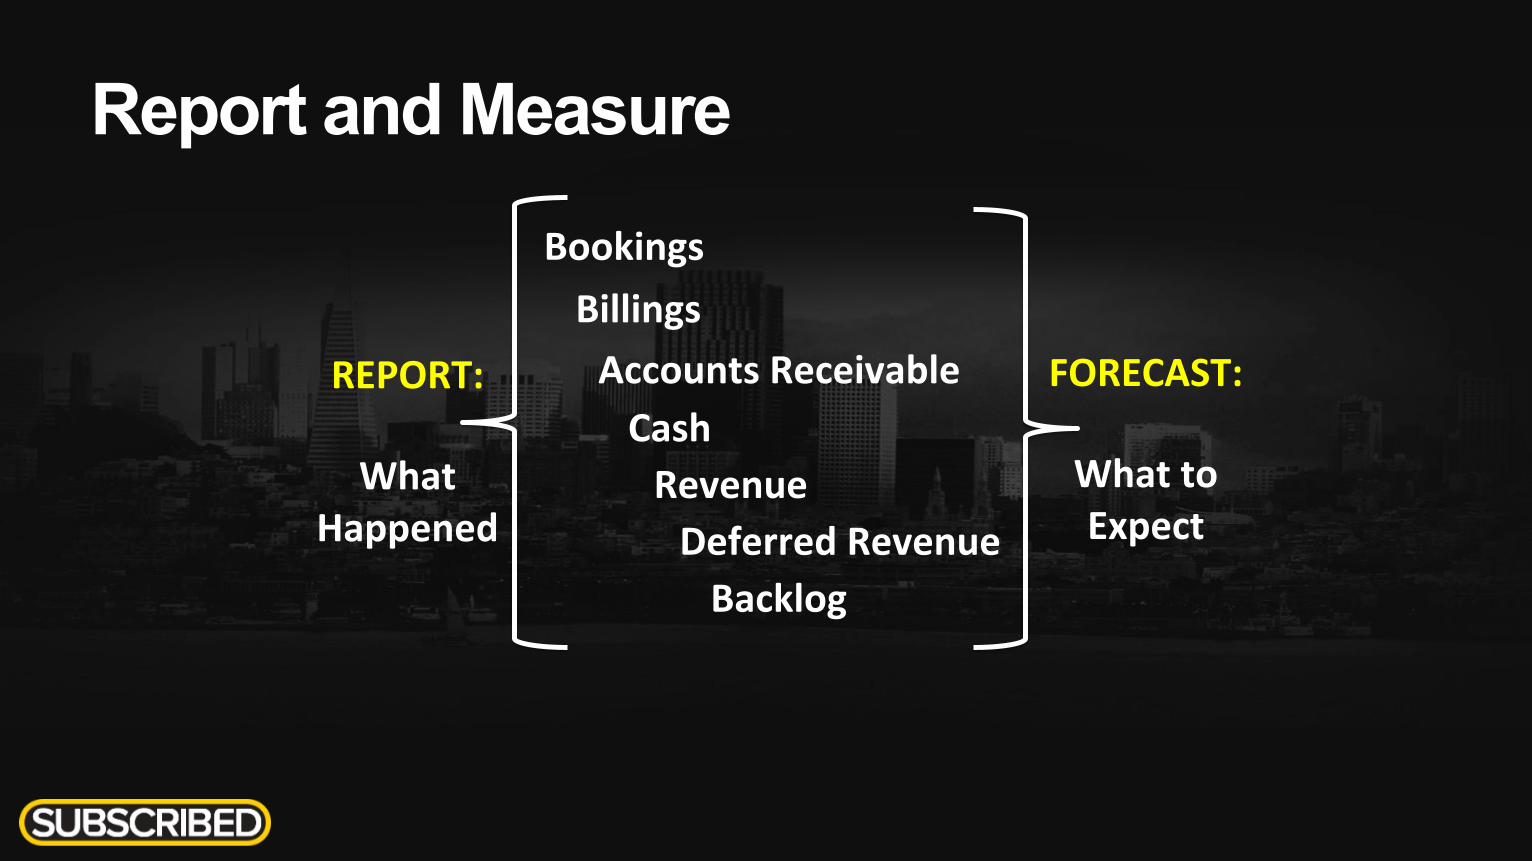
Report and Measure
Bookings Billings
Cash Revenue Deferred Revenue Backlog
Accounts Receivable REPORT:
What Happened
FORECAST:
What to Expect

Meet the Panelists
Blackline Chuck Best, CFO
Logic Monitor Ed Shaughnessy, VP Finance &
Corp Dev
WireDrive PJ Nachman, CFO
Dyn Joe Raczka, VP Finance
Zuora Tyler Sloat, CFO
@jmraczka
@tsloat
@eshaughnessy30 @cbest55
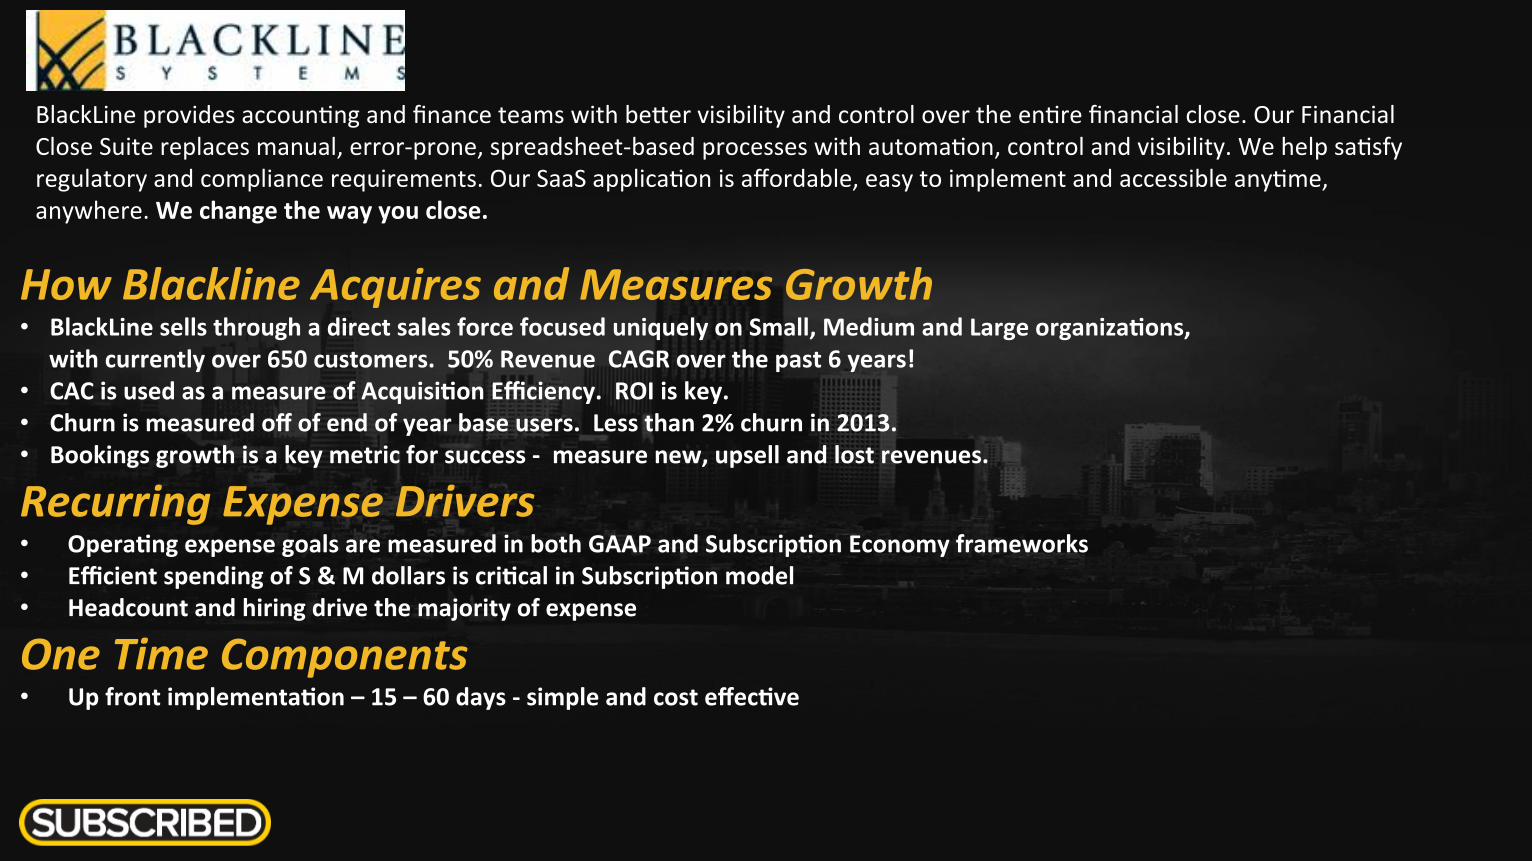
BlackLine provides accoungng and finance teams with bemer visibility and control over the engre financial close. Our Financial Close Suite replaces manual, error-‐prone, spreadsheet-‐based processes with automagon, control and visibility. We help sagsfy regulatory and compliance requirements. Our SaaS applicagon is affordable, easy to implement and accessible anygme, anywhere. We change the way you close.
How Blackline Acquires and Measures Growth • BlackLine sells through a direct sales force focused uniquely on Small, Medium and Large organiza,ons,
with currently over 650 customers. 50% Revenue CAGR over the past 6 years! • CAC is used as a measure of Acquisi,on Efficiency. ROI is key. • Churn is measured off of end of year base users. Less than 2% churn in 2013. • Bookings growth is a key metric for success -‐ measure new, upsell and lost revenues.
Recurring Expense Drivers • Opera,ng expense goals are measured in both GAAP and Subscrip,on Economy frameworks • Efficient spending of S & M dollars is cri,cal in Subscrip,on model • Headcount and hiring drive the majority of expense
One Time Components • Up front implementa,on – 15 – 60 days -‐ simple and cost effec,ve
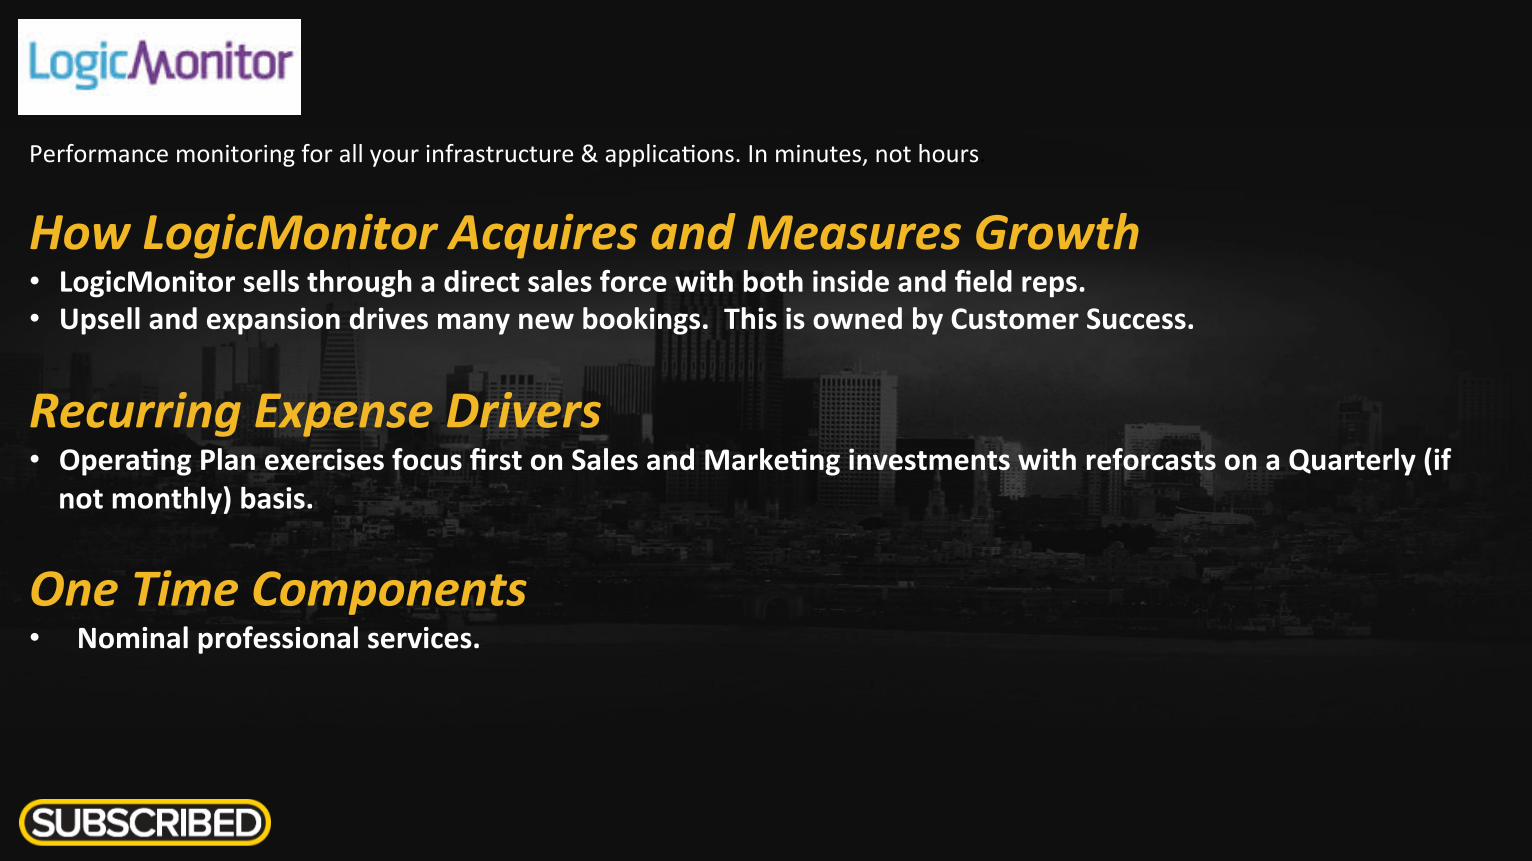
Performance monitoring for all your infrastructure & applicagons. In minutes, not hours.
How LogicMonitor Acquires and Measures Growth • LogicMonitor sells through a direct sales force with both inside and field reps. • Upsell and expansion drives many new bookings. This is owned by Customer Success.
Recurring Expense Drivers • Opera,ng Plan exercises focus first on Sales and Marke,ng investments with reforcasts on a Quarterly (if not monthly) basis.
One Time Components • Nominal professional services.
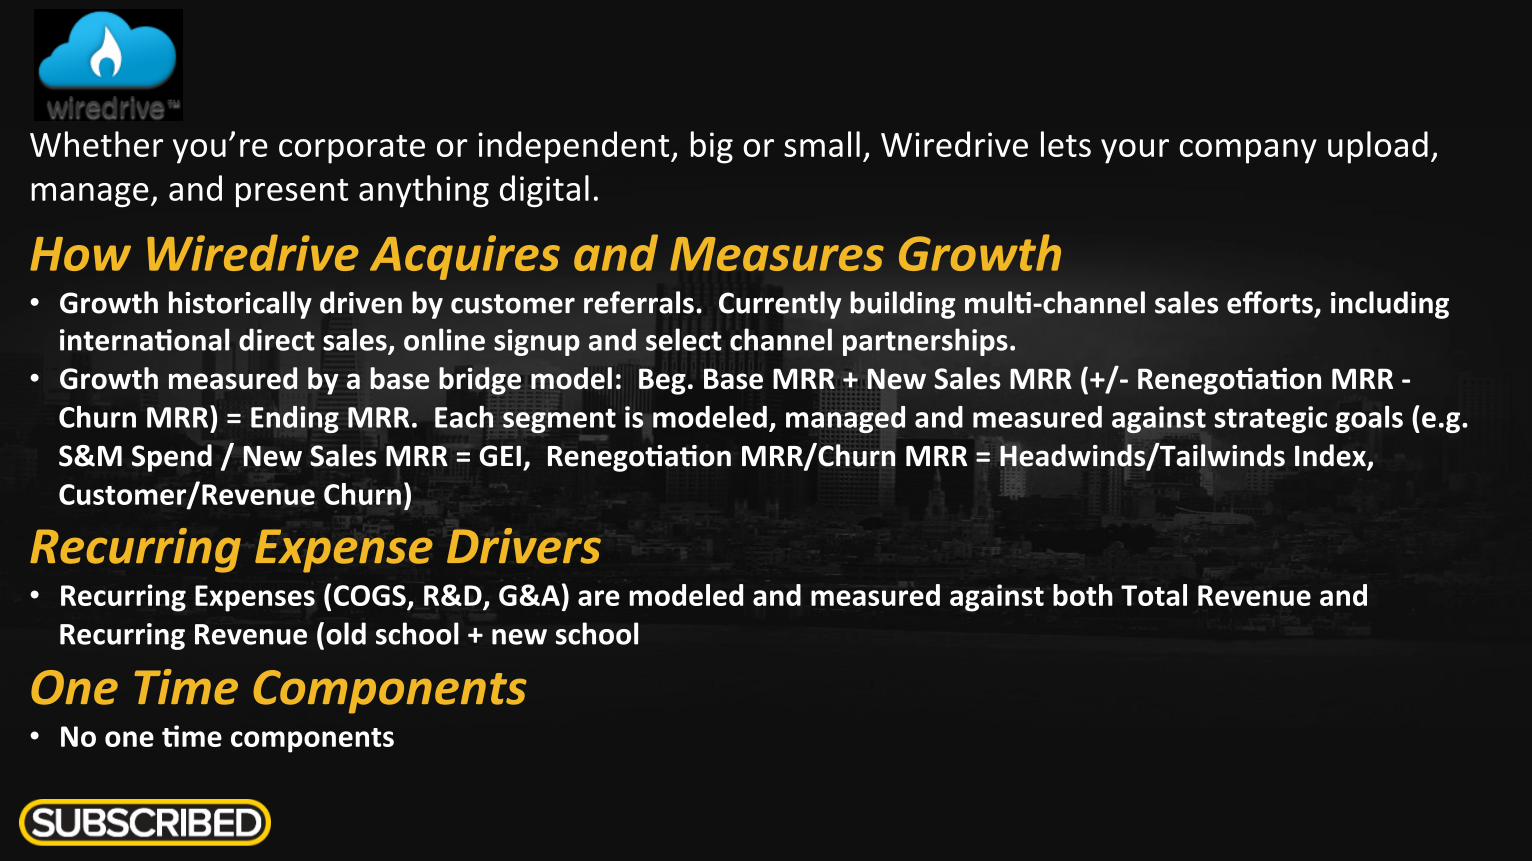
Whether you’re corporate or independent, big or small, Wiredrive lets your company upload, manage, and present anything digital.
How Wiredrive Acquires and Measures Growth • Growth historically driven by customer referrals. Currently building mul,-‐channel sales efforts, including interna,onal direct sales, online signup and select channel partnerships.
• Growth measured by a base bridge model: Beg. Base MRR + New Sales MRR (+/-‐ Renego,a,on MRR -‐ Churn MRR) = Ending MRR. Each segment is modeled, managed and measured against strategic goals (e.g. S&M Spend / New Sales MRR = GEI, Renego,a,on MRR/Churn MRR = Headwinds/Tailwinds Index, Customer/Revenue Churn)
Recurring Expense Drivers • Recurring Expenses (COGS, R&D, G&A) are modeled and measured against both Total Revenue and Recurring Revenue (old school + new school
One Time Components • No one ,me components
Dyn solugons are at the core of Internet Performance. Through traffic management, message management and performance assurance, Dyn is connecgng people through the Internet and ensuring informagon gets where it needs to go, faster and more reliably than ever before. Incorporated in 2001, Dyn’s global presence services more than four million enterprise, small business and personal customers. Visit dyn.com to learn more about how Dyn.com/Delivers.
How Dyn Acquires and Measures Growth • Direct sales model (60%) and self-‐service component (40%). Direct Sales includes Enterprise, Emerging, and Partner/Channel
• Growth measured by ARR -‐ Churn + New ACV
Recurring Expense Drivers • OPEX goals are run against bookings targets • Recurring Expense is Cost of Revenue, G&A & R&D and measured against Long Term Model
One Time Components • No one time components

END