Embed Size (px)
Citation preview
© 2012 Cloud9 Analytics, Inc. All Rights Reserved.
© 2012 Cloud9 Analytics, Inc. All Rights Reserved.
Intelligent Sales Forecasting
Treasure Hunting in Your Salesforce Data Swayne Hill Co-Founder & Senior VP, Cloud9
© 2012 Cloud9 Analytics, Inc. All Rights Reserved.
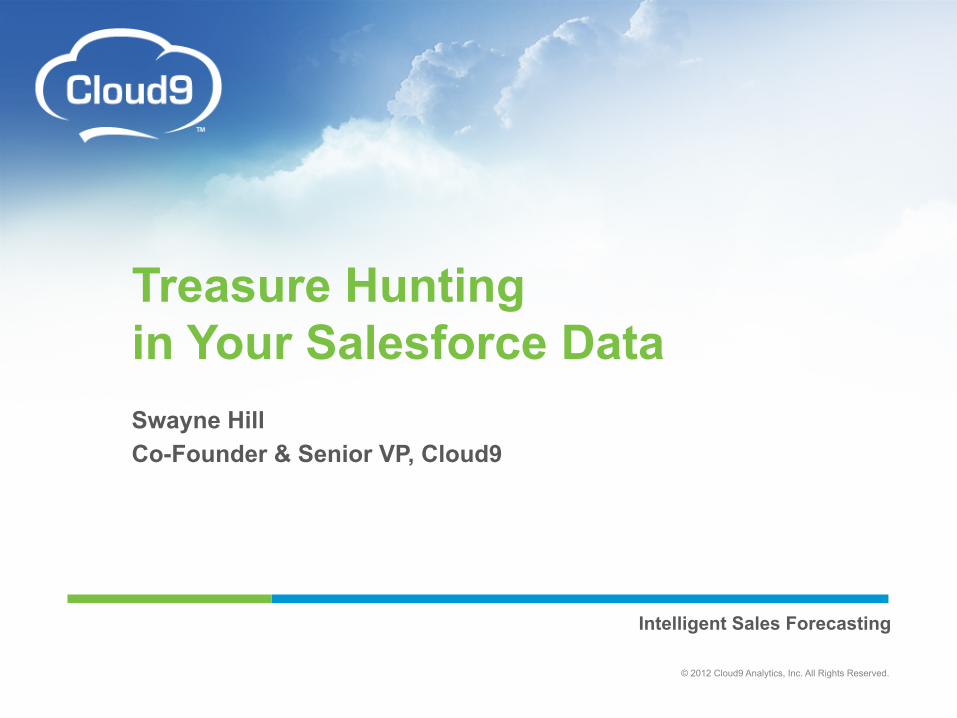
We Don’t Need more Dashboards,
We Just Need Answers
© 2012 Cloud9 Analytics, Inc. All Rights Reserved.
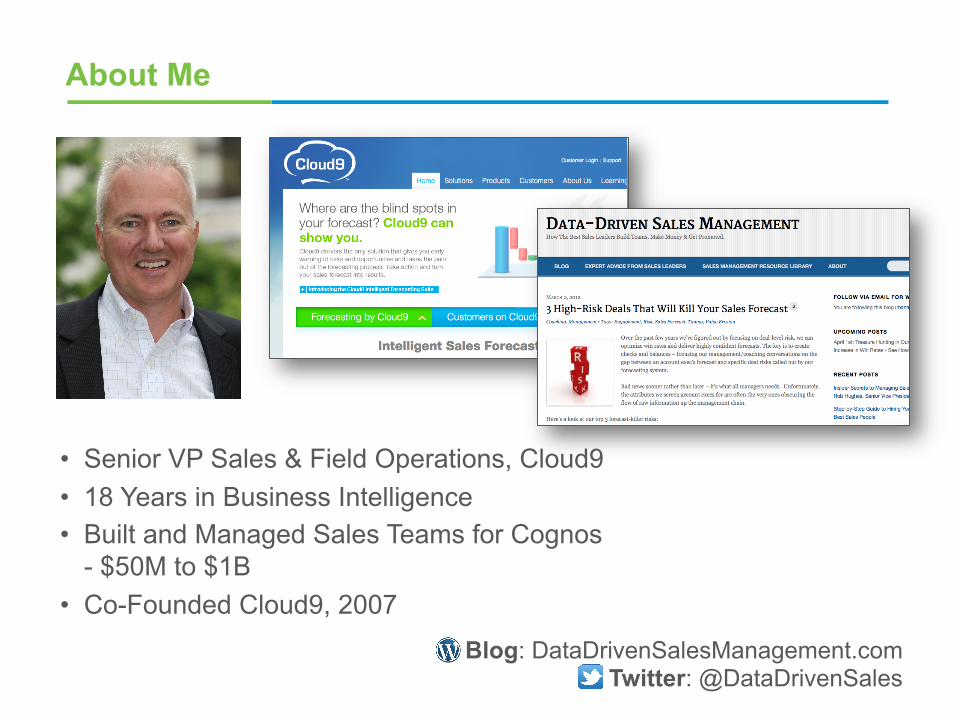
About Me
• Senior VP Sales & Field Operations, Cloud9 • 18 Years in Business Intelligence • Built and Managed Sales Teams for Cognos
- $50M to $1B • Co-Founded Cloud9, 2007
Blog: DataDrivenSalesManagement.com Twitter: @DataDrivenSales

© 2012 Cloud9 Analytics, Inc. All Rights Reserved.
Treasure Hunting in Your Own Back Yard There’s Gold in Your Sales Data, You Just Need a Way to Find it
© 2012 Cloud9 Analytics, Inc. All Rights Reserved.
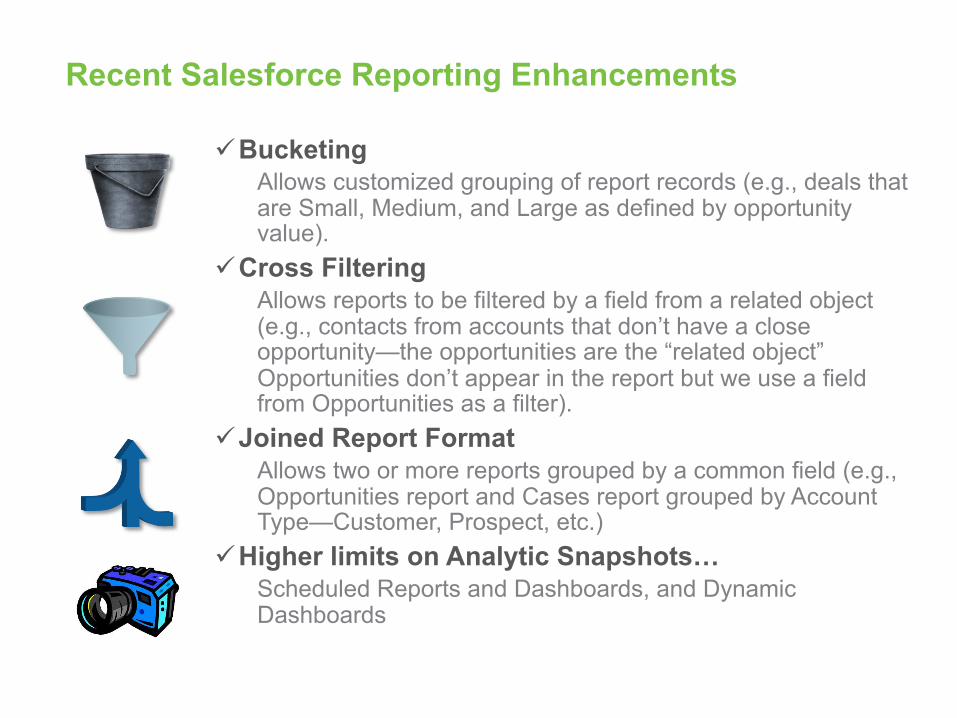
Recent Salesforce Reporting Enhancements
ü Bucketing Allows customized grouping of report records (e.g., deals that are Small, Medium, and Large as defined by opportunity value).
ü Cross Filtering Allows reports to be filtered by a field from a related object (e.g., contacts from accounts that don’t have a close opportunity—the opportunities are the “related object” Opportunities don’t appear in the report but we use a field from Opportunities as a filter).
ü Joined Report Format Allows two or more reports grouped by a common field (e.g., Opportunities report and Cases report grouped by Account Type—Customer, Prospect, etc.)
ü Higher limits on Analytic Snapshots… Scheduled Reports and Dashboards, and Dynamic Dashboards
© 2012 Cloud9 Analytics, Inc. All Rights Reserved.
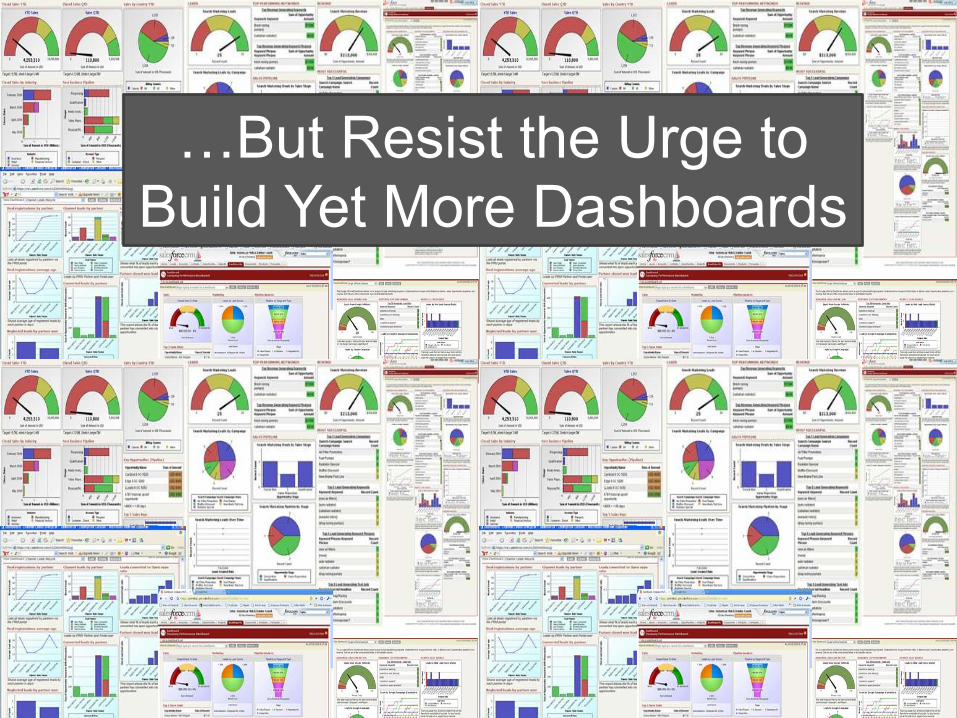
…But Resist the Urge to Build Yet More Dashboards
© 2012 Cloud9 Analytics, Inc. All Rights Reserved.
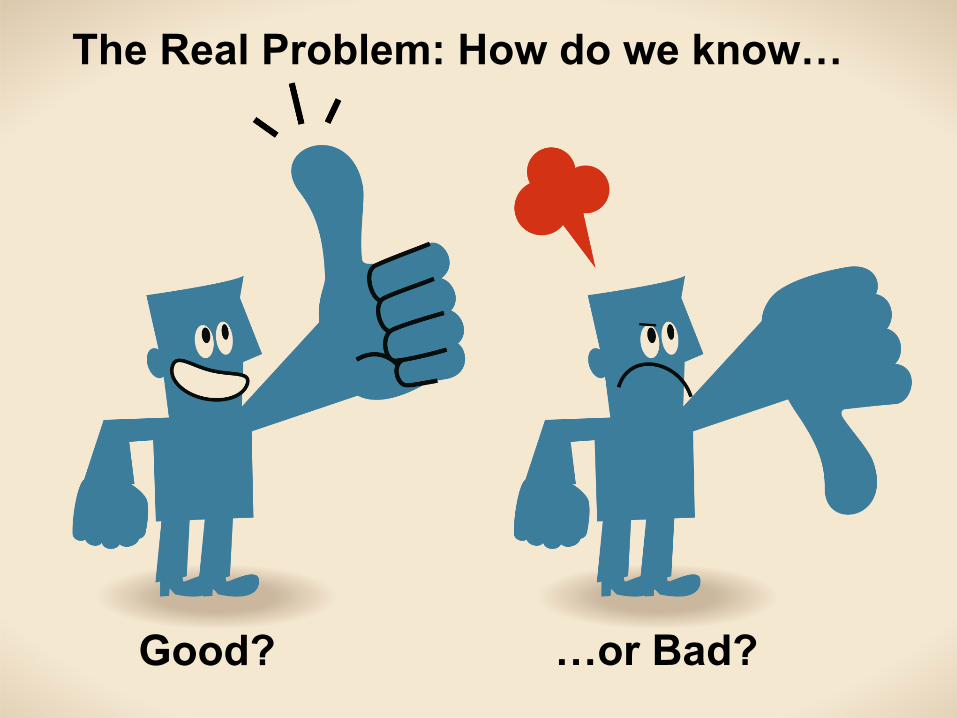
How do I know if it’s good or bad
Good? …or Bad?
The Real Problem: How do we know…
© 2012 Cloud9 Analytics, Inc. All Rights Reserved.
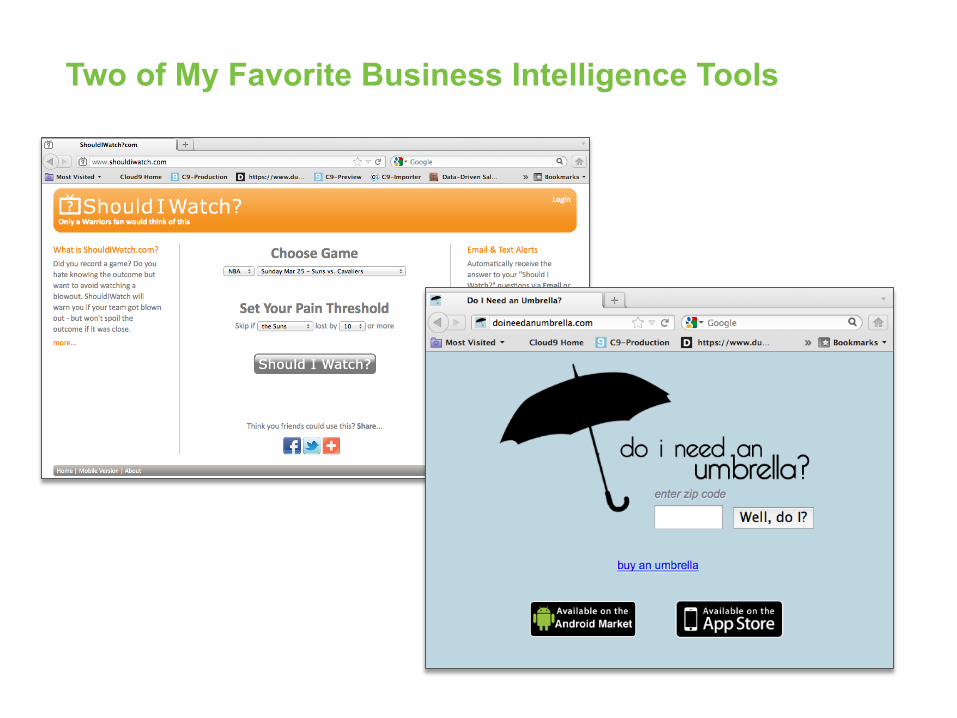
Two of My Favorite Business Intelligence Tools

© 2012 Cloud9 Analytics, Inc. All Rights Reserved.
© 2012 Cloud9 Analytics, Inc. All Rights Reserved.
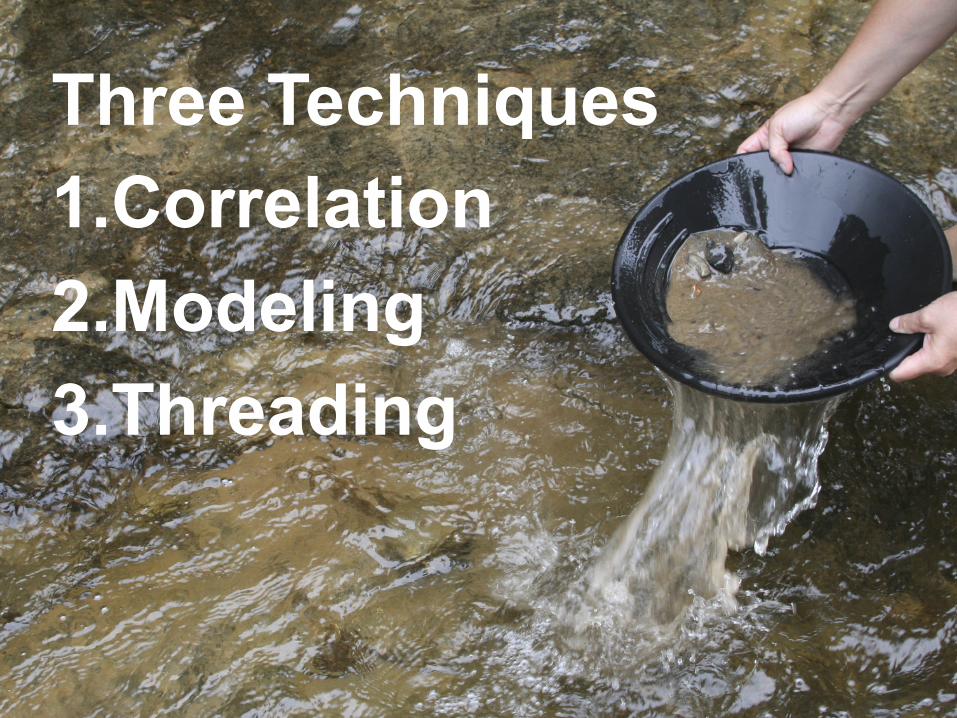
Three Techniques 1. Correlation 2. Modeling 3. Threading
© 2012 Cloud9 Analytics, Inc. All Rights Reserved.
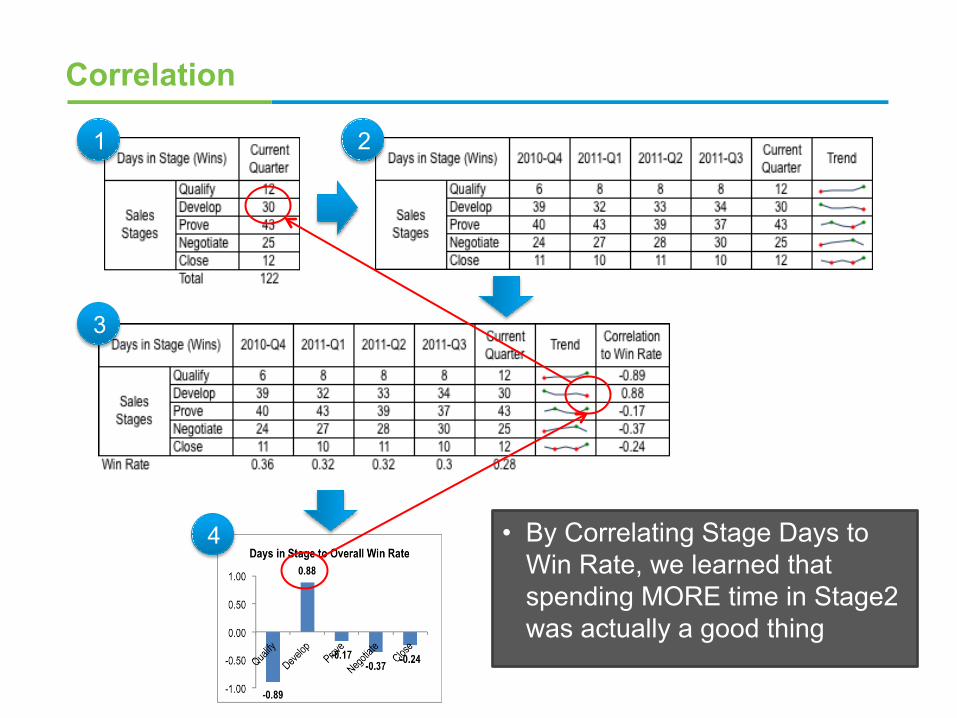
Correlation
1 2
3
4 • By Correlating Stage Days to Win Rate, we learned that spending MORE time in Stage2 was actually a good thing
© 2012 Cloud9 Analytics, Inc. All Rights Reserved.
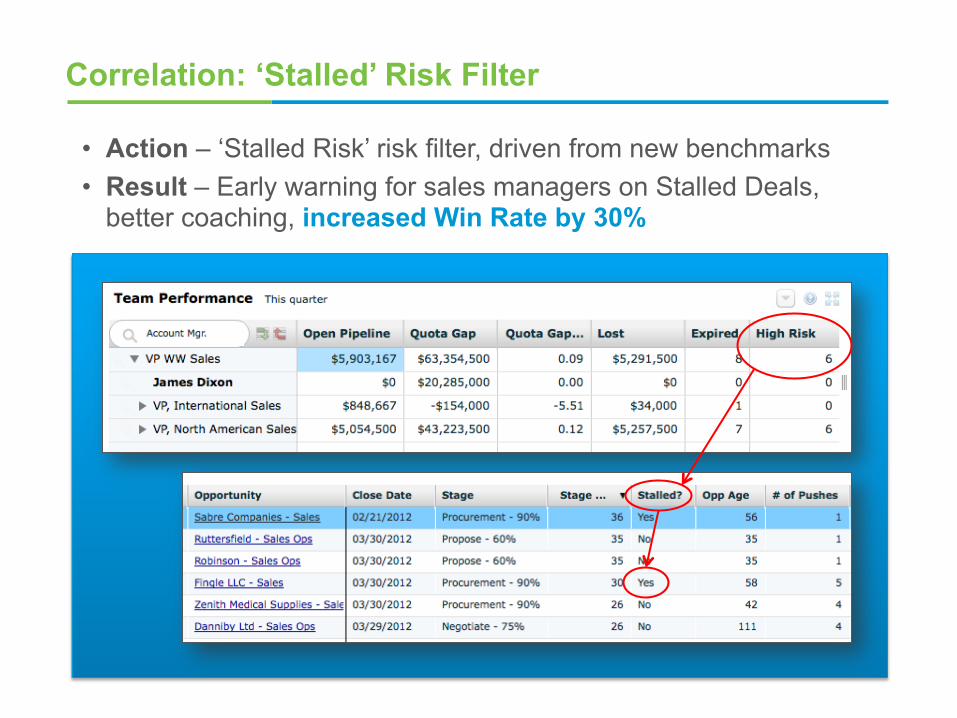
Correlation: ‘Stalled’ Risk Filter
• Action – ‘Stalled Risk’ risk filter, driven from new benchmarks • Result – Early warning for sales managers on Stalled Deals,
better coaching, increased Win Rate by 30%
© 2012 Cloud9 Analytics, Inc. All Rights Reserved.
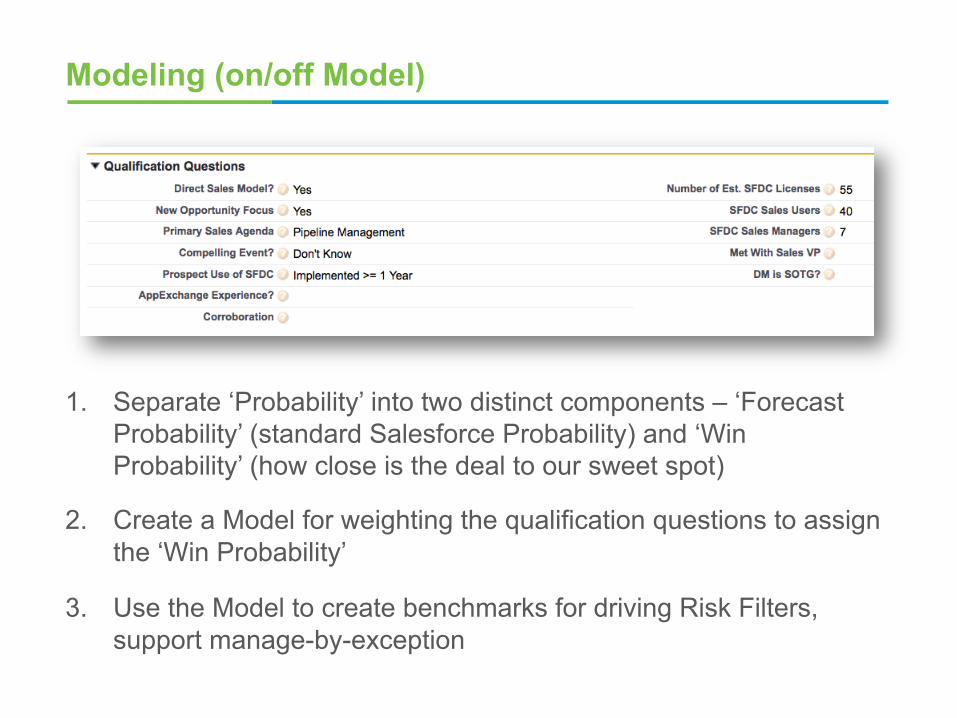
Modeling (on/off Model)
1. Separate ‘Probability’ into two distinct components – ‘Forecast Probability’ (standard Salesforce Probability) and ‘Win Probability’ (how close is the deal to our sweet spot)
2. Create a Model for weighting the qualification questions to assign the ‘Win Probability’
3. Use the Model to create benchmarks for driving Risk Filters, support manage-by-exception
© 2012 Cloud9 Analytics, Inc. All Rights Reserved.
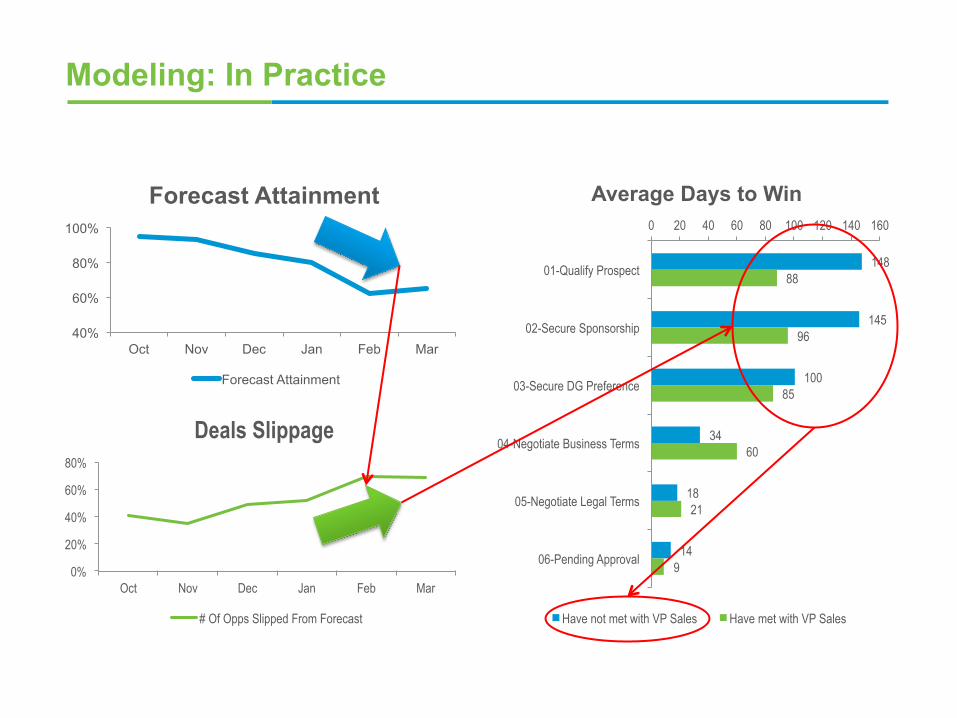
Modeling: In Practice
148
145
100
34
18
14
88
96
85
60
21
9
0 20 40 60 80 100 120 140 160
01-Qualify Prospect
02-Secure Sponsorship
03-Secure DG Preference
04-Negotiate Business Terms
05-Negotiate Legal Terms
06-Pending Approval
Average Days to Win
Have not met with VP Sales Have met with VP Sales
40%
60%
80%
100%
Oct Nov Dec Jan Feb Mar
Forecast Attainment
Forecast Attainment
0%
20%
40%
60%
80%
Oct Nov Dec Jan Feb Mar
Deals Slippage
# Of Opps Slipped From Forecast
© 2012 Cloud9 Analytics, Inc. All Rights Reserved.
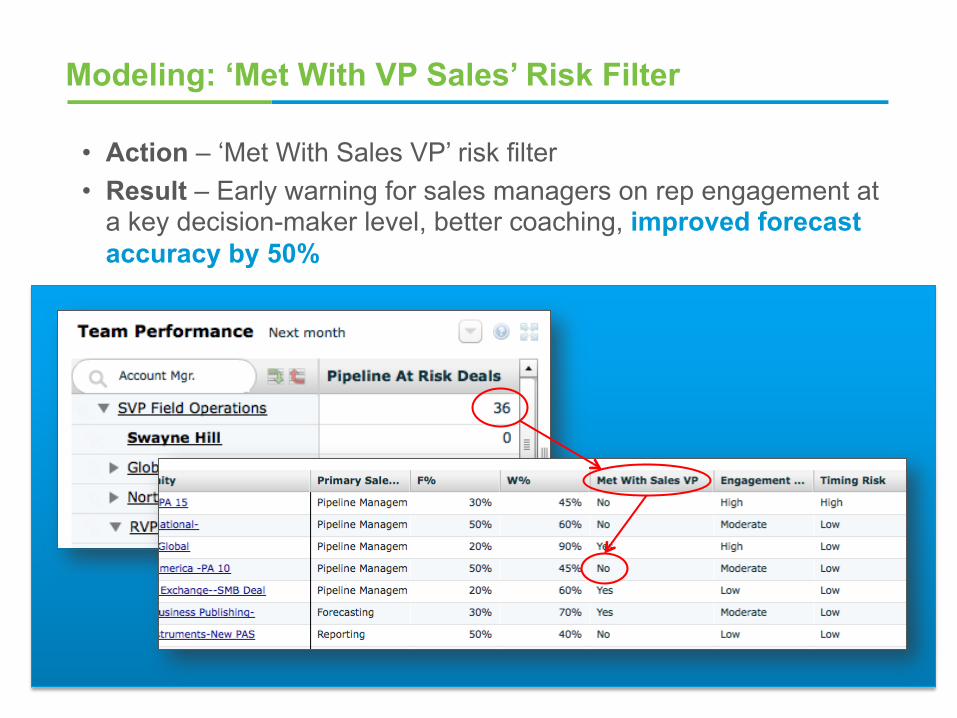
Modeling: ‘Met With VP Sales’ Risk Filter
• Action – ‘Met With Sales VP’ risk filter • Result – Early warning for sales managers on rep engagement at
a key decision-maker level, better coaching, improved forecast accuracy by 50%
© 2012 Cloud9 Analytics, Inc. All Rights Reserved.
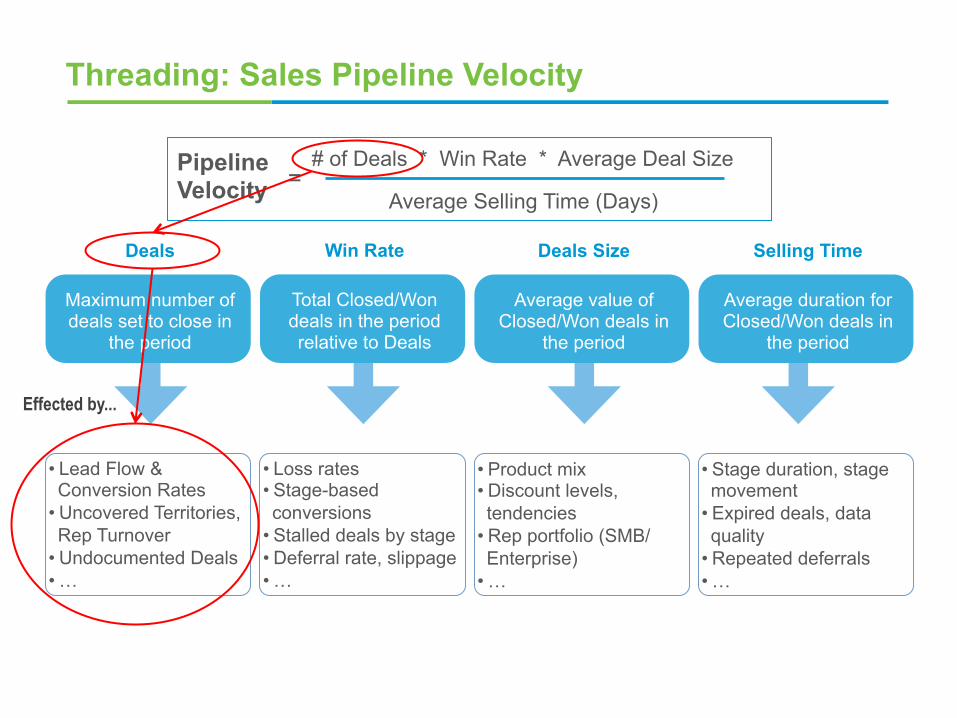
Threading: Sales Pipeline Velocity
Deals
Maximum number of deals set to close in
the period
• Lead Flow & Conversion Rates
• Uncovered Territories, Rep Turnover
• Undocumented Deals • …
Effected by...
Win Rate
Total Closed/Won deals in the period relative to Deals
• Loss rates • Stage-based conversions
• Stalled deals by stage • Deferral rate, slippage • …
Deals Size
Average value of Closed/Won deals in
the period
• Product mix • Discount levels, tendencies
• Rep portfolio (SMB/Enterprise)
• …
Selling Time
Average duration for Closed/Won deals in
the period
• Stage duration, stage movement
• Expired deals, data quality
• Repeated deferrals • …
# of Deals * Win Rate * Average Deal Size
Average Selling Time (Days)
Pipeline Velocity =
© 2012 Cloud9 Analytics, Inc. All Rights Reserved.
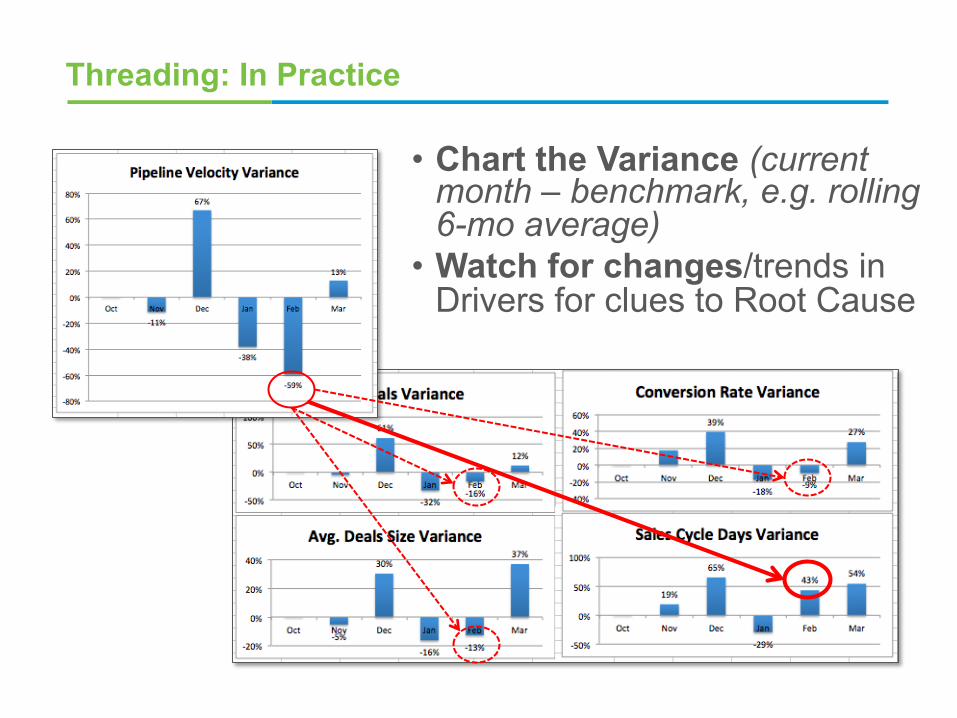
Threading: In Practice
• Chart the Variance (current month – benchmark, e.g. rolling 6-mo average)
• Watch for changes/trends in Drivers for clues to Root Cause
© 2012 Cloud9 Analytics, Inc. All Rights Reserved.
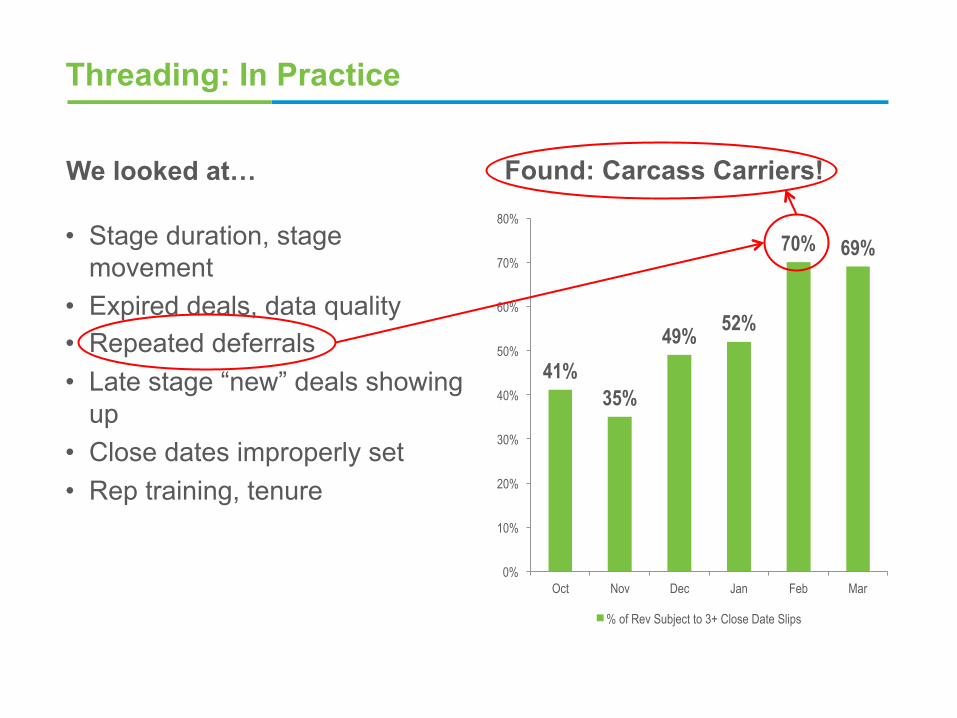
Threading: In Practice
• Stage duration, stage movement
• Expired deals, data quality • Repeated deferrals • Late stage “new” deals showing
up • Close dates improperly set • Rep training, tenure
41% 35%
49% 52%
70% 69%
0%
10%
20%
30%
40%
50%
60%
70%
80%
Oct Nov Dec Jan Feb Mar
% of Rev Subject to 3+ Close Date Slips
We looked at… Found: Carcass Carriers!
© 2012 Cloud9 Analytics, Inc. All Rights Reserved.
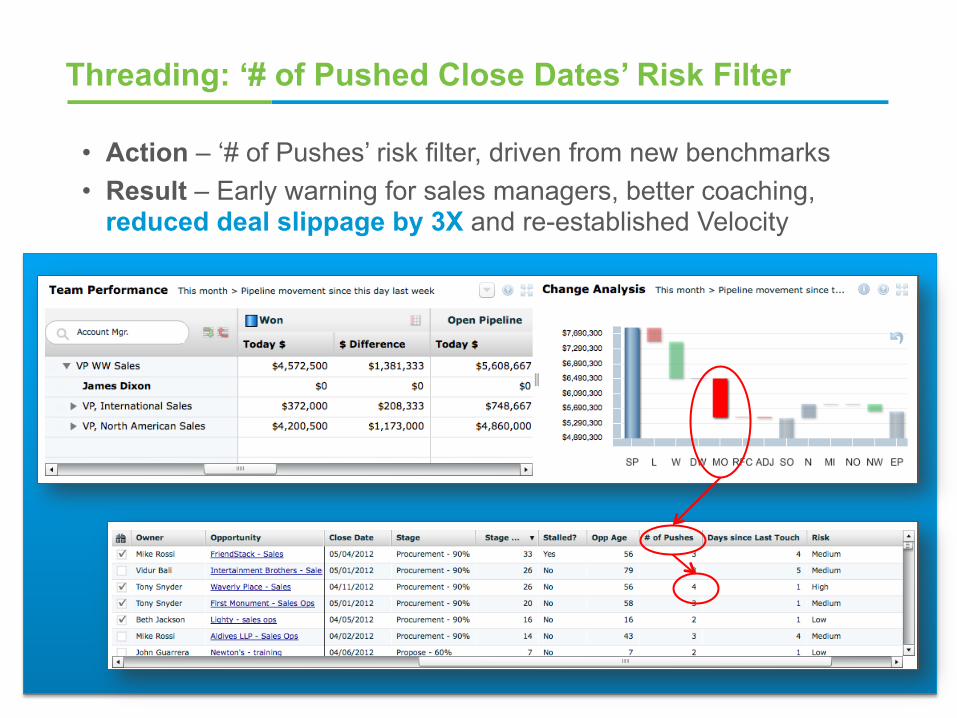
Threading: ‘# of Pushed Close Dates’ Risk Filter
• Action – ‘# of Pushes’ risk filter, driven from new benchmarks • Result – Early warning for sales managers, better coaching,
reduced deal slippage by 3X and re-established Velocity
© 2012 Cloud9 Analytics, Inc. All Rights Reserved.
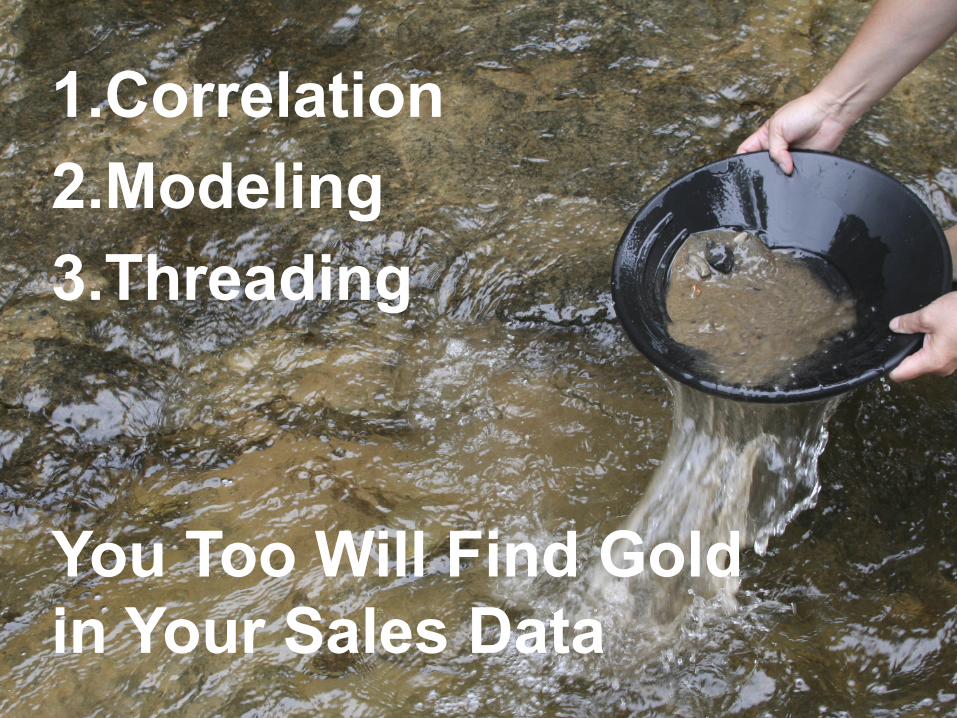
1. Correlation 2. Modeling 3. Threading
You Too Will Find Gold in Your Sales Data
© 2012 Cloud9 Analytics, Inc. All Rights Reserved.
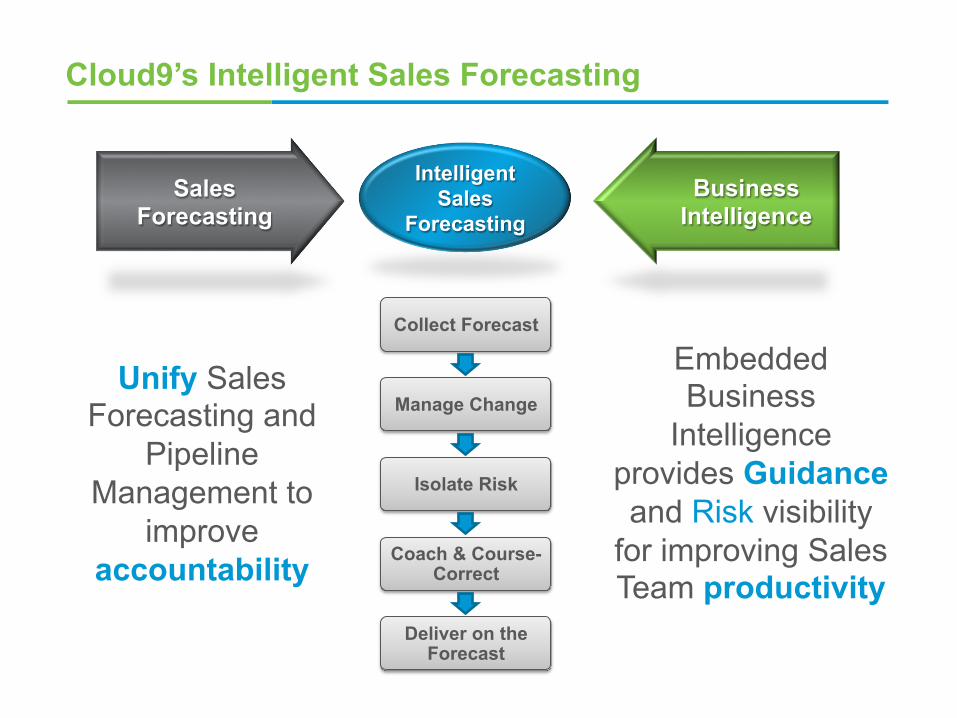
Cloud9’s Intelligent Sales Forecasting
Sales Forecasting
Business Intelligence
Intelligent Sales
Forecasting
Collect Forecast
Manage Change
Isolate Risk
Coach & Course-Correct
Deliver on the Forecast
Unify Sales Forecasting and
Pipeline Management to
improve accountability
Embedded Business
Intelligence provides Guidance and Risk visibility
for improving Sales Team productivity
© 2012 Cloud9 Analytics, Inc. All Rights Reserved.
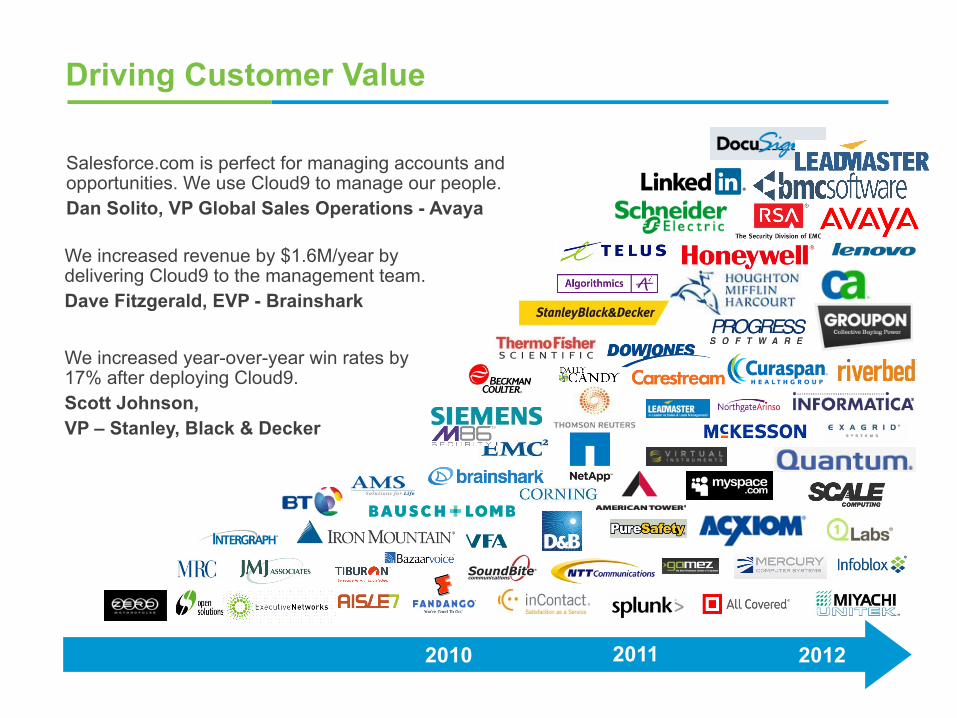
Driving Customer Value
2010 2011
We increased revenue by $1.6M/year by delivering Cloud9 to the management team. Dave Fitzgerald, EVP - Brainshark
Salesforce.com is perfect for managing accounts and opportunities. We use Cloud9 to manage our people. Dan Solito, VP Global Sales Operations - Avaya
We increased year-over-year win rates by 17% after deploying Cloud9. Scott Johnson, VP – Stanley, Black & Decker
2012

© 2012 Cloud9 Analytics, Inc. All Rights Reserved.
© 2012 Cloud9 Analytics, Inc. All Rights Reserved.
Intelligent Sales Forecasting
Treasure Hunting in Your Salesforce Data Swayne Hill Co-Founder & Senior VP, Cloud9