Embed Size (px)
DESCRIPTION
Apresentação do Comscore sobre o mercado digital brasileiro, mostrando o seu crescimento e apontando tendências para 2012.
Citation preview
Key Insights from 2011 and What They Mean for the Coming Year
2012 Brazil Digital Future in Focus
Alexander Banks March 2012
Managing Director, Brazil
2© comScore, Inc. Proprietary.
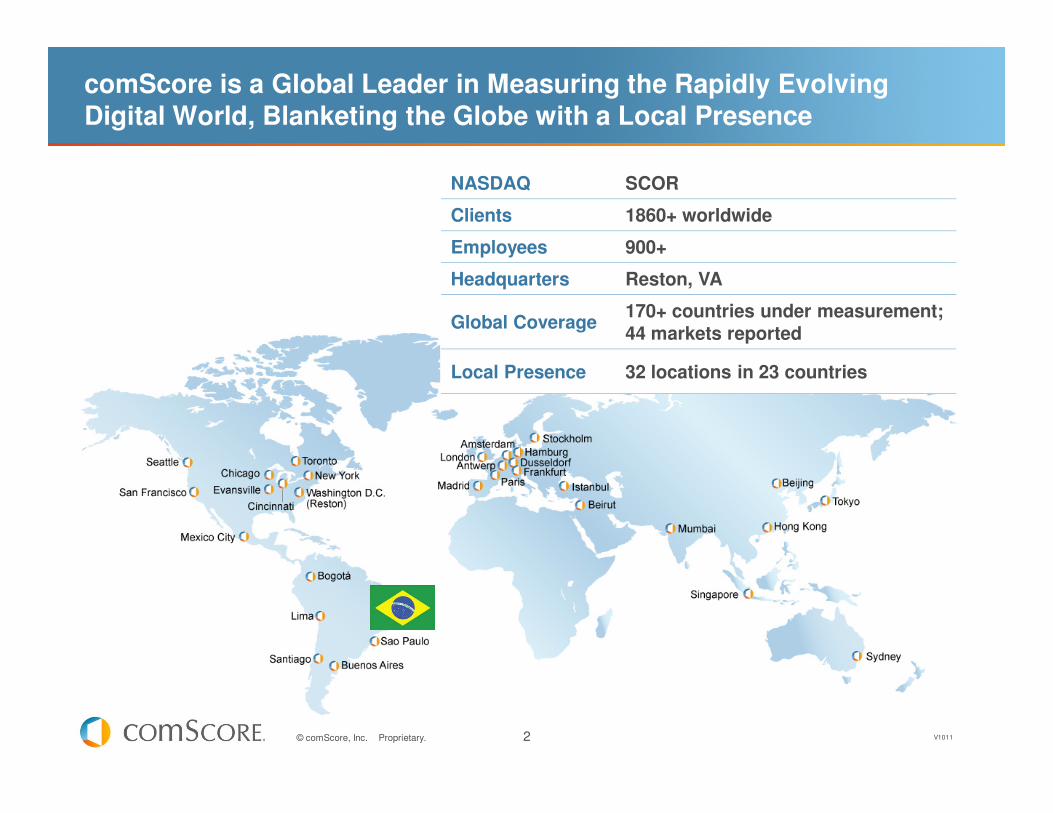
NASDAQ SCOR
Clients 1860+ worldwide
Employees 900+
Headquarters Reston, VA
Global Coverage170+ countries under measurement;44 markets reported
Local Presence 32 locations in 23 countries
comScore is a Global Leader in Measuring the Rapidly Evolving Digital World, Blanketing the Globe with a Local Presence
V1011
3© comScore, Inc. Proprietary.
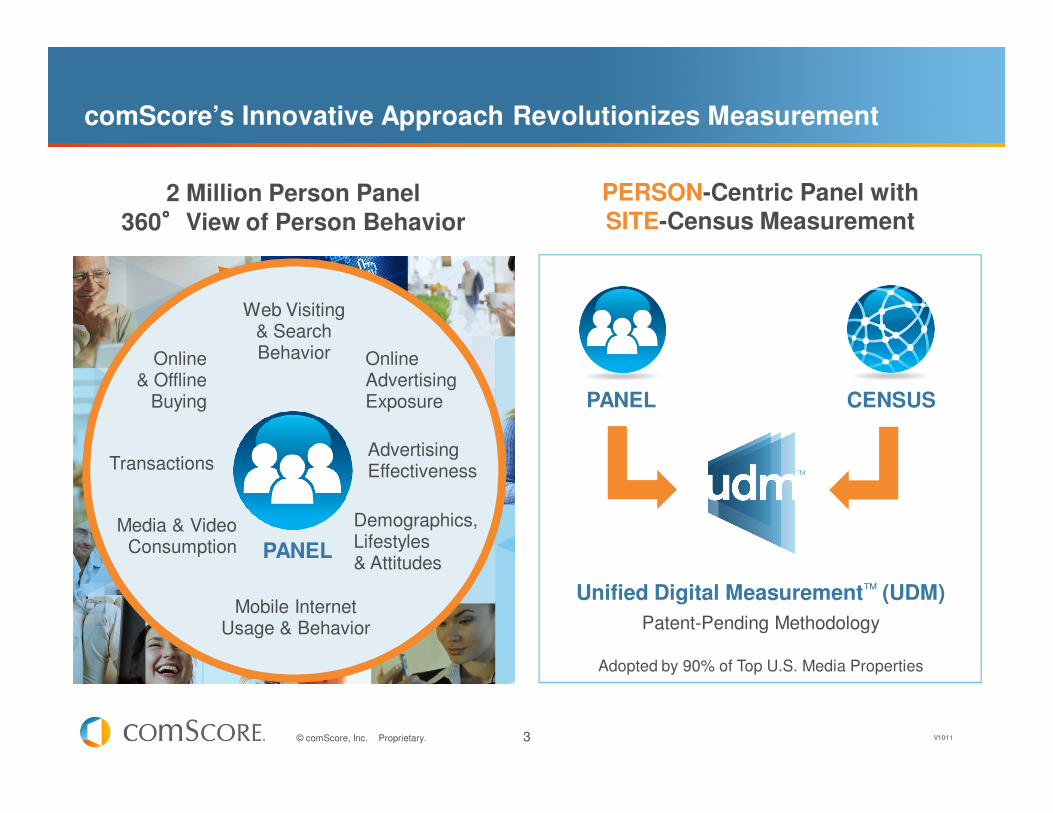
comScore’s Innovative Approach Revolutionizes Measurement
2 Million Person Panel 360㼻㼻㼻㼻View of Person Behavior
CENSUS
Unified Digital Measurement™ (UDM)
Patent-Pending Methodology
Adopted by 90% of Top U.S. Media Properties
PANEL
PERSON-Centric Panel with SITE-Census Measurement
Web Visiting & Search Behavior Online
AdvertisingExposure
AdvertisingEffectiveness
Demographics,Lifestyles& Attitudes
Media & VideoConsumption
Transactions
Online& Offline
Buying
Mobile InternetUsage & Behavior
PANEL
V1011
4© comScore, Inc. Proprietary.
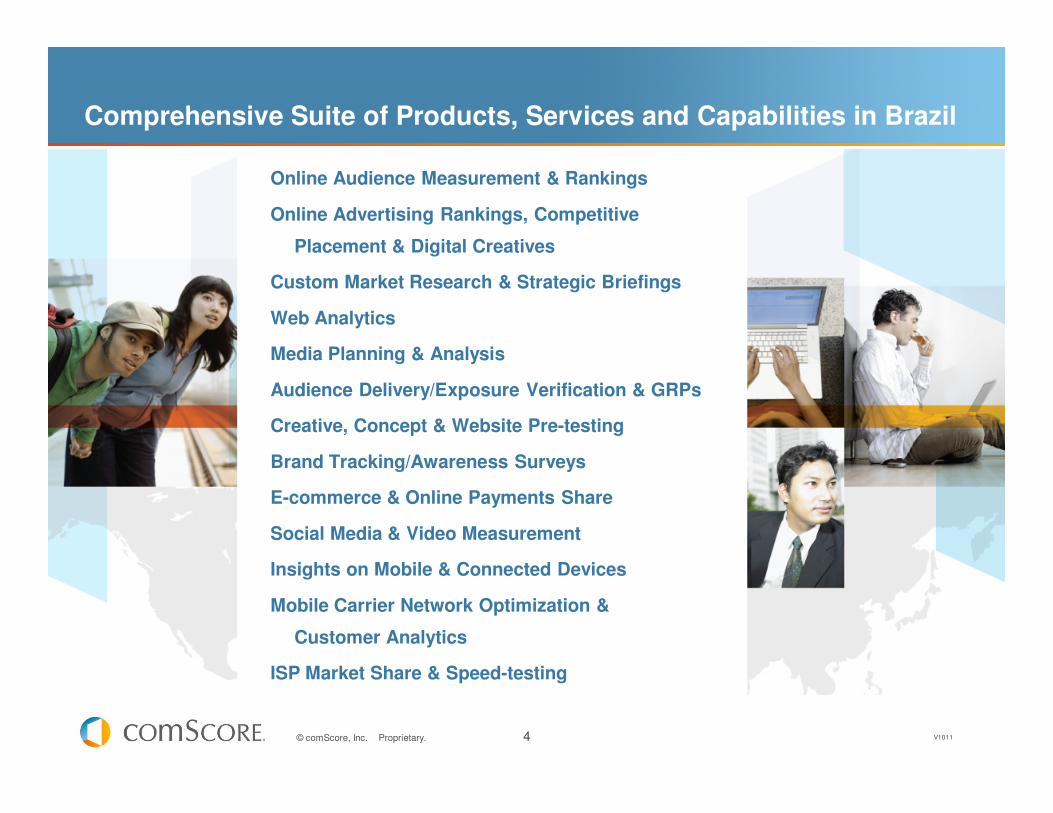
Comprehensive Suite of Products, Services and Capabilities in Brazil
Online Audience Measurement & Rankings
Online Advertising Rankings, Competitive
Placement & Digital Creatives
Custom Market Research & Strategic Briefings
Web Analytics
Media Planning & Analysis
Audience Delivery/Exposure Verification & GRPs
Creative, Concept & Website Pre-testing
Brand Tracking/Awareness Surveys
E-commerce & Online Payments Share
Social Media & Video Measurement
Insights on Mobile & Connected Devices
Mobile Carrier Network Optimization &
Customer Analytics
ISP Market Share & Speed-testing
V1011
5© comScore, Inc. Proprietary.
THE GROWING AND SHIFTING DIGITAL LANDSCAPE IN BRAZIL AND AROUND THE WORLD
6© comScore, Inc. Proprietary.
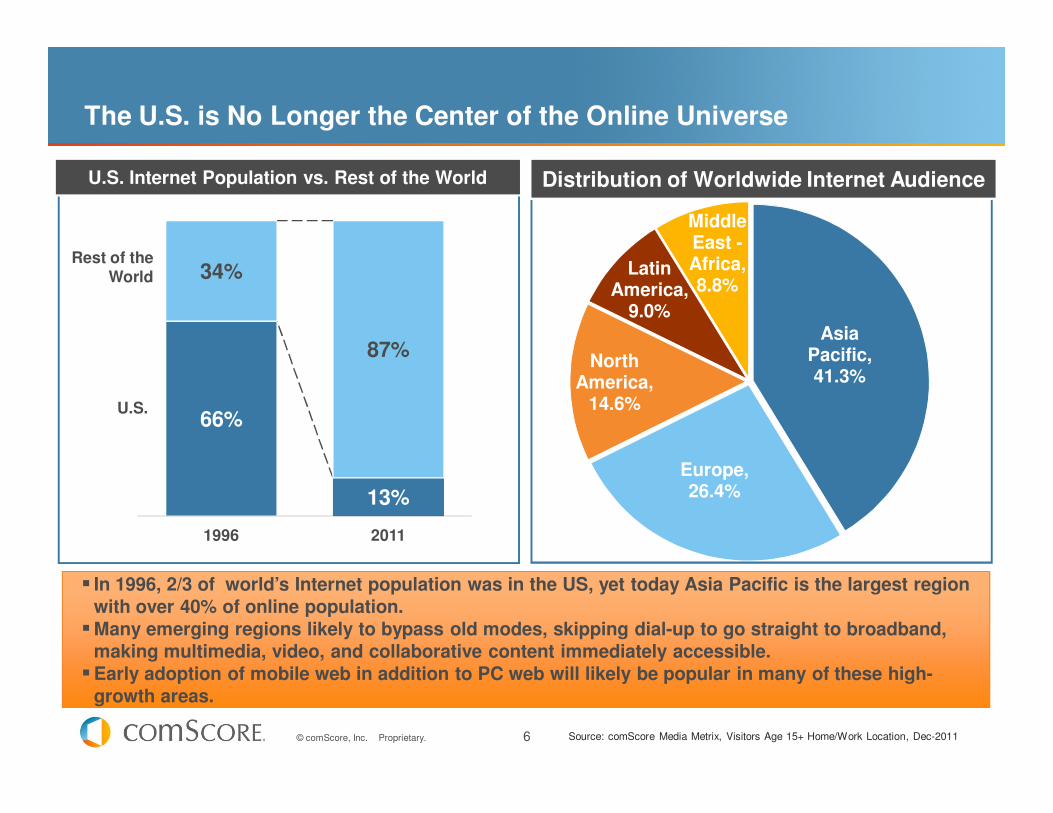
In 1996, 2/3 of world’s Internet population was in the US, yet today Asia Pacific is the largest region with over 40% of online population.
Many emerging regions likely to bypass old modes, skipping dial-up to go straight to broadband, making multimedia, video, and collaborative content immediately accessible.
Early adoption of mobile web in addition to PC web will likely be popular in many of these high-growth areas.
Asia Pacific
Distribution of Worldwide Internet Audience
66%
13%
34%
87%
1996 2011
U.S. Internet Population vs. Rest of the World
Rest of the World
U.S.
Source: comScore Media Metrix, Visitors Age 15+ Home/Work Location, Dec-2011
Asia Pacific, 41.3%
Europe, 26.4%
North America,
14.6%
Latin America,
9.0%
Middle East -Africa, 8.8%
The U.S. is No Longer the Center of the Online Universe
7© comScore, Inc. Proprietary.
595
381210
129 126
534361
203112 111
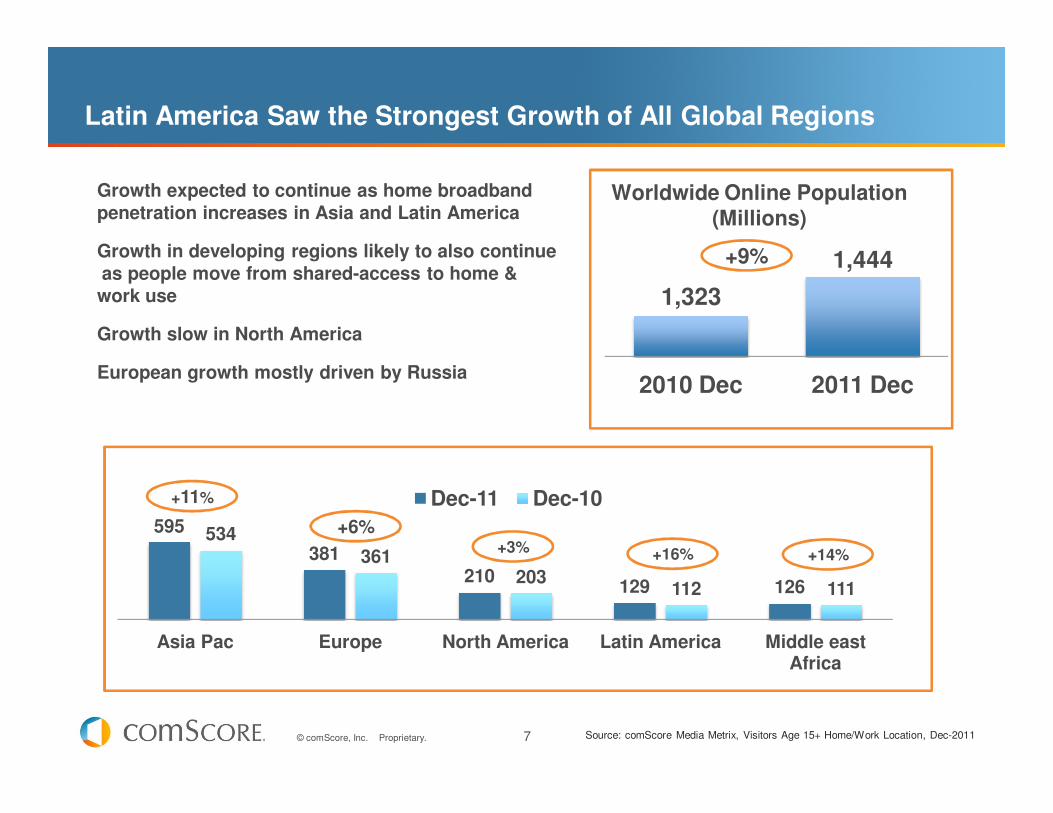
Asia Pac Europe North America Latin America Middle east Africa
Dec-11 Dec-10
Latin America Saw the Strongest Growth of All Global Regions
Growth expected to continue as home broadband penetration increases in Asia and Latin America
Growth in developing regions likely to also continueas people move from shared-access to home & work use
Growth slow in North America
European growth mostly driven by Russia
+11%
+3%+6%
+16% +14%
Worldwide Online Population(Millions)
Source: comScore Media Metrix, Visitors Age 15+ Home/Work Location, Dec-2011
1,323
1,444
2010 Dec 2011 Dec
+9%
8© comScore, Inc. Proprietary.
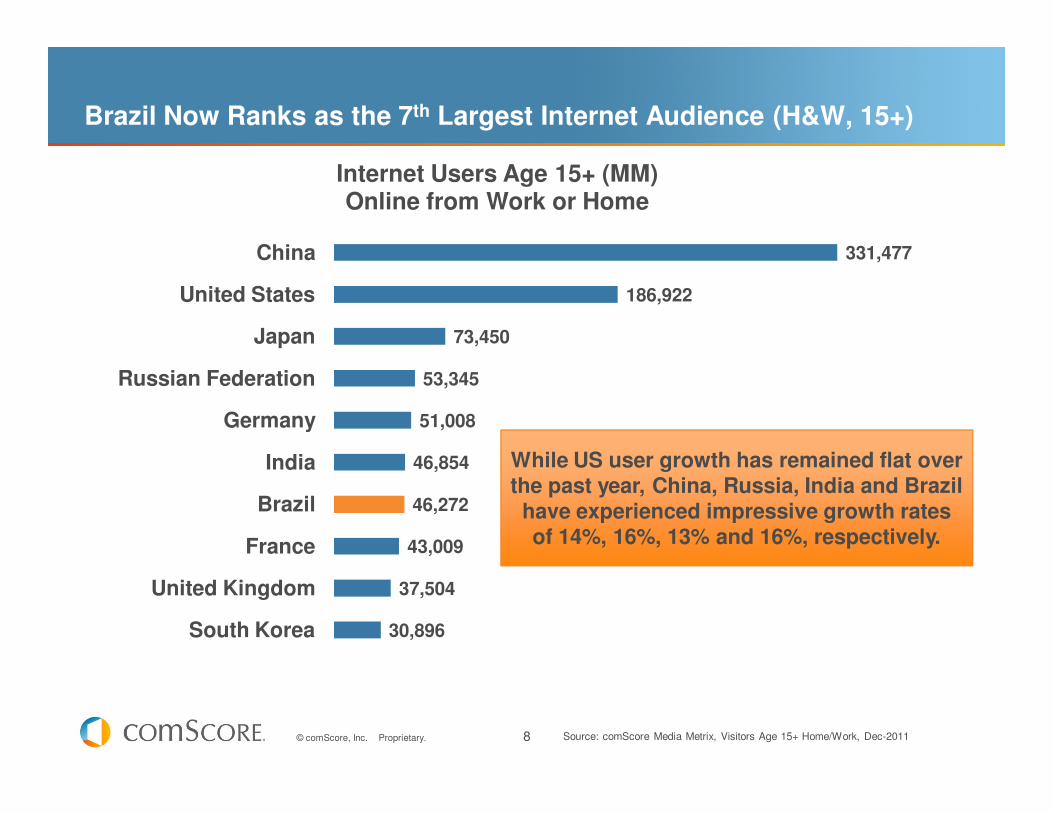
Brazil Now Ranks as the 7th Largest Internet Audience (H&W, 15+)
Source: comScore Media Metrix, Visitors Age 15+ Home/Work, Dec-2011
331,477
186,922
73,450
53,345
51,008
46,854
46,272
43,009
37,504
30,896
China
United States
Japan
Russian Federation
Germany
India
Brazil
France
United Kingdom
South Korea
Internet Users Age 15+ (MM)Online from Work or Home
While US user growth has remained flat over the past year, China, Russia, India and Brazil have experienced impressive growth rates of 14%, 16%, 13% and 16%, respectively.
9© comScore, Inc. Proprietary.
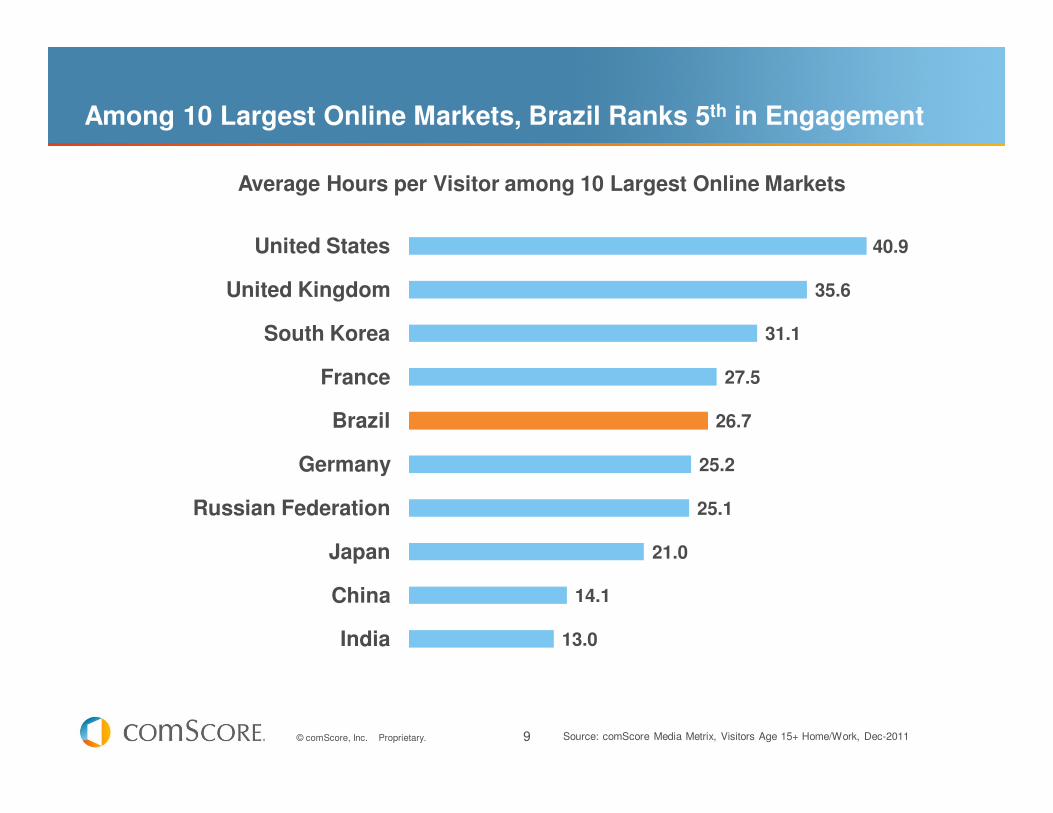
Among 10 Largest Online Markets, Brazil Ranks 5th in Engagement
Source: comScore Media Metrix, Visitors Age 15+ Home/Work, Dec-2011
40.9
35.6
31.1
27.5
26.7
25.2
25.1
21.0
14.1
13.0
United States
United Kingdom
South Korea
France
Brazil
Germany
Russian Federation
Japan
China
India
Average Hours per Visitor among 10 Largest Online Markets
10© comScore, Inc. Proprietary.
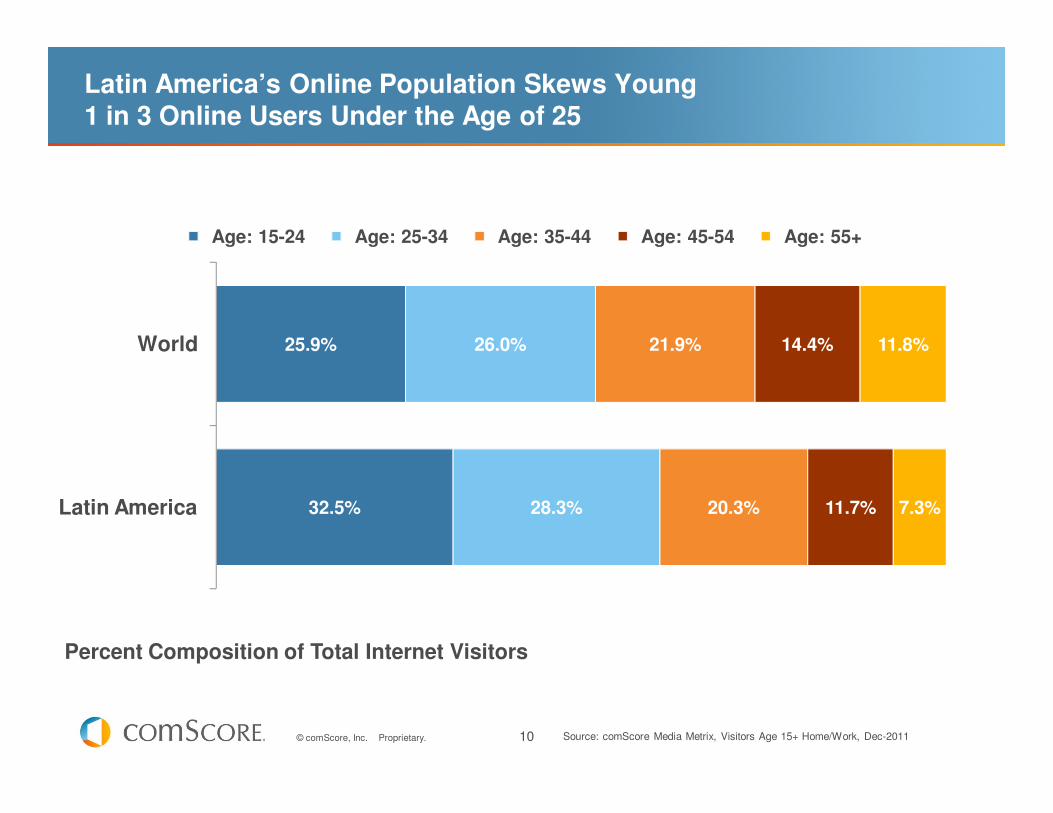
Percent Composition of Total Internet Visitors
25.9%
32.5%
26.0%
28.3%
21.9%
20.3%
14.4%
11.7%
11.8%
7.3%
World
Latin America
Age: 15-24 Age: 25-34 Age: 35-44 Age: 45-54 Age: 55+
Latin America’s Online Population Skews Young1 in 3 Online Users Under the Age of 25
Source: comScore Media Metrix, Visitors Age 15+ Home/Work, Dec-2011
11© comScore, Inc. Proprietary.
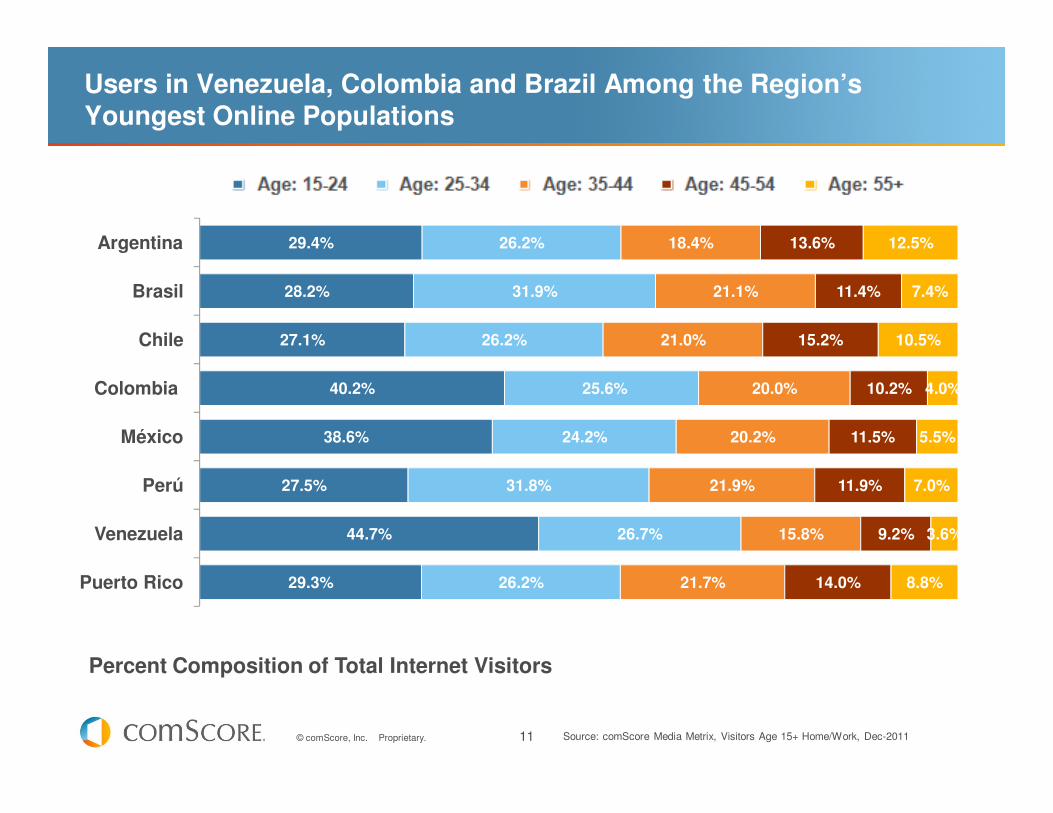
Percent Composition of Total Internet Visitors
29.4%
28.2%
27.1%
40.2%
38.6%
27.5%
44.7%
29.3%
26.2%
31.9%
26.2%
25.6%
24.2%
31.8%
26.7%
26.2%
18.4%
21.1%
21.0%
20.0%
20.2%
21.9%
15.8%
21.7%
13.6%
11.4%
15.2%
10.2%
11.5%
11.9%
9.2%
14.0%
12.5%
7.4%
10.5%
4.0%
5.5%
7.0%
3.6%
8.8%
Argentina
Brasil
Chile
Colombia
México
Perú
Venezuela
Puerto Rico
Users in Venezuela, Colombia and Brazil Among the Region’s Youngest Online Populations
Source: comScore Media Metrix, Visitors Age 15+ Home/Work, Dec-2011
12© comScore, Inc. Proprietary.
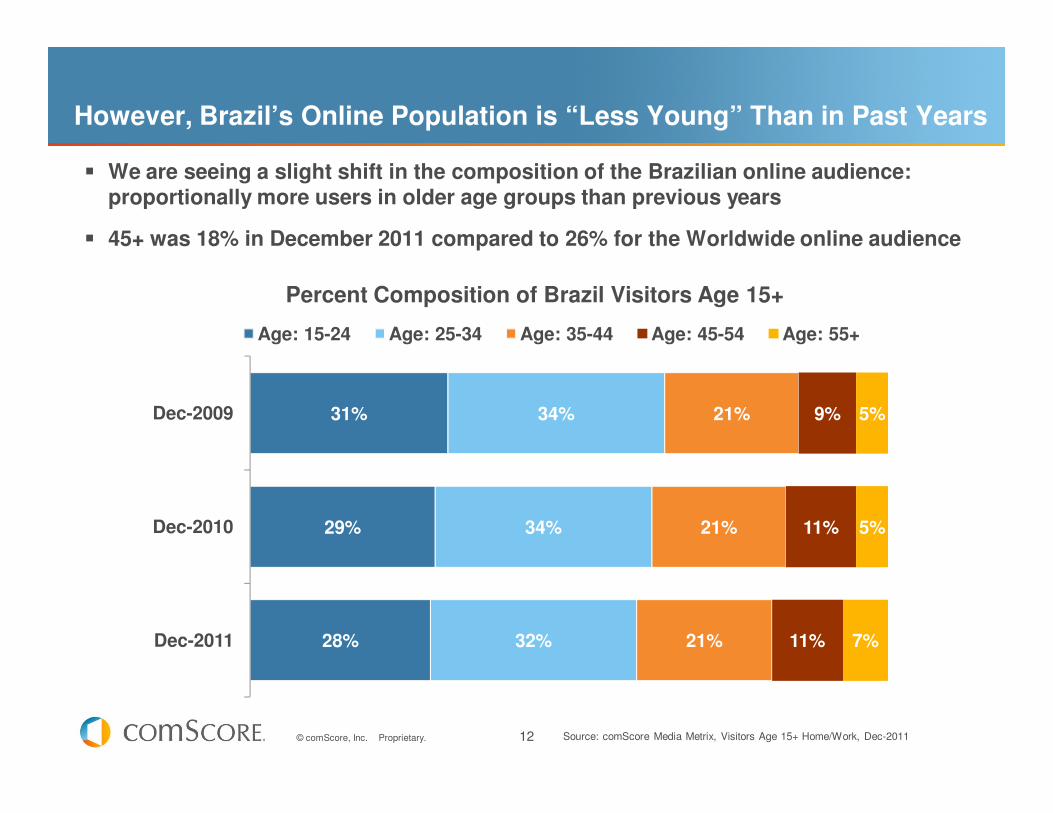
However, Brazil’s Online Population is “Less Young” Than in Past Years
We are seeing a slight shift in the composition of the Brazilian online audience: proportionally more users in older age groups than previous years
45+ was 18% in December 2011 compared to 26% for the Worldwide online audience
Source: comScore Media Metrix, Visitors Age 15+ Home/Work, Dec-2011
31%
29%
28%
34%
34%
32%
21%
21%
21%
9%
11%
11%
5%
5%
7%
Dec-2009
Dec-2010
Dec-2011
Percent Composition of Brazil Visitors Age 15+
Age: 15-24 Age: 25-34 Age: 35-44 Age: 45-54 Age: 55+
13© comScore, Inc. Proprietary.
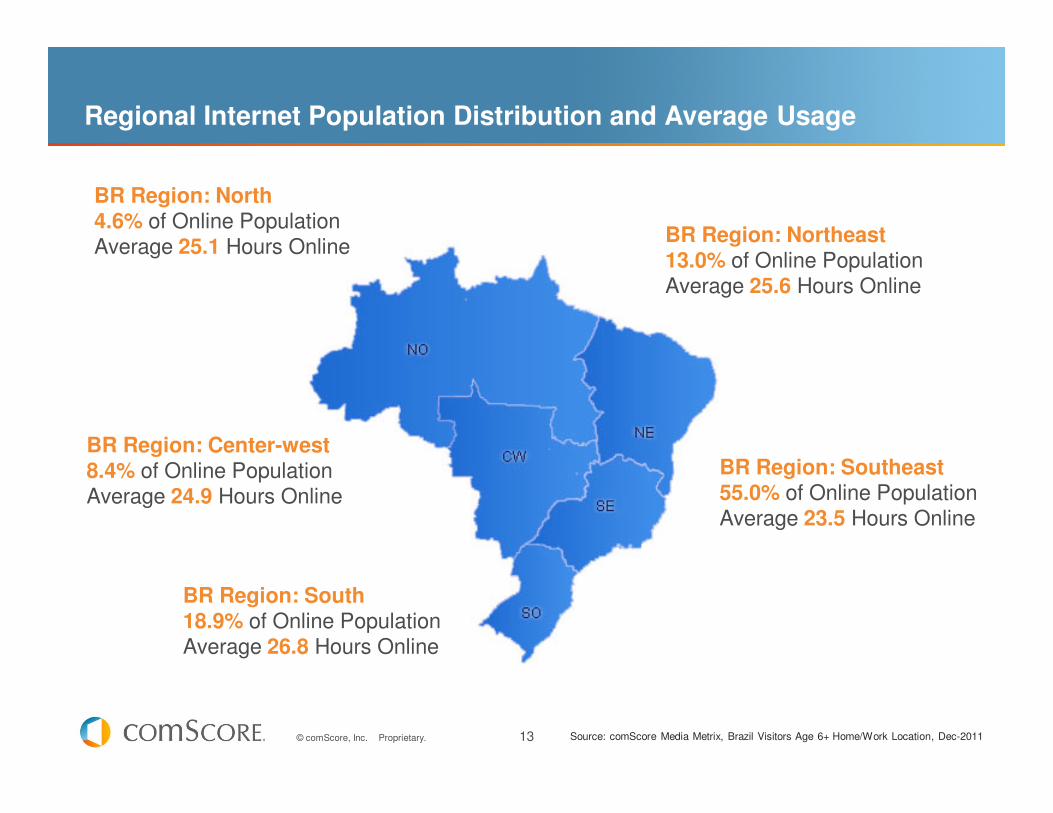
Regional Internet Population Distribution and Average Usage
BR Region: Southeast68% of Online PopulationAverage 23.7 hours online
BR Region: Northeast11% of Online PopulationAverage 26.3 hours online
BR Region: South13% of Online PopulationAverage 25.9 hours online
BR Region: Center-west6% of Online PopulationAverage 23.9 hours online
BR Region: North2% of Online PopulationAverage 22.3 hours online
BR Region: North4.6% of Online Population Average 25.1 Hours Online
BR Region: Northeast 13.0% of Online Population Average 25.6 Hours Online
BR Region: Southeast 55.0% of Online Population Average 23.5 Hours Online
BR Region: Center-west 8.4% of Online Population Average 24.9 Hours Online
BR Region: South 18.9% of Online Population Average 26.8 Hours Online
Source: comScore Media Metrix, Brazil Visitors Age 6+ Home/Work Location, Dec-2011
14© comScore, Inc. Proprietary.
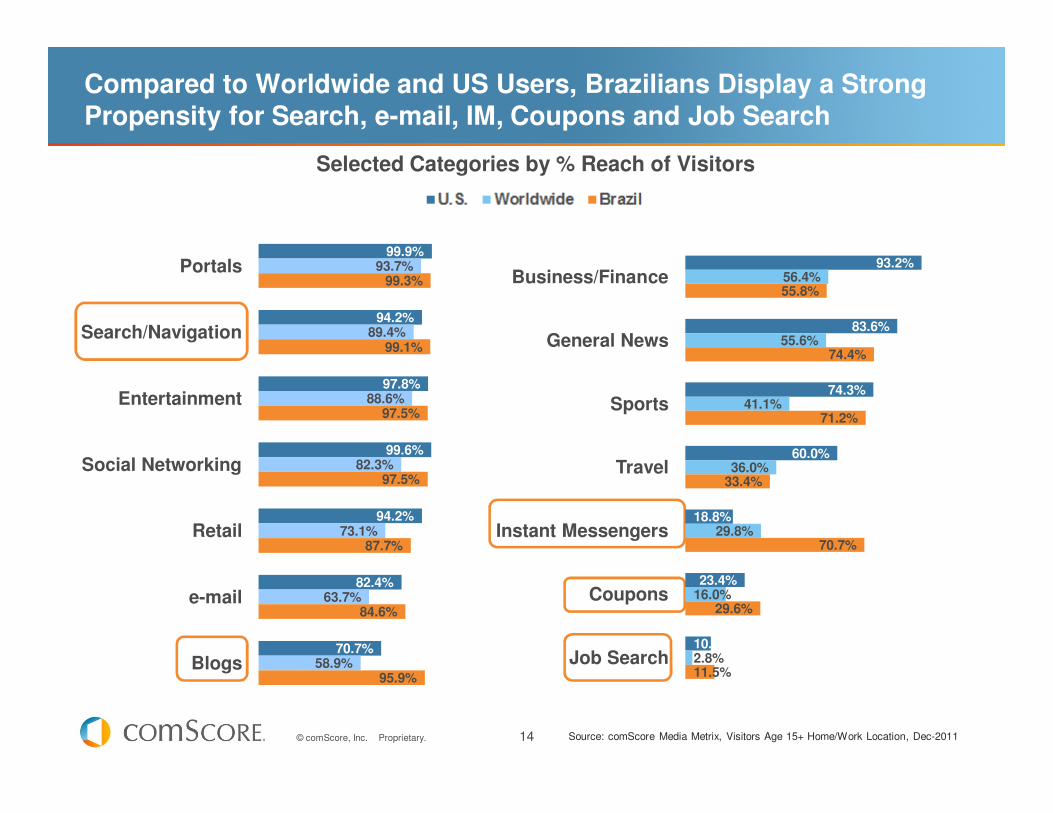
Compared to Worldwide and US Users, Brazilians Display a Strong Propensity for Search, e-mail, IM, Coupons and Job Search
Selected Categories by % Reach of Visitors
Source: comScore Media Metrix, Visitors Age 15+ Home/Work Location, Dec-2011
99.9%
94.2%
97.8%
99.6%
94.2%
82.4%
70.7%
93.7%
89.4%
88.6%
82.3%
73.1%
63.7%
58.9%
99.3%
99.1%
97.5%
97.5%
87.7%
84.6%
95.9%
Portals
Search/Navigation
Entertainment
Social Networking
Retail
Blogs
93.2%
83.6%
74.3%
60.0%
18.8%
23.4%
10.1%
56.4%
55.6%
41.1%
36.0%
29.8%
16.0%
2.8%
55.8%
74.4%
71.2%
33.4%
70.7%
29.6%
11.5%
Business/Finance
General News
Sports
Travel
Instant Messengers
Coupons
Job Search
15© comScore, Inc. Proprietary.
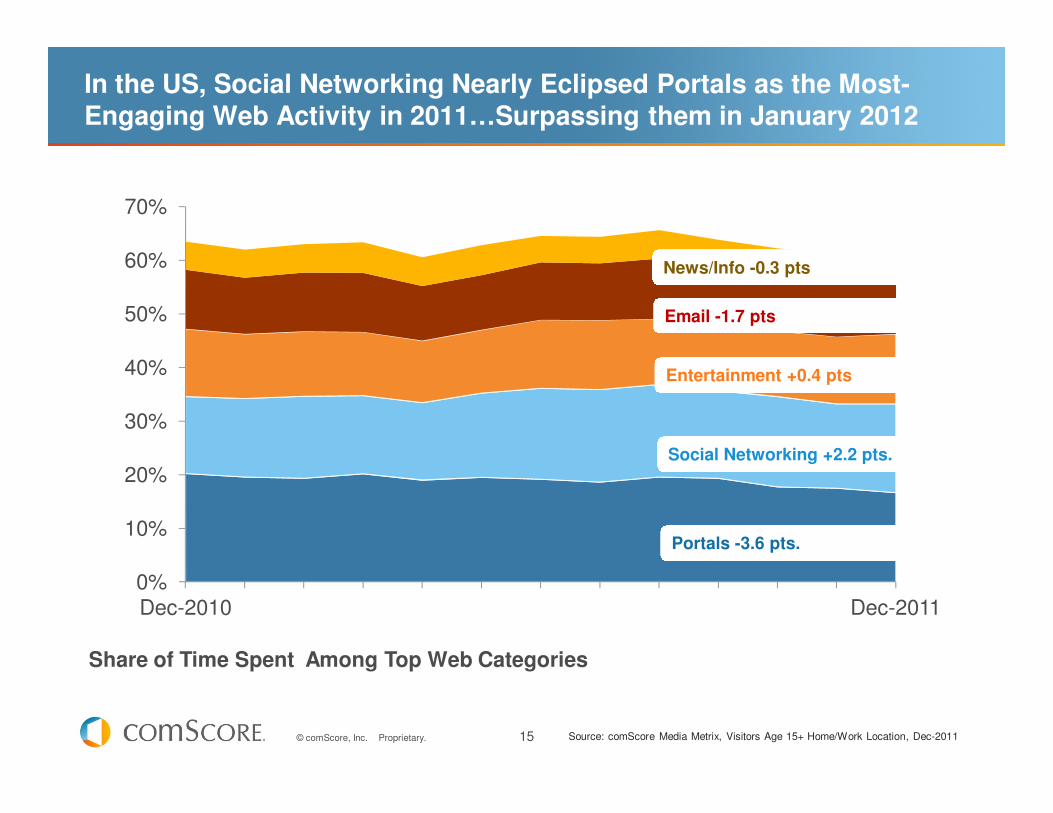
Share of Time Spent Among Top Web Categories
0%
10%
20%
30%
40%
50%
60%
70%
Dec-2010 Dec-2011
Portals -3.6 pts.
Entertainment +0.4 pts
Email -1.7 pts
News/Info -0.3 pts
Social Networking +2.2 pts.
In the US, Social Networking Nearly Eclipsed Portals as the Most-Engaging Web Activity in 2011…Surpassing them in January 2012
Source: comScore Media Metrix, Visitors Age 15+ Home/Work Location, Dec-2011
16© comScore, Inc. Proprietary.
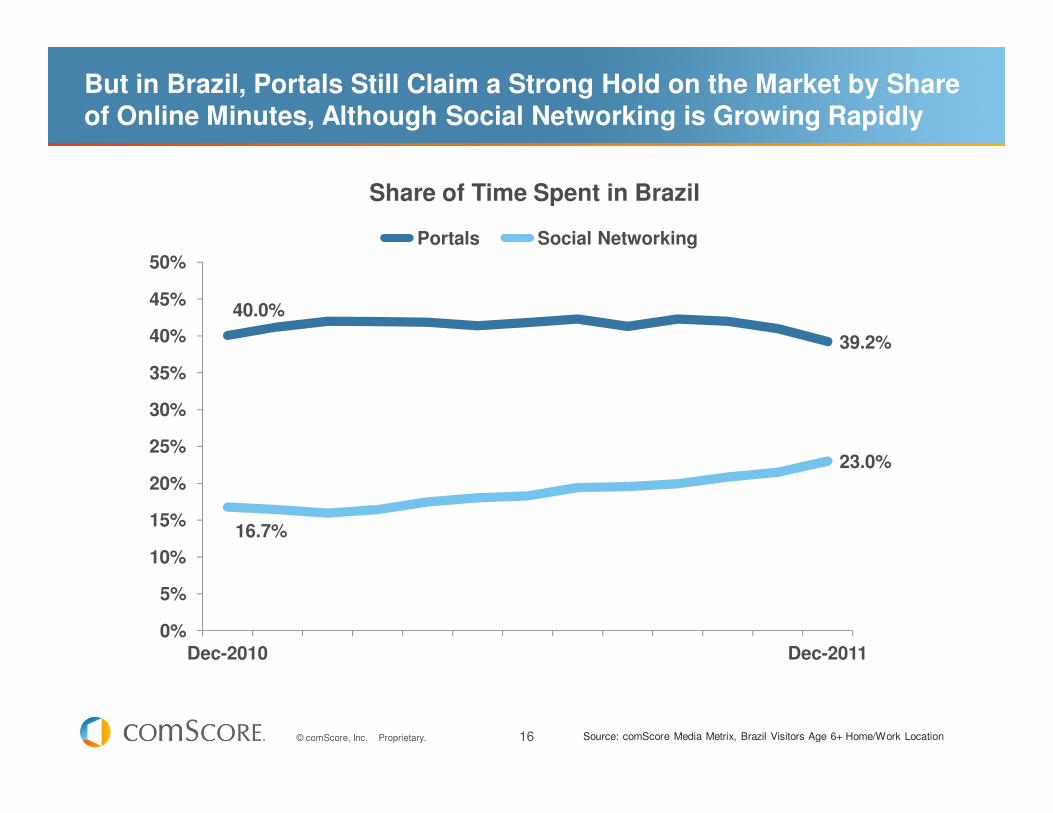
But in Brazil, Portals Still Claim a Strong Hold on the Market by Share of Online Minutes, Although Social Networking is Growing Rapidly
40.0%
39.2%
16.7%
23.0%
0%
5%
10%
15%
20%
25%
30%
35%
40%
45%
50%
Dec-2010 Dec-2011
Share of Time Spent in Brazil
Portals Social Networking
Source: comScore Media Metrix, Brazil Visitors Age 6+ Home/Work Location
17© comScore, Inc. Proprietary.
SOCIAL MEDIA IS REDEFINING COMMUNICATION IN THE DIGITAL AND PHYSICAL WORLDS
18© comScore, Inc. Proprietary.
0
200
400
600
800
1,000
1,200
1,400
1,600
2007 2008 2009 2010 2011
+174%
+88%
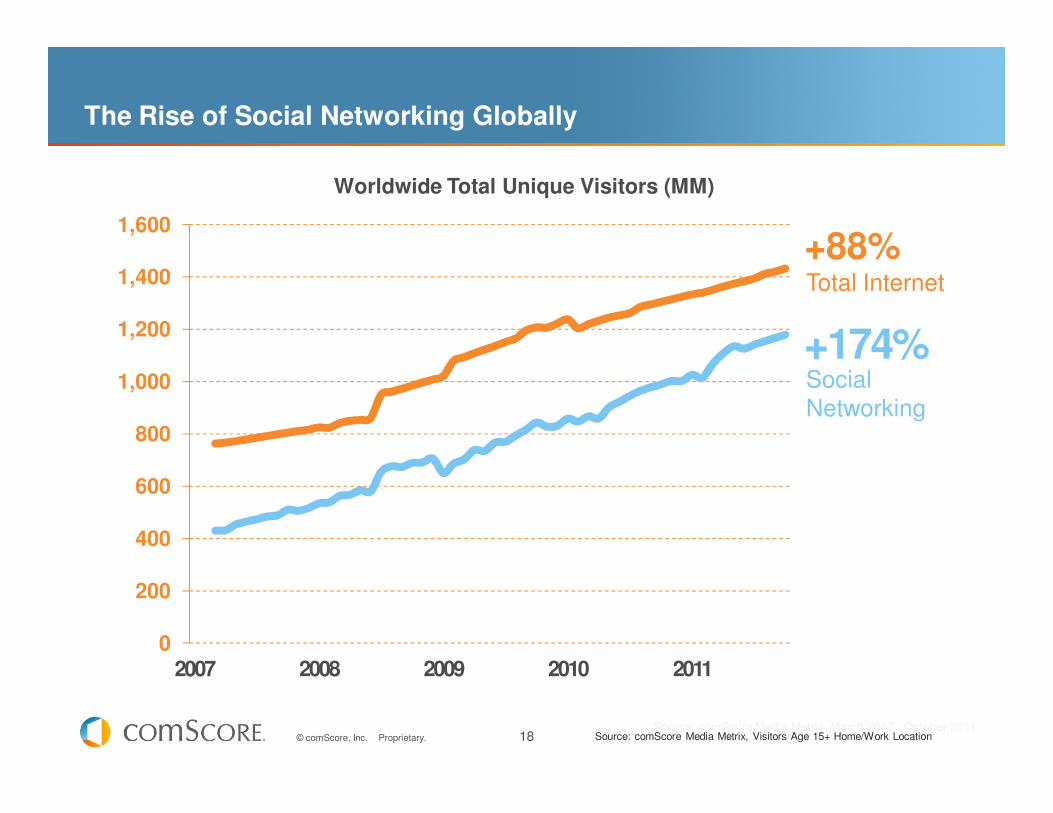
Worldwide Total Unique Visitors (MM)
Total Internet
Social Networking
Source: comScore Media Metrix, March 2007 - October 2011
The Rise of Social Networking Globally
Source: comScore Media Metrix, Visitors Age 15+ Home/Work Location
19© comScore, Inc. Proprietary.
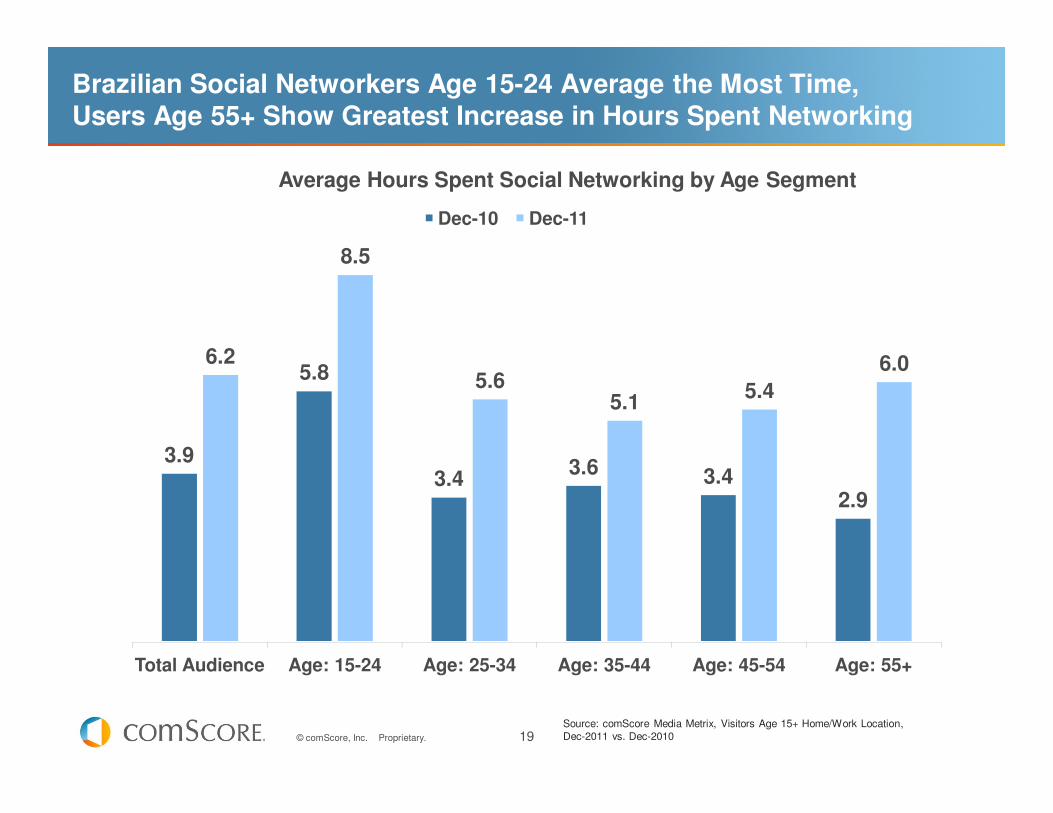
Brazilian Social Networkers Age 15-24 Average the Most Time,Users Age 55+ Show Greatest Increase in Hours Spent Networking
3.9
5.8
3.43.6 3.4
2.9
6.2
8.5
5.65.1
5.46.0
Total Audience Age: 15-24 Age: 25-34 Age: 35-44 Age: 45-54 Age: 55+
Average Hours Spent Social Networking by Age Segment
Dec-10 Dec-11
Source: comScore Media Metrix, Visitors Age 15+ Home/Work Location, Dec-2011 vs. Dec-2010
20© comScore, Inc. Proprietary.
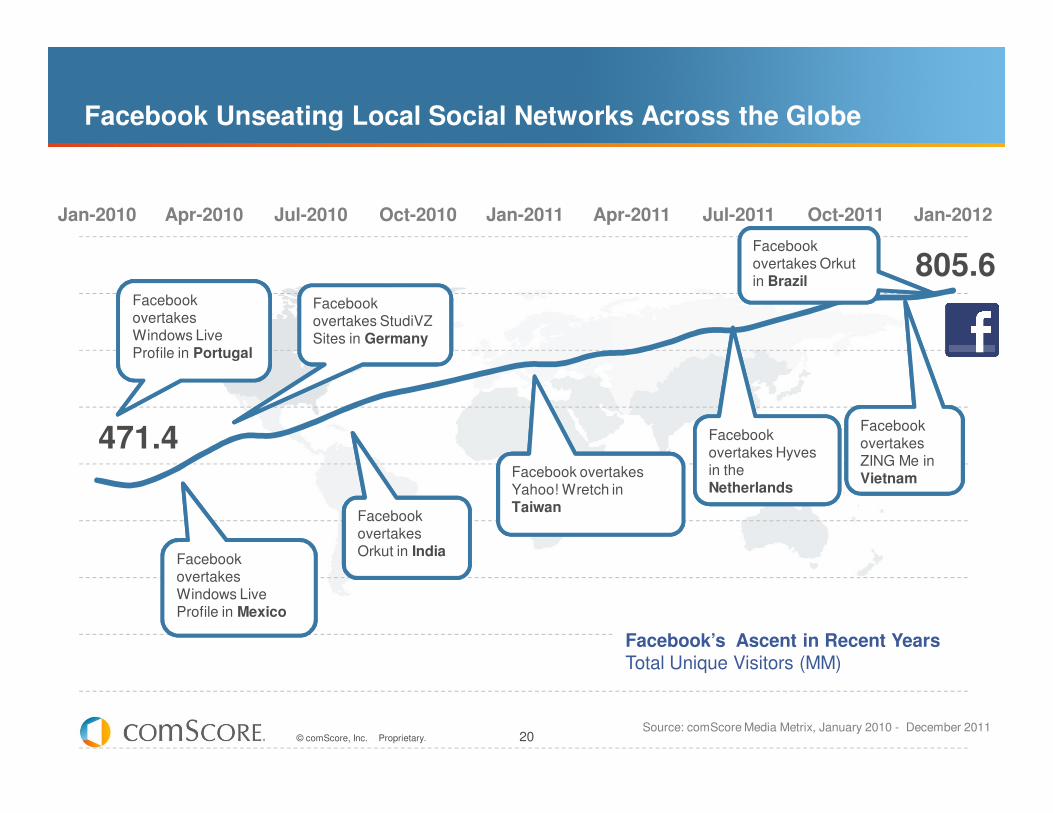
471.4
805.6
Jan-2010 Apr-2010 Jul-2010 Oct-2010 Jan-2011 Apr-2011 Jul-2011 Oct-2011 Jan-2012
Facebook overtakes Orkut in India
Facebook overtakes Windows Live Profile in Mexico
Facebook overtakes Hyves in the Netherlands
Facebook overtakes Windows Live Profile in Portugal
Facebook overtakes Yahoo! Wretch in Taiwan
Facebook overtakes StudiVZ Sites in Germany
Facebook overtakes Orkut in Brazil
Facebook overtakes ZING Me in Vietnam
Source: comScore Media Metrix, January 2010 - December 2011
Facebook’s Ascent in Recent YearsTotal Unique Visitors (MM)
Facebook Unseating Local Social Networks Across the Globe
21© comScore, Inc. Proprietary.
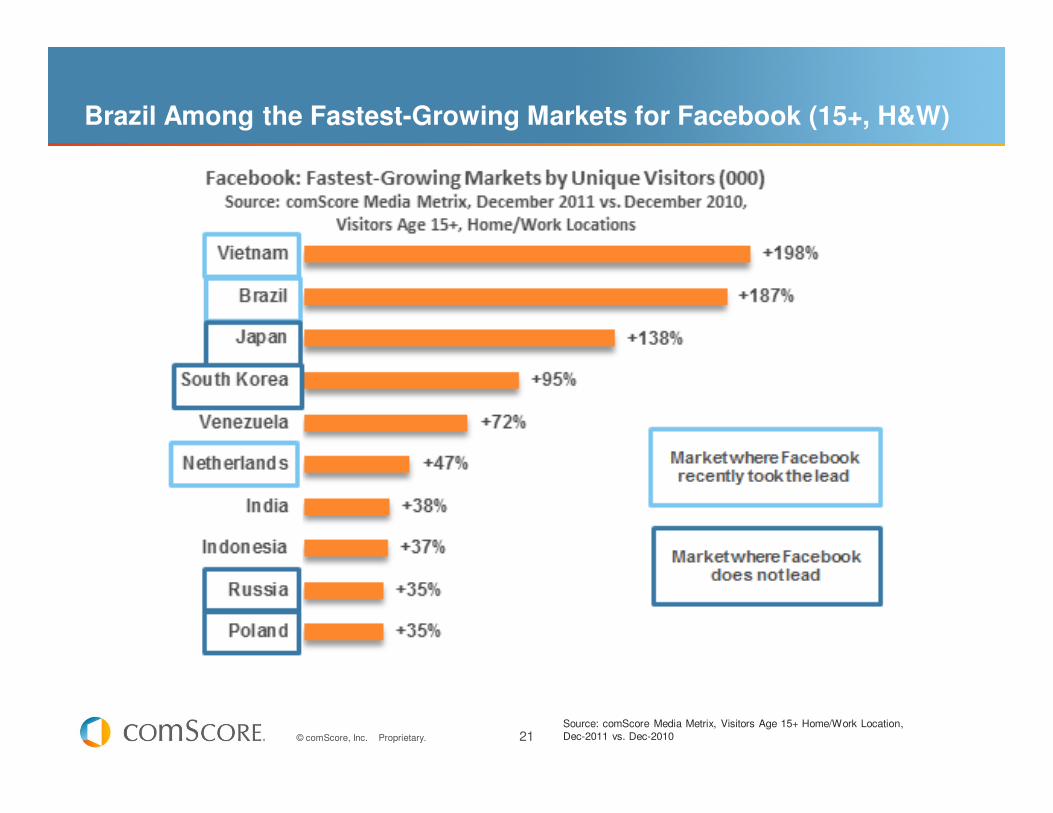
Brazil Among the Fastest-Growing Markets for Facebook (15+, H&W)
Source: comScore Media Metrix, Visitors Age 15+ Home/Work Location, Dec-2011 vs. Dec-2010
22© comScore, Inc. Proprietary.
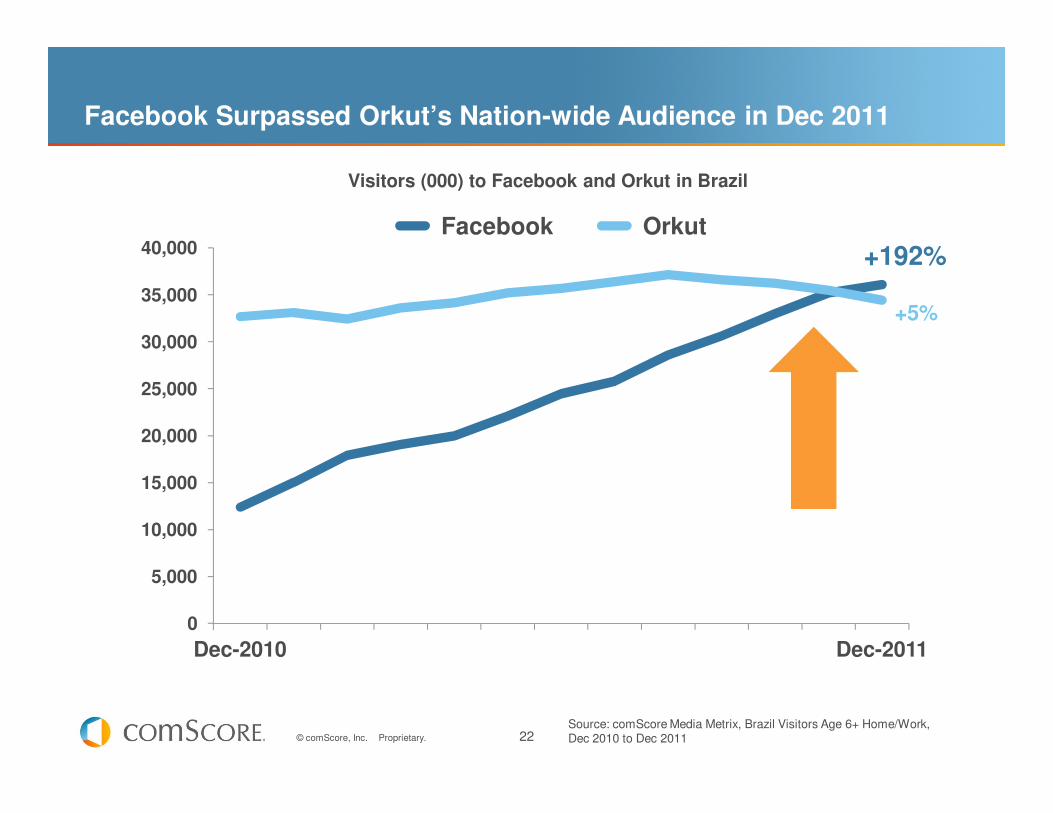
Source: comScore Media Metrix, Brazil Visitors Age 6+ Home/Work,Dec 2010 to Dec 2011
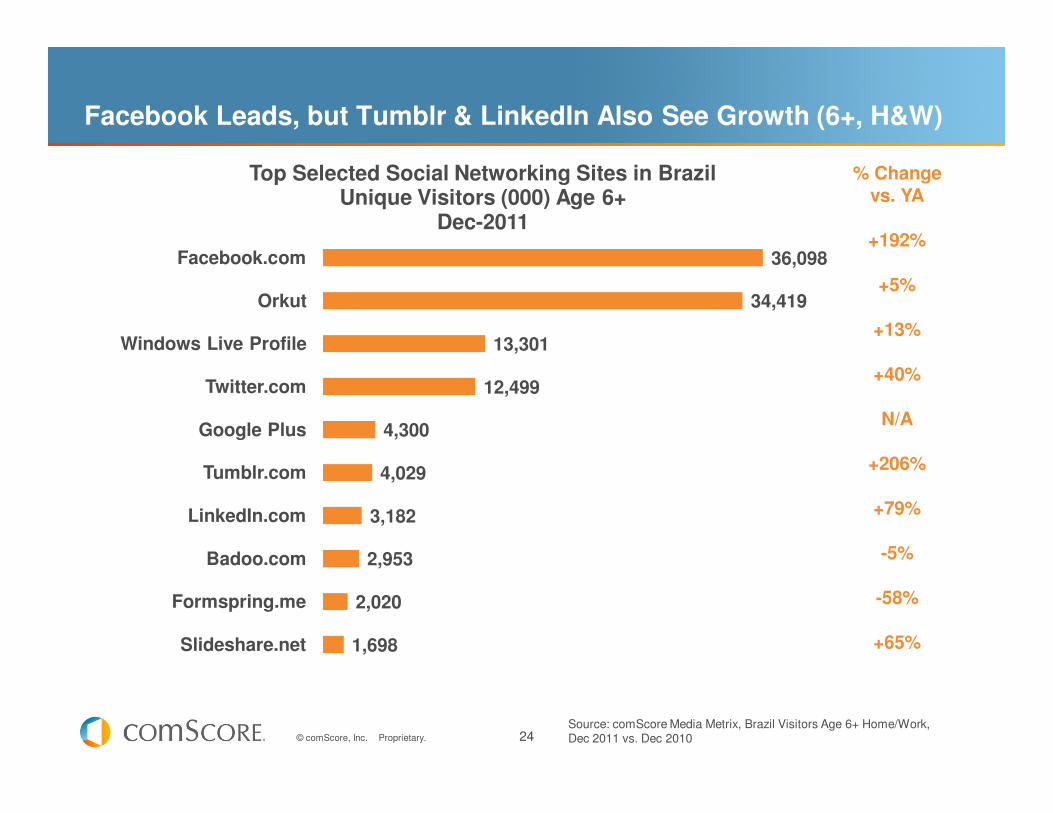
+192%
+5%
0
5,000
10,000
15,000
20,000
25,000
30,000
35,000
40,000
Dec-2010 Dec-2011
Facebook Orkut
Visitors (000) to Facebook and Orkut in Brazil
Facebook Surpassed Orkut’s Nation-wide Audience in Dec 2011
23© comScore, Inc. Proprietary.
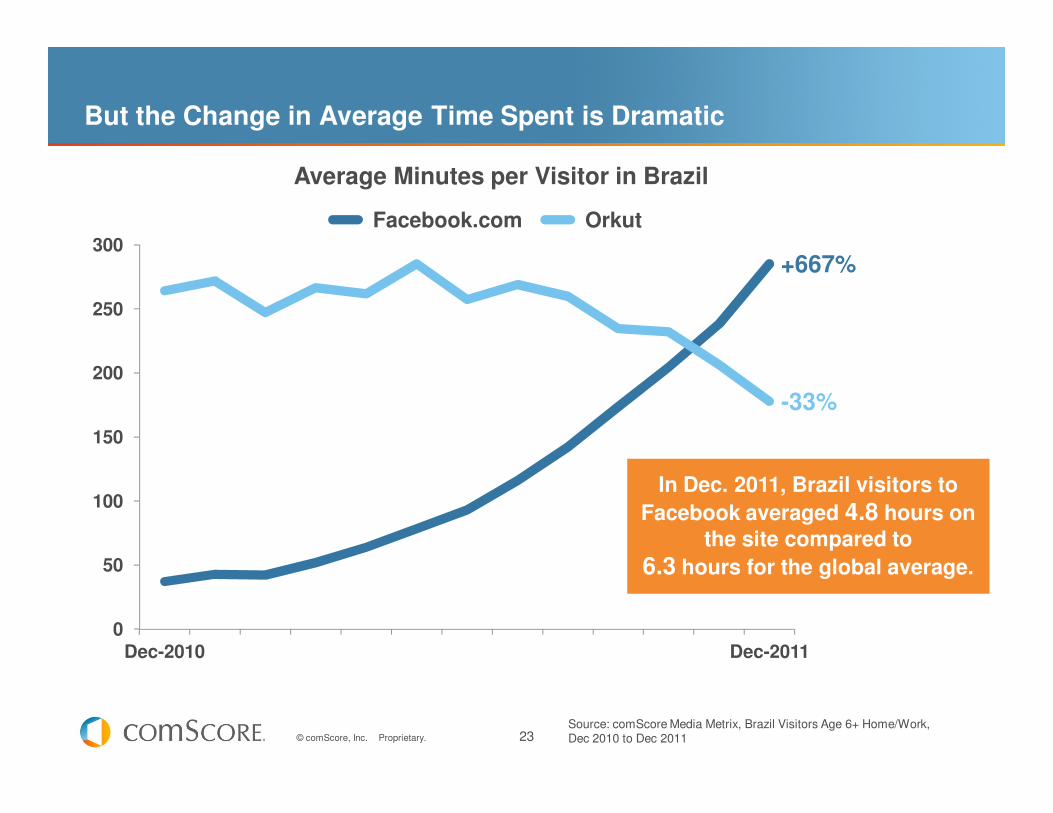
But the Change in Average Time Spent is Dramatic
+667%
-33%
0
50
100
150
200
250
300
Dec-2010 Dec-2011
Average Minutes per Visitor in Brazil
Facebook.com Orkut
In Dec. 2011, Brazil visitors to
Facebook averaged 4.8 hours on the site compared to
6.3 hours for the global average.
Source: comScore Media Metrix, Brazil Visitors Age 6+ Home/Work,Dec 2010 to Dec 2011
24© comScore, Inc. Proprietary.
Facebook Leads, but Tumblr & LinkedIn Also See Growth (6+, H&W)
% Changevs. YA
+192%
+5%
+13%
+40%
N/A
+206%
+79%
-5%
-58%
+65%
Source: comScore Media Metrix, Brazil Visitors Age 6+ Home/Work,Dec 2011 vs. Dec 2010
36,098
34,419
13,301
12,499
4,300
4,029
3,182
2,953
2,020
1,698
Facebook.com
Orkut
Windows Live Profile
Twitter.com
Google Plus
Tumblr.com
LinkedIn.com
Badoo.com
Formspring.me
Slideshare.net
Top Selected Social Networking Sites in BrazilUnique Visitors (000) Age 6+
Dec-2011
25© comScore, Inc. Proprietary.
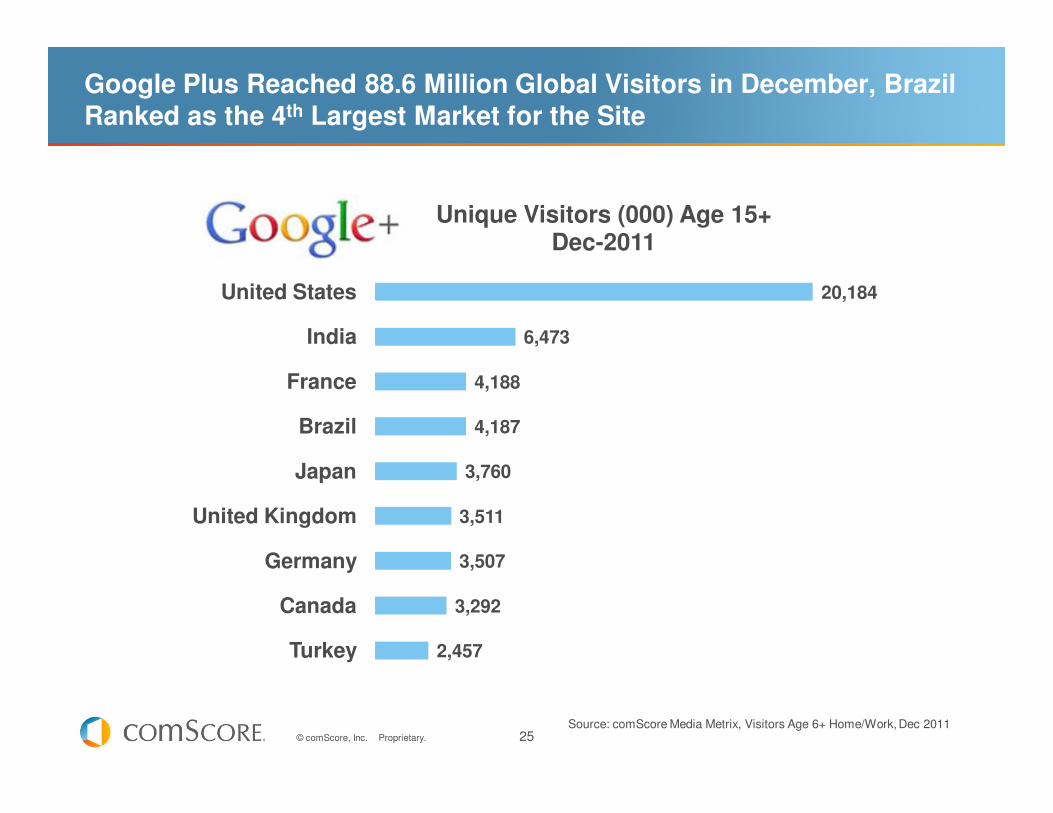
Google Plus Reached 88.6 Million Global Visitors in December, Brazil Ranked as the 4th Largest Market for the Site
20,184
6,473
4,188
4,187
3,760
3,511
3,507
3,292
2,457
United States
India
France
Brazil
Japan
United Kingdom
Germany
Canada
Turkey
Unique Visitors (000) Age 15+ Dec-2011
Source: comScore Media Metrix, Visitors Age 6+ Home/Work, Dec 2011
26© comScore, Inc. Proprietary.
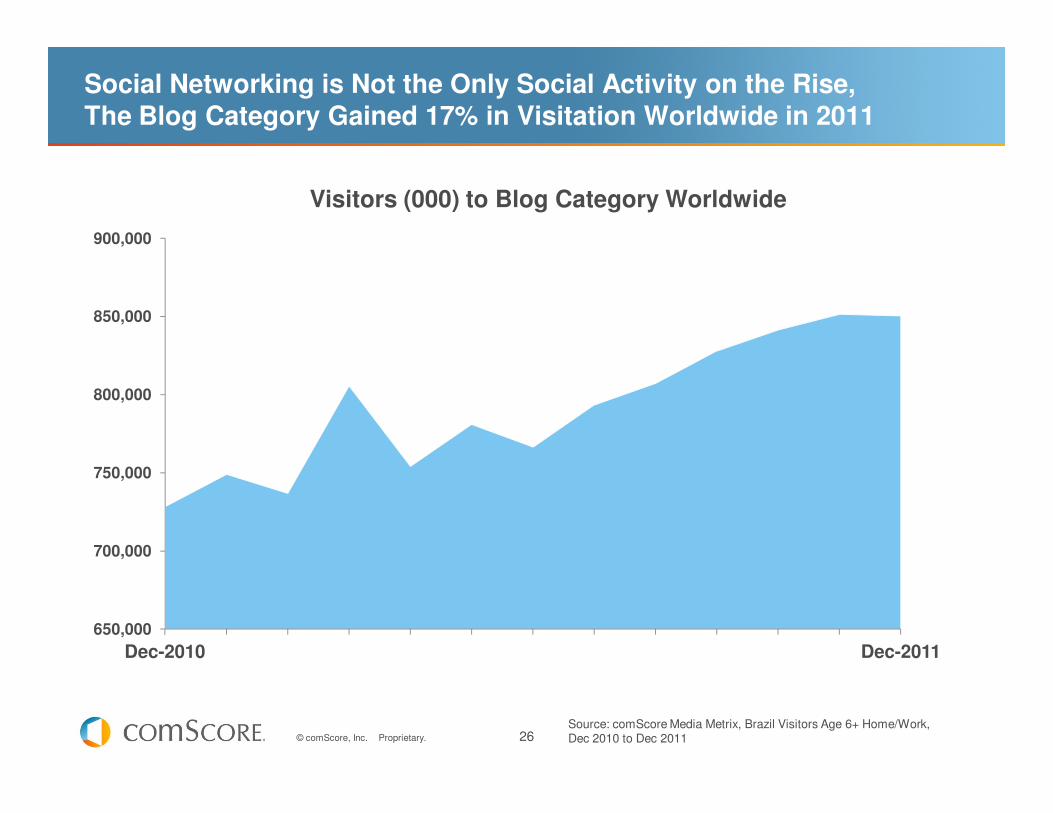
Social Networking is Not the Only Social Activity on the Rise, The Blog Category Gained 17% in Visitation Worldwide in 2011
650,000
700,000
750,000
800,000
850,000
900,000
Dec-2010 Dec-2011
Visitors (000) to Blog Category Worldwide
Source: comScore Media Metrix, Brazil Visitors Age 6+ Home/Work,Dec 2010 to Dec 2011
27© comScore, Inc. Proprietary.
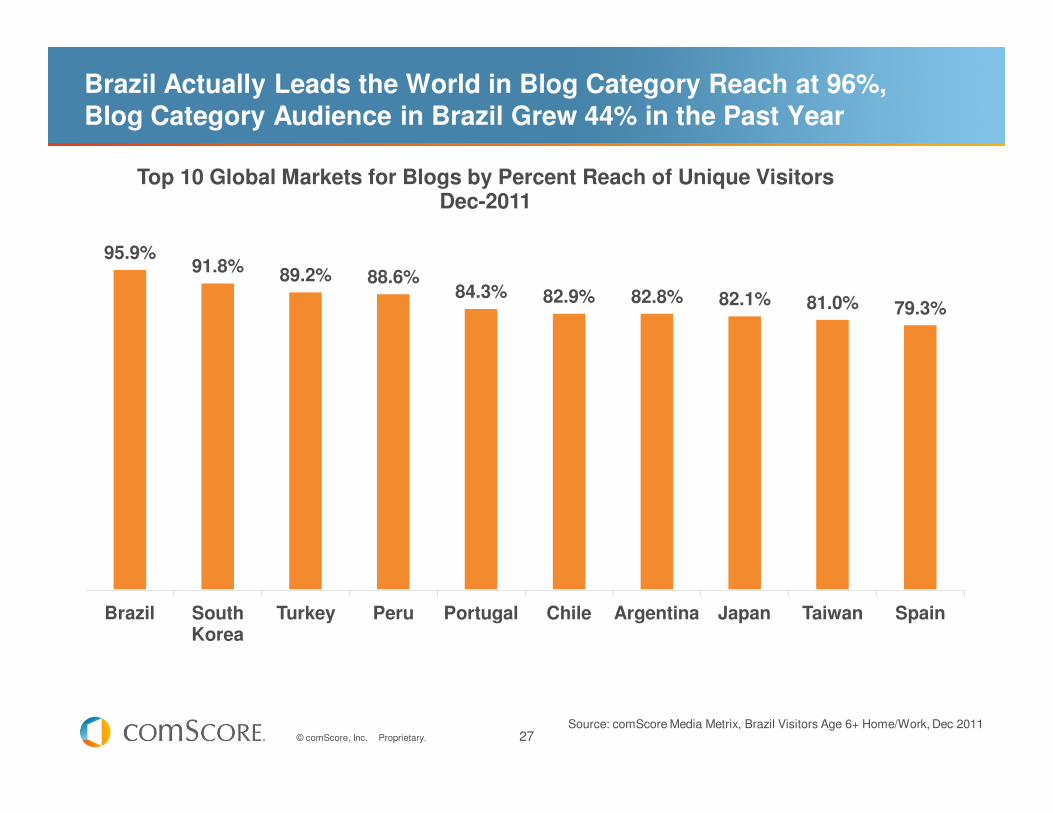
Brazil Actually Leads the World in Blog Category Reach at 96%, Blog Category Audience in Brazil Grew 44% in the Past Year
95.9%91.8% 89.2% 88.6%
84.3% 82.9% 82.8% 82.1% 81.0% 79.3%
Brazil South Korea
Turkey Peru Portugal Chile Argentina Japan Taiwan Spain
Top 10 Global Markets for Blogs by Percent Reach of Unique Visitors Dec-2011
Source: comScore Media Metrix, Brazil Visitors Age 6+ Home/Work, Dec 2011
28© comScore, Inc. Proprietary.
ENTERTAINMENT CONTENT AND ONLINE VIDEO ATTRACTING GROWING AUDIENCE
29© comScore, Inc. Proprietary.
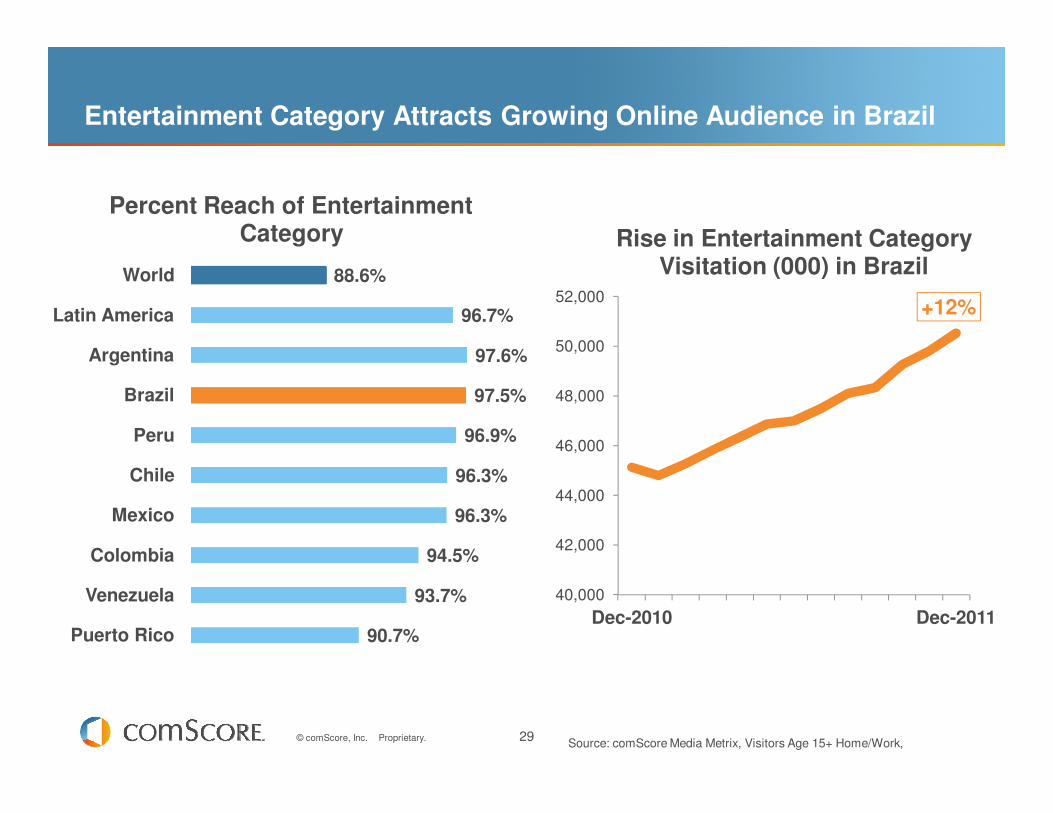
88.6%
96.7%
97.6%
97.5%
96.9%
96.3%
96.3%
94.5%
93.7%
90.7%
World
Latin America
Argentina
Brazil
Peru
Chile
Mexico
Colombia
Venezuela
Puerto Rico
Percent Reach of Entertainment Category
Entertainment Category Attracts Growing Online Audience in Brazil
Source: comScore Media Metrix, Visitors Age 15+ Home/Work,
+12%
40,000
42,000
44,000
46,000
48,000
50,000
52,000
Dec-2010 Dec-2011
Rise in Entertainment Category Visitation (000) in Brazil
30© comScore, Inc. Proprietary.
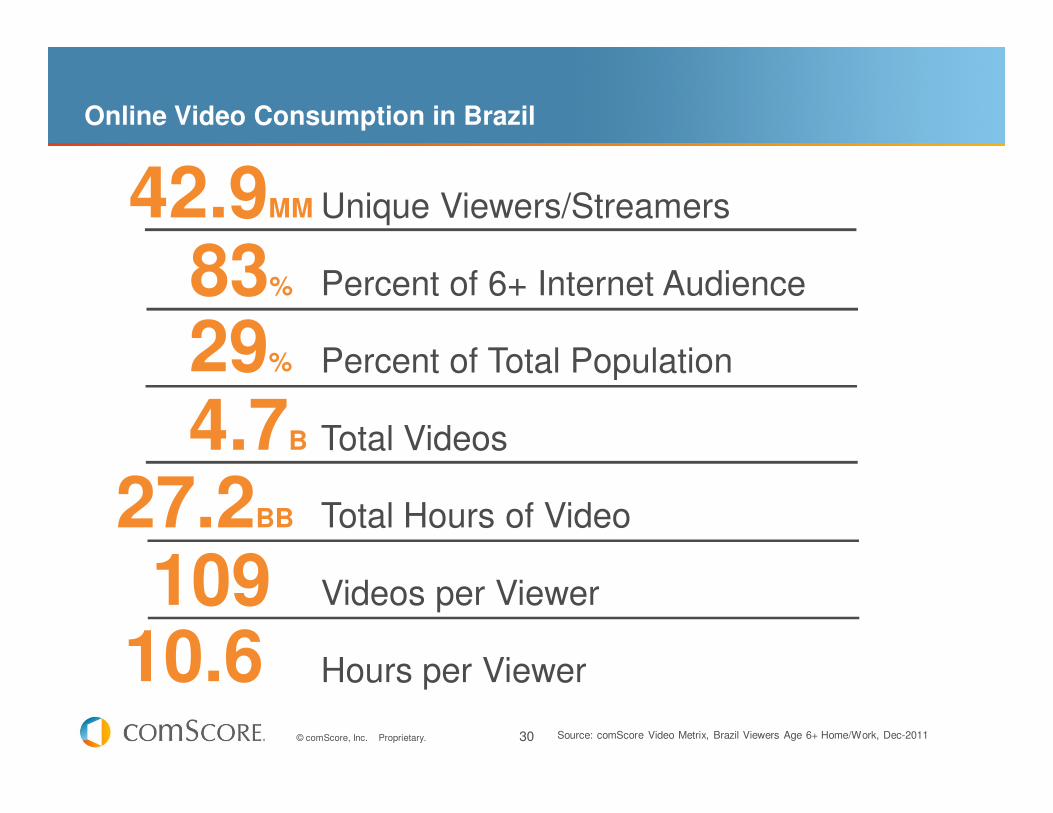
Online Video Consumption in Brazil
Source: comScore Video Metrix, Brazil Viewers Age 6+ Home/Work, Dec-2011
27.2BB
Unique Viewers/Streamers
Percent of 6+ Internet Audience
Percent of Total Population
Total Videos
Total Hours of Video
Videos per Viewer
Hours per Viewer
42.9MM
29%
4.7B
10910.6
83%
31© comScore, Inc. Proprietary.
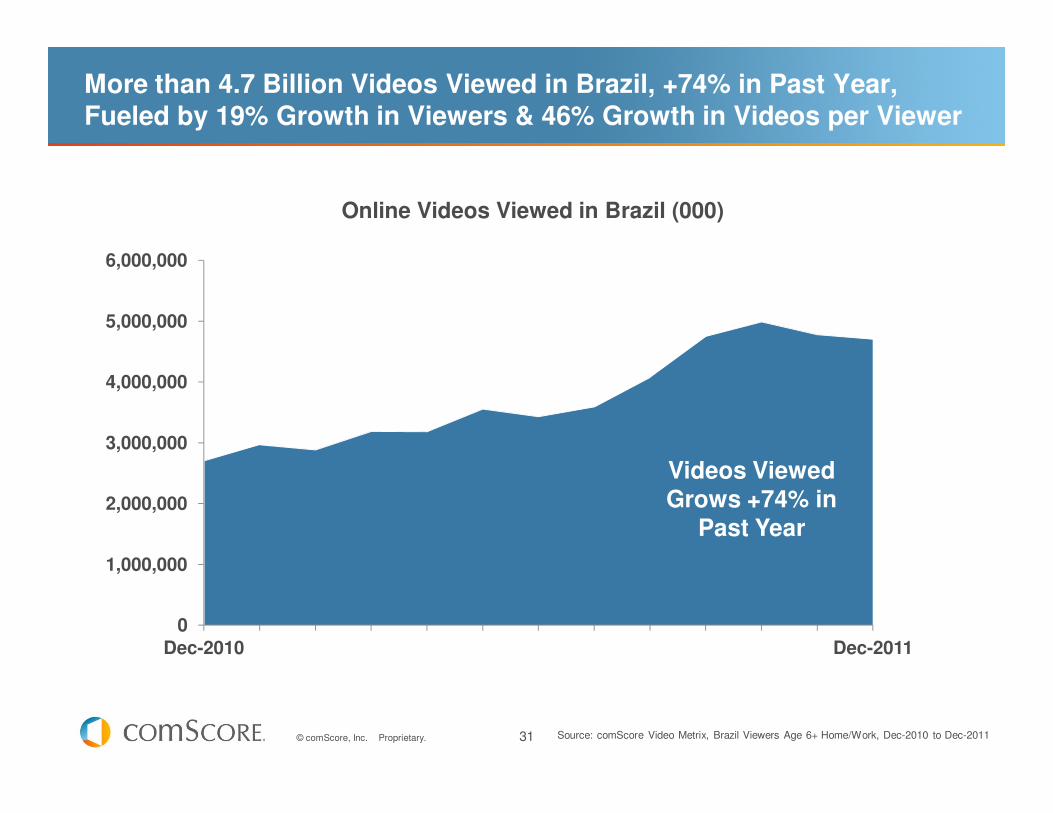
More than 4.7 Billion Videos Viewed in Brazil, +74% in Past Year, Fueled by 19% Growth in Viewers & 46% Growth in Videos per Viewer
0
1,000,000
2,000,000
3,000,000
4,000,000
5,000,000
6,000,000
Dec-2010 Dec-2011
Online Videos Viewed in Brazil (000)
Videos Viewed Grows +74% in
Past Year
Source: comScore Video Metrix, Brazil Viewers Age 6+ Home/Work, Dec-2010 to Dec-2011
32© comScore, Inc. Proprietary.
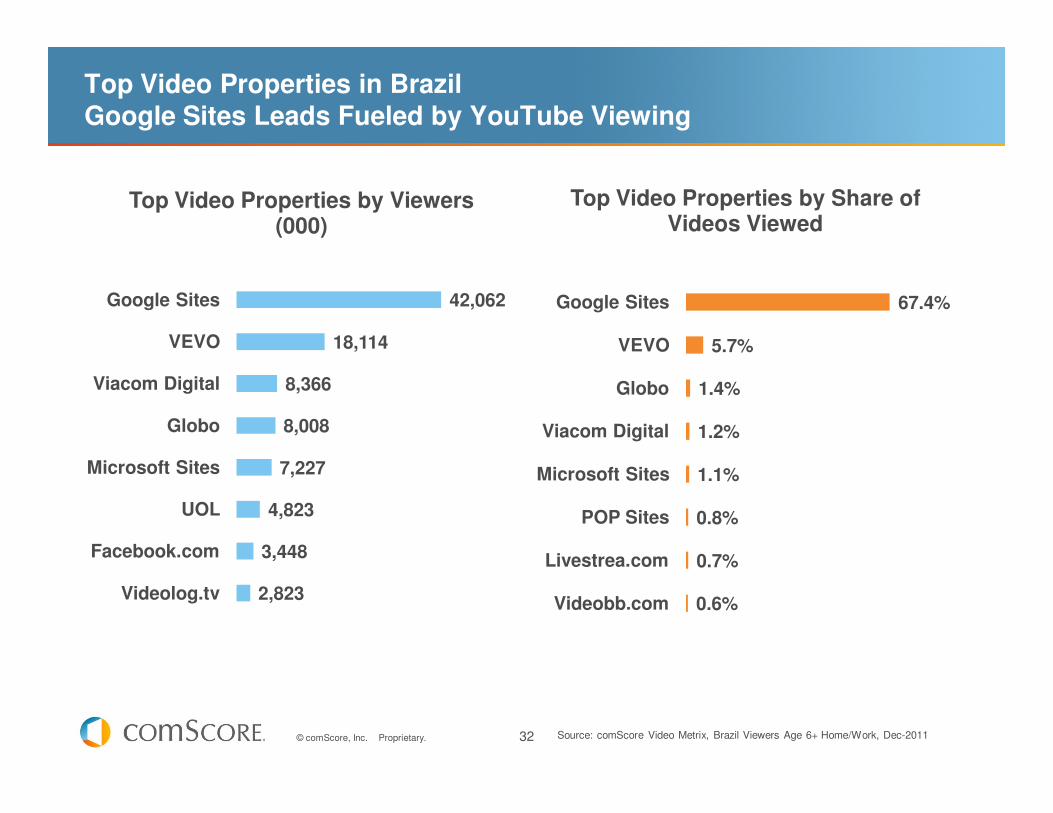
Top Video Properties in BrazilGoogle Sites Leads Fueled by YouTube Viewing
42,062
18,114
8,366
8,008
7,227
4,823
3,448
2,823
Google Sites
VEVO
Viacom Digital
Globo
Microsoft Sites
UOL
Facebook.com
Videolog.tv
Top Video Properties by Viewers (000)
67.4%
5.7%
1.4%
1.2%
1.1%
0.8%
0.7%
0.6%
Google Sites
VEVO
Globo
Viacom Digital
Microsoft Sites
POP Sites
Livestrea.com
Videobb.com
Top Video Properties by Share of Videos Viewed
Source: comScore Video Metrix, Brazil Viewers Age 6+ Home/Work, Dec-2011
33© comScore, Inc. Proprietary.
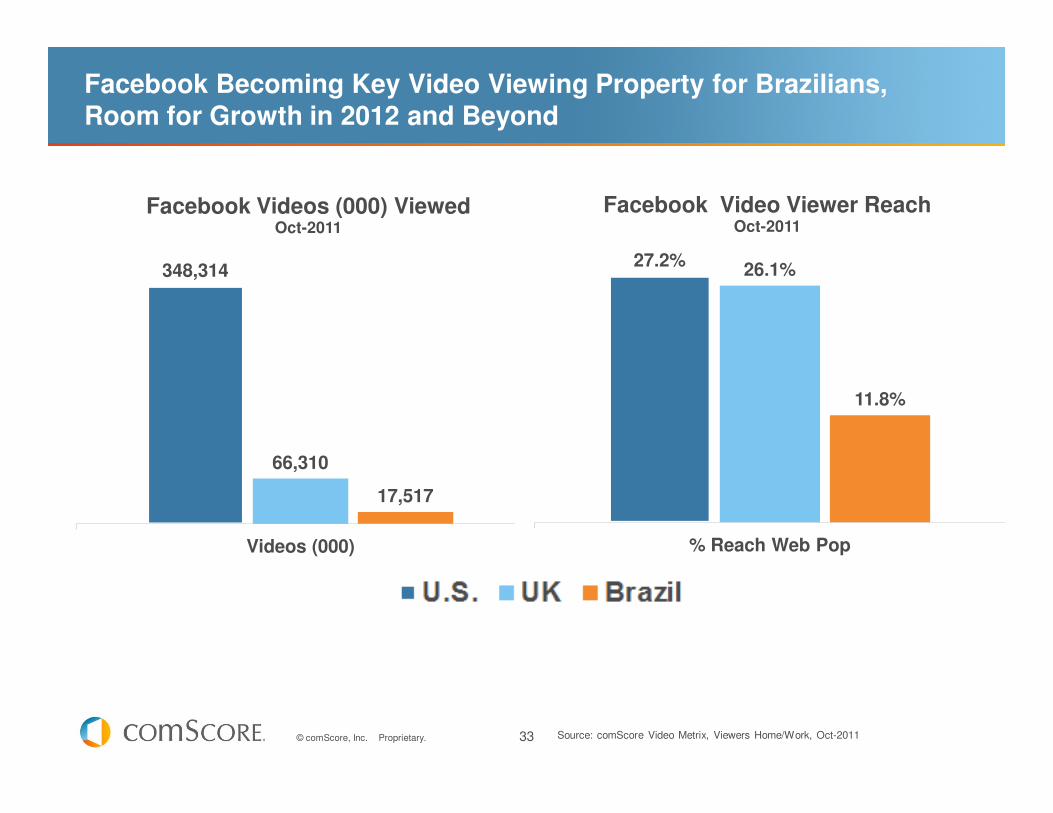
Facebook Becoming Key Video Viewing Property for Brazilians, Room for Growth in 2012 and Beyond
Source: comScore Video Metrix, Viewers Home/Work, Oct-2011
348,314
66,310
17,517
Videos (000)
Facebook Videos (000) ViewedOct-2011
27.2% 26.1%
11.8%
% Reach Web Pop
Facebook Video Viewer ReachOct-2011
34© comScore, Inc. Proprietary.
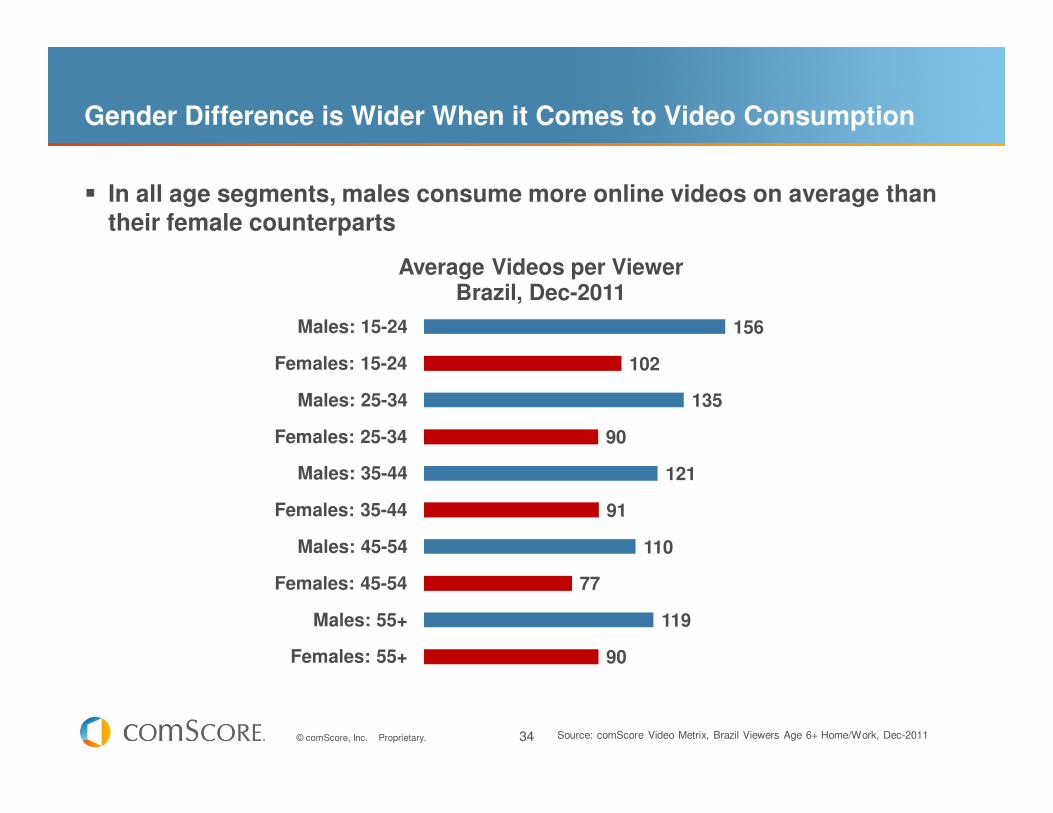
Gender Difference is Wider When it Comes to Video Consumption
156
102
135
90
121
91
110
77
119
90
Males: 15-24
Females: 15-24
Males: 25-34
Females: 25-34
Males: 35-44
Females: 35-44
Males: 45-54
Females: 45-54
Males: 55+
Females: 55+
Average Videos per ViewerBrazil, Dec-2011
In all age segments, males consume more online videos on average than their female counterparts
Source: comScore Video Metrix, Brazil Viewers Age 6+ Home/Work, Dec-2011

35© comScore, Inc. Proprietary.
SHOPPING AND PURCHASING ONLINE CONTINUES TO GROW DURING 2011
36© comScore, Inc. Proprietary.
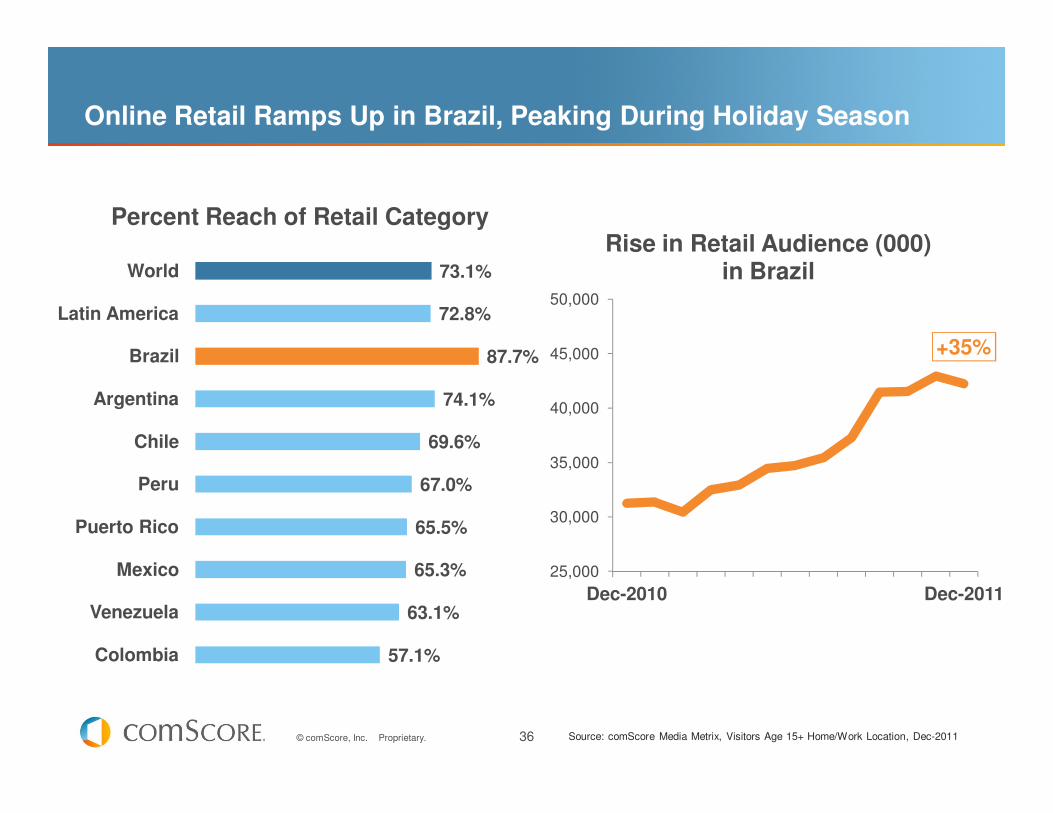
73.1%
72.8%
87.7%
74.1%
69.6%
67.0%
65.5%
65.3%
63.1%
57.1%
World
Latin America
Brazil
Argentina
Chile
Peru
Puerto Rico
Mexico
Venezuela
Colombia
Percent Reach of Retail Category
Online Retail Ramps Up in Brazil, Peaking During Holiday Season
Source: comScore Media Metrix, Visitors Age 15+ Home/Work Location, Dec-2011
+35%
25,000
30,000
35,000
40,000
45,000
50,000
Dec-2010 Dec-2011
Rise in Retail Audience (000) in Brazil
37© comScore, Inc. Proprietary.
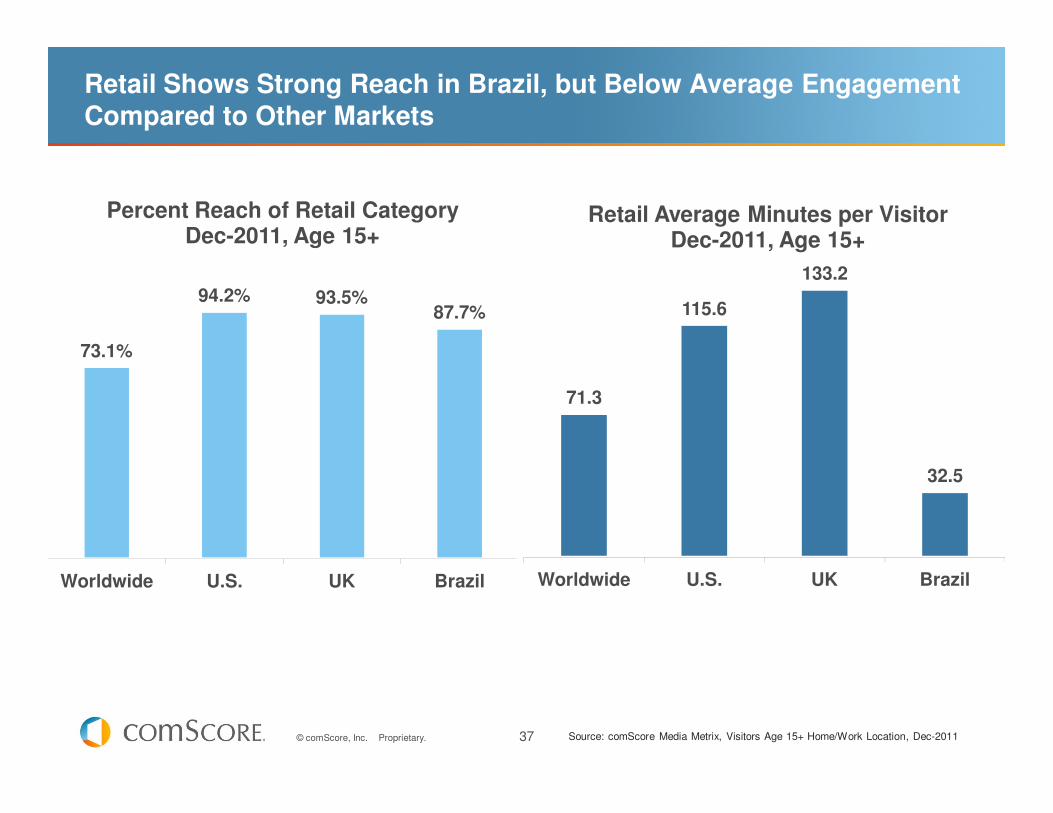
Retail Shows Strong Reach in Brazil, but Below Average Engagement Compared to Other Markets
73.1%
94.2% 93.5%87.7%
Worldwide U.S. UK Brazil
Percent Reach of Retail Category Dec-2011, Age 15+
71.3
115.6
133.2
32.5
Worldwide U.S. UK Brazil
Retail Average Minutes per VisitorDec-2011, Age 15+
Source: comScore Media Metrix, Visitors Age 15+ Home/Work Location, Dec-2011
38© comScore, Inc. Proprietary.
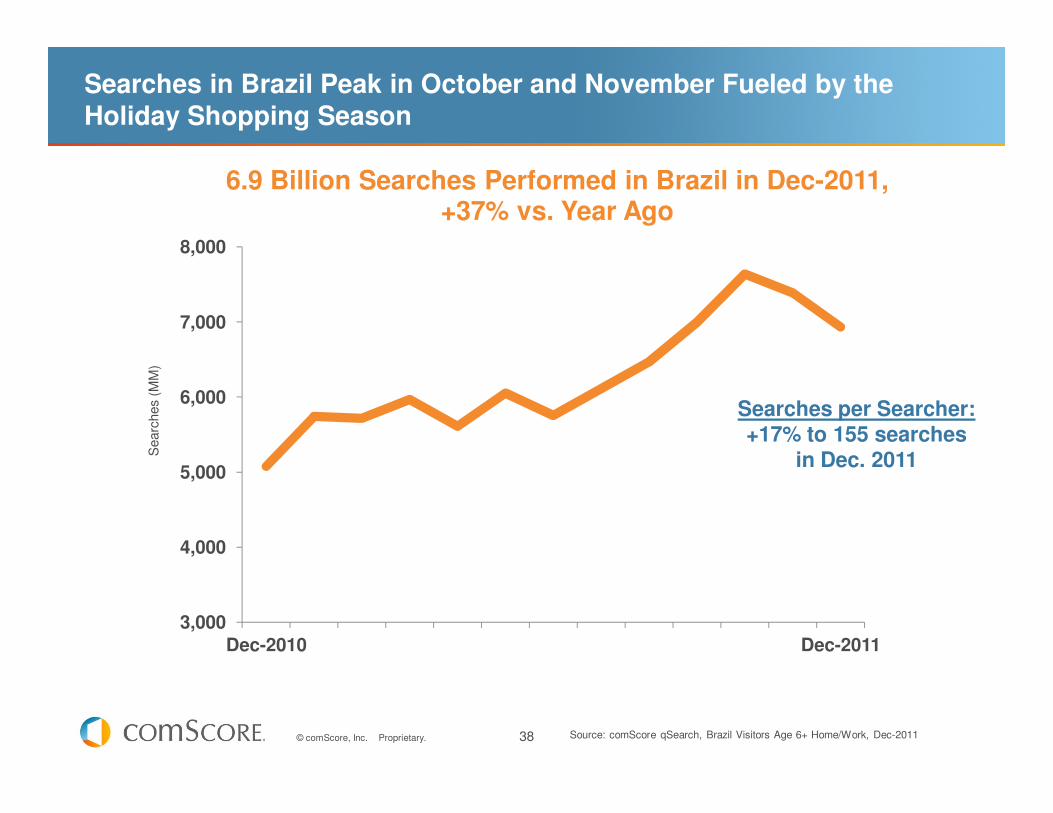
Searches in Brazil Peak in October and November Fueled by the Holiday Shopping Season
3,000
4,000
5,000
6,000
7,000
8,000
Dec-2010 Dec-2011
Searc
hes
(MM
)
6.9 Billion Searches Performed in Brazil in Dec-2011, +37% vs. Year Ago
Searches per Searcher: +17% to 155 searches
in Dec. 2011
Source: comScore qSearch, Brazil Visitors Age 6+ Home/Work, Dec-2011
39© comScore, Inc. Proprietary.
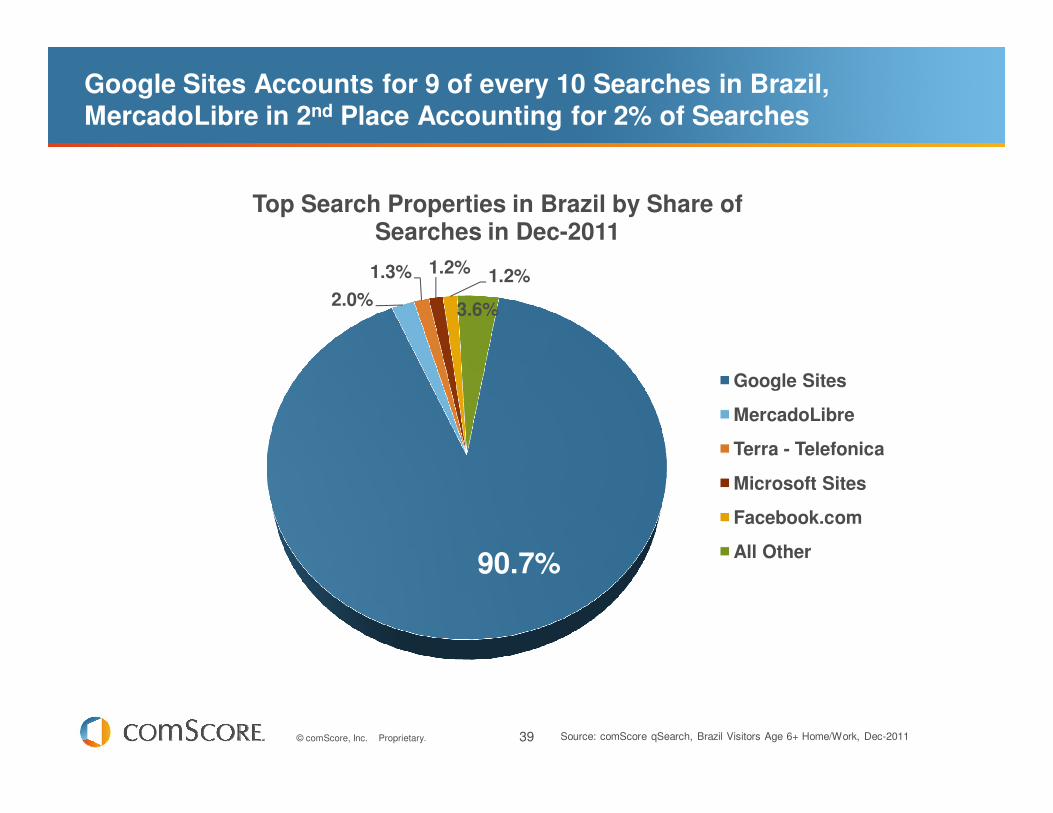
Google Sites Accounts for 9 of every 10 Searches in Brazil, MercadoLibre in 2nd Place Accounting for 2% of Searches
90.7%
2.0%
1.3% 1.2% 1.2%
3.6%
Top Search Properties in Brazil by Share of Searches in Dec-2011
Google Sites
MercadoLibre
Terra - Telefonica
Microsoft Sites
Facebook.com
All Other
Source: comScore qSearch, Brazil Visitors Age 6+ Home/Work, Dec-2011
40© comScore, Inc. Proprietary.
DIGITAL ADVERTISING ENTERS ERA OF INCREASED ACCOUNTABILITY AS BRAND DOLLARS CONTINUE TO SHIFT ONLINE
41© comScore, Inc. Proprietary.
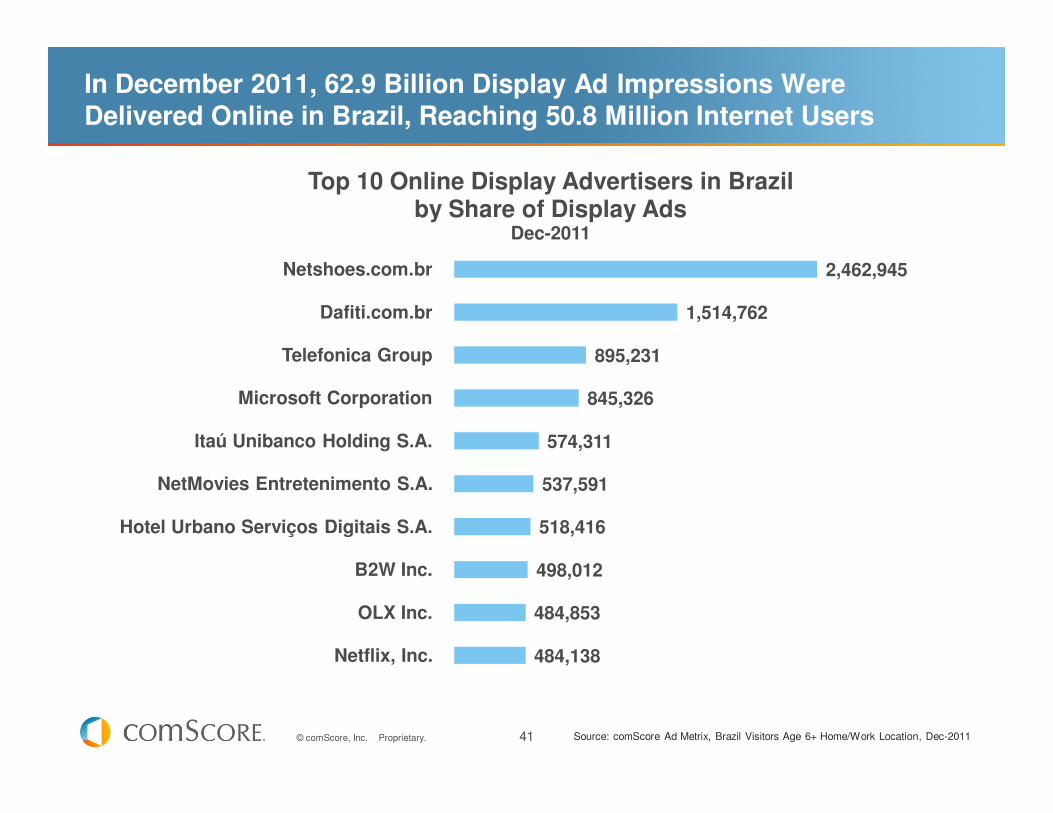
In December 2011, 62.9 Billion Display Ad Impressions Were Delivered Online in Brazil, Reaching 50.8 Million Internet Users
2,462,945
1,514,762
895,231
845,326
574,311
537,591
518,416
498,012
484,853
484,138
Netshoes.com.br
Dafiti.com.br
Telefonica Group
Microsoft Corporation
Itaú Unibanco Holding S.A.
NetMovies Entretenimento S.A.
Hotel Urbano Serviços Digitais S.A.
B2W Inc.
OLX Inc.
Netflix, Inc.
Top 10 Online Display Advertisers in Brazil by Share of Display Ads
Dec-2011
Source: comScore Ad Metrix, Brazil Visitors Age 6+ Home/Work Location, Dec-2011
42© comScore, Inc. Proprietary.
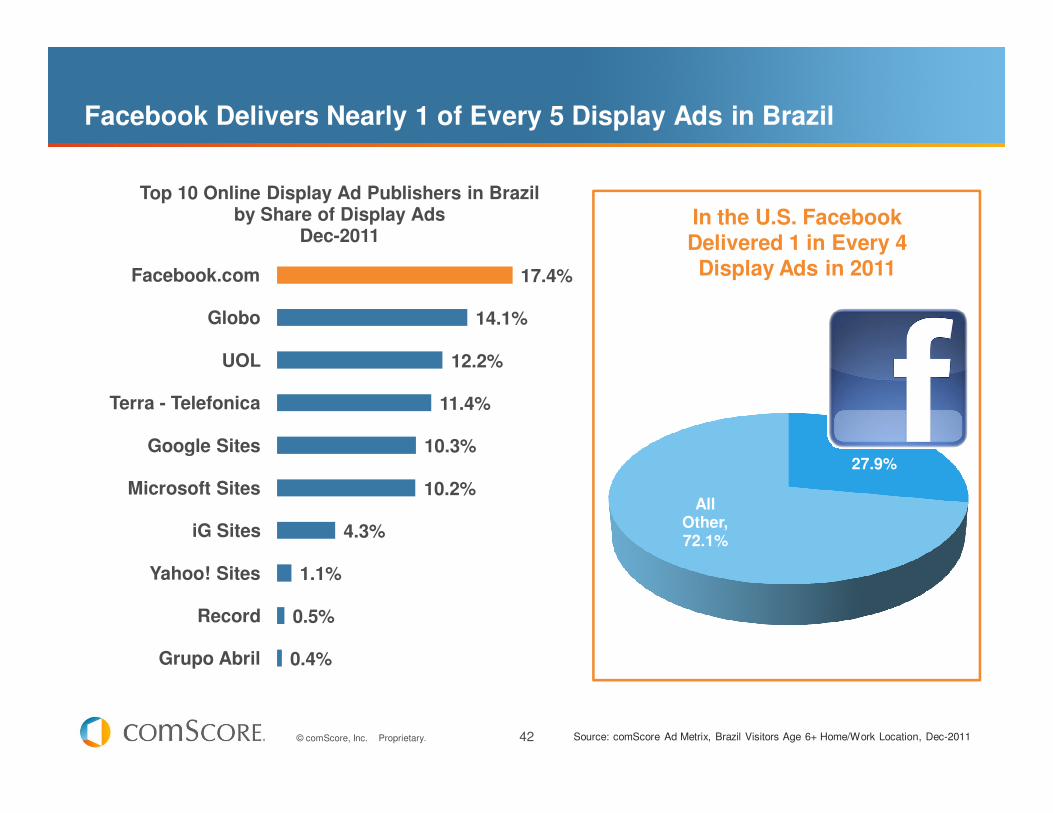
27.9%
17.4%
14.1%
12.2%
11.4%
10.3%
10.2%
4.3%
1.1%
0.5%
0.4%
Facebook.com
Globo
UOL
Terra - Telefonica
Google Sites
Microsoft Sites
iG Sites
Yahoo! Sites
Record
Grupo Abril
Top 10 Online Display Ad Publishers in Brazil by Share of Display Ads
Dec-2011
27.9%
All Other, 72.1%
In the U.S. Facebook Delivered 1 in Every 4 Display Ads in 2011
Facebook Delivers Nearly 1 of Every 5 Display Ads in Brazil
Source: comScore Ad Metrix, Brazil Visitors Age 6+ Home/Work Location, Dec-2011
43© comScore, Inc. Proprietary.
Arguably the Most Important Digital Advertising Initiative To Date:
“Making Measurement Make Sense” (3MS) Mission
Reduce costs of doing business due to complexity of digital
advertising ecosystem
‘Single Tag’ solution to reduce complexity
Improve reporting of ad exposure
Bolster confidence that ads delivered are actually visible
44© comScore, Inc. Proprietary.
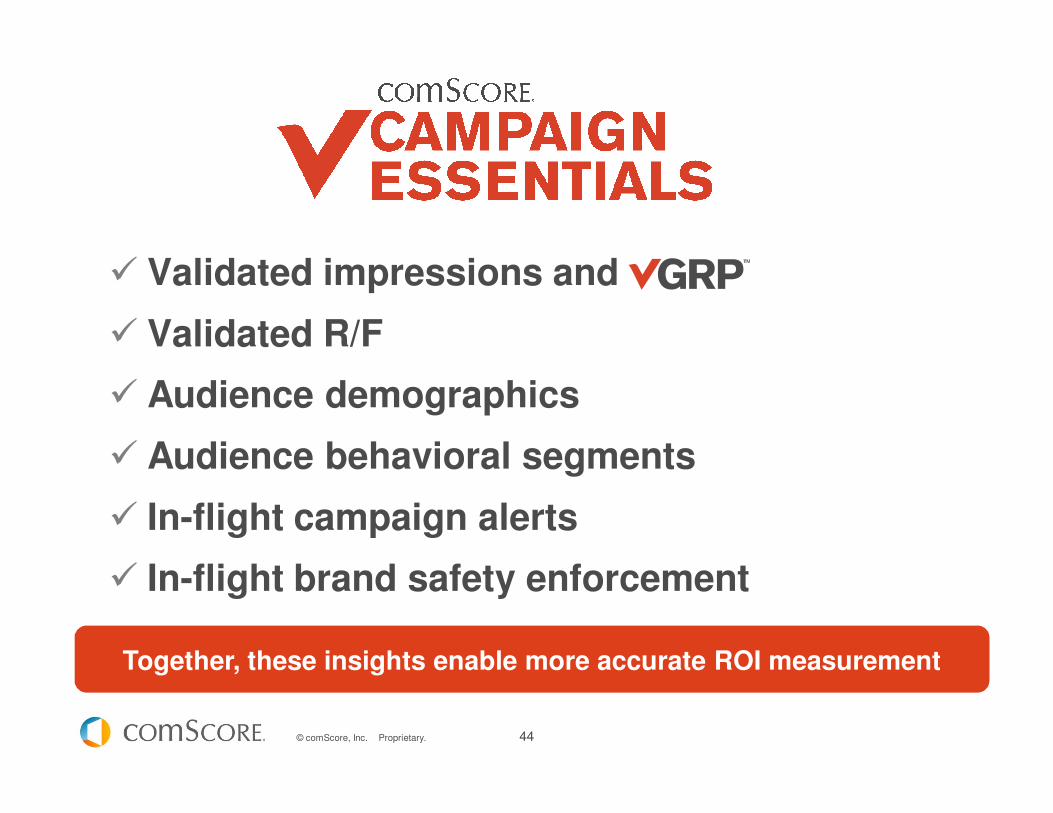
Validated impressions and
Validated R/F
Audience demographics
Audience behavioral segments
In-flight campaign alerts
In-flight brand safety enforcement
Together, these insights enable more accurate ROI measurement
45© comScore, Inc. Proprietary.
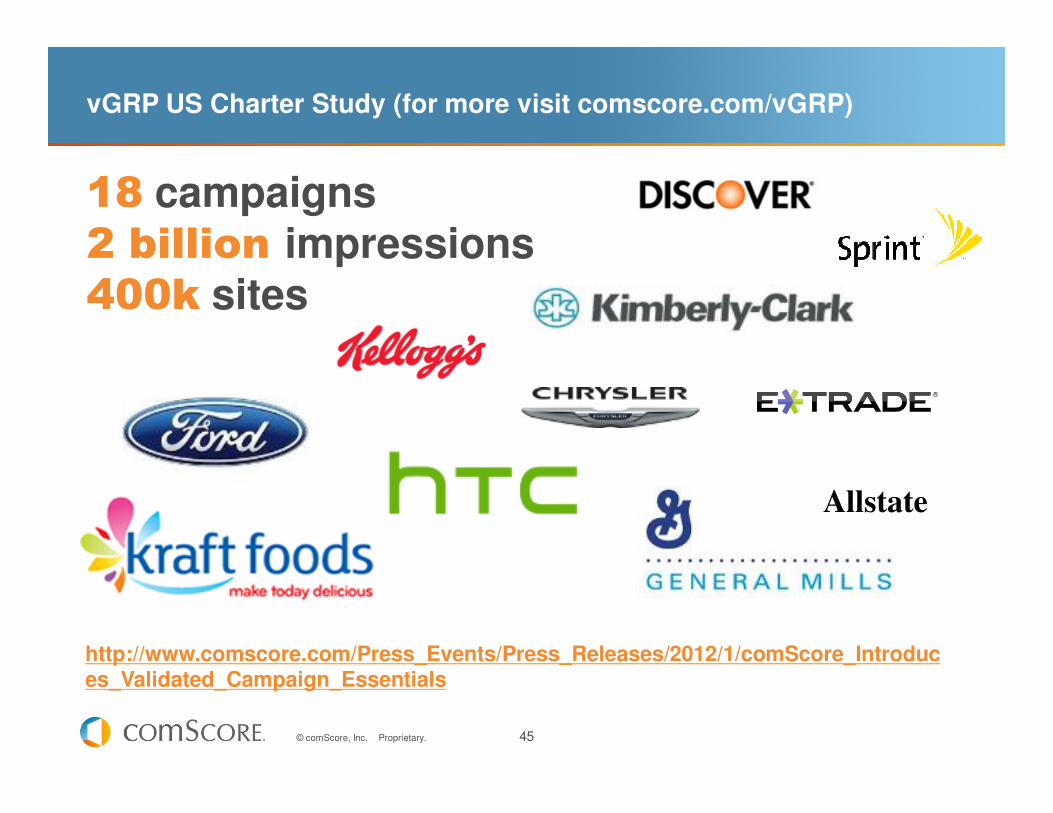
vGRP US Charter Study (for more visit comscore.com/vGRP)
18 campaigns2 billion impressions 400k sites
Allstate
http://www.comscore.com/Press_Events/Press_Releases/2012/1/comScore_Introduces_Validated_Campaign_Essentials
46© comScore, Inc. Proprietary.
OTHER ACTIVITIES ON THE RISE IN BRAZIL
47© comScore, Inc. Proprietary.
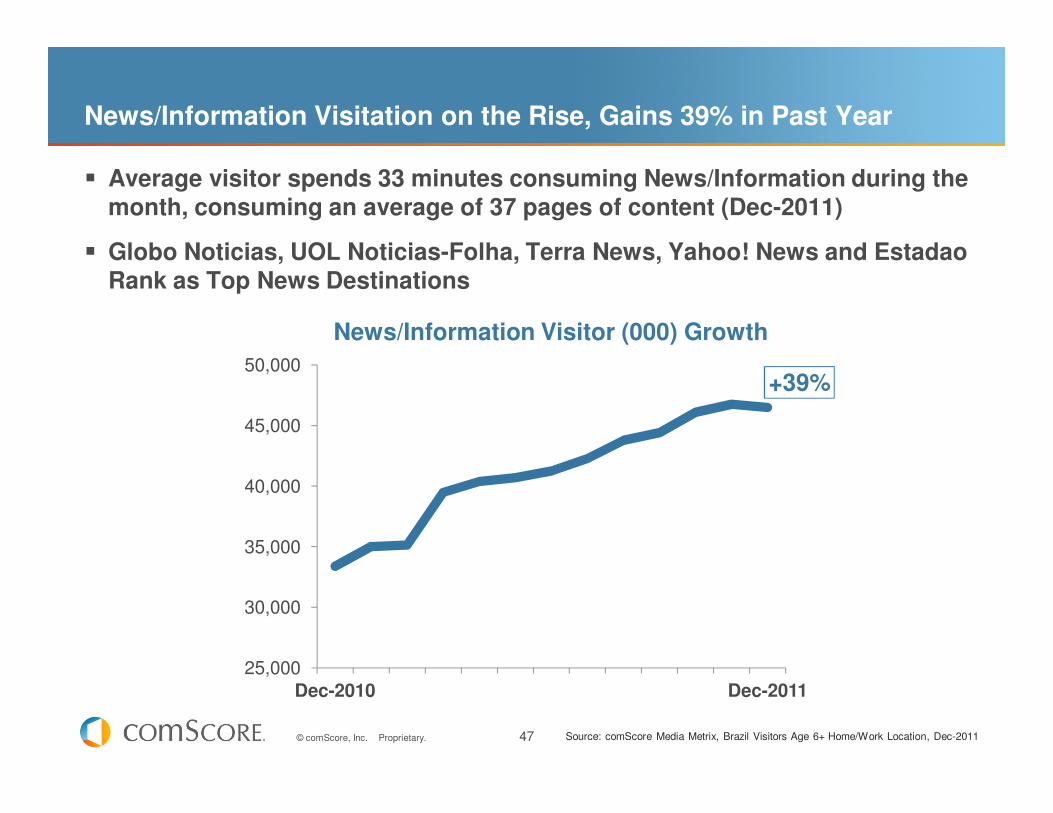
News/Information Visitation on the Rise, Gains 39% in Past Year
Average visitor spends 33 minutes consuming News/Information during the month, consuming an average of 37 pages of content (Dec-2011)
Globo Noticias, UOL Noticias-Folha, Terra News, Yahoo! News and EstadaoRank as Top News Destinations
+39%
25,000
30,000
35,000
40,000
45,000
50,000
Dec-2010 Dec-2011
News/Information Visitor (000) Growth
Source: comScore Media Metrix, Brazil Visitors Age 6+ Home/Work Location, Dec-2011
48© comScore, Inc. Proprietary.
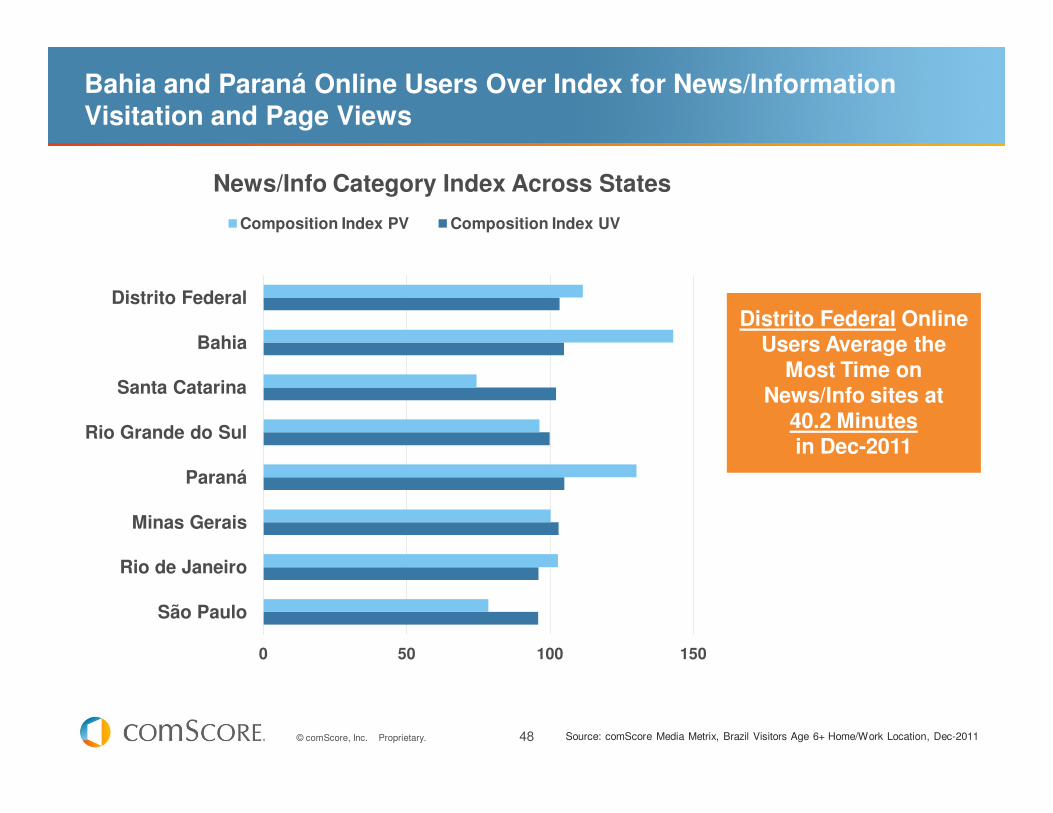
Bahia and Paraná Online Users Over Index for News/Information Visitation and Page Views
0 50 100 150
São Paulo
Rio de Janeiro
Minas Gerais
Paraná
Rio Grande do Sul
Santa Catarina
Bahia
Distrito Federal
News/Info Category Index Across States
Composition Index PV Composition Index UV
Source: comScore Media Metrix, Brazil Visitors Age 6+ Home/Work Location, Dec-2011
Distrito Federal Online Users Average the
Most Time on News/Info sites at
40.2 Minutes in Dec-2011
49© comScore, Inc. Proprietary.
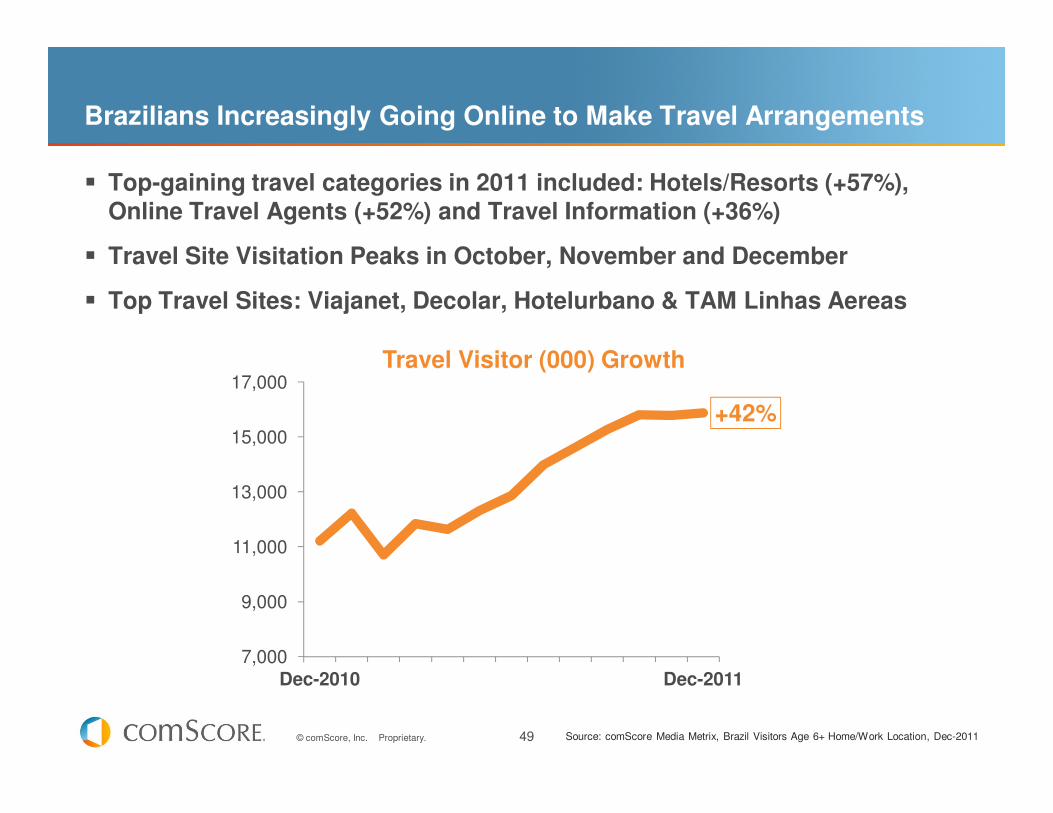
Brazilians Increasingly Going Online to Make Travel Arrangements
Top-gaining travel categories in 2011 included: Hotels/Resorts (+57%), Online Travel Agents (+52%) and Travel Information (+36%)
Travel Site Visitation Peaks in October, November and December
Top Travel Sites: Viajanet, Decolar, Hotelurbano & TAM Linhas Aereas
Source: comScore Media Metrix, Brazil Visitors Age 6+ Home/Work Location, Dec-2011
+42%
7,000
9,000
11,000
13,000
15,000
17,000
Dec-2010 Dec-2011
Travel Visitor (000) Growth
50© comScore, Inc. Proprietary.
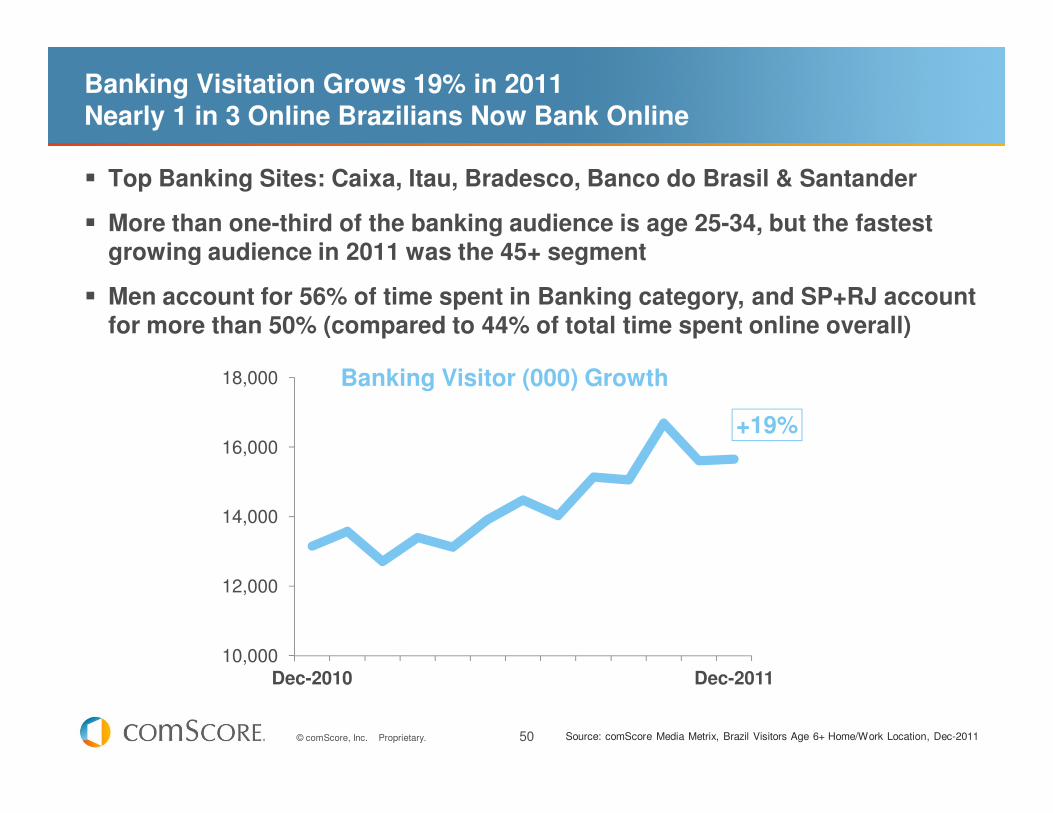
Banking Visitation Grows 19% in 2011 Nearly 1 in 3 Online Brazilians Now Bank Online
Top Banking Sites: Caixa, Itau, Bradesco, Banco do Brasil & Santander
More than one-third of the banking audience is age 25-34, but the fastest growing audience in 2011 was the 45+ segment
Men account for 56% of time spent in Banking category, and SP+RJ account for more than 50% (compared to 44% of total time spent online overall)
Source: comScore Media Metrix, Brazil Visitors Age 6+ Home/Work Location, Dec-2011
+19%
10,000
12,000
14,000
16,000
18,000
Dec-2010 Dec-2011
Banking Visitor (000) Growth
51© comScore, Inc. Proprietary.
SMARTPHONES AND TABLETS FUEL THE RISE OF THE DIGITAL OMNIVORE
52© comScore, Inc. Proprietary.
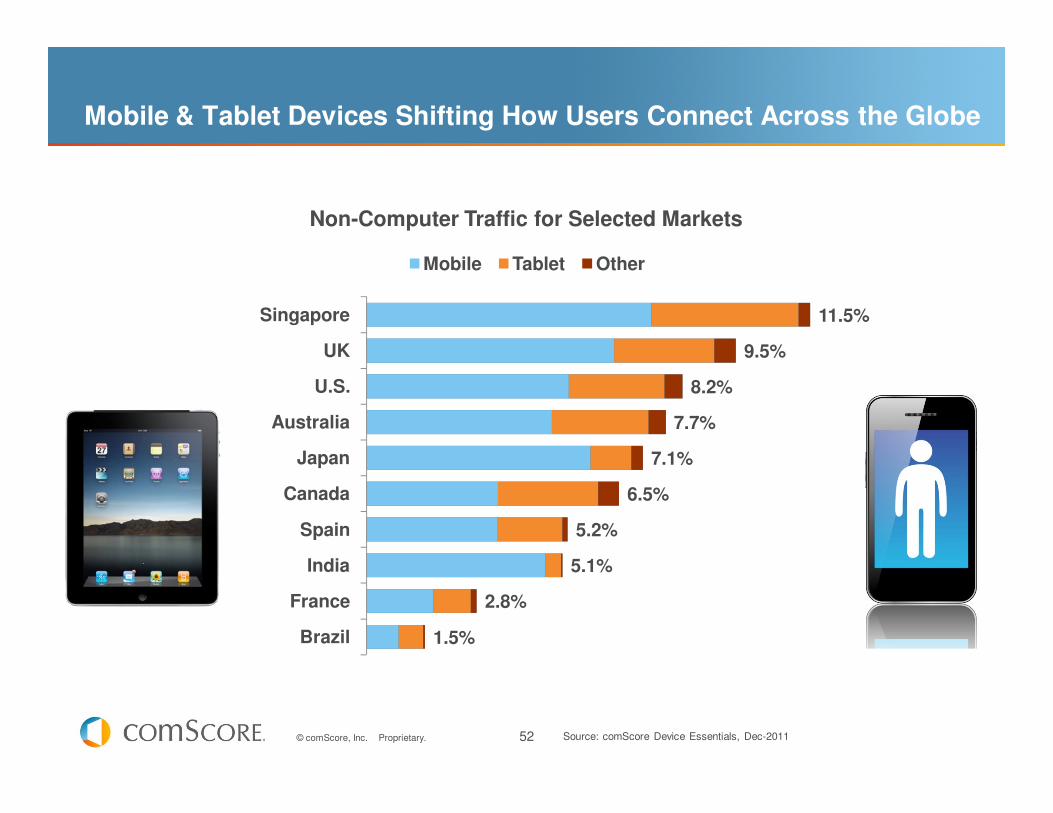
11.5%
9.5%
8.2%
7.7%
7.1%
6.5%
5.2%
5.1%
2.8%
1.5%
Singapore
UK
U.S.
Australia
Japan
Canada
Spain
India
France
Brazil
Non-Computer Traffic for Selected Markets
Mobile Tablet Other
Mobile & Tablet Devices Shifting How Users Connect Across the Globe
Source: comScore Device Essentials, Dec-2011
53© comScore, Inc. Proprietary.
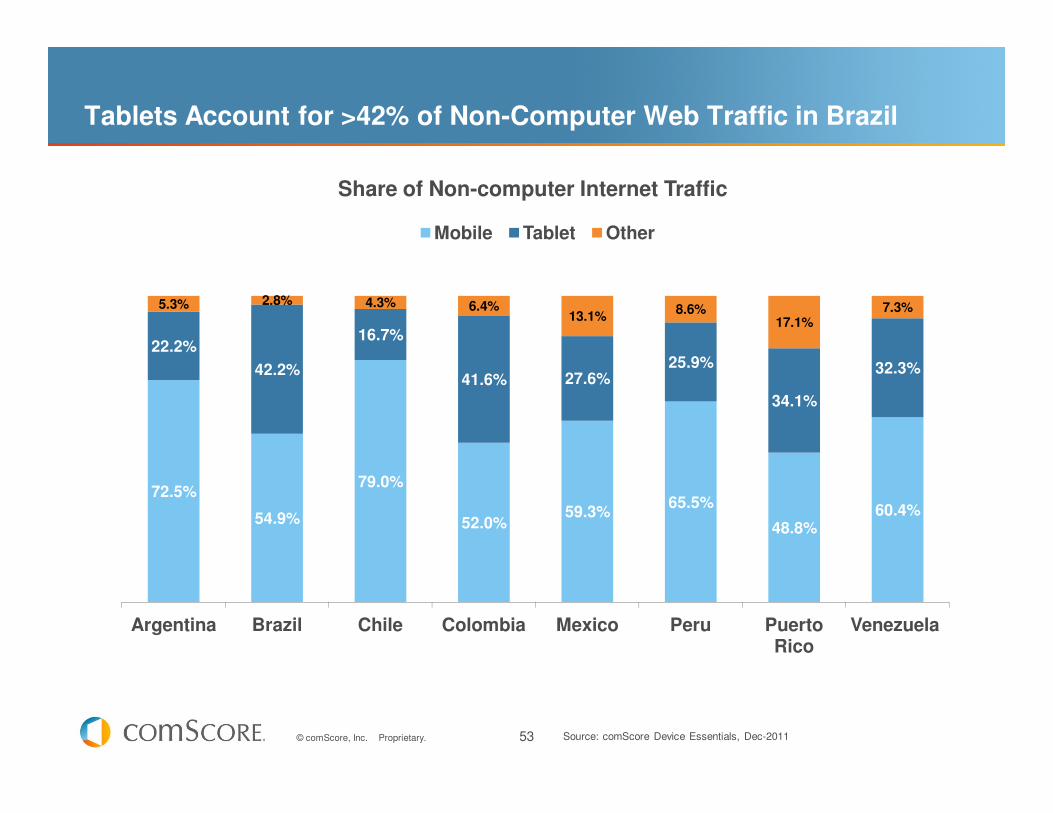
72.5%
54.9%
79.0%
52.0%59.3%
65.5%
48.8%60.4%
22.2%
42.2%
16.7%
41.6% 27.6%25.9%
34.1%
32.3%
5.3% 2.8% 4.3% 6.4%13.1%
8.6%17.1%
7.3%
Argentina Brazil Chile Colombia Mexico Peru Puerto Rico
Venezuela
Share of Non-computer Internet Traffic
Mobile Tablet Other
Tablets Account for >42% of Non-Computer Web Traffic in Brazil
Source: comScore Device Essentials, Dec-2011
54© comScore, Inc. Proprietary.
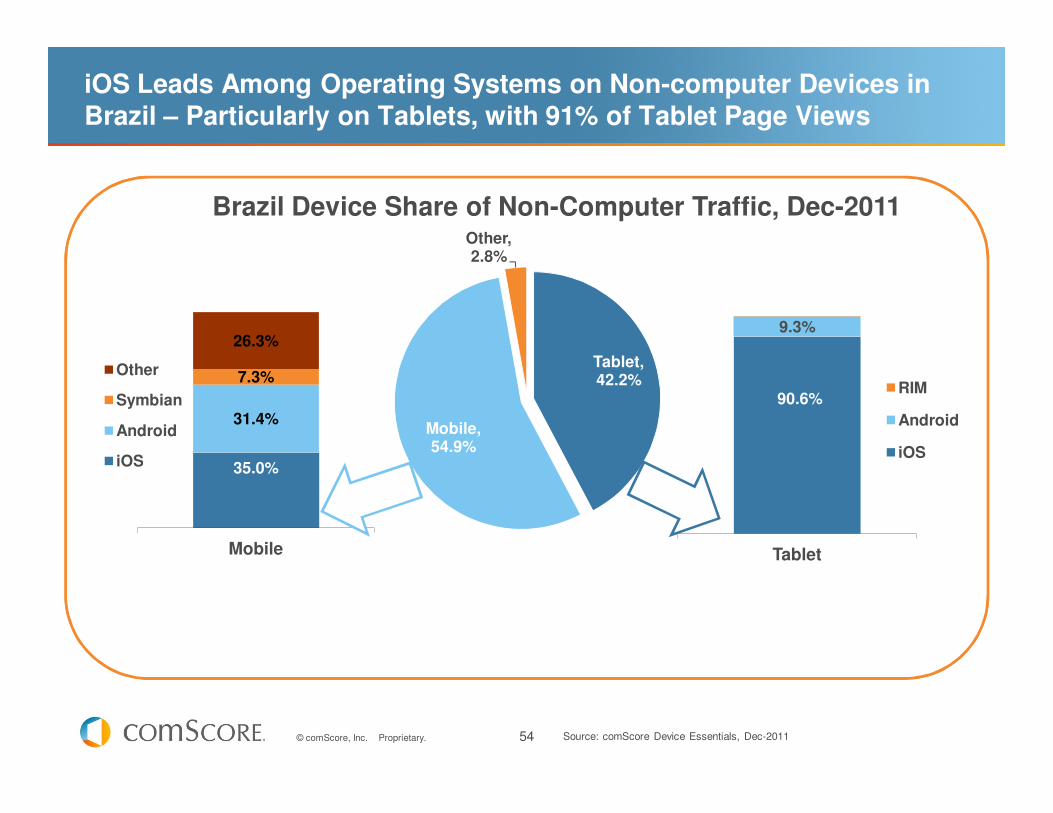
iOS Leads Among Operating Systems on Non-computer Devices in Brazil – Particularly on Tablets, with 91% of Tablet Page Views
Tablet, 42.2%
Mobile, 54.9%
Other, 2.8%
35.0%
31.4%
7.3%
26.3%
Mobile
Other
Symbian
Android
iOS
Source: comScore Device Essentials, Dec-2011
Brazil Device Share of Non-Computer Traffic, Dec-2011
90.6%
9.3%
Tablet
RIM
Android
iOS
55© comScore, Inc. Proprietary.
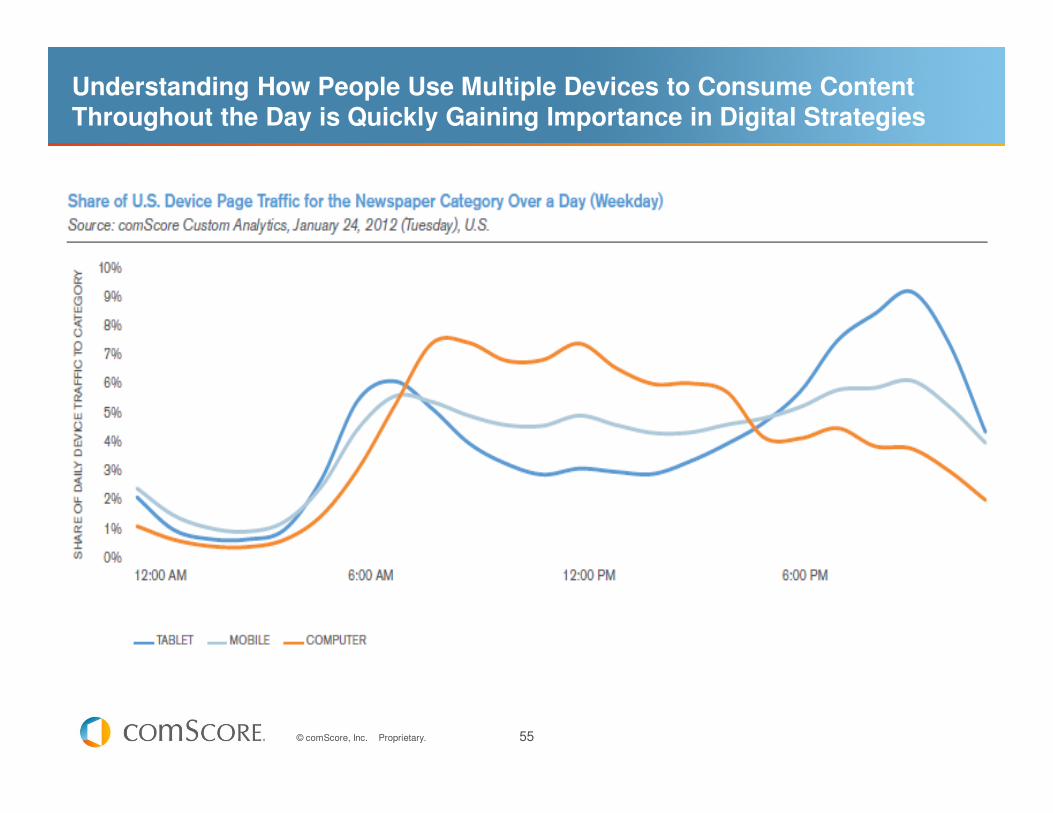
Understanding How People Use Multiple Devices to Consume Content Throughout the Day is Quickly Gaining Importance in Digital Strategies
56© comScore, Inc. Proprietary.
CONCLUSIONS
57© comScore, Inc. Proprietary.
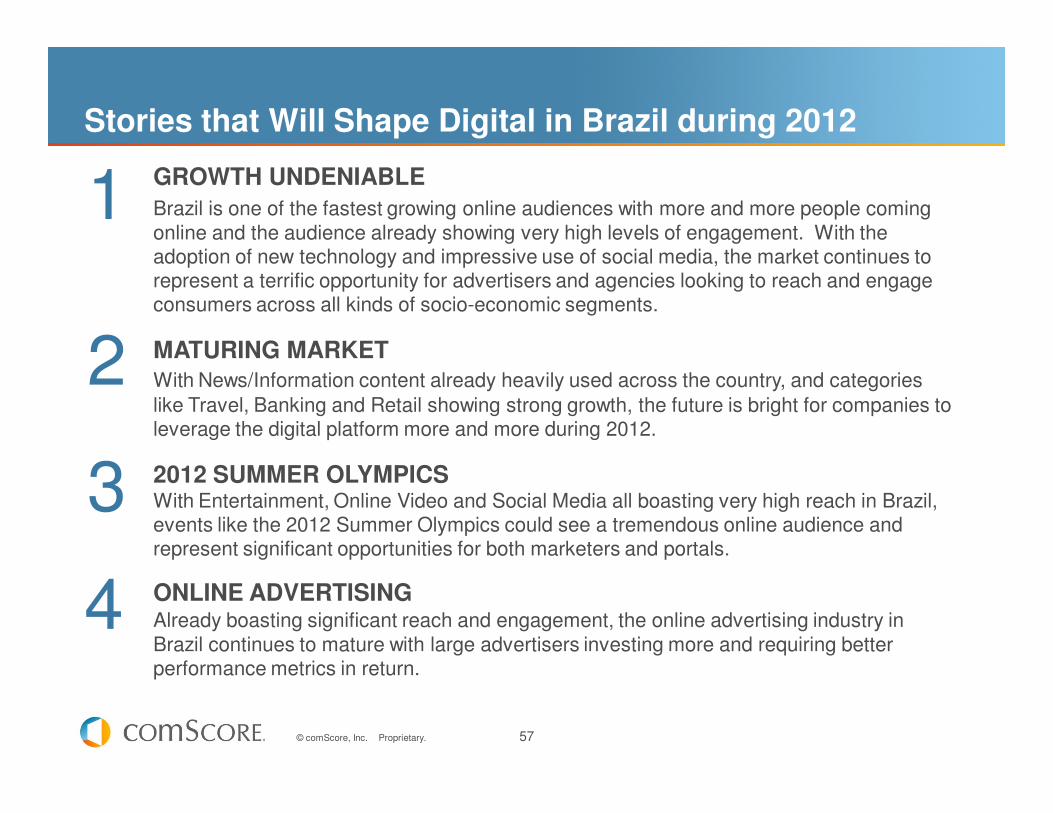
GROWTH UNDENIABLEBrazil is one of the fastest growing online audiences with more and more people coming online and the audience already showing very high levels of engagement. With the adoption of new technology and impressive use of social media, the market continues to represent a terrific opportunity for advertisers and agencies looking to reach and engage consumers across all kinds of socio-economic segments.
MATURING MARKETWith News/Information content already heavily used across the country, and categories like Travel, Banking and Retail showing strong growth, the future is bright for companies to leverage the digital platform more and more during 2012.
2012 SUMMER OLYMPICS With Entertainment, Online Video and Social Media all boasting very high reach in Brazil, events like the 2012 Summer Olympics could see a tremendous online audience and represent significant opportunities for both marketers and portals.
ONLINE ADVERTISINGAlready boasting significant reach and engagement, the online advertising industry in Brazil continues to mature with large advertisers investing more and requiring better performance metrics in return.
1
3
4
Stories that Will Shape Digital in Brazil during 2012
2