Embed Size (px)
Citation preview

Unique & Sleek: Continued Growth in Vehicle
Modification
Mary-Beth Kellenberger, Senior ConsultantTonya Fowler, Director of Competitive Benchmarking Services
Automotive & TransportationJuly 22, 2008
2
Focus Points
• Uniqueness: The Driving Factor Behind Modification
• Background and Research Objectives
• General Population Study
• Modification Enthusiast Study
• Conclusions

3
Uniqueness: The Driving Factor Behind Modification
• Most enthusiasts, and as Frost & Sullivan’s research indicates, many general vehicle owners, see modern vehicles as a tabula rasa, a blank canvas that needs their added touch to make it complete.
• Modification is made easier by modern society’s access to:
• Design software
• Customized manufacturing
• Social structure that supports individuality
• The aftermarket modification industry produces retail revenues of more than $37 billion a year.
• Aftermarket modification is a growing industry as U.S. vehicle owners continue to expand the use of their vehicles or further deepen their appeal.

4
Background and Research Objectives

5
Background and Research Objectives
Frost & Sullivan conducted a similar investigation into vehicle owner modification
behaviours in 2006. The current study is an update to the 2006 study and
provides insight into behavioural changes between 2006 and 2008.
The primary objective was to measure the behaviour of U.S. vehicle owners who have
performed at least three aftermarket vehicle modifications within the past year.
Supporting this primary objective, this research:
• Measured the types of vehicle modifications typically performed
• Identified the level of experience among modification enthusiasts
• Delineated the modification process
• Captured modification spend and spending trends
• Determined who modification enthusiasts are – based on owner demographics and
vehicles brands demographics
General Population Survey• Web-based survey where respondents
were invited to participate• 1,000 U.S. vehicle owners• Data collected January to March 2008
Modification Enthusiast Survey• Web-based survey where respondents
were invited to participate• 505 modification enthusiasts, vehicle owners
who have performed at least three vehicle modifications within the past 12 months.
• Data collected January to March 2008

6
General Population Study

7
High Interest in Modification Amongst the General Population Survey
• Approximately 57% of the general U.S. population completed a vehicle modification in the past year.
• Tire modifications continue to be the most popular.
• The largest proportion own medium/large vehicles
• Vehicle owners across every segment (luxury, SUV, Medium etc.) perform vehicle modifications consistently.
• Those with higher incomes perform significantly more vehicle modifications

8
Vehicle Modification Process…Comparative Analysis
42%
14%
14%
12%
11%
10%
8%
8%
8%
7%
7%
6%
6%
6%
6%
4%
44%
38%
17%
16%
16%
13%
9%
7%
6%
9%
7%
8%
8%
7%
4%
43%
0% 10% 20% 30% 40% 50%
Tires
Electronics
Performance Brakes
Ignition System
Lighting
Accessories
Wheels
Exterior
Alarm System
Suspension
Fuel System
Air Intake
Performance Exhaust
Interior
Mounted accessories and truck accessories
Engine Modifications
None
2008 2006
No data available
No data available
Vehicle Modifications Among U.S. General Population
Source: Frost & Sullivan
With the exception of tires, alarms, and exterior, U.S. vehicle owners reported completing fewer modifications within each of the categories in 2008 versus 2006.

9
2008 U.S. General Consumers: Vehicle Modifications by Vehicle Segments
1%18%4%12%4%6%Mounted Accessories and Truck Accessories
10%17%4%10%10%11%10%Accessories
SmallPickup Truck Minivan
Medium/ LargeSUV/ CUV
Luxury/ Specialty
Types of Vehicle Modifications
49%33%51%47%41%43%44%None
4%4%1%6%2%6%4%Engine Modifications
4%8%4%6%6%12%6%Interior
6%9%4%6%7%6%Performance Exhaust
5%11%6%6%9%6%Air Intake
6%8%4%8%4%9%7%Fuel System
5%7%4%9%7%9%7%Suspension
5%9%1%8%8%13%8%Alarm System
6%10%4%8%8%10%8%Exterior
7%7%2%10%8%12%8%Wheels
13%14%8%12%7%14%11%Lighting
8%18%7%13%11%12%12%Ignition System
13%13%12%14%11%17%14%Performance Brakes
11%16%7%15%16%15%14%Electronics
36%42%39%40%47%46%42%Tires
136 212 278 83 123
Vehicle Segment
Total Sample
Sample Sizes: 1661000
Source: Frost & Sullivan

10
Modification Enthusiast Study

11
Uniqueness: The Driving Factor Behind Modification
Research indicates:
• The modification industry remains strong at this time despite concerns toward discretionary spending in light of the U.S. mortgage crisis and rising fuel prices.
• Enthusiasts in 2008 reported increased participation in vehicle modification through a rise in:
• Dollars spent
• Time allotted
• Skills
• The profile of enthusiasts has also changed. This year’s study revealed an enthusiast population more attuned to newer vehicles, luxury vehicles, and OEM parts.

12
More U.S. Modification Enthusiasts Report Modifying Domestic Make Vehicles Compared to Imports.
Import
42%Domestic
58%
Nearly six out of ten U.S. modification enthusiasts modified a domestic vehicle in 2008

13
Brand Representation in the Modified Vehicle Population
Note: General Motors and Ford Motor Company proportions
include all makes/brands - domestic or import.
1.6%
6.9%
11.0%
13.0%
23.5%
1.7%
5.3%
11.1%
24.3%25.0%
23.0%
19.5%
34.1%
0% 5% 10% 15% 20% 25% 30% 35% 40%
Others
Hyundai
Honda
Toyota/Lexus
Chrysler
Ford Motor Company
General Motors
% of Modified Vehicles % of VIO
• Domestic brands: GM, Ford, and Chrysler are the most popular amongst modification enthusiasts.
• Ford, Toyota and Hyundai brands have the same representation in modified vehicle population as they do in the VIO population.
• Honda’s presence in the modified population is higher than it VIO presence. This is likely driven by the high number of civics, accords, being modified.

14
Vehicle Type and Enthusiast Classification
Vehicle Segment Distribution Among
Enthusiasts…Comparative Analysis
23%
22%
20%
17%
13%
3%
21%
20%
23%
17%
19%
0% 20% 40%
Luxury
SUV/CUV
Medium/Large
Pickup Truck
Small
Minivan/Van
2008 2006
Data not available
Source: Frost & Sullivan
• In 2008, the percentage of respondents modifying luxury, and SUV/CUV vehicles increased.
• Respondents reporting modifying small vehicles dropped by approximately 6%.
• Enthusiasts used multiple categories to describe their enthusiasm, the following ranking represents enthusiasts classifications:
1. Light Truck
2. Classic Car
3. Hot Rod
4. Modern Vehicle
5. Tuner
6. Other

15
Vehicle Modifications Completed in Past 12 Months…Comparative Analysis
83%
65%
56%
55%
53%
50%
49%
48%
48%
45%
45%
40%
37%
35%
33%
32%
78%
67%
54%
54%
52%
37%
39%
32%
51%
39%
36%
38%
32%
27%
0% 20% 40% 60% 80% 100%
Tires
Electronics
Accessories
Lighting
Wheels
Exterior
Performance Brakes
Ignition System
Suspension
Interior
Performance Exhaust
Air Intake
Alarm System
Engine Modifications
Mounted Accessories and Truck Accessories
Fuel system
2008 2006
Data not available.
Data not available.
Vehicle Modifications Among Modification Enthusiasts
Increase from 2006
Source: Frost & Sullivan
In general, modification enthusiasts increased their participation across most of the product categories.

16
Years Modifying Vehicles…Comparative
Analysis
8%
18%
31%
16%
29%
11%
17%
29%
18%
25%
0% 10% 20% 30% 40% 50%
Less Than 1
Year
1-2 Years
3-5 Years
6-10 Years
More Than 10
Years
2008 2006
Number of Vehicles Modified…Comparative
Analysis
15%
25%
21%
9%
30%
19%
20%
21%
10%
30%
0% 10% 20% 30% 40% 50%
1
2
3
4
5 or More
2008 2006
Experience of Modification Enthusiasts
Experienced Modification Enthusiasts
Experienced Modification Enthusiasts
76% of enthusiasts fall into the experienced enthusiast category.
In the long run, the industry will need new enthusiasts to sustain it. On both
measurements of interest, years modifying and number of vehicles, first time participants were down from 2006.
Source: Frost & Sullivan

17
2008 U.S. Modification Enthusiasts: Vehicle Modifications by Vehicle Segments
30%47%-27%41%28%33%Mounted Accessories and Truck Accessories
41%22%8%32%31%42%32%Fuel System
36%26%15%34%32%45%35%Engine Modifications
62%38%38%46%60%61%53%Wheels
SmallPickup Truck
Mini-van
Medium/ Large
SUV/ CUV
Luxury/ Special
-ty
Types of Vehicle Modifications
41%27%38%34%41%45%37%Alarm System
45%41%8%31%43%48%40%Air Intake
44%51%-31%54%50%45%Performance Exhaust
52%33%46%31%49%57%45%Interior
45%47%38%43%51%52%48%Suspension
58%43%31%44%50%52%48%Ignition System
50%41%31%52%46%56%49%Performance Brakes
59%43%46%45%52%54%50%Exterior
58%45%38%61%59%54%55%Lighting
58%45%54%59%58%59%56%Accessories
65%61%69%66%67%63%65%Electronics
82%78%77%84%91%80%83%Tires
115 111 101 13 88
Vehicle Segment
Total Sample
Sample Sizes: 66505Vehicle Segment Distribution Among
Enthusiasts…Comparative Analysis
23%
22%
20%
17%
13%
3%
21%
20%
23%
17%
19%
0% 20% 40%
Luxury
SUV/CUV
Medium/Large
Pickup Truck
Small
Minivan/Van
2008 2006
Data not available
Source: Frost & Sullivan

18
Vehicle
No
37%
Yes
63%
Nearly Two-Thirds of U.S. Modification Enthusiasts Considered The Availability of Modification Components When They Purchased Their Current Vehicle
Considered Modification Components When Purchased Current Vehicle
Source: Frost & Sullivan

19
Nearly Two-Thirds of U.S. Modification Enthusiasts Report Having Modifications Installed at Dealerships at the Time of Purchase
Modification Installed at
Dealership
(N=307)
Yes
64%
No
36%
Source: Frost & Sullivan

20
Type of Parts Purchased...Comparitive Analysis
37%
11%
6%
36%
43%
12%
9%
45%
0% 10% 20% 30% 40% 50%
Original equipment products
(OEM)
Aftermarket products
Japanese domestic products
(JDM)
Don’t know/can’t say
2008 2006
OEM Products Appear to Have Gained More Popularity Over Aftermarket Products Since 2006
Source: Frost & Sullivan

21
Amount Spent on Current Vehicle Modifications
11%
18%
24%
20%
20%
2%
4%
0% 10% 20% 30%
Less than $500
$501 to $1,000
$1001 to $2,000
$2,001 to $3,000
$3,001 to $5,000
More than $5,000
Don’t know/can’t recall
High Income Enthusiasts Spend Big Bucks for Modifications
Four Out of Ten Report Spending More Than $3,000
42% are “Moderate”Spenders
40% are “Big”Spenders
Source: Frost & Sullivan
Annual Income…Comparative Analysis
12%
22%
23%
18%
18%
7%
12%
27%
29%
13%
12%
7%
0% 10% 20% 30% 40%
Less than $15,000
$15,001 to $30,000
$30,001 to $50,000
$50,001 to $80,000
$80,001 to $100,000
More than $100,000
2008 2006
36% of enthusiasts report incomes in excess of $80,000
22
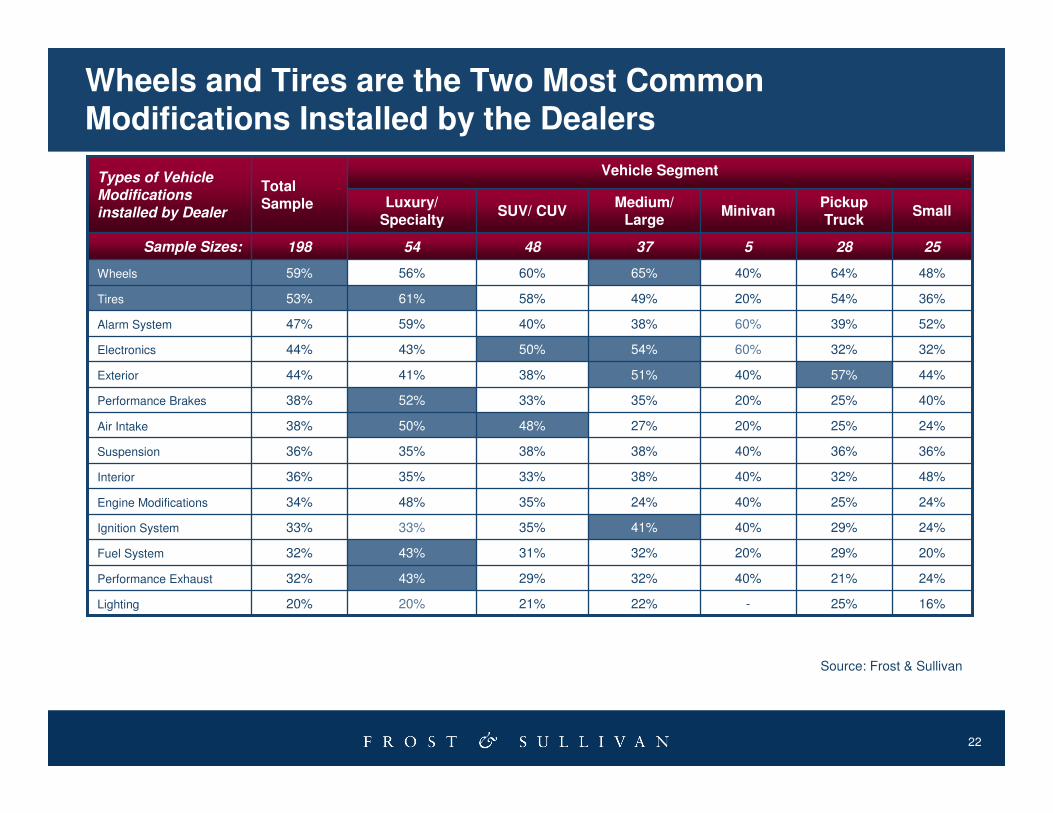
20%29%20%32%31%43%32%Fuel System
32%32%60%54%50%43%44%Electronics
SmallPickup Truck
Minivan Medium/
LargeSUV/ CUV
Luxury/ Specialty
Types of Vehicle Modifications installed by Dealer
16%25%-22%21%20%20%Lighting
24%21%40%32%29%43%32%Performance Exhaust
24%29%40%41%35%33%33%Ignition System
24%25%40%24%35%48%34%Engine Modifications
48%32%40%38%33%35%36%Interior
36%36%40%38%38%35%36%Suspension
24%25%20%27%48%50%38%Air Intake
40%25%20%35%33%52%38%Performance Brakes
44%57%40%51%38%41%44%Exterior
52%39%60%38%40%59%47%Alarm System
36%54%20%49%58%61%53%Tires
48%64%40%65%60%56%59%Wheels
54 48 37 5 28
Vehicle SegmentTotal Sample
Sample Sizes: 25198
Wheels and Tires are the Two Most Common Modifications Installed by the Dealers
Source: Frost & Sullivan

23
As Might be Expected, Air Intake and Tire/Wheel Modifications are Generally Completed First Due to Their Simplicity (Compared to Others)
2%1%17%It is an exterior modification that immediately impacts the vehicle’s look
15%11%12%It is a modification that I really like/value
235220390Sample Sizes:
1%-1%Don’t Know
--1%Other
18%17%11%It is a performance modification that immediately impacts the vehicle’s drivability
3%1%2%It is a modification that immediately impacts the vehicle’s resale value
20%8%11%It is a relatively expensive modification
8%10%8%It is a relatively inexpensive modification
21%8%6%It is a relatively complex modification
12%44%32%It is a relatively simple modification
EngineAir IntakeTires & WheelsReason for Completion
Source: Frost & Sullivan

24
Percentage Spend on "Show" vs. "Go" Features
9%
18%
46%
20%
5%
1%
1%
9%
42%
26%
12%
9%
0% 10% 20% 30% 40% 50%
0%
1-25%
26-50%
51-75%
76-99%
100%
Show Features Go Features
47% of Modification Enthusiasts report spending more than 51% of modification spending on “Go” Features.
Only 26% of the Modification Enthusiasts spend more than 51% of the modification expenses on “Show”Features.
Modification Enthusiasts Tend to Spend More on “Go”Features Compared to “Show” Features
Source: Frost & Sullivan

25
Theme is Important and Paint is the Most Commonly Used Component to Determine a Theme
Componenets That Help Determine Theme
73%
67%
60%
60%
56%
56%
56%
55%
49%
42%
38%
0% 20% 40% 60% 80% 100%
Paints
Interior accessories
Wheels
Exterior accessories
Seats
Engine
Body kits, spoilers, grill
Electronics
Suspension
Brakes
Neon and LED lighting
Choice of Theme for Vehicle Modification
(N=505)
45%
38%
17%
0% 20% 40% 60%
Yes
No, but I
develop a
general theme
or concept as I
go.
No, I do not
follow a
general theme
or concept.
Source: Frost & Sullivan
26
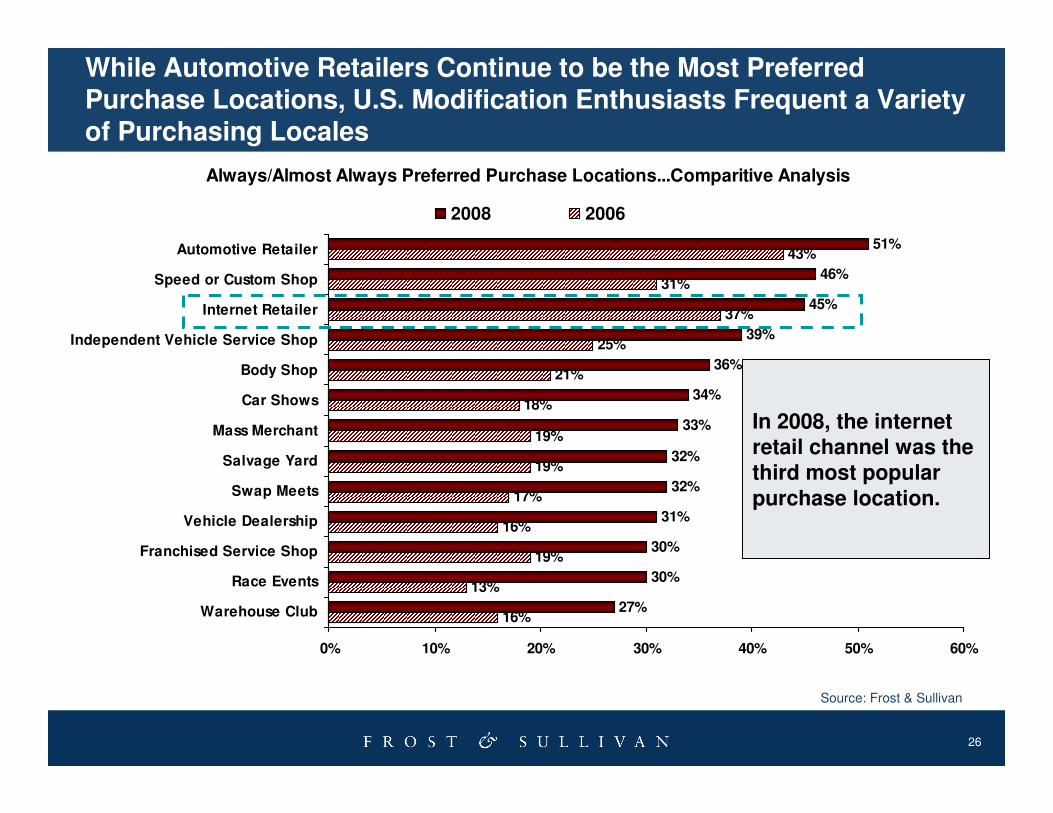
Always/Almost Always Preferred Purchase Locations...Comparitive Analysis
46%
45%
39%
36%
34%
33%
32%
32%
31%
30%
30%
27%
43%
31%
37%
25%
21%
18%
19%
19%
17%
16%
19%
13%
16%
51%
0% 10% 20% 30% 40% 50% 60%
Automotive Retailer
Speed or Custom Shop
Internet Retailer
Independent Vehicle Service Shop
Body Shop
Car Shows
Mass Merchant
Salvage Yard
Swap Meets
Vehicle Dealership
Franchised Service Shop
Race Events
Warehouse Club
2008 2006
While Automotive Retailers Continue to be the Most Preferred Purchase Locations, U.S. Modification Enthusiasts Frequent a Variety of Purchasing Locales
Source: Frost & Sullivan
In 2008, the internet retail channel was the third most popular purchase location.

27
Accessory Purchase Locations
Source: Frost & Sullivan
Most Likely Source for Accessories
Product Modification (N=94)
29%
14%
11%
9%
9%
0% 10% 20% 30% 40%
Automotive Retailer
E-Bay or Other On-lineBidding Company
Speed or Custom Shop
Independent vehicleservice shop
Mass Merchant
On-line bidding services gain prominence as purchase location for certain types of accessories.

28
Conclusions
29
Conclusion
• Frost & Sullivan’s 2008 investigation into vehicle modification revealed that this hobby has strong appeal across a wide spectrum of vehicles and enthusiast types. This contributes to the sustainability of the industry.
• Enthusiasts in 2008 reported: • higher incomes
• higher spend levels
• higher skill levels
• and increased participation
• In 2008, cost appears to be less of a limiting factor than in 2006.
• The dealer channel has increased in importance since 2006. Much of that shift is being driven by many of the respondents recent new vehicle purchases.
• SUV/CUV and Pickup owners are strong participants. As the population of the these vehicles declines, it will be interesting to see if consumer’s interest in modification translates over to other vehicle types.

30
Your Feedback is Important to Us
Emerging Product & Service Trends?
Strategic Positioning?
Growth Forecasts?
Competitive Structure?
Customer Research?
Other?Please inform us by taking our survey.
What would you like to see from Frost & Sullivan?

31
For Additional Information
• To leave a comment, ask the analyst a question, or receive the free audio segment that accompanies this presentation, please contact Stephanie Ochoa, Analyst Briefing Coordinator, at (210) 247-2421 or via email, [email protected].