Embed Size (px)
Citation preview

© Copyright 2012 WNS (Holdings) Ltd. All rights reserved
Adding Teeth to Your Finance Shared
Services Organization
15th Annual Australasia Shared
Services & Outsourcing Week
April 16–19, 2012
Melbourne Australasia
1 © Copyright 2012 WNS (Holdings) Ltd. All rights reserved
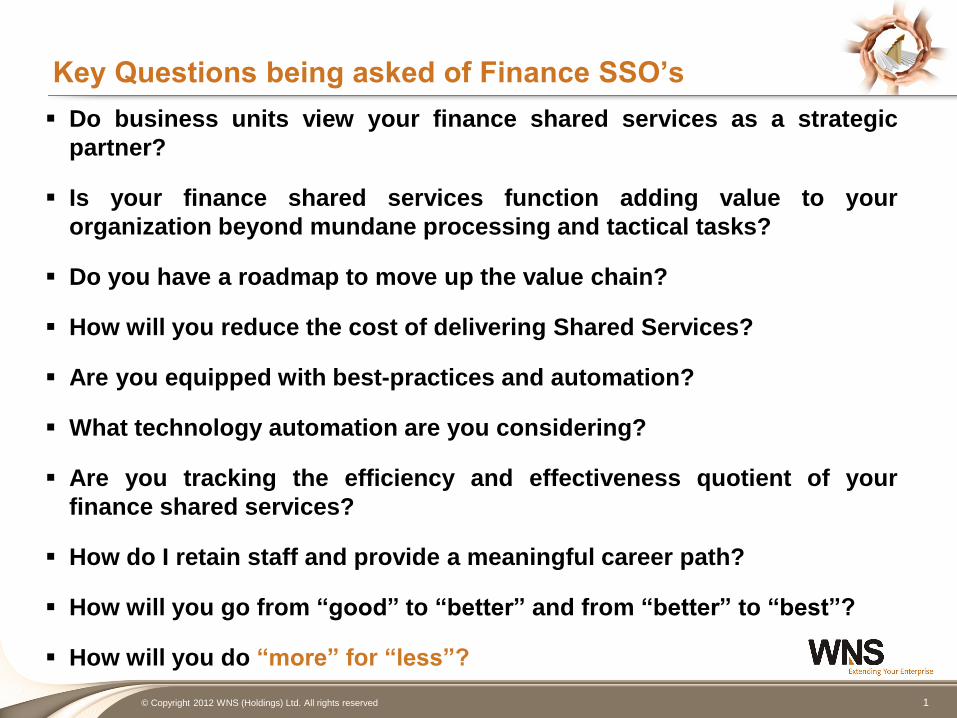
Key Questions being asked of Finance SSO’s
Do business units view your finance shared services as a strategic
partner?
Is your finance shared services function adding value to your
organization beyond mundane processing and tactical tasks?
Do you have a roadmap to move up the value chain?
How will you reduce the cost of delivering Shared Services?
Are you equipped with best-practices and automation?
What technology automation are you considering?
Are you tracking the efficiency and effectiveness quotient of your
finance shared services?
How do I retain staff and provide a meaningful career path?
How will you go from “good” to “better” and from “better” to “best”?
How will you do “more” for “less”?
2 © Copyright 2012 WNS (Holdings) Ltd. All rights reserved
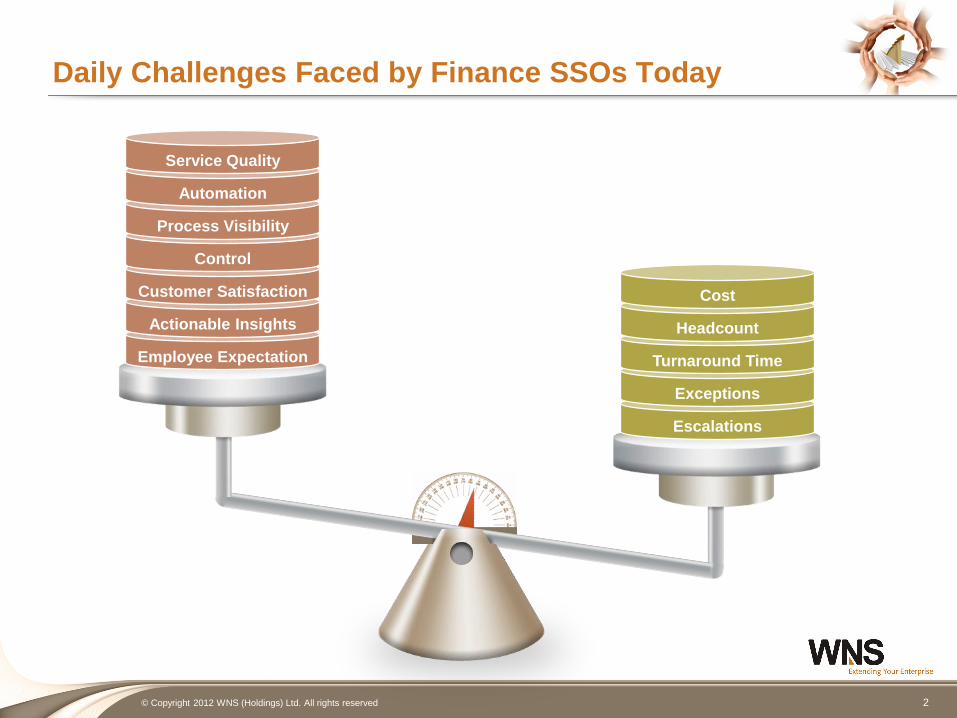
Daily Challenges Faced by Finance SSOs Today
Employee Expectation
Actionable Insights
Customer Satisfaction
Control
Process Visibility
Automation
Service Quality
Escalations
Exceptions
Turnaround Time
Headcount
Cost
3 © Copyright 2012 WNS (Holdings) Ltd. All rights reserved
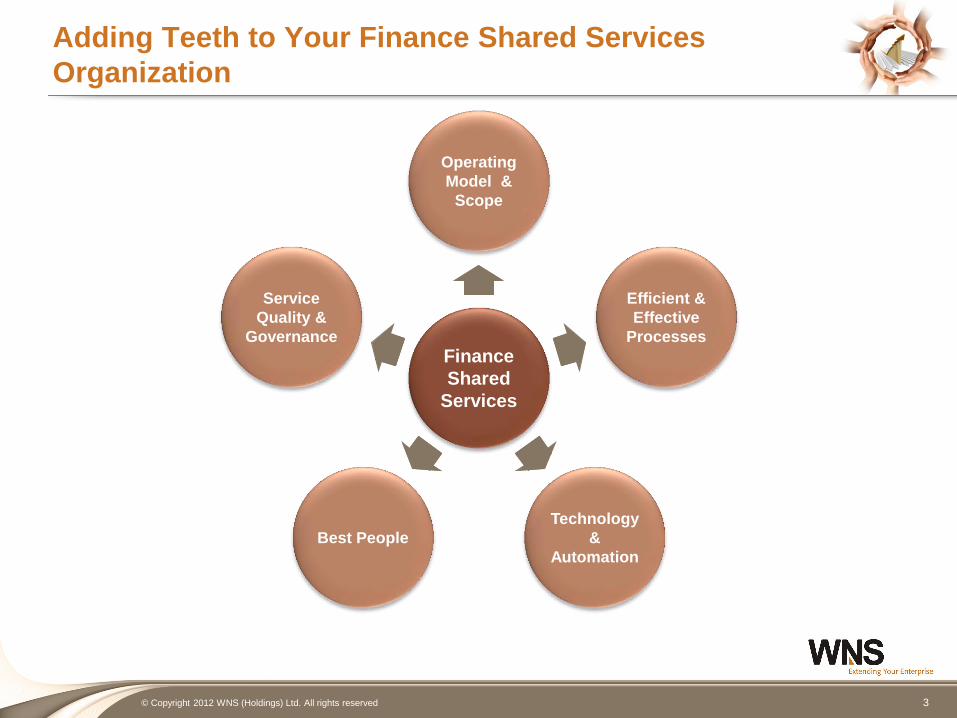
Adding Teeth to Your Finance Shared Services
Organization
Finance
Shared
Services
Operating
Model &
Scope
Efficient &
Effective
Processes
Technology
&
Automation
Best People
Service
Quality &
Governance
4 © Copyright 2012 WNS (Holdings) Ltd. All rights reserved
Pillars for Moving up the Value Chain
5 © Copyright 2012 WNS (Holdings) Ltd. All rights reserved
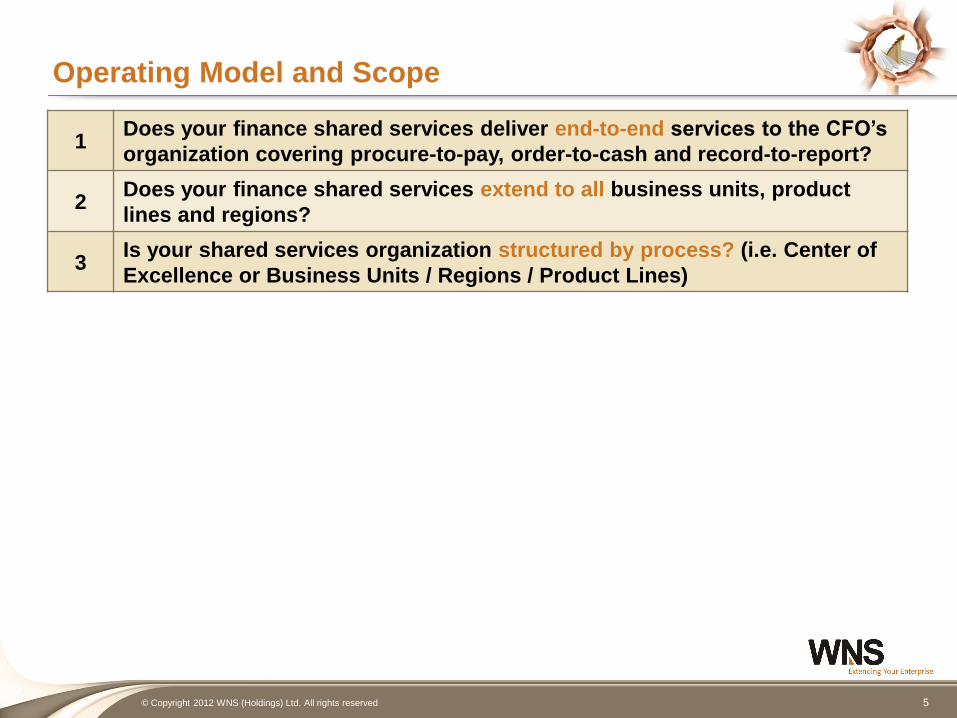
Operating Model and Scope
1 Does your finance shared services deliver end-to-end services to the CFO’s
organization covering procure-to-pay, order-to-cash and record-to-report?
2 Does your finance shared services extend to all business units, product
lines and regions?
3 Is your shared services organization structured by process? (i.e. Center of
Excellence or Business Units / Regions / Product Lines)
6 © Copyright 2012 WNS (Holdings) Ltd. All rights reserved
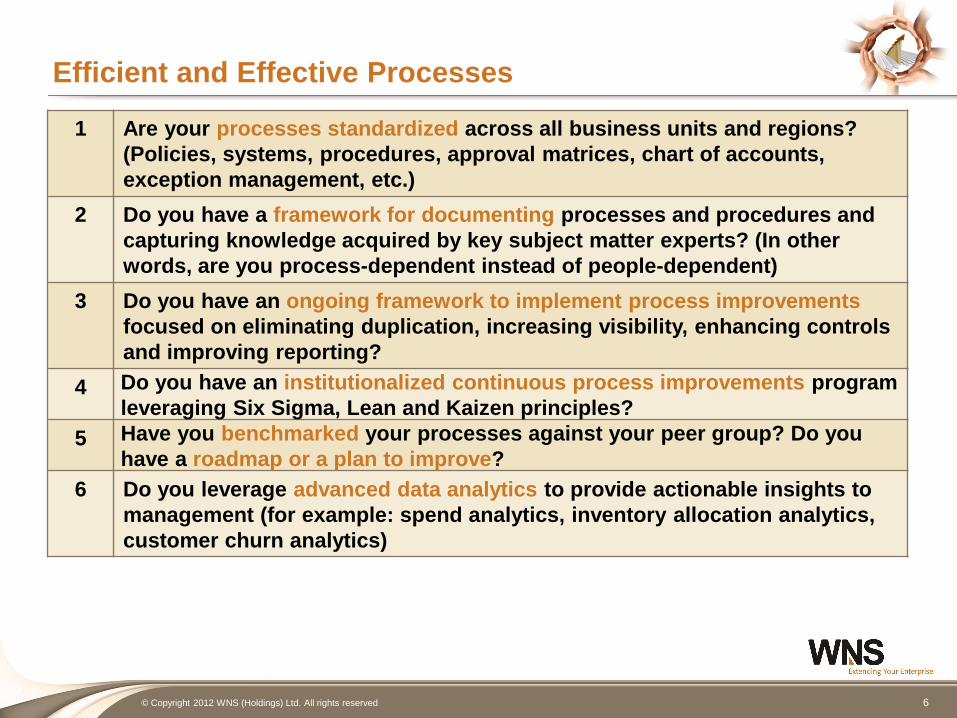
Efficient and Effective Processes
1 Are your processes standardized across all business units and regions?
(Policies, systems, procedures, approval matrices, chart of accounts,
exception management, etc.)
2 Do you have a framework for documenting processes and procedures and
capturing knowledge acquired by key subject matter experts? (In other
words, are you process-dependent instead of people-dependent)
3 Do you have an ongoing framework to implement process improvements
focused on eliminating duplication, increasing visibility, enhancing controls
and improving reporting?
4 Do you have an institutionalized continuous process improvements program
leveraging Six Sigma, Lean and Kaizen principles?
5 Have you benchmarked your processes against your peer group? Do you
have a roadmap or a plan to improve?
6 Do you leverage advanced data analytics to provide actionable insights to
management (for example: spend analytics, inventory allocation analytics,
customer churn analytics)
7 © Copyright 2012 WNS (Holdings) Ltd. All rights reserved
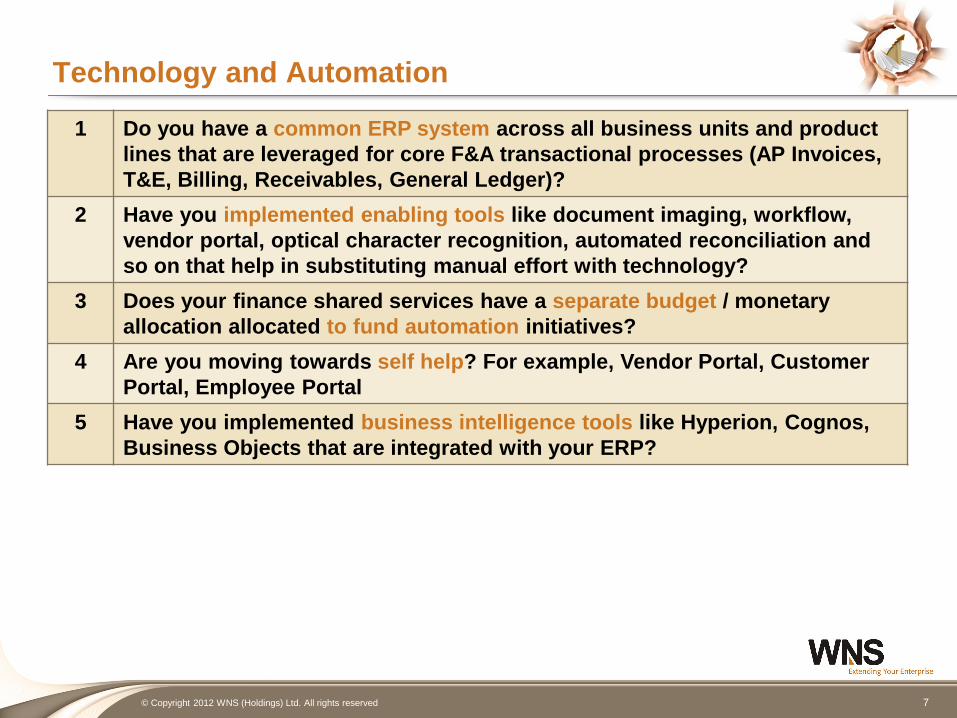
Technology and Automation
1 Do you have a common ERP system across all business units and product
lines that are leveraged for core F&A transactional processes (AP Invoices,
T&E, Billing, Receivables, General Ledger)?
2 Have you implemented enabling tools like document imaging, workflow,
vendor portal, optical character recognition, automated reconciliation and
so on that help in substituting manual effort with technology?
3 Does your finance shared services have a separate budget / monetary
allocation allocated to fund automation initiatives?
4 Are you moving towards self help? For example, Vendor Portal, Customer
Portal, Employee Portal
5 Have you implemented business intelligence tools like Hyperion, Cognos,
Business Objects that are integrated with your ERP?
8 © Copyright 2012 WNS (Holdings) Ltd. All rights reserved
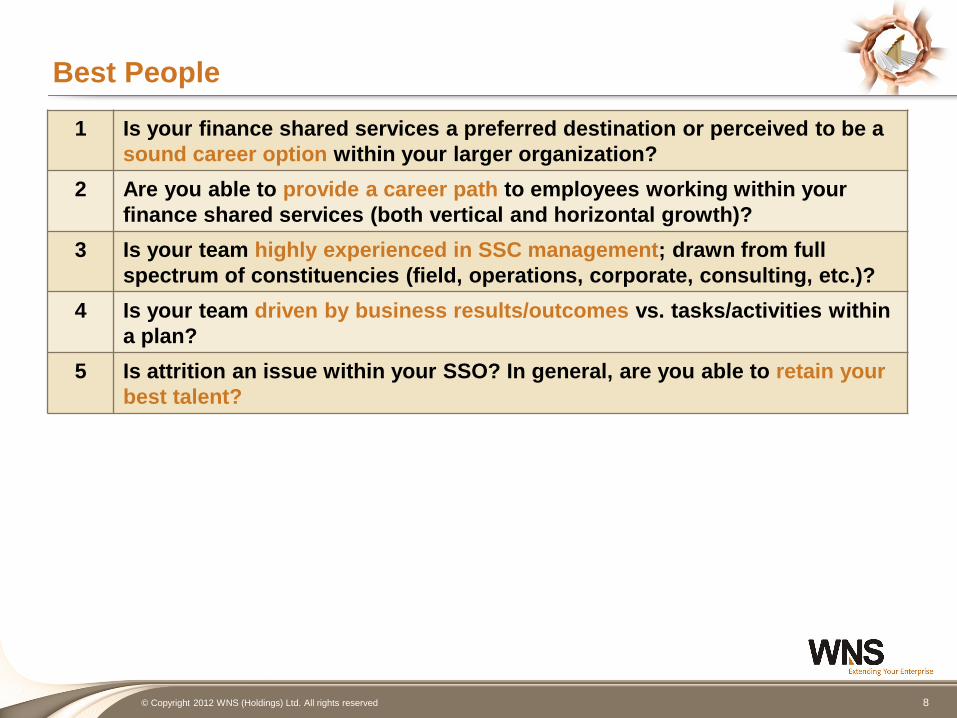
Best People
1 Is your finance shared services a preferred destination or perceived to be a
sound career option within your larger organization?
2 Are you able to provide a career path to employees working within your
finance shared services (both vertical and horizontal growth)?
3 Is your team highly experienced in SSC management; drawn from full
spectrum of constituencies (field, operations, corporate, consulting, etc.)?
4 Is your team driven by business results/outcomes vs. tasks/activities within
a plan?
5 Is attrition an issue within your SSO? In general, are you able to retain your
best talent?
9 © Copyright 2012 WNS (Holdings) Ltd. All rights reserved
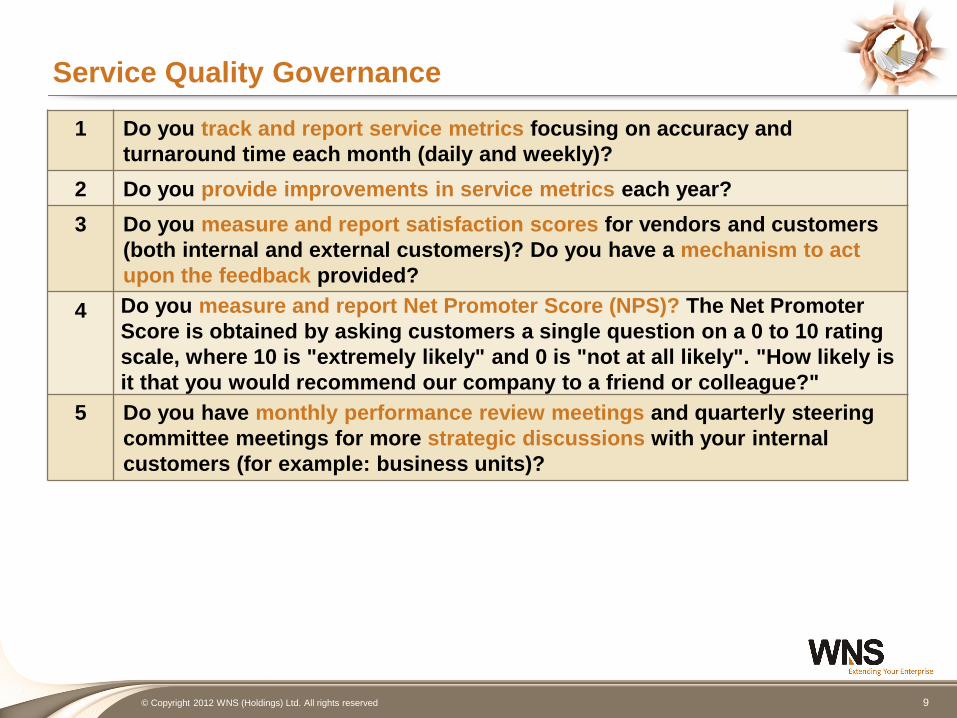
Service Quality Governance
1 Do you track and report service metrics focusing on accuracy and
turnaround time each month (daily and weekly)?
2 Do you provide improvements in service metrics each year?
3 Do you measure and report satisfaction scores for vendors and customers
(both internal and external customers)? Do you have a mechanism to act
upon the feedback provided?
4 Do you measure and report Net Promoter Score (NPS)? The Net Promoter
Score is obtained by asking customers a single question on a 0 to 10 rating
scale, where 10 is "extremely likely" and 0 is "not at all likely". "How likely is
it that you would recommend our company to a friend or colleague?"
5 Do you have monthly performance review meetings and quarterly steering
committee meetings for more strategic discussions with your internal
customers (for example: business units)?
10 © Copyright 2012 WNS (Holdings) Ltd. All rights reserved
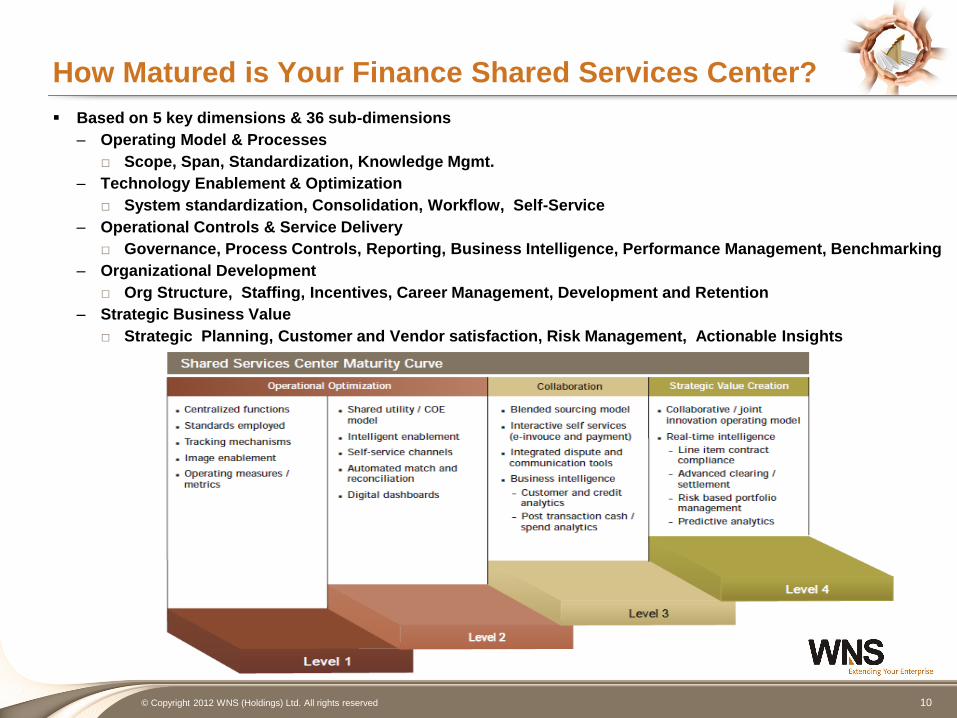
How Matured is Your Finance Shared Services Center?
Based on 5 key dimensions & 36 sub-dimensions
– Operating Model & Processes
□ Scope, Span, Standardization, Knowledge Mgmt.
– Technology Enablement & Optimization
□ System standardization, Consolidation, Workflow, Self-Service
– Operational Controls & Service Delivery
□ Governance, Process Controls, Reporting, Business Intelligence, Performance Management, Benchmarking
– Organizational Development
□ Org Structure, Staffing, Incentives, Career Management, Development and Retention
– Strategic Business Value
□ Strategic Planning, Customer and Vendor satisfaction, Risk Management, Actionable Insights
11 © Copyright 2012 WNS (Holdings) Ltd. All rights reserved
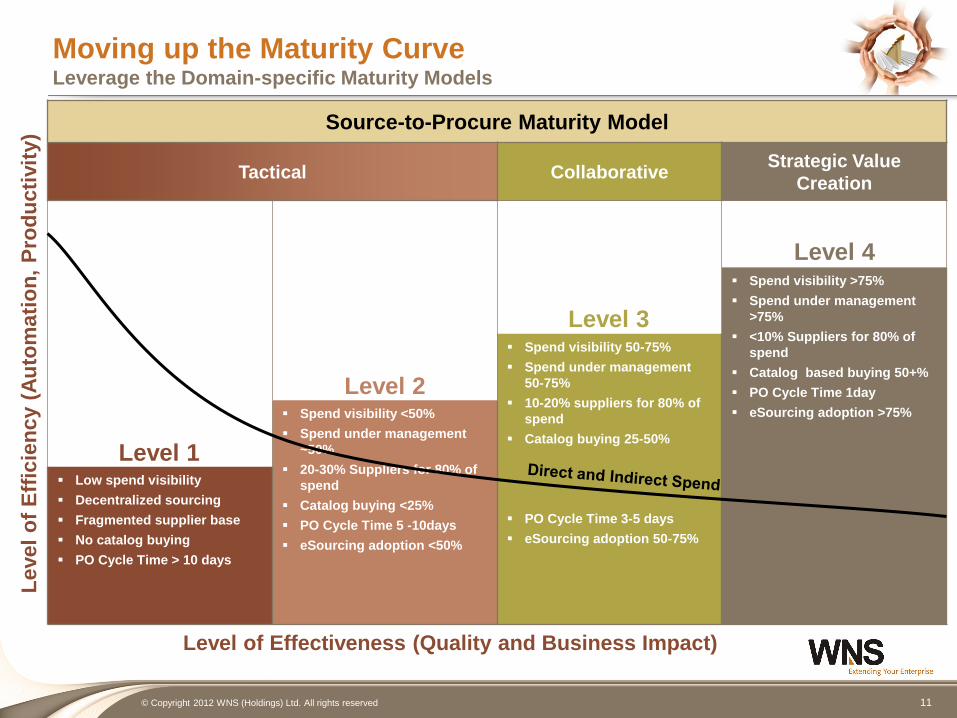
Moving up the Maturity Curve Leverage the Domain-specific Maturity Models
Source-to-Procure Maturity Model
Tactical Collaborative Strategic Value
Creation
Spend visibility >75%
Spend under management
>75%
<10% Suppliers for 80% of
spend
Catalog based buying 50+%
PO Cycle Time 1day
eSourcing adoption >75%
Spend visibility 50-75%
Spend under management
50-75%
10-20% suppliers for 80% of
spend
Catalog buying 25-50%
PO Cycle Time 3-5 days
eSourcing adoption 50-75%
Spend visibility <50%
Spend under management
~50%
20-30% Suppliers for 80% of
spend
Catalog buying <25%
PO Cycle Time 5 -10days
eSourcing adoption <50%
Low spend visibility
Decentralized sourcing
Fragmented supplier base
No catalog buying
PO Cycle Time > 10 days
Level 1
Level 2
Level 3
Level 4
Level of Effectiveness (Quality and Business Impact)
Leve
l o
f E
ffic
ien
cy (
Au
tom
ati
on
, P
rod
ucti
vit
y)
12 © Copyright 2012 WNS (Holdings) Ltd. All rights reserved
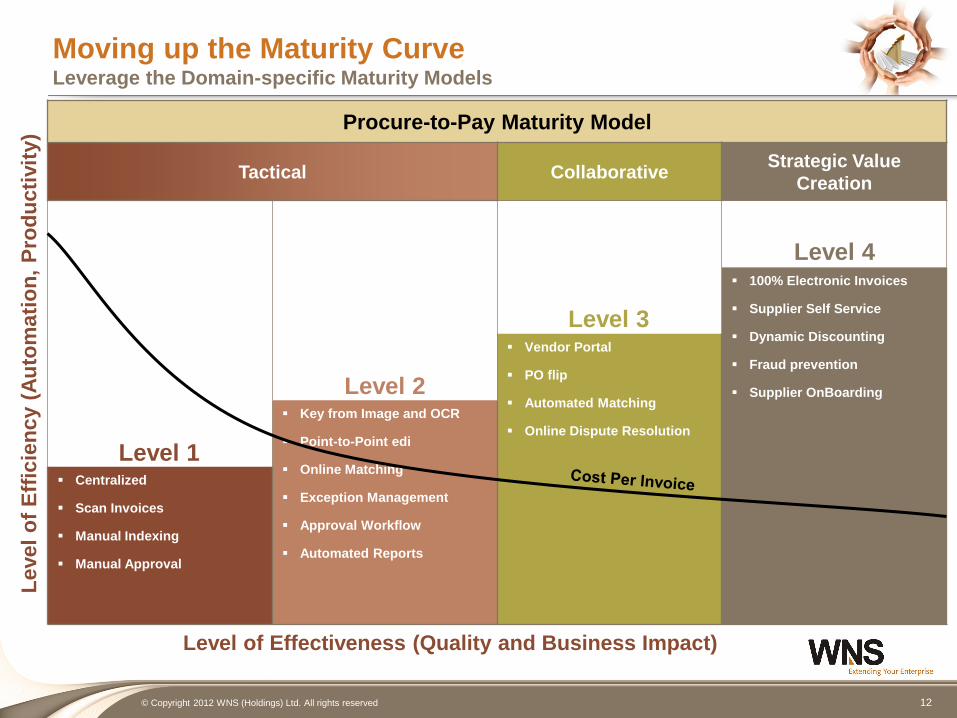
Moving up the Maturity Curve Leverage the Domain-specific Maturity Models
Procure-to-Pay Maturity Model
Tactical Collaborative Strategic Value
Creation
100% Electronic Invoices
Supplier Self Service
Dynamic Discounting
Fraud prevention
Supplier OnBoarding
Vendor Portal
PO flip
Automated Matching
Online Dispute Resolution
Key from Image and OCR
Point-to-Point edi
Online Matching
Exception Management
Approval Workflow
Automated Reports
Centralized
Scan Invoices
Manual Indexing
Manual Approval
Leve
l o
f E
ffic
ien
cy (
Au
tom
ati
on
, P
rod
ucti
vit
y)
Level of Effectiveness (Quality and Business Impact)
Level 1
Level 2
Level 3
Level 4
13 © Copyright 2012 WNS (Holdings) Ltd. All rights reserved
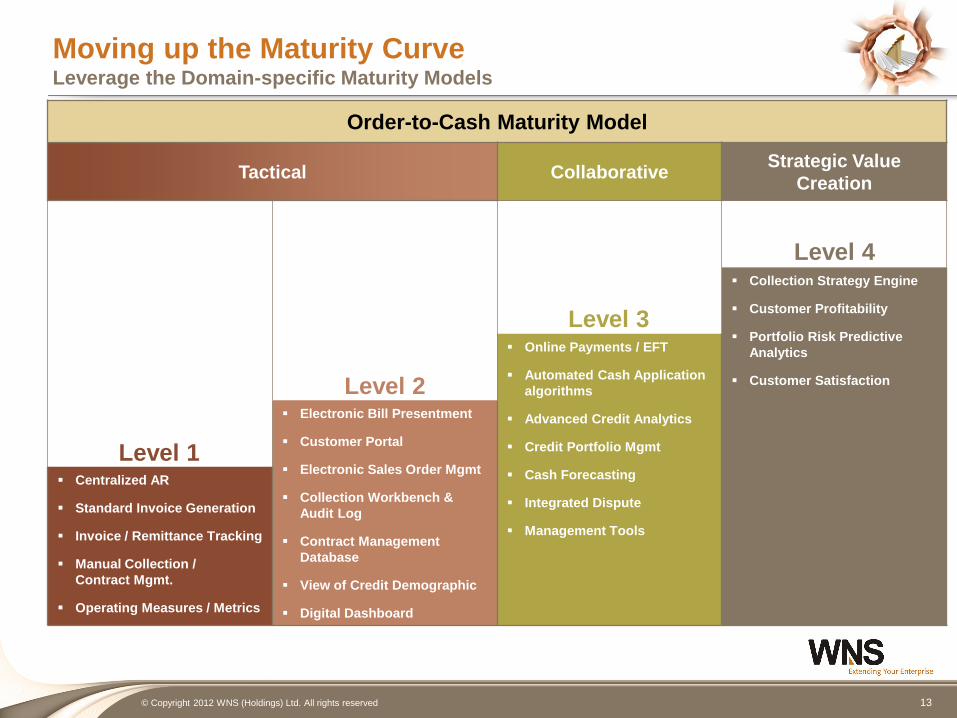
Moving up the Maturity Curve Leverage the Domain-specific Maturity Models
Order-to-Cash Maturity Model
Tactical Collaborative Strategic Value
Creation
Collection Strategy Engine
Customer Profitability
Portfolio Risk Predictive
Analytics
Customer Satisfaction
Online Payments / EFT
Automated Cash Application
algorithms
Advanced Credit Analytics
Credit Portfolio Mgmt
Cash Forecasting
Integrated Dispute
Management Tools
Electronic Bill Presentment
Customer Portal
Electronic Sales Order Mgmt
Collection Workbench &
Audit Log
Contract Management
Database
View of Credit Demographic
Digital Dashboard
Centralized AR
Standard Invoice Generation
Invoice / Remittance Tracking
Manual Collection /
Contract Mgmt.
Operating Measures / Metrics
Level 1
Level 2
Level 3
Level 4
14 © Copyright 2012 WNS (Holdings) Ltd. All rights reserved
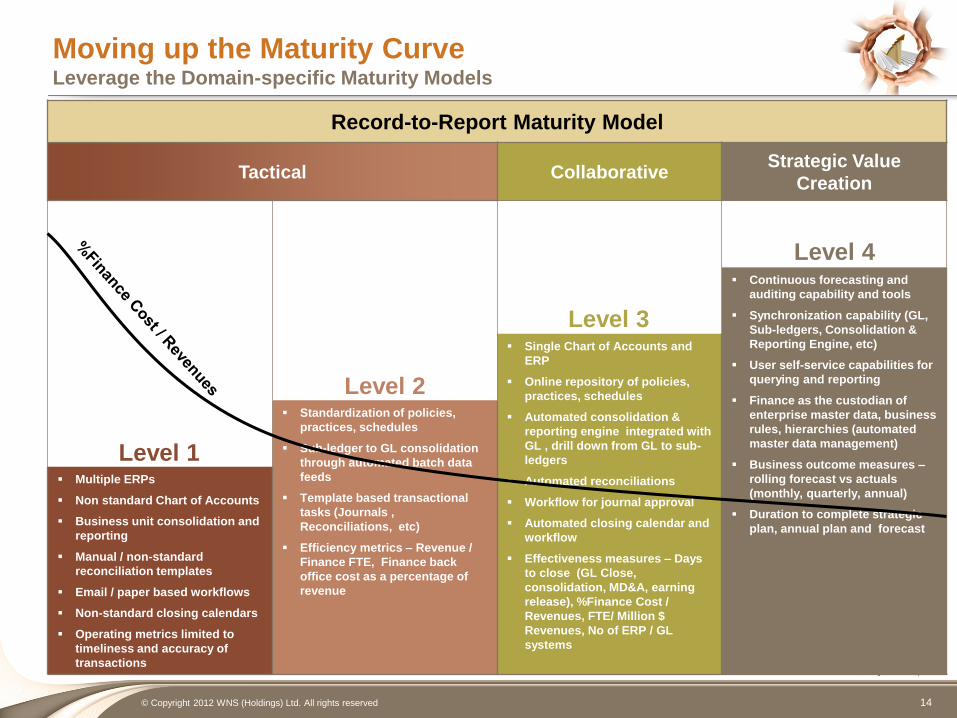
Moving up the Maturity Curve Leverage the Domain-specific Maturity Models
Record-to-Report Maturity Model
Tactical Collaborative Strategic Value
Creation
Continuous forecasting and
auditing capability and tools
Synchronization capability (GL,
Sub-ledgers, Consolidation &
Reporting Engine, etc)
User self-service capabilities for
querying and reporting
Finance as the custodian of
enterprise master data, business
rules, hierarchies (automated
master data management)
Business outcome measures –
rolling forecast vs actuals
(monthly, quarterly, annual)
Duration to complete strategic
plan, annual plan and forecast
Single Chart of Accounts and
ERP
Online repository of policies,
practices, schedules
Automated consolidation &
reporting engine integrated with
GL , drill down from GL to sub-
ledgers
Automated reconciliations
Workflow for journal approval
Automated closing calendar and
workflow
Effectiveness measures – Days
to close (GL Close,
consolidation, MD&A, earning
release), %Finance Cost /
Revenues, FTE/ Million $
Revenues, No of ERP / GL
systems
Standardization of policies,
practices, schedules
Sub-ledger to GL consolidation
through automated batch data
feeds
Template based transactional
tasks (Journals ,
Reconciliations, etc)
Efficiency metrics – Revenue /
Finance FTE, Finance back
office cost as a percentage of
revenue
Multiple ERPs
Non standard Chart of Accounts
Business unit consolidation and
reporting
Manual / non-standard
reconciliation templates
Email / paper based workflows
Non-standard closing calendars
Operating metrics limited to
timeliness and accuracy of
transactions
Level 1
Level 2
Level 3
Level 4
15 © Copyright 2012 WNS (Holdings) Ltd. All rights reserved
Next Steps Where do I go from here?
Conduct a discovery session in which
discrete opportunities are identified and
preliminarily sized / evaluated
Get organizational buy-in from key
stakeholders
Consider a formal assessment through
High Level Due Diligence:
– Will unearth clear opportunities without significant
investment
– Driven by industry practices & thought leadership,
specifically the Finance Shared Service Maturity
Model
Establish a Program:
– Leveraging existing SSC staff, technology and
other stakeholders
– Formalize as the opportunities, roadmap, and
business case become clear (i.e. Detailed Due
Diligence)
– Create timelines, define roles, assign
responsibilities
– Plan the work and work the plan!