Embed Size (px)
DESCRIPTION
This Q4 FY13 Earnings presentation includes highlights from Dell’s fourth quarter results and for the full year FY13.
Citation preview
Dell 4Q FY13 Performance Review Brian Gladden SVP, Chief Financial Officer
February 19, 2013
Rob Williams VP, Investor Relations
Tom Sweet VP, Corporate Controller
See Financial History at www.dell.com/investor Dell Investor Relations – 4Q FY13 Performance Review
Forward-Looking Statements
2
Special Note on Forward Looking Statements: Statements in this presentation that relate to future results and events (including statements about Dell’s future financial and operating performance, trends relating to macroeconomic challenges, competitive pricing pressures, effects of our server business , and government demand) are forward-looking statements and are based on Dell's current expectations. In some cases, you can identify these statements by such forward-looking words as “anticipate,” “believe,” “could,” “estimate,” “expect,” “intend,” “confidence,” “may,” “plan,” “potential,” “should,” “will” and “would,” or similar expressions. Actual results and events in future periods may differ materially from those expressed or implied by these forward-looking statements because of a number of risks, uncertainties and other factors, including: intense competition; Dell’s reliance on third-party suppliers for product components, including reliance on several single-sourced or limited-sourced suppliers; Dell’s ability to achieve favorable pricing from its vendors; weak global economic conditions and instability in financial markets; Dell’s ability to manage effectively the change involved in implementing strategic initiatives; successful implementation of Dell’s acquisition strategy; Dell’s cost-efficiency measures; Dell’s ability to effectively manage periodic product and services transitions; Dell’s ability to deliver consistent quality products and services; Dell’s ability to generate substantial non-U.S. net revenue; Dell’s product, customer, and geographic sales mix, and seasonal sales trends; the performance of Dell’s sales channel partners; access to the capital markets by Dell or its customers; weak economic conditions and additional regulation affecting our financial services activities; counterparty default; customer terminations of or pricing changes in services contracts, or Dell’s failure to perform as it anticipates at the time it enters into services contracts; loss of government contracts; Dell’s ability to obtain licenses to intellectual property developed by others on commercially reasonable and competitive terms; infrastructure disruptions; cyber attacks or other data security breaches; Dell’s ability to hedge effectively its exposure to fluctuations in foreign currency exchange rates and interest rates; expiration of tax holidays or favorable tax rate structures, or unfavorable outcomes in tax audits and other compliance matters; impairment of portfolio investments; unfavorable results of legal proceedings; Dell’s ability to attract, retain, and motivate key personnel; Dell’s ability to maintain strong internal controls; changing environmental and safety laws; the effect of armed hostilities, terrorism, natural disasters, and public health issues; and other risks and uncertainties discussed in Dell’s filings with the Securities and Exchange Commission, including its Annual Report on Form 10-K for its fiscal year ended February 3, 2012. Factors or risks that could cause our actual results to differ materially from the results we anticipate also include: (1) the occurrence of any event, change or other circumstances that could give rise to the termination of the merger agreement; (2) the inability to complete the proposed merger due to the failure to obtain stockholder approval for the proposed merger or the failure to satisfy other conditions to completion of the proposed merger, including that a governmental entity may prohibit, delay or refuse to grant approval for the consummation of the transaction; (3) the failure to obtain the necessary financing arrangements set forth in the debt and equity commitment letters delivered pursuant to the merger agreement; (4) risks related to disruption of management’s attention from the Company’s ongoing business operations due to the transaction; and (5) the effect of the announcement of the proposed merger on the Company’s relationships with its customers, operating results and business generally. Dell assumes no obligation to update its forward-looking statements. Non-GAAP Financial Measures: This presentation includes information about non-GAAP gross margin, non-GAAP operating expenses, non-GAAP operating income, non-GAAP net income, and non-GAAP earnings per share (collectively the “non-GAAP financial measures”), which are not measurements of financial performance prepared in accordance with U.S. generally accepted accounting principles. We have provided a reconciliation of the historical non-GAAP financial measures and of free cash flow, which is also a non-GAAP measure, to the most directly comparable GAAP measures in the slides captioned “Supplemental Non-GAAP Measures.” A detailed discussion of our reasons for including the non-GAAP financial measures and the limitations associated with those measures is presented in” Management’s Discussion and Analysis of Financial Condition and Results of Operations – Results of Operations - Non-GAAP Financial Measures” in Dell’s annual report on Form 10-K for the fiscal year ended February 3, 2012. We encourage investors to review the historical reconciliation and the non-GAAP discussion in conjunction with our presentation of the non-GAAP financial measures.
See Financial History at www.dell.com/investor Dell Investor Relations – 4Q FY13 Performance Review
Additional Information
3
Additional Information and Where to Find It
In connection with the proposed merger transaction, the Company will file with the SEC and furnish to the Company’s stockholders a proxy statement and other relevant documents. These materials do not constitute a solicitation of any vote or approval. Stockholders are urged to read the proxy statement when it becomes available and any other documents to be filed with the SEC in connection with the proposed merger or incorporated by reference in the proxy statement because they will contain important information about the proposed merger.
Investors will be able to obtain a free copy of documents filed with the SEC at the SEC’s website at http://www.sec.gov. In addition, investors may obtain a free copy of the Company’s filings with the SEC from the Company’s website at http://content.dell.com/us/en/corp/investor-financial-reporting.aspx or by directing a request to: Dell Inc. One Dell Way, Round Rock, Texas 78682, Attn: Investor Relations, (512) 728-7800, [email protected].
The directors, executive officers and certain other members of management and employees of the Company may be deemed “participants” in the solicitation of proxies from stockholders of the Company in favor of the proposed merger. Information regarding the persons who may, under the rules of the SEC, be considered participants in the solicitation of the stockholders of the Company in connection with the proposed merger will be set forth in the proxy statement and the other relevant documents to be filed with the SEC. You can find information about the Company’s executive officers and directors in its Annual Report on Form 10-K for the fiscal year ended February 3, 2012 and in its definitive proxy statement filed with the SEC on Schedule 14A on May 24, 2012.
See Financial History at www.dell.com/investor Dell Investor Relations – 4Q FY13 Performance Review
Dell 4Q FY13 FY13 and 4Q Earnings Review
4
Brian Gladden SVP, Chief Financial Officer
See Financial History at www.dell.com/investor Dell Investor Relations – 4Q FY13 Performance Review
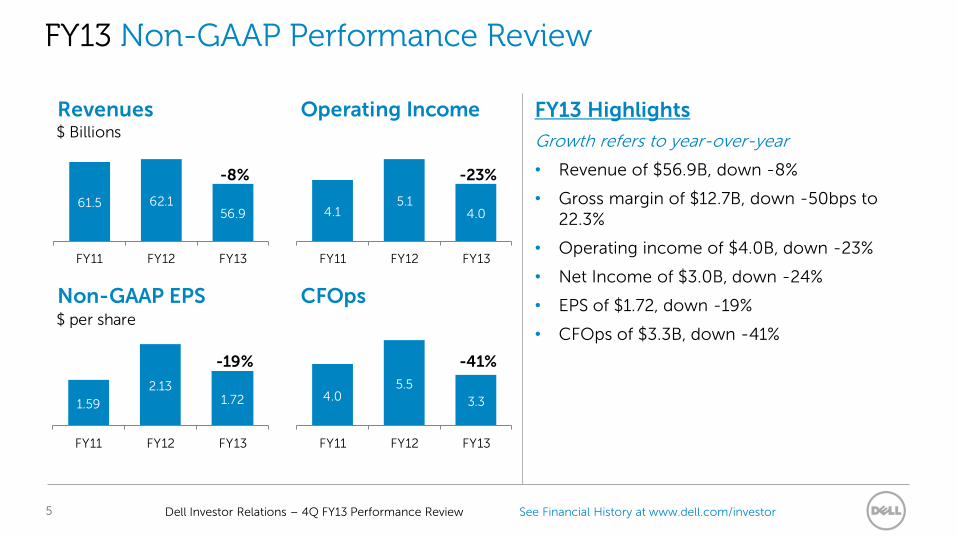
FY13 Non-GAAP Performance Review
FY13 Highlights
Growth refers to year-over-year
• Revenue of $56.9B, down -8%
• Gross margin of $12.7B, down -50bps to 22.3%
• Operating income of $4.0B, down -23%
• Net Income of $3.0B, down -24%
• EPS of $1.72, down -19%
• CFOps of $3.3B, down -41%
5
Revenues Operating Income$ Billions
-8% -23%
Non-GAAP EPS CFOps$ per share
-19% -41%
61.5 62.156.9
FY11 FY12 FY13
4.15.1
4.0
FY11 FY12 FY13
1.59
2.131.72
FY11 FY12 FY13
4.05.5
3.3
FY11 FY12 FY13
See Financial History at www.dell.com/investor Dell Investor Relations – 4Q FY13 Performance Review
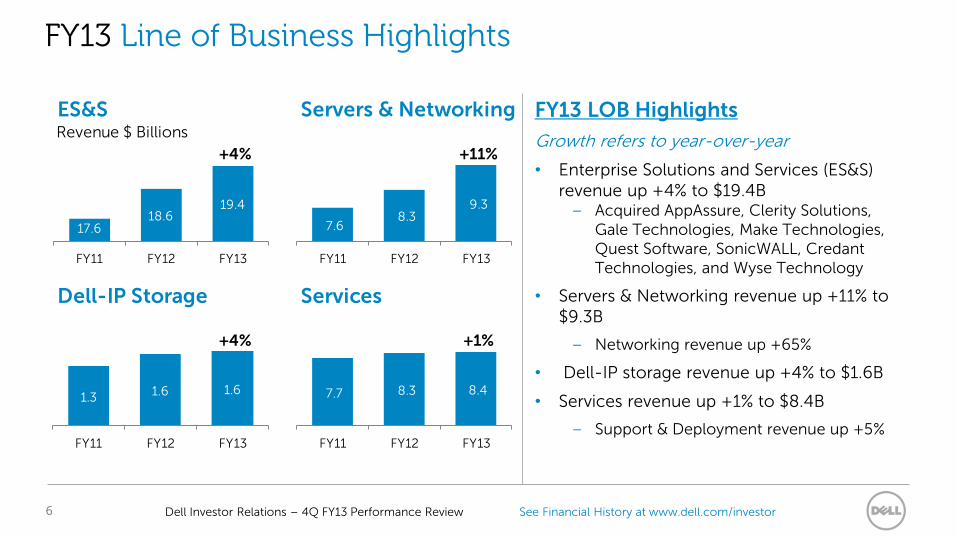
FY13 Line of Business Highlights
FY13 LOB Highlights
Growth refers to year-over-year
• Enterprise Solutions and Services (ES&S) revenue up +4% to $19.4B
– Acquired AppAssure, Clerity Solutions, Gale Technologies, Make Technologies, Quest Software, SonicWALL, Credant Technologies, and Wyse Technology
• Servers & Networking revenue up +11% to $9.3B
– Networking revenue up +65%
• Dell-IP storage revenue up +4% to $1.6B
• Services revenue up +1% to $8.4B
– Support & Deployment revenue up +5%
6
ES&S Servers & NetworkingRevenue $ Billions
+4% +11%
Dell-IP Storage Services
+4% +1%
17.618.6
19.4
FY11 FY12 FY13
7.6 8.3
9.3
FY11 FY12 FY13
1.3 1.6 1.6
FY11 FY12 FY13
7.7 8.3 8.4
FY11 FY12 FY13
See Financial History at www.dell.com/investor Dell Investor Relations – 4Q FY13 Performance Review
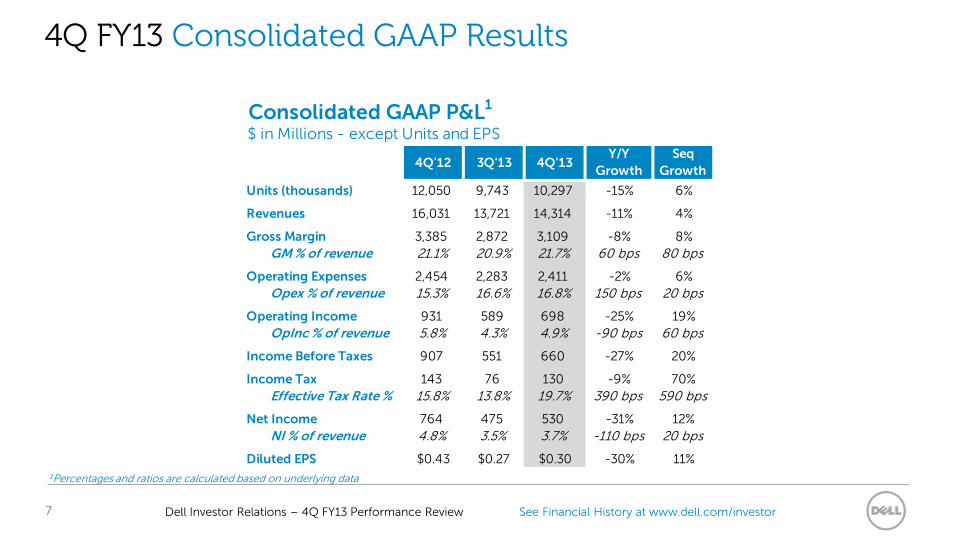
4Q FY13 Consolidated GAAP Results
1Percentages and ratios are calculated based on underlying data
7
Consolidated GAAP P&L1
$ in Millions - except Units and EPS
4Q'12 3Q'13 4Q'13Y/Y
Growth
Seq
Growth
Units (thousands) 12,050 9,743 10,297 -15% 6%
Revenues 16,031 13,721 14,314 -11% 4%
Gross Margin 3,385 2,872 3,109 -8% 8%
GM % of revenue 21.1% 20.9% 21.7% 60 bps 80 bps
Operating Expenses 2,454 2,283 2,411 -2% 6%
Opex % of revenue 15.3% 16.6% 16.8% 150 bps 20 bps
Operating Income 931 589 698 -25% 19%
OpInc % of revenue 5.8% 4.3% 4.9% -90 bps 60 bps
Income Before Taxes 907 551 660 -27% 20%
Income Tax 143 76 130 -9% 70%
Effective Tax Rate % 15.8% 13.8% 19.7% 390 bps 590 bps
Net Income 764 475 530 -31% 12%
NI % of revenue 4.8% 3.5% 3.7% -110 bps 20 bps
Diluted EPS $0.43 $0.27 $0.30 -30% 11%
See Financial History at www.dell.com/investor Dell Investor Relations – 4Q FY13 Performance Review
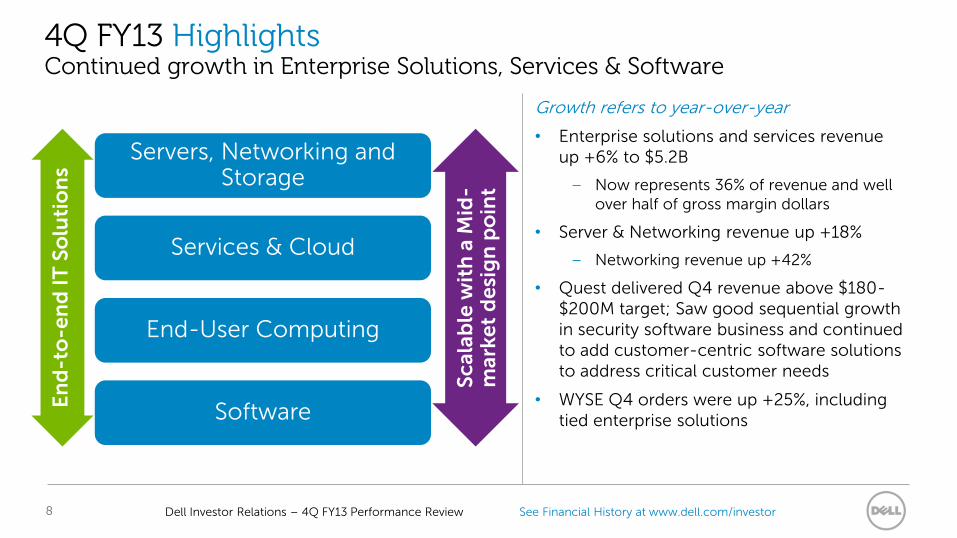
4Q FY13 Highlights Continued growth in Enterprise Solutions, Services & Software
Growth refers to year-over-year
• Enterprise solutions and services revenue up +6% to $5.2B
– Now represents 36% of revenue and well over half of gross margin dollars
• Server & Networking revenue up +18%
– Networking revenue up +42%
• Quest delivered Q4 revenue above $180-$200M target; Saw good sequential growth in security software business and continued to add customer-centric software solutions to address critical customer needs
• WYSE Q4 orders were up +25%, including tied enterprise solutions
8
Servers, Networking and Storage
Services & Cloud
End-User Computing
Software En
d-t
o-e
nd
IT
So
luti
on
s
Sc
ala
ble
wit
h a
Mid
-m
ark
et
de
sig
n p
oin
t
See Financial History at www.dell.com/investor Dell Investor Relations – 4Q FY13 Performance Review
4Q FY13 Non-GAAP Summary
9
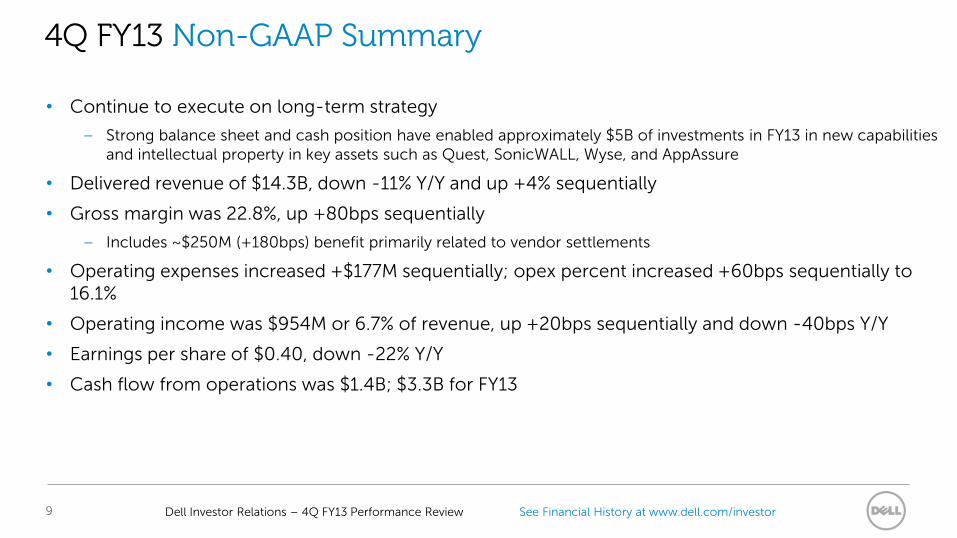
• Continue to execute on long-term strategy
– Strong balance sheet and cash position have enabled approximately $5B of investments in FY13 in new capabilities and intellectual property in key assets such as Quest, SonicWALL, Wyse, and AppAssure
• Delivered revenue of $14.3B, down -11% Y/Y and up +4% sequentially
• Gross margin was 22.8%, up +80bps sequentially
– Includes ~$250M (+180bps) benefit primarily related to vendor settlements
• Operating expenses increased +$177M sequentially; opex percent increased +60bps sequentially to 16.1%
• Operating income was $954M or 6.7% of revenue, up +20bps sequentially and down -40bps Y/Y
• Earnings per share of $0.40, down -22% Y/Y
• Cash flow from operations was $1.4B; $3.3B for FY13
See Financial History at www.dell.com/investor Dell Investor Relations – 4Q FY13 Performance Review
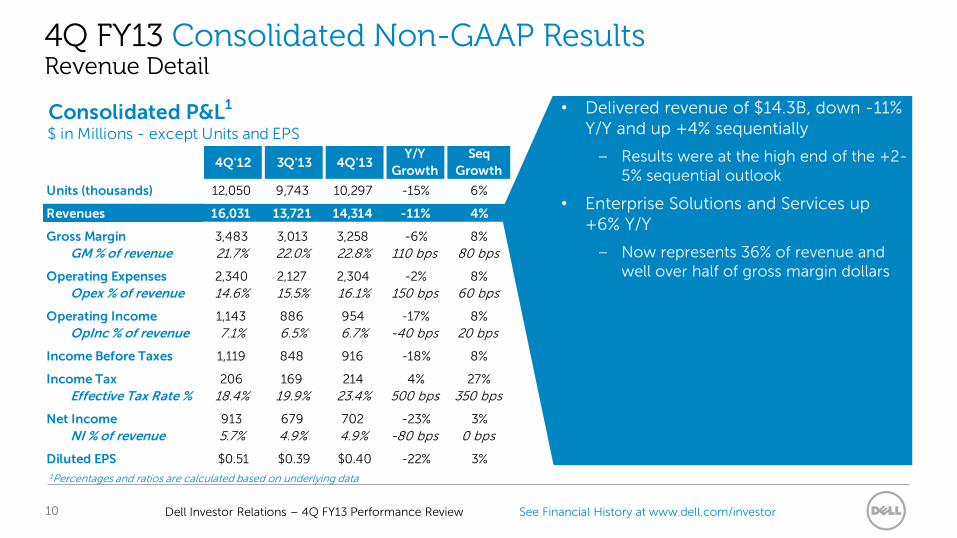
Consolidated P&L1
$ in Millions - except Units and EPS
4Q'12 3Q'13 4Q'13Y/Y
Growth
Seq
Growth
Units (thousands) 12,050 9,743 10,297 -15% 6%
Revenues 16,031 13,721 14,314 -11% 4%
Gross Margin 3,483 3,013 3,258 -6% 8%
GM % of revenue 21.7% 22.0% 22.8% 110 bps 80 bps
Operating Expenses 2,340 2,127 2,304 -2% 8%
Opex % of revenue 14.6% 15.5% 16.1% 150 bps 60 bps
Operating Income 1,143 886 954 -17% 8%
OpInc % of revenue 7.1% 6.5% 6.7% -40 bps 20 bps
Income Before Taxes 1,119 848 916 -18% 8%
Income Tax 206 169 214 4% 27%
Effective Tax Rate % 18.4% 19.9% 23.4% 500 bps 350 bps
Net Income 913 679 702 -23% 3%
NI % of revenue 5.7% 4.9% 4.9% -80 bps 0 bps
Diluted EPS $0.51 $0.39 $0.40 -22% 3%
4Q FY13 Consolidated Non-GAAP Results Revenue Detail
• Delivered revenue of $14.3B, down -11% Y/Y and up +4% sequentially
– Results were at the high end of the +2-5% sequential outlook
• Enterprise Solutions and Services up +6% Y/Y
– Now represents 36% of revenue and well over half of gross margin dollars
1Percentages and ratios are calculated based on underlying data
10
See Financial History at www.dell.com/investor Dell Investor Relations – 4Q FY13 Performance Review
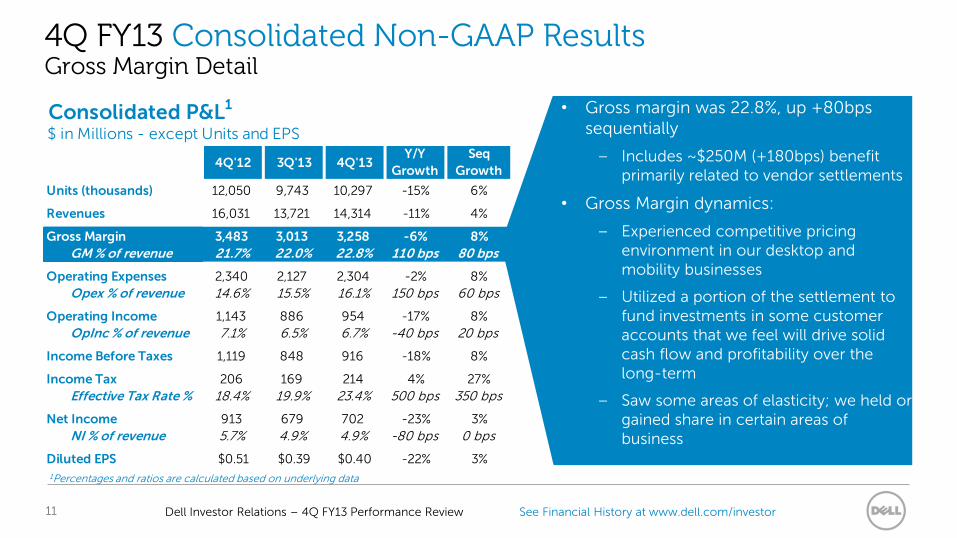
Consolidated P&L1
$ in Millions - except Units and EPS
4Q'12 3Q'13 4Q'13Y/Y
Growth
Seq
Growth
Units (thousands) 12,050 9,743 10,297 -15% 6%
Revenues 16,031 13,721 14,314 -11% 4%
Gross Margin 3,483 3,013 3,258 -6% 8%
GM % of revenue 21.7% 22.0% 22.8% 110 bps 80 bps
Operating Expenses 2,340 2,127 2,304 -2% 8%
Opex % of revenue 14.6% 15.5% 16.1% 150 bps 60 bps
Operating Income 1,143 886 954 -17% 8%
OpInc % of revenue 7.1% 6.5% 6.7% -40 bps 20 bps
Income Before Taxes 1,119 848 916 -18% 8%
Income Tax 206 169 214 4% 27%
Effective Tax Rate % 18.4% 19.9% 23.4% 500 bps 350 bps
Net Income 913 679 702 -23% 3%
NI % of revenue 5.7% 4.9% 4.9% -80 bps 0 bps
Diluted EPS $0.51 $0.39 $0.40 -22% 3%
4Q FY13 Consolidated Non-GAAP Results Gross Margin Detail
• Gross margin was 22.8%, up +80bps sequentially
– Includes ~$250M (+180bps) benefit primarily related to vendor settlements
• Gross Margin dynamics:
– Experienced competitive pricing environment in our desktop and mobility businesses
– Utilized a portion of the settlement to fund investments in some customer accounts that we feel will drive solid cash flow and profitability over the long-term
– Saw some areas of elasticity; we held or gained share in certain areas of business
1Percentages and ratios are calculated based on underlying data
11
See Financial History at www.dell.com/investor Dell Investor Relations – 4Q FY13 Performance Review
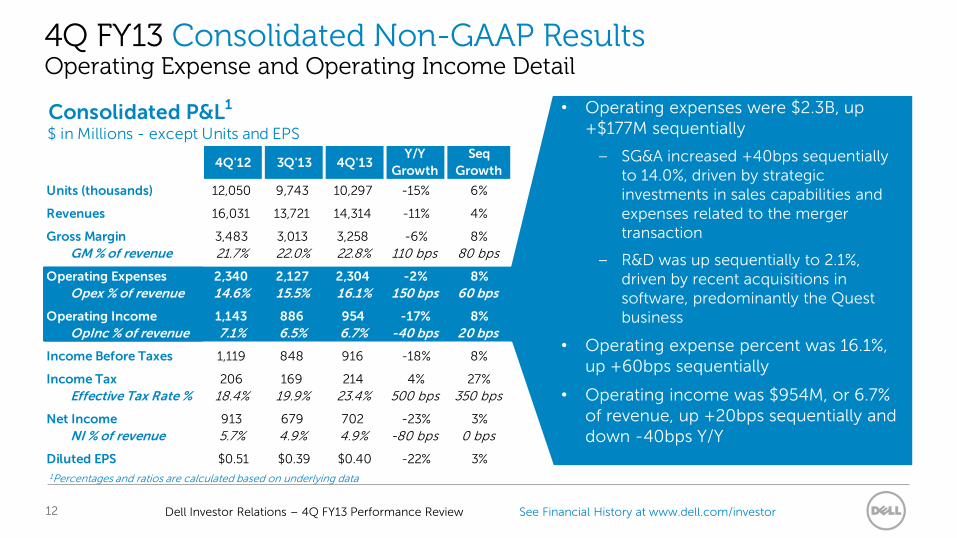
Consolidated P&L1
$ in Millions - except Units and EPS
4Q'12 3Q'13 4Q'13Y/Y
Growth
Seq
Growth
Units (thousands) 12,050 9,743 10,297 -15% 6%
Revenues 16,031 13,721 14,314 -11% 4%
Gross Margin 3,483 3,013 3,258 -6% 8%
GM % of revenue 21.7% 22.0% 22.8% 110 bps 80 bps
Operating Expenses 2,340 2,127 2,304 -2% 8%
Opex % of revenue 14.6% 15.5% 16.1% 150 bps 60 bps
Operating Income 1,143 886 954 -17% 8%
OpInc % of revenue 7.1% 6.5% 6.7% -40 bps 20 bps
Income Before Taxes 1,119 848 916 -18% 8%
Income Tax 206 169 214 4% 27%
Effective Tax Rate % 18.4% 19.9% 23.4% 500 bps 350 bps
Net Income 913 679 702 -23% 3%
NI % of revenue 5.7% 4.9% 4.9% -80 bps 0 bps
Diluted EPS $0.51 $0.39 $0.40 -22% 3%
4Q FY13 Consolidated Non-GAAP Results Operating Expense and Operating Income Detail
• Operating expenses were $2.3B, up +$177M sequentially
– SG&A increased +40bps sequentially to 14.0%, driven by strategic investments in sales capabilities and expenses related to the merger transaction
– R&D was up sequentially to 2.1%, driven by recent acquisitions in software, predominantly the Quest business
• Operating expense percent was 16.1%, up +60bps sequentially
• Operating income was $954M, or 6.7% of revenue, up +20bps sequentially and down -40bps Y/Y
1Percentages and ratios are calculated based on underlying data
12
See Financial History at www.dell.com/investor Dell Investor Relations – 4Q FY13 Performance Review
Consolidated P&L1
$ in Millions - except Units and EPS
4Q'12 3Q'13 4Q'13Y/Y
Growth
Seq
Growth
Units (thousands) 12,050 9,743 10,297 -15% 6%
Revenues 16,031 13,721 14,314 -11% 4%
Gross Margin 3,483 3,013 3,258 -6% 8%
GM % of revenue 21.7% 22.0% 22.8% 110 bps 80 bps
Operating Expenses 2,340 2,127 2,304 -2% 8%
Opex % of revenue 14.6% 15.5% 16.1% 150 bps 60 bps
Operating Income 1,143 886 954 -17% 8%
OpInc % of revenue 7.1% 6.5% 6.7% -40 bps 20 bps
Income Before Taxes 1,119 848 916 -18% 8%
Income Tax 206 169 214 4% 27%
Effective Tax Rate % 18.4% 19.9% 23.4% 500 bps 350 bps
Net Income 913 679 702 -23% 3%
NI % of revenue 5.7% 4.9% 4.9% -80 bps 0 bps
Diluted EPS $0.51 $0.39 $0.40 -22% 3%
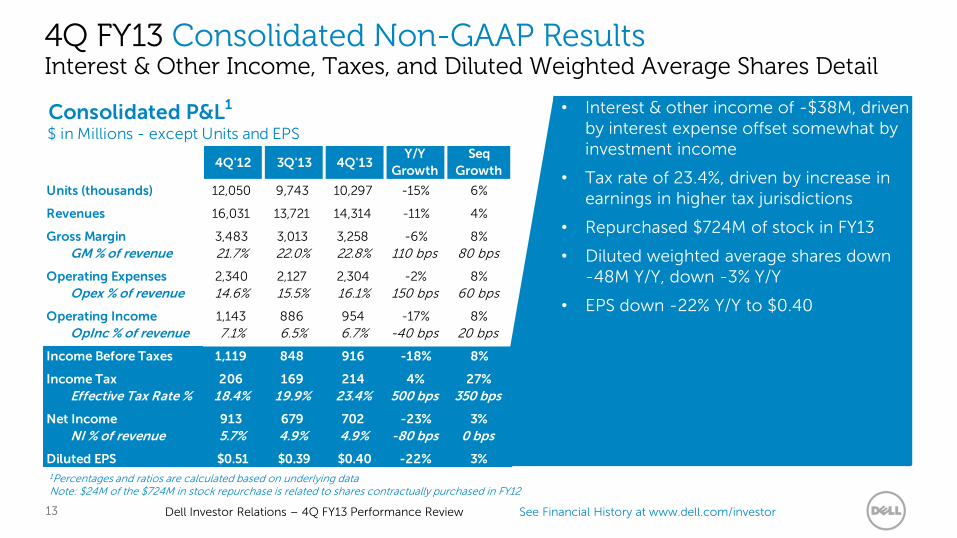
4Q FY13 Consolidated Non-GAAP Results Interest & Other Income, Taxes, and Diluted Weighted Average Shares Detail
• Interest & other income of -$38M, driven by interest expense offset somewhat by investment income
• Tax rate of 23.4%, driven by increase in earnings in higher tax jurisdictions
• Repurchased $724M of stock in FY13
• Diluted weighted average shares down -48M Y/Y, down -3% Y/Y
• EPS down -22% Y/Y to $0.40
13
1Percentages and ratios are calculated based on underlying data Note: $24M of the $724M in stock repurchase is related to shares contractually purchased in FY12
See Financial History at www.dell.com/investor Dell Investor Relations – 4Q FY13 Performance Review
Cash Flow from Operations1
Free Cash Flow1,2
$5.5B$4.9B
$3.2B$3.7B $3.3B
4Q'12 1Q'13 2Q'13 3Q'13 4Q'13
$5.2B$4.6B
$2.8B$3.4B
$3.0B
4Q'12 1Q'13 2Q'13 3Q'13 4Q'13
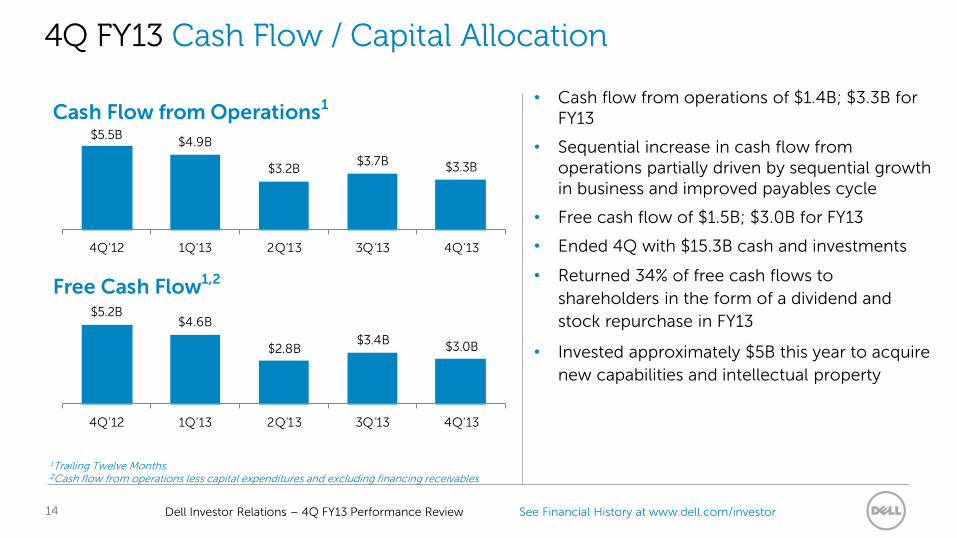
4Q FY13 Cash Flow / Capital Allocation
• Cash flow from operations of $1.4B; $3.3B for FY13
• Sequential increase in cash flow from operations partially driven by sequential growth in business and improved payables cycle
• Free cash flow of $1.5B; $3.0B for FY13
• Ended 4Q with $15.3B cash and investments
• Returned 34% of free cash flows to
shareholders in the form of a dividend and
stock repurchase in FY13
• Invested approximately $5B this year to acquire
new capabilities and intellectual property
1Trailing Twelve Months 2Cash flow from operations less capital expenditures and excluding financing receivables
14
See Financial History at www.dell.com/investor Dell Investor Relations – 4Q FY13 Performance Review
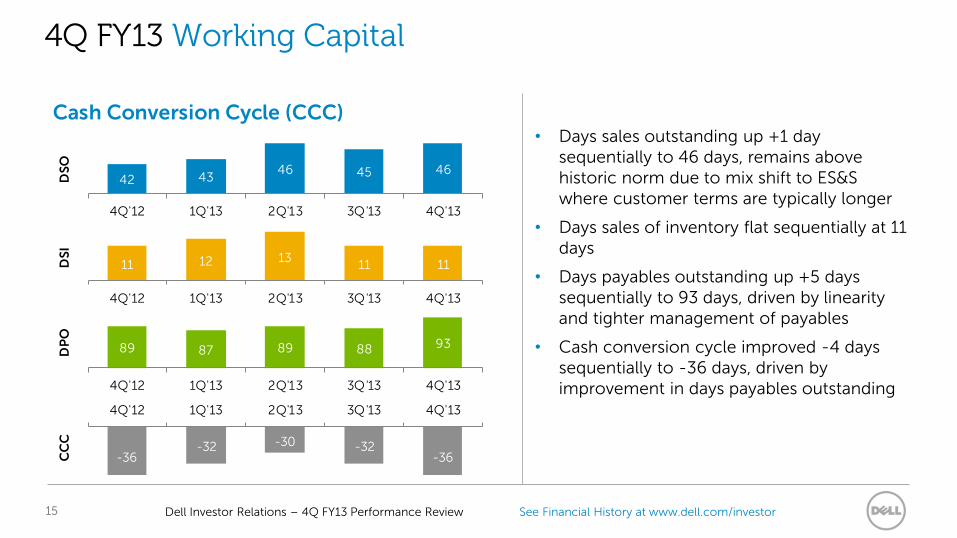
4Q FY13 Working Capital
• Days sales outstanding up +1 day sequentially to 46 days, remains above historic norm due to mix shift to ES&S where customer terms are typically longer
• Days sales of inventory flat sequentially at 11 days
• Days payables outstanding up +5 days sequentially to 93 days, driven by linearity and tighter management of payables
• Cash conversion cycle improved -4 days sequentially to -36 days, driven by improvement in days payables outstanding
Cash Conversion Cycle (CCC)
42 4346 45 46
4Q'12 1Q'13 2Q'13 3Q'13 4Q'13
DS
O
11 12 1311 11
4Q'12 1Q'13 2Q'13 3Q'13 4Q'13
DS
I
89 87 89 88 93
4Q'12 1Q'13 2Q'13 3Q'13 4Q'13
DP
O
-36-32 -30 -32
-36
4Q'12 1Q'13 2Q'13 3Q'13 4Q'13
CC
C
15
See Financial History at www.dell.com/investor Dell Investor Relations – 4Q FY13 Performance Review
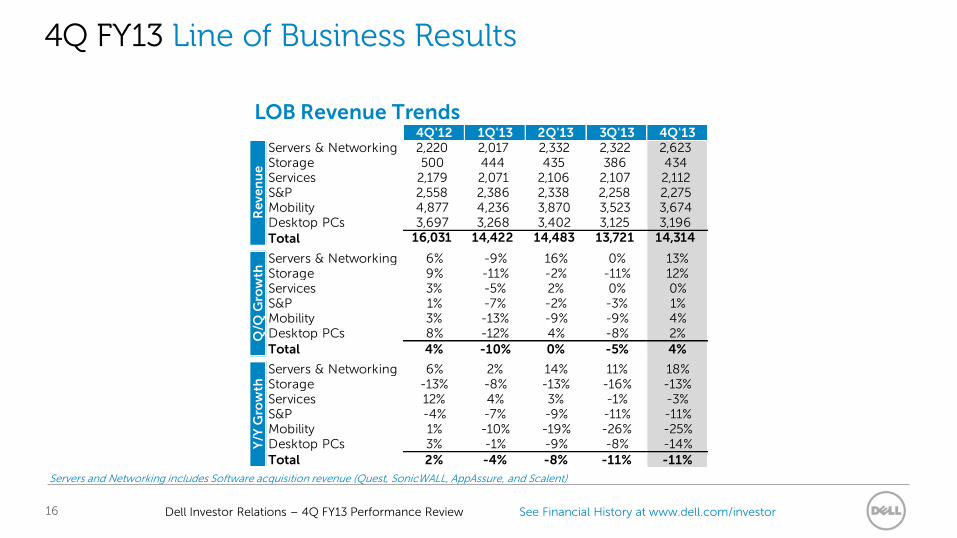
4Q FY13 Line of Business Results
16
LOB Revenue Trends4Q'12 1Q'13 2Q'13 3Q'13 4Q'13
Servers & Networking 2,220 2,017 2,332 2,322 2,623Storage 500 444 435 386 434Services 2,179 2,071 2,106 2,107 2,112S&P 2,558 2,386 2,338 2,258 2,275Mobility 4,877 4,236 3,870 3,523 3,674Desktop PCs 3,697 3,268 3,402 3,125 3,196Total 16,031 14,422 14,483 13,721 14,314
Servers & Networking 6% -9% 16% 0% 13%Storage 9% -11% -2% -11% 12%Services 3% -5% 2% 0% 0%S&P 1% -7% -2% -3% 1%Mobility 3% -13% -9% -9% 4%Desktop PCs 8% -12% 4% -8% 2%Total 4% -10% 0% -5% 4%
Servers & Networking 6% 2% 14% 11% 18%Storage -13% -8% -13% -16% -13%Services 12% 4% 3% -1% -3%S&P -4% -7% -9% -11% -11%Mobility 1% -10% -19% -26% -25%Desktop PCs 3% -1% -9% -8% -14%Total 2% -4% -8% -11% -11%
Re
ve
nu
eQ
/Q G
row
thY
/Y G
row
th
Servers and Networking includes Software acquisition revenue (Quest, SonicWALL, AppAssure, and Scalent)
See Financial History at www.dell.com/investor Dell Investor Relations – 4Q FY13 Performance Review
4Q FY13 Servers, Networking & Storage
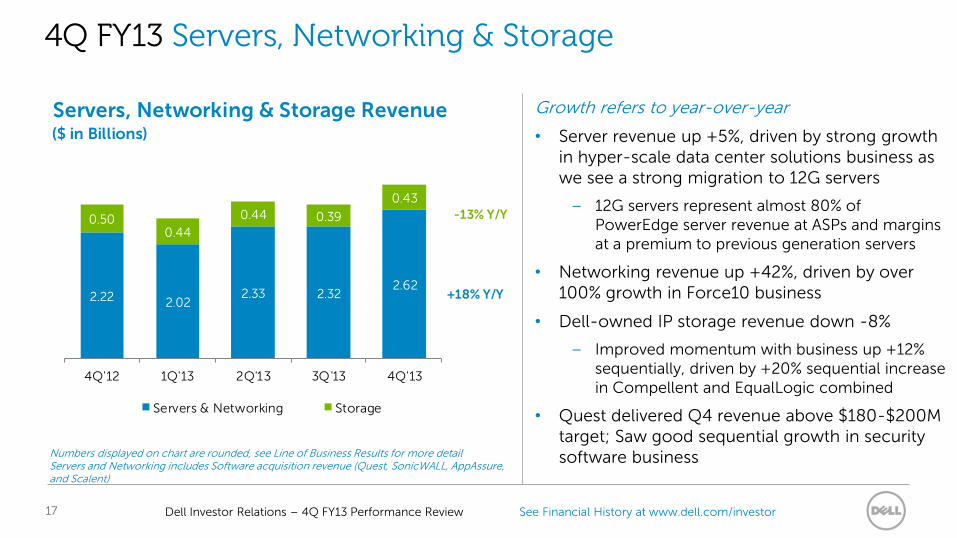
Growth refers to year-over-year
• Server revenue up +5%, driven by strong growth in hyper-scale data center solutions business as we see a strong migration to 12G servers
– 12G servers represent almost 80% of PowerEdge server revenue at ASPs and margins at a premium to previous generation servers
• Networking revenue up +42%, driven by over 100% growth in Force10 business
• Dell-owned IP storage revenue down -8%
– Improved momentum with business up +12% sequentially, driven by +20% sequential increase in Compellent and EqualLogic combined
• Quest delivered Q4 revenue above $180-$200M target; Saw good sequential growth in security software business
17
Numbers displayed on chart are rounded, see Line of Business Results for more detail Servers and Networking includes Software acquisition revenue (Quest, SonicWALL, AppAssure, and Scalent)
Servers, Networking & Storage Revenue($ in Billions)
-13% Y/Y
+18% Y/Y2.22 2.022.33 2.32
2.62
0.500.44
0.44 0.39
0.43
4Q'12 1Q'13 2Q'13 3Q'13 4Q'13
Servers & Networking Storage
See Financial History at www.dell.com/investor Dell Investor Relations – 4Q FY13 Performance Review
4Q FY13 Services, Security and Cloud
18
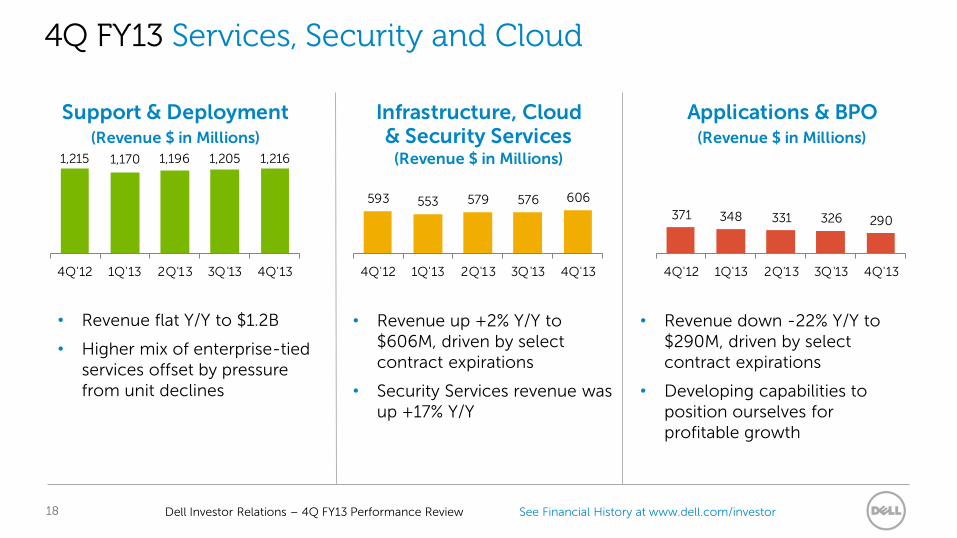
Support & Deployment(Revenue $ in Millions)
(Revenue $ in Millions)
Applications & BPO& Security Services (Revenue $ in Millions)
Infrastructure, Cloud
1,215 1,170 1,196 1,205 1,216
4Q'12 1Q'13 2Q'13 3Q'13 4Q'13
593 553 579 576 606
4Q'12 1Q'13 2Q'13 3Q'13 4Q'13
371 348 331 326 290
4Q'12 1Q'13 2Q'13 3Q'13 4Q'13
• Revenue flat Y/Y to $1.2B
• Higher mix of enterprise-tied services offset by pressure from unit declines
• Revenue up +2% Y/Y to $606M, driven by select contract expirations
• Security Services revenue was up +17% Y/Y
• Revenue down -22% Y/Y to $290M, driven by select contract expirations
• Developing capabilities to position ourselves for profitable growth
See Financial History at www.dell.com/investor Dell Investor Relations – 4Q FY13 Performance Review
4Q FY13 Services, Security and Cloud
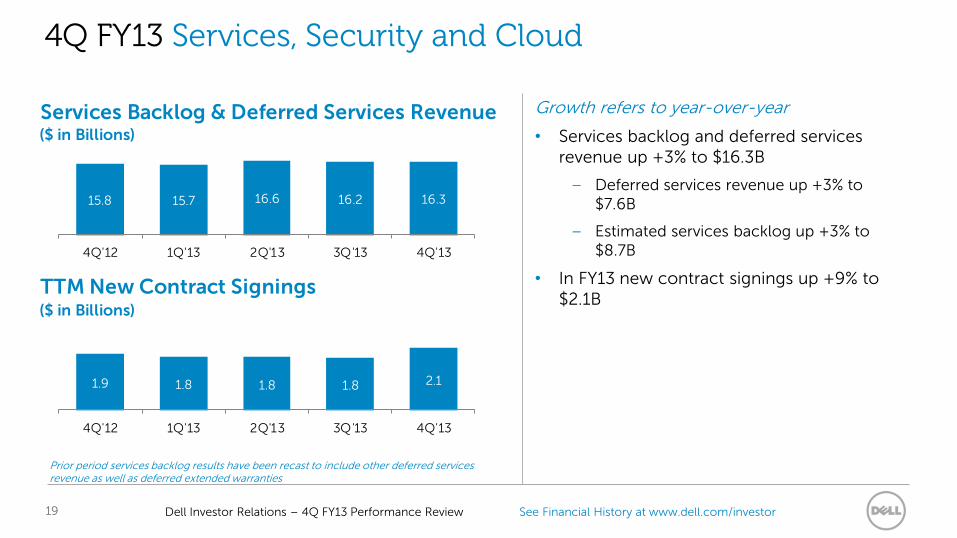
Growth refers to year-over-year
• Services backlog and deferred services revenue up +3% to $16.3B
– Deferred services revenue up +3% to $7.6B
– Estimated services backlog up +3% to $8.7B
• In FY13 new contract signings up +9% to $2.1B
Services Backlog & Deferred Services Revenue($ in Billions)
TTM New Contract Signings($ in Billions)
15.8 15.7 16.6 16.2 16.3
4Q'12 1Q'13 2Q'13 3Q'13 4Q'13
1.9 1.8 1.8 1.8 2.1
4Q'12 1Q'13 2Q'13 3Q'13 4Q'13
19
Prior period services backlog results have been recast to include other deferred services revenue as well as deferred extended warranties
See Financial History at www.dell.com/investor Dell Investor Relations – 4Q FY13 Performance Review
4Q FY13 End User Computing and Software & Peripherals
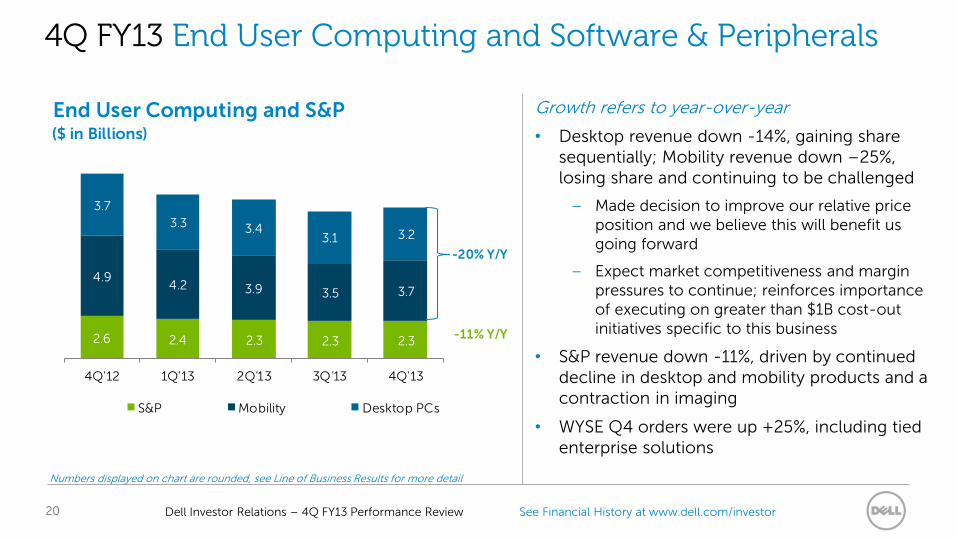
Growth refers to year-over-year
• Desktop revenue down -14%, gaining share sequentially; Mobility revenue down –25%, losing share and continuing to be challenged
– Made decision to improve our relative price position and we believe this will benefit us going forward
– Expect market competitiveness and margin pressures to continue; reinforces importance of executing on greater than $1B cost-out initiatives specific to this business
• S&P revenue down -11%, driven by continued decline in desktop and mobility products and a contraction in imaging
• WYSE Q4 orders were up +25%, including tied enterprise solutions
20
Numbers displayed on chart are rounded, see Line of Business Results for more detail
End User Computing and S&P($ in Billions)
-20% Y/Y
-11% Y/Y2.6 2.4 2.3 2.3 2.3
4.94.2 3.9 3.5 3.7
3.7
3.3 3.43.1 3.2
4Q'12 1Q'13 2Q'13 3Q'13 4Q'13
S&P Mobility Desktop PCs
See Financial History at www.dell.com/investor Dell Investor Relations – 4Q FY13 Performance Review
Revenue & Operating Income Revenue Mix
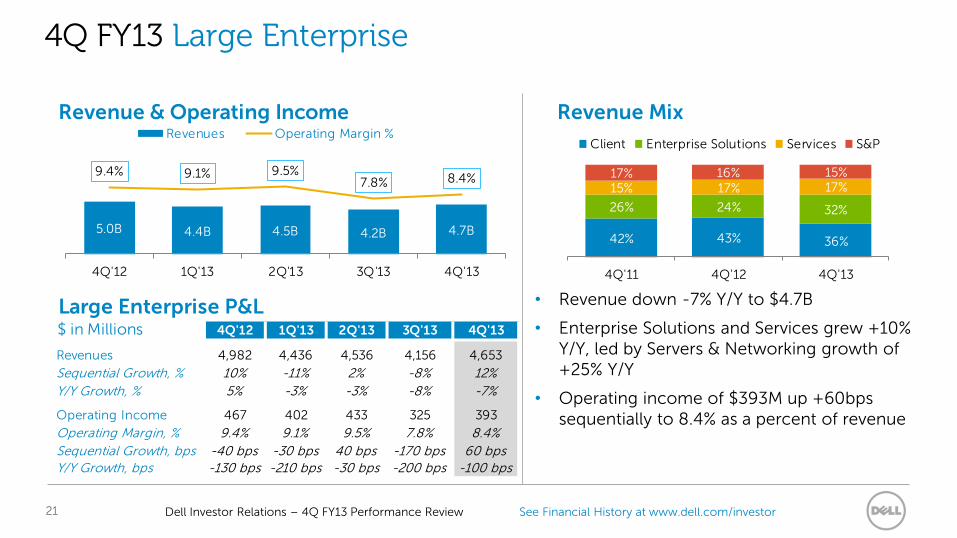
Large Enterprise P&L$ in Millions 4Q'12 1Q'13 2Q'13 3Q'13 4Q'13
Revenues 4,982 4,436 4,536 4,156 4,653
Sequential Growth, % 10% -11% 2% -8% 12%
Y/Y Growth, % 5% -3% -3% -8% -7%
Operating Income 467 402 433 325 393
Operating Margin, % 9.4% 9.1% 9.5% 7.8% 8.4%
Sequential Growth, bps -40 bps -30 bps 40 bps -170 bps 60 bpsY/Y Growth, bps -130 bps -210 bps -30 bps -200 bps -100 bps
5.0B 4.4B 4.5B 4.2B 4.7B
9.4% 9.1% 9.5%7.8% 8.4%
4Q'12 1Q'13 2Q'13 3Q'13 4Q'13
Revenues Operating Margin %
42% 43% 36%
26% 24% 32%
15% 17% 17%17% 16% 15%
4Q'11 4Q'12 4Q'13
Client Enterprise Solutions Services S&P
• Revenue down -7% Y/Y to $4.7B
• Enterprise Solutions and Services grew +10% Y/Y, led by Servers & Networking growth of +25% Y/Y
• Operating income of $393M up +60bps sequentially to 8.4% as a percent of revenue
4Q FY13 Large Enterprise
21
See Financial History at www.dell.com/investor Dell Investor Relations – 4Q FY13 Performance Review
Revenue & Operating Income Revenue Mix
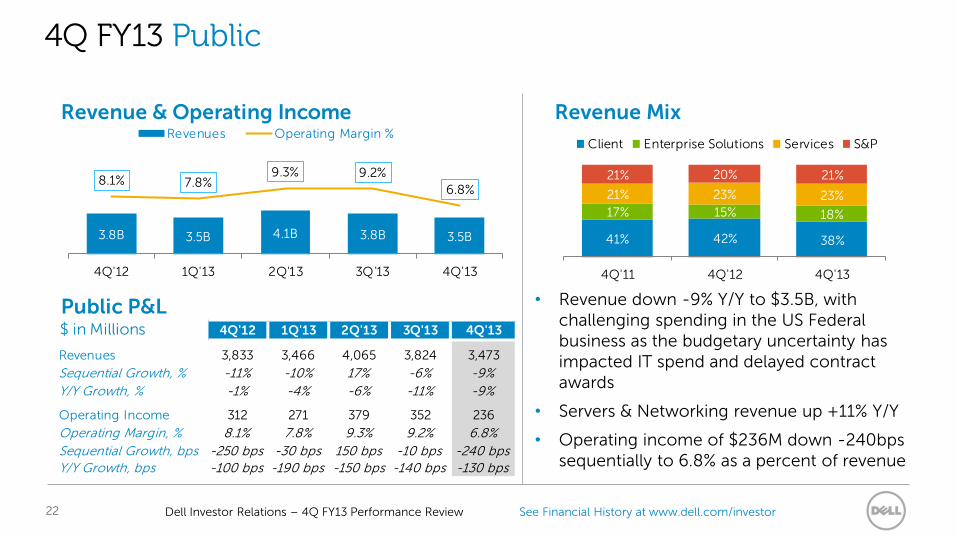
Public P&L$ in Millions 4Q'12 1Q'13 2Q'13 3Q'13 4Q'13
Revenues 3,833 3,466 4,065 3,824 3,473
Sequential Growth, % -11% -10% 17% -6% -9%
Y/Y Growth, % -1% -4% -6% -11% -9%
Operating Income 312 271 379 352 236
Operating Margin, % 8.1% 7.8% 9.3% 9.2% 6.8%
Sequential Growth, bps -250 bps -30 bps 150 bps -10 bps -240 bpsY/Y Growth, bps -100 bps -190 bps -150 bps -140 bps -130 bps
3.8B 3.5B 4.1B 3.8B 3.5B
8.1% 7.8%9.3% 9.2%
6.8%
4Q'12 1Q'13 2Q'13 3Q'13 4Q'13
Revenues Operating Margin %
41% 42% 38%
17% 15% 18%
21% 23% 23%
21% 20% 21%
4Q'11 4Q'12 4Q'13
Client Enterprise Solutions Services S&P
• Revenue down -9% Y/Y to $3.5B, with challenging spending in the US Federal business as the budgetary uncertainty has impacted IT spend and delayed contract awards
• Servers & Networking revenue up +11% Y/Y
• Operating income of $236M down -240bps sequentially to 6.8% as a percent of revenue
4Q FY13 Public
22
See Financial History at www.dell.com/investor Dell Investor Relations – 4Q FY13 Performance Review
Revenue & Operating Income Revenue Mix
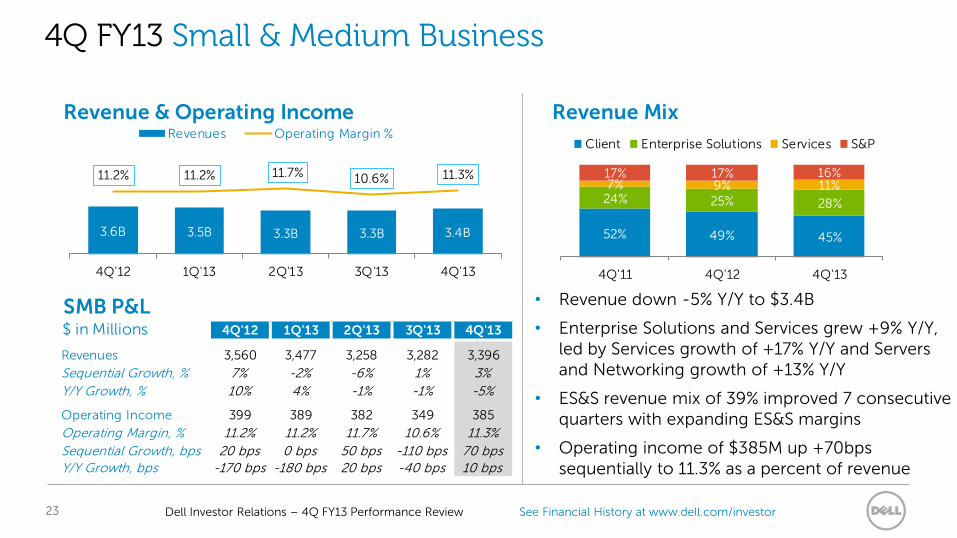
SMB P&L$ in Millions 4Q'12 1Q'13 2Q'13 3Q'13 4Q'13
Revenues 3,560 3,477 3,258 3,282 3,396
Sequential Growth, % 7% -2% -6% 1% 3%
Y/Y Growth, % 10% 4% -1% -1% -5%
Operating Income 399 389 382 349 385
Operating Margin, % 11.2% 11.2% 11.7% 10.6% 11.3%
Sequential Growth, bps 20 bps 0 bps 50 bps -110 bps 70 bpsY/Y Growth, bps -170 bps -180 bps 20 bps -40 bps 10 bps
3.6B 3.5B 3.3B 3.3B 3.4B
11.2% 11.2% 11.7% 10.6% 11.3%
4Q'12 1Q'13 2Q'13 3Q'13 4Q'13
Revenues Operating Margin %
52% 49% 45%
24% 25% 28%
7% 9% 11%17% 17% 16%
4Q'11 4Q'12 4Q'13
Client Enterprise Solutions Services S&P
• Revenue down -5% Y/Y to $3.4B
• Enterprise Solutions and Services grew +9% Y/Y, led by Services growth of +17% Y/Y and Servers and Networking growth of +13% Y/Y
• ES&S revenue mix of 39% improved 7 consecutive quarters with expanding ES&S margins
• Operating income of $385M up +70bps sequentially to 11.3% as a percent of revenue
4Q FY13 Small & Medium Business
23
See Financial History at www.dell.com/investor Dell Investor Relations – 4Q FY13 Performance Review
Revenue & Operating Income Revenue Mix
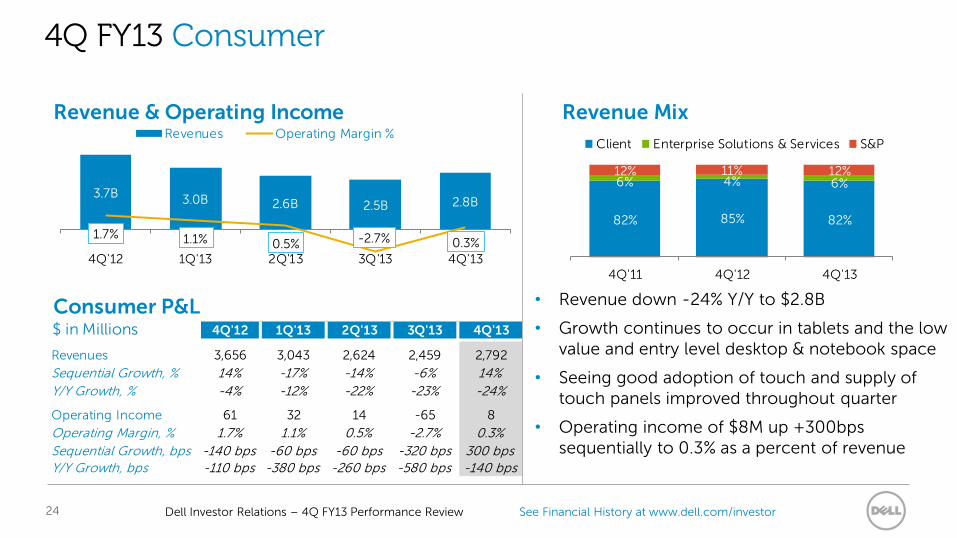
Consumer P&L$ in Millions 4Q'12 1Q'13 2Q'13 3Q'13 4Q'13
Revenues 3,656 3,043 2,624 2,459 2,792
Sequential Growth, % 14% -17% -14% -6% 14%
Y/Y Growth, % -4% -12% -22% -23% -24%
Operating Income 61 32 14 -65 8
Operating Margin, % 1.7% 1.1% 0.5% -2.7% 0.3%
Sequential Growth, bps -140 bps -60 bps -60 bps -320 bps 300 bpsY/Y Growth, bps -110 bps -380 bps -260 bps -580 bps -140 bps
3.7B 3.0B 2.6B 2.5B 2.8B
1.7% 1.1% 0.5% -2.7% 0.3%4Q'12 1Q'13 2Q'13 3Q'13 4Q'13
Revenues Operating Margin %
82% 85% 82%
6% 4% 6%12% 11% 12%
4Q'11 4Q'12 4Q'13
Client Enterprise Solutions & Services S&P
• Revenue down -24% Y/Y to $2.8B
• Growth continues to occur in tablets and the low value and entry level desktop & notebook space
• Seeing good adoption of touch and supply of touch panels improved throughout quarter
• Operating income of $8M up +300bps sequentially to 0.3% as a percent of revenue
4Q FY13 Consumer
24
See Financial History at www.dell.com/investor Dell Investor Relations – 4Q FY13 Performance Review
4Q FY13 Growth Markets and Regional Dynamics
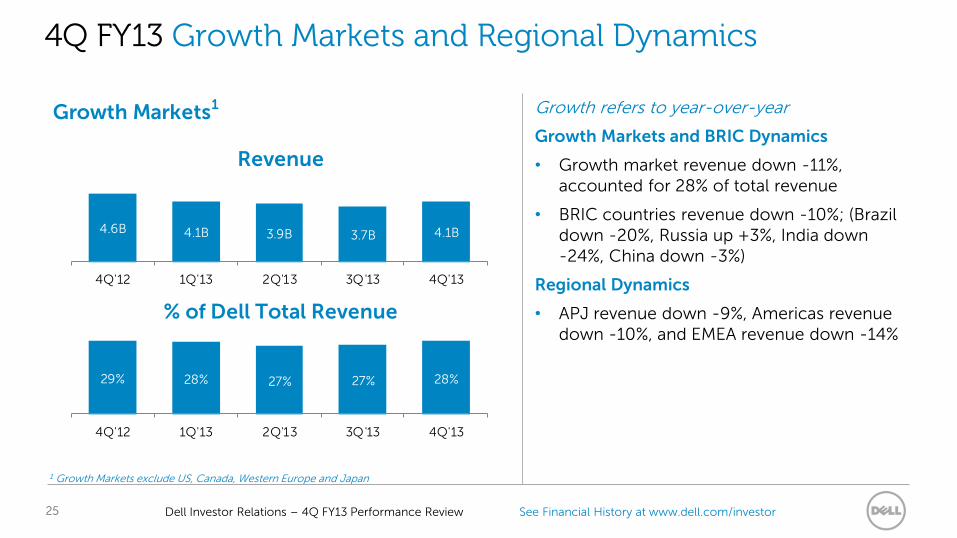
Growth refers to year-over-year
Growth Markets and BRIC Dynamics
• Growth market revenue down -11%, accounted for 28% of total revenue
• BRIC countries revenue down -10%; (Brazil down -20%, Russia up +3%, India down -24%, China down -3%)
Regional Dynamics
• APJ revenue down -9%, Americas revenue down -10%, and EMEA revenue down -14%
1 Growth Markets exclude US, Canada, Western Europe and Japan
25
Growth Markets1
Revenue
% of Dell Total Revenue
4.6B 4.1B 3.9B 3.7B 4.1B
4Q'12 1Q'13 2Q'13 3Q'13 4Q'13
29% 28% 27% 27% 28%
4Q'12 1Q'13 2Q'13 3Q'13 4Q'13
See Financial History at www.dell.com/investor Dell Investor Relations – 4Q FY13 Performance Review
Outlook
FY14
• Given pending merger agreement we will not be providing an outlook for FY14 or our first quarter
26
See Financial History at www.dell.com/investor Dell Investor Relations – 4Q FY13 Performance Review
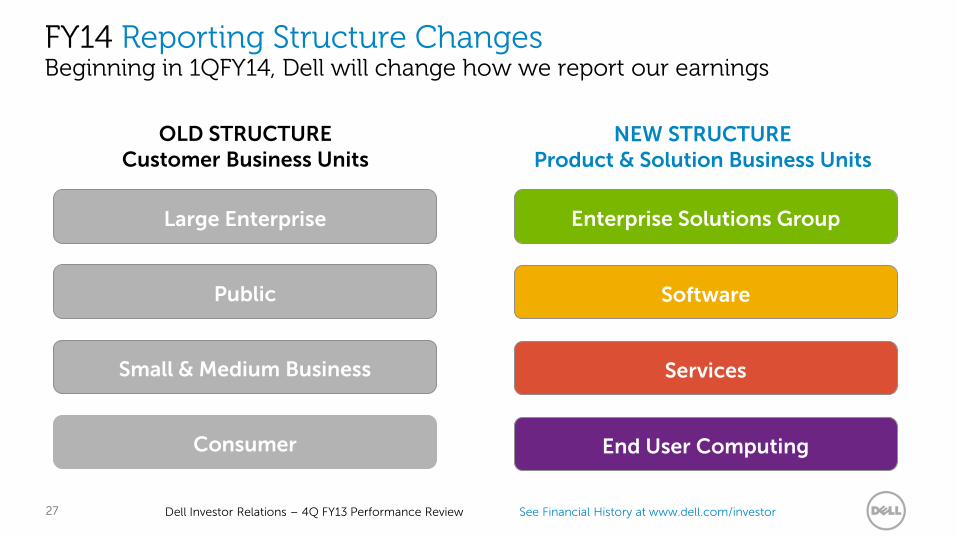
FY14 Reporting Structure Changes Beginning in 1QFY14, Dell will change how we report our earnings
27
Large Enterprise
Public
Small & Medium Business
Consumer
Enterprise Solutions Group
Software
Services
End User Computing
OLD STRUCTURE Customer Business Units
NEW STRUCTURE Product & Solution Business Units
See Financial History at www.dell.com/investor Dell Investor Relations – 4Q FY13 Performance Review
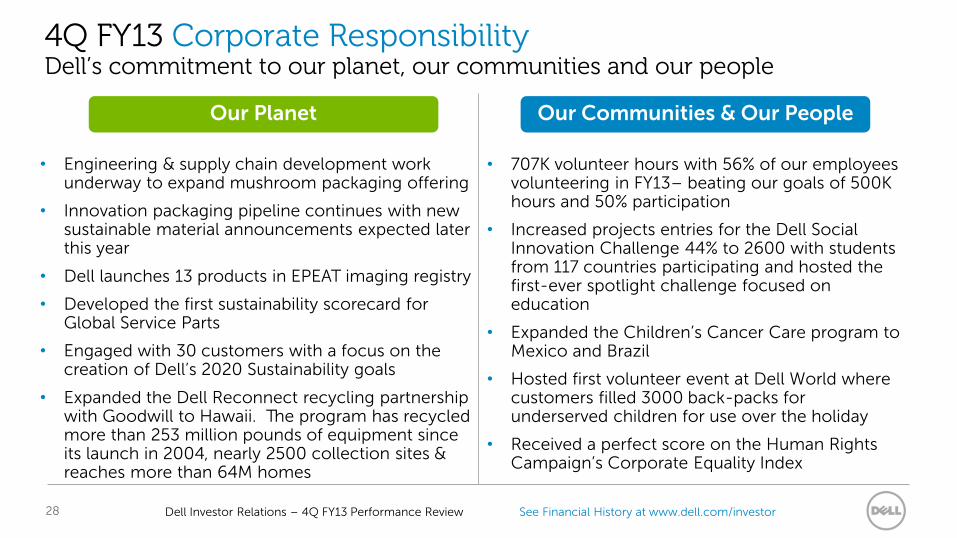
Our Communities & Our People Our Planet
• 707K volunteer hours with 56% of our employees volunteering in FY13– beating our goals of 500K hours and 50% participation
• Increased projects entries for the Dell Social Innovation Challenge 44% to 2600 with students from 117 countries participating and hosted the first-ever spotlight challenge focused on education
• Expanded the Children’s Cancer Care program to Mexico and Brazil
• Hosted first volunteer event at Dell World where customers filled 3000 back-packs for underserved children for use over the holiday
• Received a perfect score on the Human Rights Campaign’s Corporate Equality Index
4Q FY13 Corporate Responsibility Dell’s commitment to our planet, our communities and our people
• Engineering & supply chain development work underway to expand mushroom packaging offering
• Innovation packaging pipeline continues with new sustainable material announcements expected later this year
• Dell launches 13 products in EPEAT imaging registry
• Developed the first sustainability scorecard for Global Service Parts
• Engaged with 30 customers with a focus on the creation of Dell’s 2020 Sustainability goals
• Expanded the Dell Reconnect recycling partnership with Goodwill to Hawaii. The program has recycled more than 253 million pounds of equipment since its launch in 2004, nearly 2500 collection sites & reaches more than 64M homes
28
See Financial History at www.dell.com/investor Dell Investor Relations – 4Q FY13 Performance Review
Dell 4Q FY13 Supplemental Non-GAAP Measures
29
See Financial History at www.dell.com/investor Dell Investor Relations – 4Q FY13 Performance Review 30
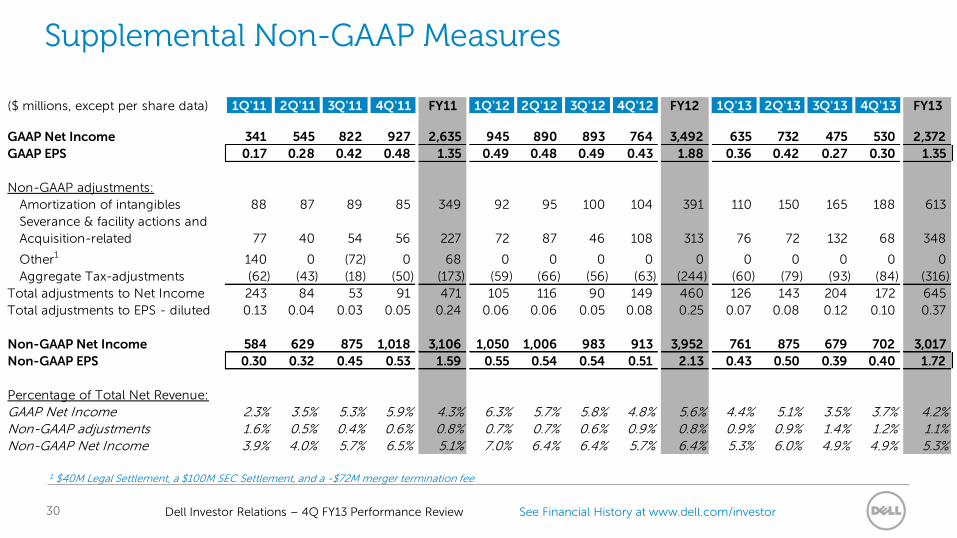
Supplemental Non-GAAP Measures
1 $40M Legal Settlement, a $100M SEC Settlement, and a -$72M merger termination fee
($ millions, except per share data) 1Q'11 2Q'11 3Q'11 4Q'11 FY11 1Q'12 2Q'12 3Q'12 4Q'12 FY12 1Q'13 2Q'13 3Q'13 4Q'13 FY13
GAAP Net Income 341 545 822 927 2,635 945 890 893 764 3,492 635 732 475 530 2,372
GAAP EPS 0.17 0.28 0.42 0.48 1.35 0.49 0.48 0.49 0.43 1.88 0.36 0.42 0.27 0.30 1.35
Non-GAAP adjustments:
Amortization of intangibles 88 87 89 85 349 92 95 100 104 391 110 150 165 188 613
Severance & facility actions and
Acquisition-related 77 40 54 56 227 72 87 46 108 313 76 72 132 68 348
Other1 140 0 (72) 0 68 0 0 0 0 0 0 0 0 0 0
Aggregate Tax-adjustments (62) (43) (18) (50) (173) (59) (66) (56) (63) (244) (60) (79) (93) (84) (316)
Total adjustments to Net Income 243 84 53 91 471 105 116 90 149 460 126 143 204 172 645
Total adjustments to EPS - diluted 0.13 0.04 0.03 0.05 0.24 0.06 0.06 0.05 0.08 0.25 0.07 0.08 0.12 0.10 0.37
Non-GAAP Net Income 584 629 875 1,018 3,106 1,050 1,006 983 913 3,952 761 875 679 702 3,017
Non-GAAP EPS 0.30 0.32 0.45 0.53 1.59 0.55 0.54 0.54 0.51 2.13 0.43 0.50 0.39 0.40 1.72
Percentage of Total Net Revenue:
GAAP Net Income 2.3% 3.5% 5.3% 5.9% 4.3% 6.3% 5.7% 5.8% 4.8% 5.6% 4.4% 5.1% 3.5% 3.7% 4.2%Non-GAAP adjustments 1.6% 0.5% 0.4% 0.6% 0.8% 0.7% 0.7% 0.6% 0.9% 0.8% 0.9% 0.9% 1.4% 1.2% 1.1%Non-GAAP Net Income 3.9% 4.0% 5.7% 6.5% 5.1% 7.0% 6.4% 6.4% 5.7% 6.4% 5.3% 6.0% 4.9% 4.9% 5.3%
See Financial History at www.dell.com/investor Dell Investor Relations – 4Q FY13 Performance Review 31
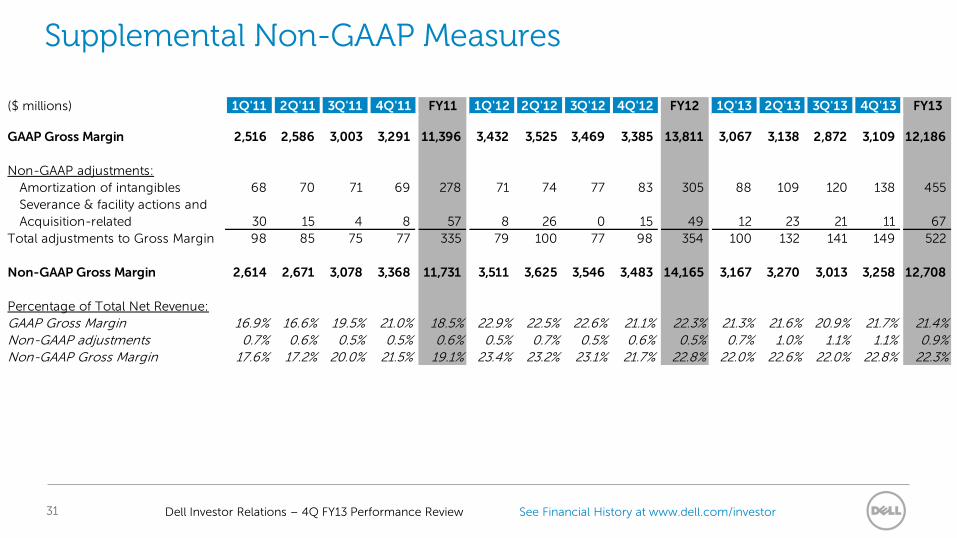
Supplemental Non-GAAP Measures
($ millions) 1Q'11 2Q'11 3Q'11 4Q'11 FY11 1Q'12 2Q'12 3Q'12 4Q'12 FY12 1Q'13 2Q'13 3Q'13 4Q'13 FY13
GAAP Gross Margin 2,516 2,586 3,003 3,291 11,396 3,432 3,525 3,469 3,385 13,811 3,067 3,138 2,872 3,109 12,186
Non-GAAP adjustments:
Amortization of intangibles 68 70 71 69 278 71 74 77 83 305 88 109 120 138 455
Severance & facility actions and
Acquisition-related 30 15 4 8 57 8 26 0 15 49 12 23 21 11 67
Total adjustments to Gross Margin 98 85 75 77 335 79 100 77 98 354 100 132 141 149 522
Non-GAAP Gross Margin 2,614 2,671 3,078 3,368 11,731 3,511 3,625 3,546 3,483 14,165 3,167 3,270 3,013 3,258 12,708
Percentage of Total Net Revenue:
GAAP Gross Margin 16.9% 16.6% 19.5% 21.0% 18.5% 22.9% 22.5% 22.6% 21.1% 22.3% 21.3% 21.6% 20.9% 21.7% 21.4%Non-GAAP adjustments 0.7% 0.6% 0.5% 0.5% 0.6% 0.5% 0.7% 0.5% 0.6% 0.5% 0.7% 1.0% 1.1% 1.1% 0.9%Non-GAAP Gross Margin 17.6% 17.2% 20.0% 21.5% 19.1% 23.4% 23.2% 23.1% 21.7% 22.8% 22.0% 22.6% 22.0% 22.8% 22.3%
See Financial History at www.dell.com/investor Dell Investor Relations – 4Q FY13 Performance Review 32
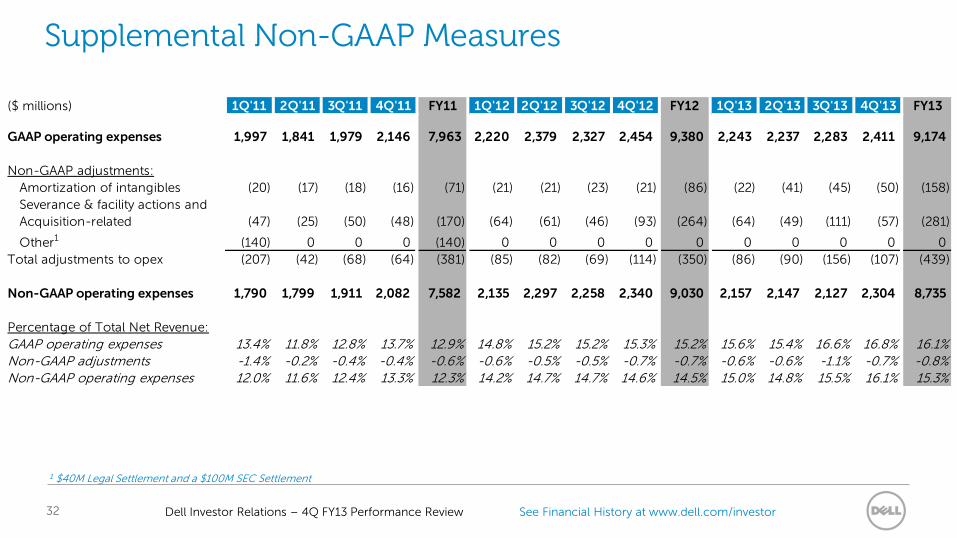
Supplemental Non-GAAP Measures
1 $40M Legal Settlement and a $100M SEC Settlement
($ millions) 1Q'11 2Q'11 3Q'11 4Q'11 FY11 1Q'12 2Q'12 3Q'12 4Q'12 FY12 1Q'13 2Q'13 3Q'13 4Q'13 FY13
GAAP operating expenses 1,997 1,841 1,979 2,146 7,963 2,220 2,379 2,327 2,454 9,380 2,243 2,237 2,283 2,411 9,174
Non-GAAP adjustments:
Amortization of intangibles (20) (17) (18) (16) (71) (21) (21) (23) (21) (86) (22) (41) (45) (50) (158)
Severance & facility actions and
Acquisition-related (47) (25) (50) (48) (170) (64) (61) (46) (93) (264) (64) (49) (111) (57) (281)
Other1 (140) 0 0 0 (140) 0 0 0 0 0 0 0 0 0 0
Total adjustments to opex (207) (42) (68) (64) (381) (85) (82) (69) (114) (350) (86) (90) (156) (107) (439)
Non-GAAP operating expenses 1,790 1,799 1,911 2,082 7,582 2,135 2,297 2,258 2,340 9,030 2,157 2,147 2,127 2,304 8,735
Percentage of Total Net Revenue:
GAAP operating expenses 13.4% 11.8% 12.8% 13.7% 12.9% 14.8% 15.2% 15.2% 15.3% 15.2% 15.6% 15.4% 16.6% 16.8% 16.1%Non-GAAP adjustments -1.4% -0.2% -0.4% -0.4% -0.6% -0.6% -0.5% -0.5% -0.7% -0.7% -0.6% -0.6% -1.1% -0.7% -0.8%Non-GAAP operating expenses 12.0% 11.6% 12.4% 13.3% 12.3% 14.2% 14.7% 14.7% 14.6% 14.5% 15.0% 14.8% 15.5% 16.1% 15.3%
See Financial History at www.dell.com/investor Dell Investor Relations – 4Q FY13 Performance Review 33
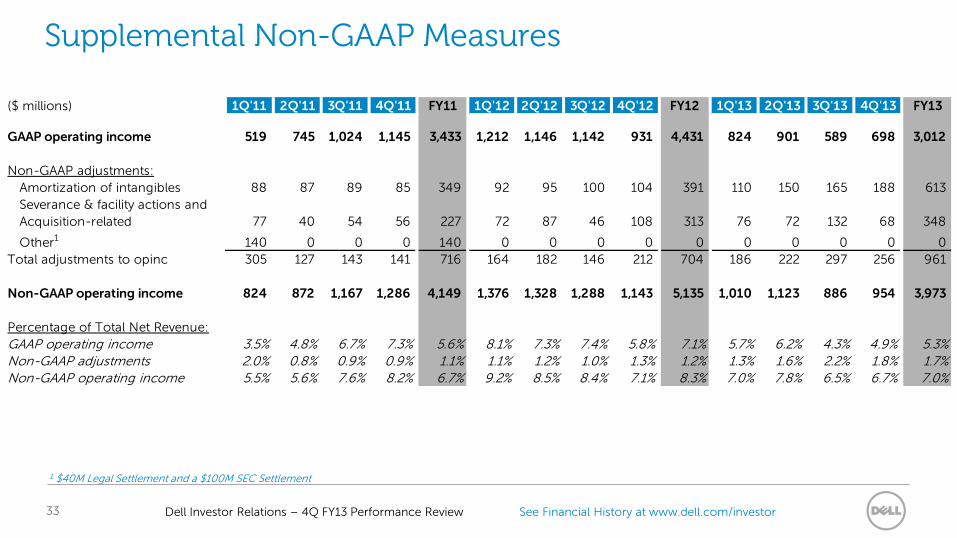
Supplemental Non-GAAP Measures
1 $40M Legal Settlement and a $100M SEC Settlement
($ millions) 1Q'11 2Q'11 3Q'11 4Q'11 FY11 1Q'12 2Q'12 3Q'12 4Q'12 FY12 1Q'13 2Q'13 3Q'13 4Q'13 FY13
GAAP operating income 519 745 1,024 1,145 3,433 1,212 1,146 1,142 931 4,431 824 901 589 698 3,012
Non-GAAP adjustments:
Amortization of intangibles 88 87 89 85 349 92 95 100 104 391 110 150 165 188 613
Severance & facility actions and
Acquisition-related 77 40 54 56 227 72 87 46 108 313 76 72 132 68 348
Other1 140 0 0 0 140 0 0 0 0 0 0 0 0 0 0
Total adjustments to opinc 305 127 143 141 716 164 182 146 212 704 186 222 297 256 961
Non-GAAP operating income 824 872 1,167 1,286 4,149 1,376 1,328 1,288 1,143 5,135 1,010 1,123 886 954 3,973
Percentage of Total Net Revenue:
GAAP operating income 3.5% 4.8% 6.7% 7.3% 5.6% 8.1% 7.3% 7.4% 5.8% 7.1% 5.7% 6.2% 4.3% 4.9% 5.3%Non-GAAP adjustments 2.0% 0.8% 0.9% 0.9% 1.1% 1.1% 1.2% 1.0% 1.3% 1.2% 1.3% 1.6% 2.2% 1.8% 1.7%Non-GAAP operating income 5.5% 5.6% 7.6% 8.2% 6.7% 9.2% 8.5% 8.4% 7.1% 8.3% 7.0% 7.8% 6.5% 6.7% 7.0%
See Financial History at www.dell.com/investor Dell Investor Relations – 4Q FY13 Performance Review 34
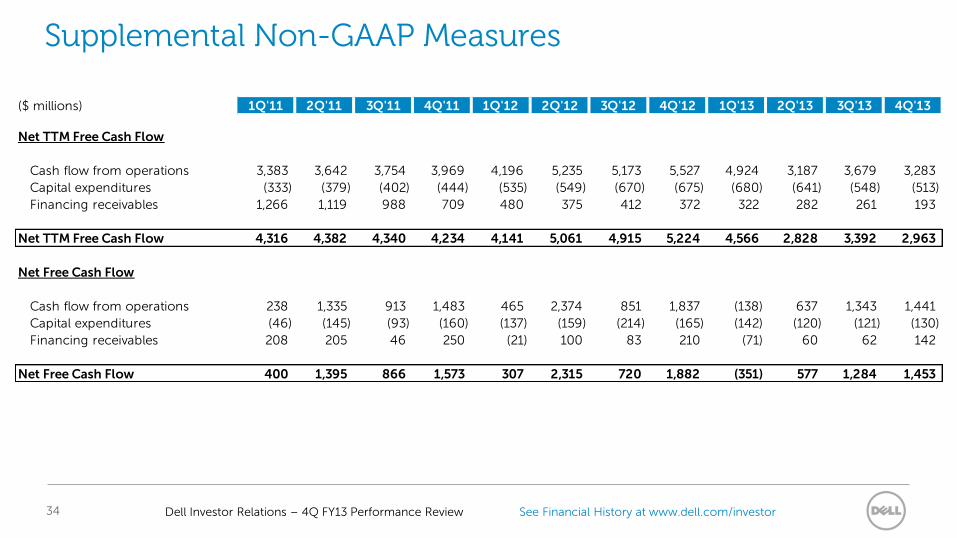
Supplemental Non-GAAP Measures
($ millions) 1Q'11 2Q'11 3Q'11 4Q'11 1Q'12 2Q'12 3Q'12 4Q'12 1Q'13 2Q'13 3Q'13 4Q'13
Net TTM Free Cash Flow
Cash flow from operations 3,383 3,642 3,754 3,969 4,196 5,235 5,173 5,527 4,924 3,187 3,679 3,283
Capital expenditures (333) (379) (402) (444) (535) (549) (670) (675) (680) (641) (548) (513)
Financing receivables 1,266 1,119 988 709 480 375 412 372 322 282 261 193
Net TTM Free Cash Flow 4,316 4,382 4,340 4,234 4,141 5,061 4,915 5,224 4,566 2,828 3,392 2,963
Net Free Cash Flow
Cash flow from operations 238 1,335 913 1,483 465 2,374 851 1,837 (138) 637 1,343 1,441
Capital expenditures (46) (145) (93) (160) (137) (159) (214) (165) (142) (120) (121) (130)
Financing receivables 208 205 46 250 (21) 100 83 210 (71) 60 62 142
Net Free Cash Flow 400 1,395 866 1,573 307 2,315 720 1,882 (351) 577 1,284 1,453


![[2013] Ubisoft - FY13 Earnings Presentation 2013](https://img.pdfslide.net/doc/110x75/54923b9cb47959744d8b4575/2013-ubisoft-fy13-earnings-presentation-2013.jpg)