Embed Size (px)
Citation preview

Denver Industrial MarketF I R S T Q U A R T E R 2 0 1 1
The CoStarIndustrial Report
Denver Industrial Market
©2011 COSTAR GROUP, INC. THE COSTAR INDUSTRIAL REPORT A
FIRST QUARTER 2011 – DENVER
Table of ContentsTable of Contents . . . . . . . . . . . . . . . . . . . . . . . . . . . . . . . . . . . . . . . . . . . . . . . . . . . . . . . . . . . . . . . . . . . . A
Methodology. . . . . . . . . . . . . . . . . . . . . . . . . . . . . . . . . . . . . . . . . . . . . . . . . . . . . . . . . . . . . . . . . . . . . . . . B
Terms & Definitions. . . . . . . . . . . . . . . . . . . . . . . . . . . . . . . . . . . . . . . . . . . . . . . . . . . . . . . . . . . . . . . . . . C
Market Highlights & Overview. . . . . . . . . . . . . . . . . . . . . . . . . . . . . . . . . . . . . . . . . . . . . . . . . . . . . . . . . 1
CoStar Markets & Submarkets . . . . . . . . . . . . . . . . . . . . . . . . . . . . . . . . . . . . . . . . . . . . . . . . . . . . . . . . . 3
Employment & Tenant Analysis . . . . . . . . . . . . . . . . . . . . . . . . . . . . . . . . . . . . . . . . . . . . . . . . . . . . . . . . 4Employment & Unemployment AnalysisTenant Profiles
Inventory & Development Analysis. . . . . . . . . . . . . . . . . . . . . . . . . . . . . . . . . . . . . . . . . . . . . . . . . . . . . . 6Construction Activity MapInventory & Development AnalysisSelect Top Under Construction PropertiesSelect Top Deliveries
Figures at a Glance . . . . . . . . . . . . . . . . . . . . . . . . . . . . . . . . . . . . . . . . . . . . . . . . . . . . . . . . . . . . . . . . . . 10Figures at a Glance by Building Type & MarketFigures at a Glance by Building Type & SubmarketHistorical Figures at a Glance
Leasing Activity Analysis . . . . . . . . . . . . . . . . . . . . . . . . . . . . . . . . . . . . . . . . . . . . . . . . . . . . . . . . . . . . . 16Leasing Activity MapLeasing Activity AnalysisSelect Top Lease Transactions
Sales Activity Analysis . . . . . . . . . . . . . . . . . . . . . . . . . . . . . . . . . . . . . . . . . . . . . . . . . . . . . . . . . . . . . . . 19Sales Activity AnalysisSelect Top Sales TransactionsSelect Same Building SalesSelect Land Sales
Analysis of Individual CoStar Markets . . . . . . . . . . . . . . . . . . . . . . . . . . . . . . . . . . . . . . . . . . . . . . . . . . 22Aurora MarketBoulder MarketBroomfield MarketCentral MarketClear Creek County MarketEast I-70/Montbello MarketElbert County MarketFort Collins/Loveland MarketGlendale MarketLongmont MarketNorth Central MarketNorth Denver MarketNortheast Denver MarketNorthwest Denver MarketPark County MarketParker/Castle Rock MarketSouth Central MarketSoutheast Denver MarketSouthwest Denver MarketWeld County MarketWest Denver Market
Denver Industrial Market
B THE COSTAR INDUSTRIAL REPORT ©2011 COSTAR GROUP, INC.
DENVER – FIRST QUARTER 2011
Denver Industrial Market
©2011 COSTAR GROUP, INC. THE COSTAR INDUSTRIAL REPORT C
FIRST QUARTER 2011 – DENVER
Methodology
The CoStar Industrial Report calculates Industrial statistics using CoStar Group's base of existing, under construction and under renovation Industrial buildings in each given metropolitan area. All Industrial building types are included, including warehouse, flex / research & development, distribution, manufacturing, industrial showroom, and service buildings, in both single-tenant and multi-tenant buildings, including owner-occupied buildings. CoStar Group's national database includes approximately 71.7 billion square feet of coverage in 3 million properties. All rental rates reported in the CoStar Industrial Report are calculated using the quoted rental rate for each property.
© Copyright 2010 CoStar Group, Inc. All Rights Reserved. Although CoStar makes efforts to ensure the accuracy and reliability of the information contained herein, CoStar makes no guarantee, representation or warranty regarding the quality, accuracy, timeliness or completeness of the information. The publication is provided ‘as is’ and CoStar expressly disclaims any guarantees, representations or warranties of any kind, including those of MERCHANTABILITY AND FITNESS FOR A PARTICULAR PURPOSE.
CoStar Group, Inc.
1331 L ST NW • Washington, DC USA 20005 • (800) 204-5960 • www.costar.com • NASDAQ: CSGP
For information on subscribing to CoStar’s other products and services, please contact us at
1-877-7COSTAR, or visit our web site at www.costar.com
Denver Industrial Market
B THE COSTAR INDUSTRIAL REPORT ©2011 COSTAR GROUP, INC.
DENVER – FIRST QUARTER 2011
Denver Industrial Market
©2011 COSTAR GROUP, INC. THE COSTAR INDUSTRIAL REPORT C
FIRST QUARTER 2011 – DENVER
Terms & DefinitionsAvailability Rate: The ratio of available space to total rentable space, calculated by dividing the total available square feet by the total rentable square feet.
Available Space: The total amount of space that is currently being marketed as available for lease in a given time period. It includes any space that is available, regardless of whether the space is vacant, occupied, available for sublease, or available at a future date.
Build-to-Suit: A term describing a particular property, developed specifically for a certain tenant to occupy, with structural features, systems, or improvement work designed specifically for the needs of that tenant. A build-to-suit can be leased or owned by the ten-ant. In a leased build-to-suit, a tenant will usually have a long term lease on the space.
Buyer: The individual, group, company, or entity that has pur-chased a commercial real estate asset.
Cap Rate: Short for capitalization rate. The Cap Rate is a calcula-tion that reflects the relationship between one year’s net operating income and the current market value of a particular property. The Cap Rate is calculated by dividing the annual net operating income by the sales price (or asking sales price).
CBD: Abbreviation for Central Business District. (See also: Central Business District)
Central Business District: The designations of Central Business District (CBD) and Suburban refer to a particular geographic area within a metropolitan statistical area (MSA) describing the level of real estate development found there. The CBD is characterized by a high density, well organized core within the largest city of a given MSA.
Class A: A classification used to describe buildings that generally qualify as extremely desirable investment-grade properties and command the highest rents or sale prices compared to other buildings in the same market. Such buildings are well located and provide efficient tenant layouts as well as high quality, and in some buildings, one-of-a-kind floor plans. They can be an archi-tectural or historical landmark designed by prominent architects. These buildings contain a modern mechanical system, and have above-average maintenance and management as well as the best quality materials and workmanship in their trim and interior fit-tings. They are generally the most attractive and eagerly sought by investors willing to pay a premium for quality.
Class B: A classification used to describe buildings that generally qualify as a more speculative investment, and as such, command lower rents or sale prices compared to Class A properties. Such buildings offer utilitarian space without special attractions, and have ordinary design, if new or fairly new; good to excellent design if an older non-landmark building. These buildings typical-ly have average to good maintenance, management and tenants. They are less appealing to tenants than Class A properties, and may be deficient in a number of respects including floor plans, condition and facilities. They lack prestige and must depend chiefly on a lower price to attract tenants and investors.
Class C: A classification used to describe buildings that gener-ally qualify as no-frills, older buildings that offer basic space and command lower rents or sale prices compared to other buildings in the same market. Such buildings typically have below-average maintenance and management, and could have mixed or low tenant prestige, inferior elevators, and/or mechanical/electrical systems. These buildings lack prestige and must depend chiefly on a lower price to attract tenants and investors.
Construction Starts: Buildings that began construction during a specific period of time. (See also: Deliveries)
Contiguous Blocks of Space: Space within a building that is, or is able to be joined together into a single contiguous space.
Deliveries: Buildings that complete construction during a specified period of time. In order for space to be considered delivered, a certificate of occupancy must have been issued for the property.
Delivery Date: The date a building completes construction and receives a certificate of occupancy.
Developer: The company, entity or individual that transforms raw land to improved property by use of labor, capital and entrepre-neurial efforts.
Direct Space: Space that is being offered for lease directly from the landlord or owner of a building, as opposed to space being offered in a building by another tenant (or broker of a tenant) trying to sublet a space that has already been leased.
Existing Inventory: The square footage of buildings that have received a certificate of occupancy and are able to be occupied by tenants. It does not include space in buildings that are either planned, under construction or under renovation.
Flex Building: A type of building designed to be versatile, which may be used in combination with office (corporate headquarters), research and development, quasi-retail sales, and including but not limited to industrial, warehouse, and distribution uses. A typi-cal flex building will be one or two stories with at least half of the rentable area being used as office space, have ceiling heights of 16 feet or less, and have some type of drive-in door, even though the door may be glassed in or sealed off.
Full Service Rental Rate: Rental rates that include all operating expenses such as utilities, electricity, janitorial services, taxes and insurance.
Gross Absorption: The total change in occupied space over a given period of time, counting space that is occupied but not space that is vacated by tenants. Gross absorption differs from leasing Activity, which is the sum of all space leased over a certain period of time. Unless otherwise noted Gross Absorption includes direct and sublease space.
Growth in Inventory: The change in size of the existing square footage in a given area over a given period of time, generally due to the construction of new buildings.
Industrial Building: A type of building adapted for such uses as the assemblage, processing, and/or manufacturing of products from raw materials or fabricated parts. Additional uses include warehousing, distribution, and maintenance facilities. The pri-mary purpose of the space is for storing, producing, assembling, or distributing product.
Landlord Rep: (Landlord Representative) In a typical lease trans-action between an owner/landlord and tenant, the broker that represents the interests of the owner/landlord is referred to as the Landlord Rep.
Leased Space: All the space that has a financial lease obligation. It includes all leased space, regardless of whether the space is currently occupied by a tenant. Leased space also includes space being offered for sublease.
Leasing Activity: The volume of square footage that is commit-ted to and signed under a lease obligation for a specific building or market in a given period of time. It includes direct leases, subleases and renewals of existing leases. It also includes any pre-leasing activity in planned, under construction, or under renovation buildings.
Market: Geographic boundaries that serve to delineate core areas that are competitive with each other and constitute a generally accepted primary competitive set of areas. Markets are building-type specific, and are non-overlapping contiguous geographic designations having a cumulative sum that matches the boundar-ies of the entire Region (See also: Region). Markets can be further subdivided into Submarkets. (See also: Submarkets)

Denver Industrial Market
D THE COSTAR INDUSTRIAL REPORT ©2011 COSTAR GROUP, INC.
DENVER – FIRST QUARTER 2011 FIRST QUARTER 2011 – DENVER
Denver Industrial Market
©2011 COSTAR GROUP, INC. THE COSTAR INDUSTRIAL REPORT 1
Multi-Tenant: Buildings that house more than one tenant at a given time. Usually, multi-tenant buildings were designed and built to accommodate many different floor plans and designs for different tenant needs. (See also: Tenancy).
Net Absorption: The net change in occupied space over a given period of time. Unless otherwise noted Net Absorption includes direct and sublease space.
Net Rental Rate: A rental rate that excludes certain expenses that a tenant could incur in occupying office space. Such expenses are expected to be paid directly by the tenant and may include janitorial costs, electricity, utilities, taxes, insurance and other related costs.
New Space: Sometimes called first generation space, refers to space that has never been occupied and/or leased by a tenant.
Occupied Space: Space that is physically occupied by a tenant. It does not include leased space that is not currently occupied by a tenant.
Office Building: A type of commercial building used exclusively or primarily for office use (business), as opposed to manufactur-ing, warehousing, or other uses. Office buildings may sometimes have other associated uses within part of the building, i.e., retail sales, financial, or restaurant, usually on the ground floor.
Owner: The company, entity, or individual that holds title on a given building or property.
Planned/Proposed: The status of a building that has been announced for future development but not yet started construction.
Preleased Space: The amount of space in a building that has been leased prior to its construction completion date, or certificate of occupancy date.
Price/SF: Calculated by dividing the price of a building (either sales price or asking sales price) by the Rentable Building Area (RBA).
Property Manager: The company and/or person responsible for the day-to-day operations of a building, such as cleaning, trash removal, etc. The property manager also makes sure that the vari-ous systems within the building, such as the elevators, HVAC, and electrical systems, are functioning properly.
Quoted Rental Rate: The asking rate per square foot for a par-ticular building or unit of space by a broker or property owner. Quoted rental rates may differ from the actual rates paid by tenants following the negotiation of all terms and conditions in a specific lease.
RBA: Abbreviation for Rentable Building Area. (See also: Rentable Building Area)
Region: Core areas containing a large population nucleus, that together with adjacent communities have a high degree of eco-nomic and social integration. Regions are further divided into market areas, called Markets. (See also: Markets)
Relet Space: Sometimes called second generation or direct space, refers to existing space that has previously been occupied by another tenant.
Rentable Building Area: (RBA) The total square footage of a building that can be occupied by, or assigned to a tenant for the purpose of determining a tenant’s rental obligation. Generally RBA includes a percentage of common areas including all hall-ways, main lobbies, bathrooms, and telephone closets.
Rental Rates: The annual costs of occupancy for a particular space quoted on a per square foot basis.
Sales Price: The total dollar amount paid for a particular property at a particular point in time.
Sales Volume: The sum of sales prices for a given group of build-ings in a given time period.
Seller: The individual, group, company, or entity that sells a par-ticular commercial real estate asset.
SF: Abbreviation for Square Feet.
Single-Tenant: Buildings that are occupied, or intended to be occupied by a single tenant. (See also: Build-to-suit and Tenancy)
Sublease Space: Space that has been leased by a tenant and is being offered for lease back to the market by the tenant with the lease obligation. Sublease space is sometimes referred to as sublet space.
Submarkets: Specific geographic boundaries that serve to delin-eate a core group of buildings that are competitive with each other and constitute a generally accepted primary competitive set, or peer group. Submarkets are building type specific (office, industrial, retail, etc.), with distinct boundaries dependent on different factors relevant to each building type. Submarkets are non-overlapping, contiguous geographic designations having a cumulative sum that matches the boundaries of the Market they are located within (See also: Market).
Suburban: The Suburban and Central Business District (CBD) designations refer to a particular geographic area within a metro-politan statistical area (MSA). Suburban is defined as including all office inventory not located in the CBD. (See also: CBD)
Tenancy: A term used to indicate whether or not a building is occupied by multiple tenants (See also: Multi-tenant) or a single tenant. (See also: Single-tenant)
Tenant Rep: Tenant Rep stands for Tenant Representative. In a typical lease transaction between an owner/landlord and tenant, the broker that represents the interests of the tenant is referred to as a Tenant Rep.
Time On Market: A measure of how long a currently available space has been marketed for lease, regardless of whether it is vacant or occupied.
Under Construction: The status of a building that is in the process of being developed, assembled, built or constructed. A building is considered to be under construction after it has begun construc-tion and until it receives a certificate of occupancy.
Vacancy Rate: A measurement expressed as a percentage of the total amount of physically vacant space divided by the total amount of existing inventory. Under construction space generally is not included in vacancy calculations.
Vacant Space: Space that is not currently occupied by a tenant, regardless of any lease obligation that may be on the space. Vacant space could be space that is either available or not avail-able. For example, sublease space that is currently being paid for by a tenant but not occupied by that tenant, would be considered vacant space. Likewise, space that has been leased but not yet occupied because of finish work being done, would also be con-sidered vacant space.
Weighted Average Rental Rate: Rental rates that are calculated by factoring in, or weighting, the square footage associated with each particular rental rate. This has the effect of causing rental rates on larger spaces to affect the average more than that of smaller spaces. The weighted average rental rate is calculated by taking the ratio of the square footage associated with the rental rate on each individual available space to the square footage associated with rental rates on all available spaces, multiplying the rental rate by that ratio, and then adding together all the resulting numbers. Unless specifically specified otherwise, rental rate averages include both Direct and Sublet available spaces.
Year Built: The year in which a building completed construction and was issued a certificate of occupancy.
YTD: Abbreviation for Year-to-Date. Describes statistics that are cumulative from the beginning of a calendar year through what-ever time period is being studied.
Denver Industrial Market
D THE COSTAR INDUSTRIAL REPORT ©2011 COSTAR GROUP, INC.
DENVER – FIRST QUARTER 2011 FIRST QUARTER 2011 – DENVER
Denver Industrial Market
©2011 COSTAR GROUP, INC. THE COSTAR INDUSTRIAL REPORT 1
OVERVIEW
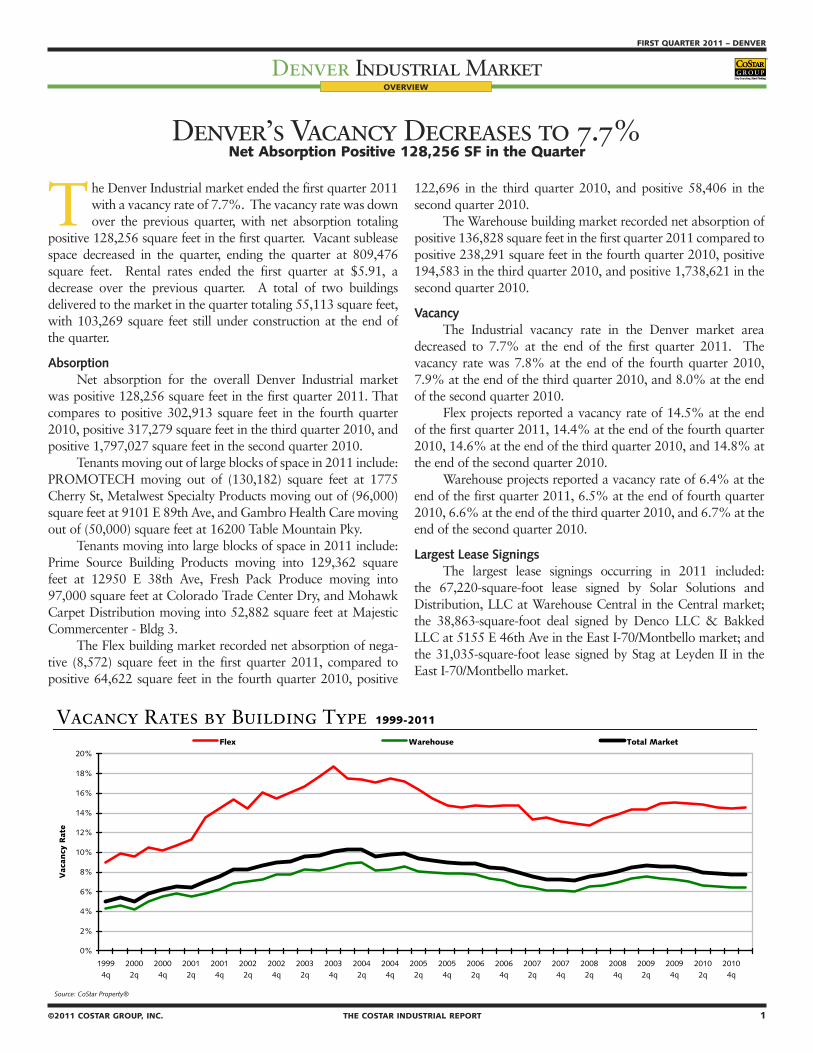
Denver’s Vacancy Decreases to 7.7% Net Absorption Positive 128,256 SF in the Quarter
The Denver Industrial market ended the first quarter 2011 with a vacancy rate of 7.7%. The vacancy rate was down over the previous quarter, with net absorption totaling
positive 128,256 square feet in the first quarter. Vacant sublease space decreased in the quarter, ending the quarter at 809,476 square feet. Rental rates ended the first quarter at $5.91, a decrease over the previous quarter. A total of two buildings delivered to the market in the quarter totaling 55,113 square feet, with 103,269 square feet still under construction at the end of the quarter.
AbsorptionNet absorption for the overall Denver Industrial market
was positive 128,256 square feet in the first quarter 2011. That compares to positive 302,913 square feet in the fourth quarter 2010, positive 317,279 square feet in the third quarter 2010, and positive 1,797,027 square feet in the second quarter 2010.
Tenants moving out of large blocks of space in 2011 include: PROMOTECH moving out of (130,182) square feet at 1775 Cherry St, Metalwest Specialty Products moving out of (96,000) square feet at 9101 E 89th Ave, and Gambro Health Care moving out of (50,000) square feet at 16200 Table Mountain Pky.
Tenants moving into large blocks of space in 2011 include: Prime Source Building Products moving into 129,362 square feet at 12950 E 38th Ave, Fresh Pack Produce moving into 97,000 square feet at Colorado Trade Center Dry, and Mohawk Carpet Distribution moving into 52,882 square feet at Majestic Commercenter - Bldg 3.
The Flex building market recorded net absorption of nega-tive (8,572) square feet in the first quarter 2011, compared to positive 64,622 square feet in the fourth quarter 2010, positive
122,696 in the third quarter 2010, and positive 58,406 in the second quarter 2010.
The Warehouse building market recorded net absorption of positive 136,828 square feet in the first quarter 2011 compared to positive 238,291 square feet in the fourth quarter 2010, positive 194,583 in the third quarter 2010, and positive 1,738,621 in the second quarter 2010.
VacancyThe Industrial vacancy rate in the Denver market area
decreased to 7.7% at the end of the first quarter 2011. The vacancy rate was 7.8% at the end of the fourth quarter 2010, 7.9% at the end of the third quarter 2010, and 8.0% at the end of the second quarter 2010.
Flex projects reported a vacancy rate of 14.5% at the end of the first quarter 2011, 14.4% at the end of the fourth quarter 2010, 14.6% at the end of the third quarter 2010, and 14.8% at the end of the second quarter 2010.
Warehouse projects reported a vacancy rate of 6.4% at the end of the first quarter 2011, 6.5% at the end of fourth quarter 2010, 6.6% at the end of the third quarter 2010, and 6.7% at the end of the second quarter 2010.
Largest Lease SigningsThe largest lease signings occurring in 2011 included:
the 67,220-square-foot lease signed by Solar Solutions and Distribution, LLC at Warehouse Central in the Central market; the 38,863-square-foot deal signed by Denco LLC & Bakked LLC at 5155 E 46th Ave in the East I-70/Montbello market; and the 31,035-square-foot lease signed by Stag at Leyden II in the East I-70/Montbello market.
Vacancy Rates by Building Type 1999-2011
Source: CoStar Property®
Absorption & Deliveries U.S. Vacancy ComparisonPast 7 Quarters Past 7 Quarters
Source: CoStar Property• Source: CoStar Property•
0%
2%
4%
6%
8%
10%
12%
14%
16%
18%
20%
19994q
20002q
20004q
20012q
20014q
20022q
20024q
20032q
20034q
20042q
20044q
20052q
20054q
20062q
20064q
20072q
20074q
20082q
20084q
20092q
20094q
20102q
20104q
Vac
ancy
Rat
e
Flex Warehouse Total Market
0.4
0.1
0.6
1.8
0.3 0.3
0.10.2
0.0 0.1
0.8
0.0 0.0 0.1
0.0
0.2
0.4
0.6
0.8
1.0
1.2
1.4
1.6
1.8
2.0
2009 3q 2009 4q 2010 1q 2010 2q 2010 3q 2010 4q 2011 1q
Millio
ns
SF
Net Absorption Deliveries
0.0%
2.0%
4.0%
6.0%
8.0%
10.0%
12.0%
2009 3q 2009 4q 2010 1q 2010 2q 2010 3q 2010 4q 2011 1q
Vac
ancy
Rat
e
Denver United States
2 THE COSTAR INDUSTRIAL REPORT ©2011 COSTAR GROUP, INC.
DENVER – FIRST QUARTER 2011
Denver Industrial MarketFIRST QUARTER 2011 – DENVER
Denver Industrial Market
©2011 COSTAR GROUP, INC. THE COSTAR INDUSTRIAL REPORT 3
OVERVIEW
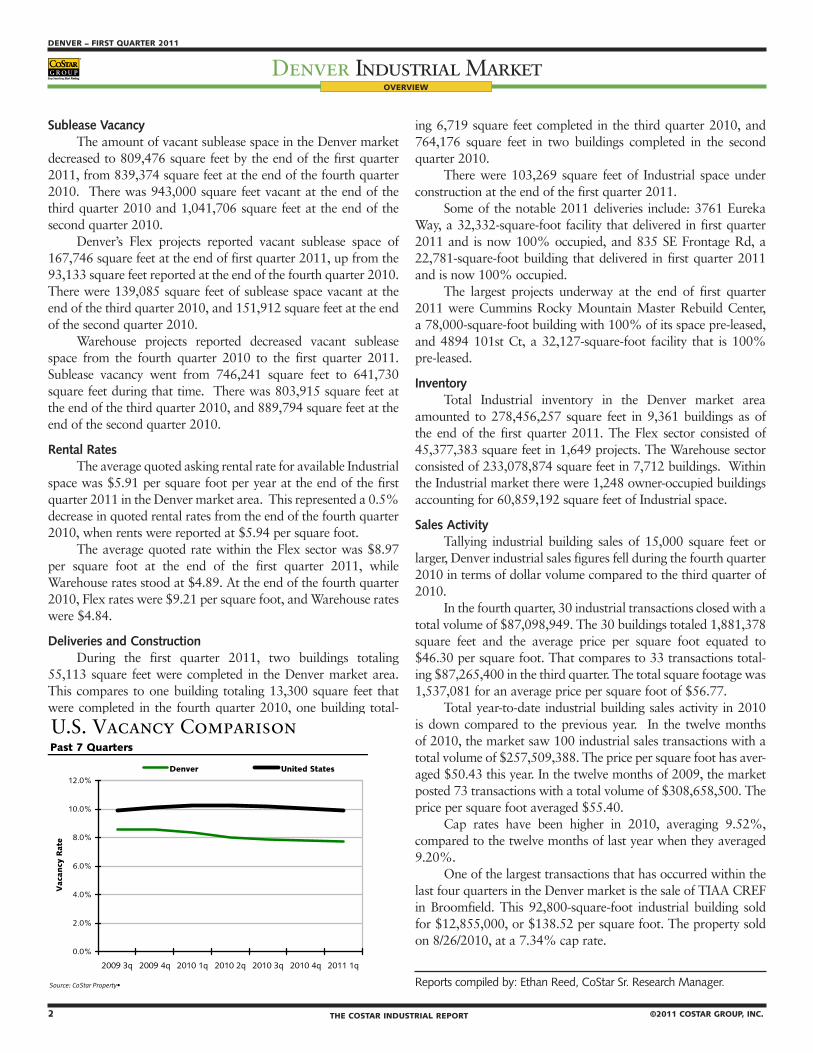
Sublease VacancyThe amount of vacant sublease space in the Denver market
decreased to 809,476 square feet by the end of the first quarter 2011, from 839,374 square feet at the end of the fourth quarter 2010. There was 943,000 square feet vacant at the end of the third quarter 2010 and 1,041,706 square feet at the end of the second quarter 2010.
Denver’s Flex projects reported vacant sublease space of 167,746 square feet at the end of first quarter 2011, up from the 93,133 square feet reported at the end of the fourth quarter 2010. There were 139,085 square feet of sublease space vacant at the end of the third quarter 2010, and 151,912 square feet at the end of the second quarter 2010.
Warehouse projects reported decreased vacant sublease space from the fourth quarter 2010 to the first quarter 2011. Sublease vacancy went from 746,241 square feet to 641,730 square feet during that time. There was 803,915 square feet at the end of the third quarter 2010, and 889,794 square feet at the end of the second quarter 2010.
Rental RatesThe average quoted asking rental rate for available Industrial
space was $5.91 per square foot per year at the end of the first quarter 2011 in the Denver market area. This represented a 0.5% decrease in quoted rental rates from the end of the fourth quarter 2010, when rents were reported at $5.94 per square foot.
The average quoted rate within the Flex sector was $8.97 per square foot at the end of the first quarter 2011, while Warehouse rates stood at $4.89. At the end of the fourth quarter 2010, Flex rates were $9.21 per square foot, and Warehouse rates were $4.84.
Deliveries and ConstructionDuring the first quarter 2011, two buildings totaling
55,113 square feet were completed in the Denver market area. This compares to one building totaling 13,300 square feet that were completed in the fourth quarter 2010, one building total-
ing 6,719 square feet completed in the third quarter 2010, and 764,176 square feet in two buildings completed in the second quarter 2010.
There were 103,269 square feet of Industrial space under construction at the end of the first quarter 2011.
Some of the notable 2011 deliveries include: 3761 Eureka Way, a 32,332-square-foot facility that delivered in first quarter 2011 and is now 100% occupied, and 835 SE Frontage Rd, a 22,781-square-foot building that delivered in first quarter 2011 and is now 100% occupied.
The largest projects underway at the end of first quarter 2011 were Cummins Rocky Mountain Master Rebuild Center, a 78,000-square-foot building with 100% of its space pre-leased, and 4894 101st Ct, a 32,127-square-foot facility that is 100% pre-leased.
InventoryTotal Industrial inventory in the Denver market area
amounted to 278,456,257 square feet in 9,361 buildings as of the end of the first quarter 2011. The Flex sector consisted of 45,377,383 square feet in 1,649 projects. The Warehouse sector consisted of 233,078,874 square feet in 7,712 buildings. Within the Industrial market there were 1,248 owner-occupied buildings accounting for 60,859,192 square feet of Industrial space.
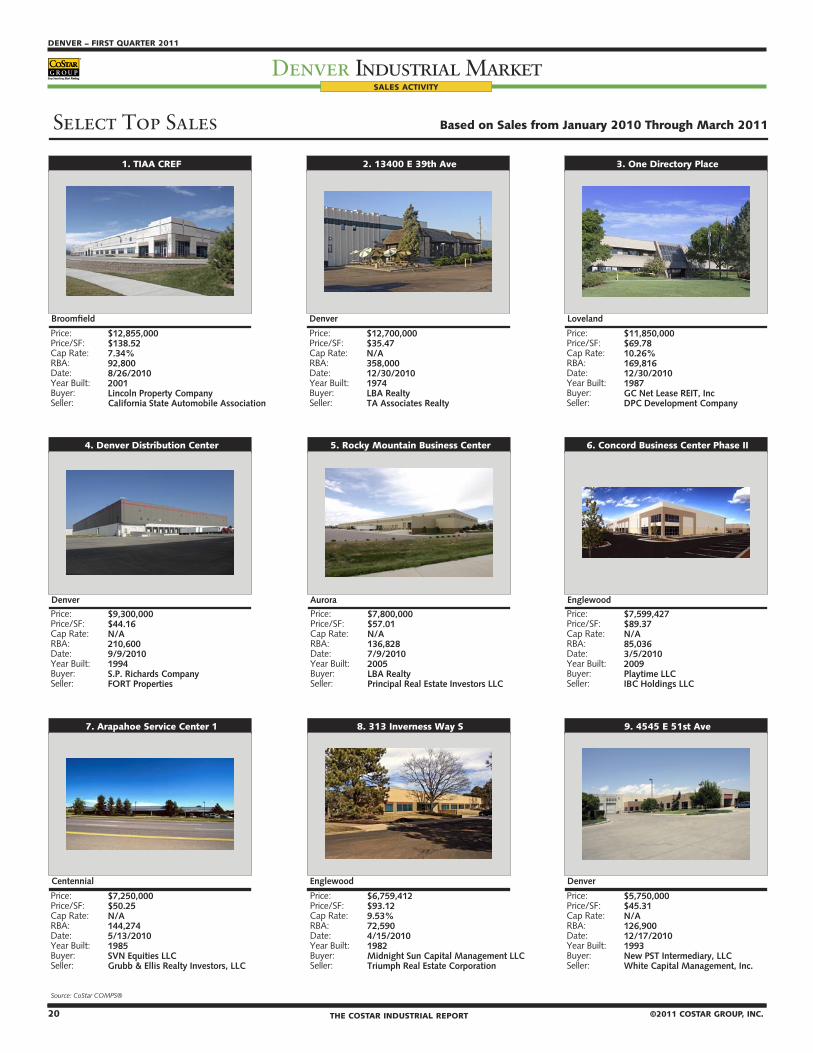
Sales ActivityTallying industrial building sales of 15,000 square feet or
larger, Denver industrial sales figures fell during the fourth quarter 2010 in terms of dollar volume compared to the third quarter of 2010.
In the fourth quarter, 30 industrial transactions closed with a total volume of $87,098,949. The 30 buildings totaled 1,881,378 square feet and the average price per square foot equated to $46.30 per square foot. That compares to 33 transactions total-ing $87,265,400 in the third quarter. The total square footage was 1,537,081 for an average price per square foot of $56.77.
Total year-to-date industrial building sales activity in 2010 is down compared to the previous year. In the twelve months of 2010, the market saw 100 industrial sales transactions with a total volume of $257,509,388. The price per square foot has aver-aged $50.43 this year. In the twelve months of 2009, the market posted 73 transactions with a total volume of $308,658,500. The price per square foot averaged $55.40.
Cap rates have been higher in 2010, averaging 9.52%, compared to the twelve months of last year when they averaged 9.20%.
One of the largest transactions that has occurred within the last four quarters in the Denver market is the sale of TIAA CREF in Broomfield. This 92,800-square-foot industrial building sold for $12,855,000, or $138.52 per square foot. The property sold on 8/26/2010, at a 7.34% cap rate.
Reports compiled by: Ethan Reed, CoStar Sr. Research Manager.
Vacancy Rates by Building Type 1999-2011
Source: CoStar Property®
Absorption & Deliveries U.S. Vacancy ComparisonPast 7 Quarters Past 7 Quarters
Source: CoStar Property• Source: CoStar Property•
0%
2%
4%
6%
8%
10%
12%
14%
16%
18%
20%
19994q
20002q
20004q
20012q
20014q
20022q
20024q
20032q
20034q
20042q
20044q
20052q
20054q
20062q
20064q
20072q
20074q
20082q
20084q
20092q
20094q
20102q
20104q
Vac
ancy
Rat
e
Flex Warehouse Total Market
0.4
0.1
0.6
1.8
0.3 0.3
0.10.2
0.0 0.1
0.8
0.0 0.0 0.1
0.0
0.2
0.4
0.6
0.8
1.0
1.2
1.4
1.6
1.8
2.0
2009 3q 2009 4q 2010 1q 2010 2q 2010 3q 2010 4q 2011 1q
Millio
ns
SF
Net Absorption Deliveries
0.0%
2.0%
4.0%
6.0%
8.0%
10.0%
12.0%
2009 3q 2009 4q 2010 1q 2010 2q 2010 3q 2010 4q 2011 1q
Vac
ancy
Rat
e
Denver United States
2 THE COSTAR INDUSTRIAL REPORT ©2011 COSTAR GROUP, INC.
DENVER – FIRST QUARTER 2011
Denver Industrial MarketFIRST QUARTER 2011 – DENVER
Denver Industrial Market
©2011 COSTAR GROUP, INC. THE COSTAR INDUSTRIAL REPORT 3
CoStar Markets & Submarkets
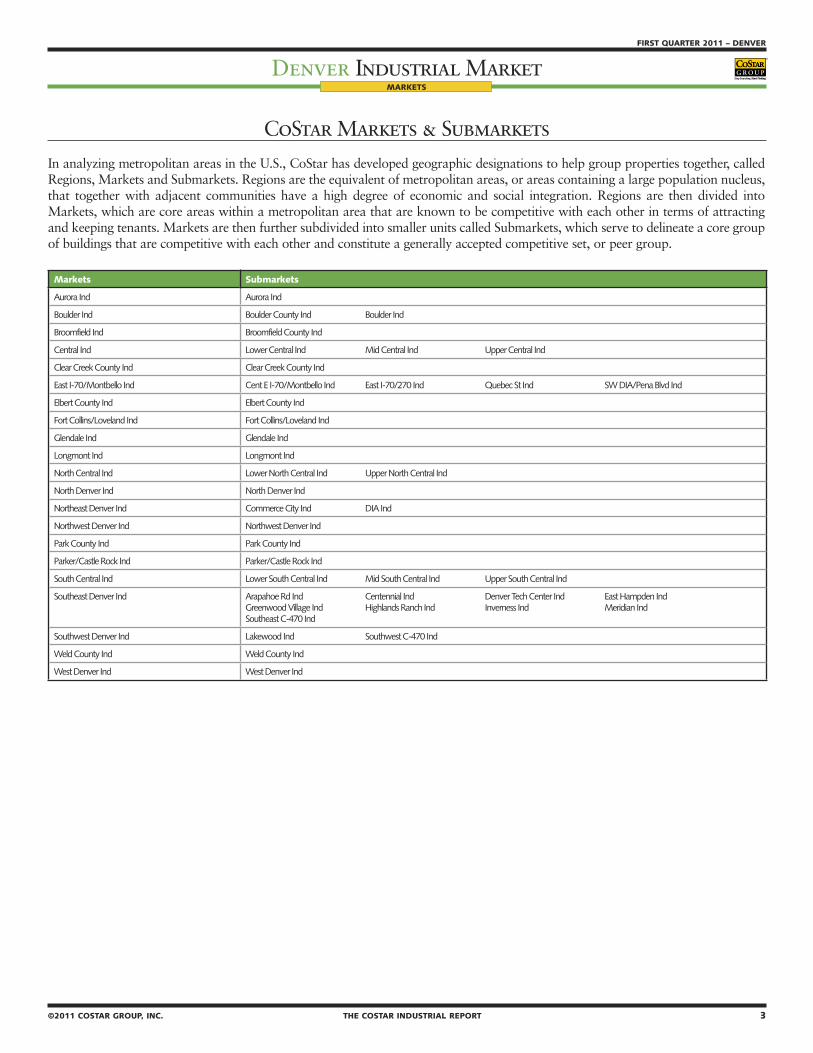
In analyzing metropolitan areas in the U.S., CoStar has developed geographic designations to help group properties together, called Regions, Markets and Submarkets. Regions are the equivalent of metropolitan areas, or areas containing a large population nucleus, that together with adjacent communities have a high degree of economic and social integration. Regions are then divided into Markets, which are core areas within a metropolitan area that are known to be competitive with each other in terms of attracting and keeping tenants. Markets are then further subdivided into smaller units called Submarkets, which serve to delineate a core group of buildings that are competitive with each other and constitute a generally accepted competitive set, or peer group.
MARKETS
Markets Submarkets
Aurora Ind Aurora Ind
Boulder Ind Boulder County Ind Boulder Ind
Broomfield Ind Broomfield County Ind
Central Ind Lower Central Ind Mid Central Ind Upper Central Ind
Clear Creek County Ind Clear Creek County Ind
East I-70/Montbello Ind Cent E I-70/Montbello Ind East I-70/270 Ind Quebec St Ind SW DIA/Pena Blvd Ind
Elbert County Ind Elbert County Ind
Fort Collins/Loveland Ind Fort Collins/Loveland Ind
Glendale Ind Glendale Ind
Longmont Ind Longmont Ind
North Central Ind Lower North Central Ind Upper North Central Ind
North Denver Ind North Denver Ind
Northeast Denver Ind Commerce City Ind DIA Ind
Northwest Denver Ind Northwest Denver Ind
Park County Ind Park County Ind
Parker/Castle Rock Ind Parker/Castle Rock Ind
South Central Ind Lower South Central Ind Mid South Central Ind Upper South Central Ind
Southeast Denver Ind Arapahoe Rd Ind Centennial Ind Denver Tech Center Ind East Hampden IndGreenwood Village Ind Highlands Ranch Ind Inverness Ind Meridian IndSoutheast C-470 Ind
Southwest Denver Ind Lakewood Ind Southwest C-470 Ind
Weld County Ind Weld County Ind
West Denver Ind West Denver Ind
4 THE COSTAR INDUSTRIAL REPORT ©2011 COSTAR GROUP, INC.
DENVER – FIRST QUARTER 2011
Denver Industrial MarketFIRST QUARTER 2011 – DENVER
Denver Industrial Market
©2011 COSTAR GROUP, INC. THE COSTAR INDUSTRIAL REPORT 5
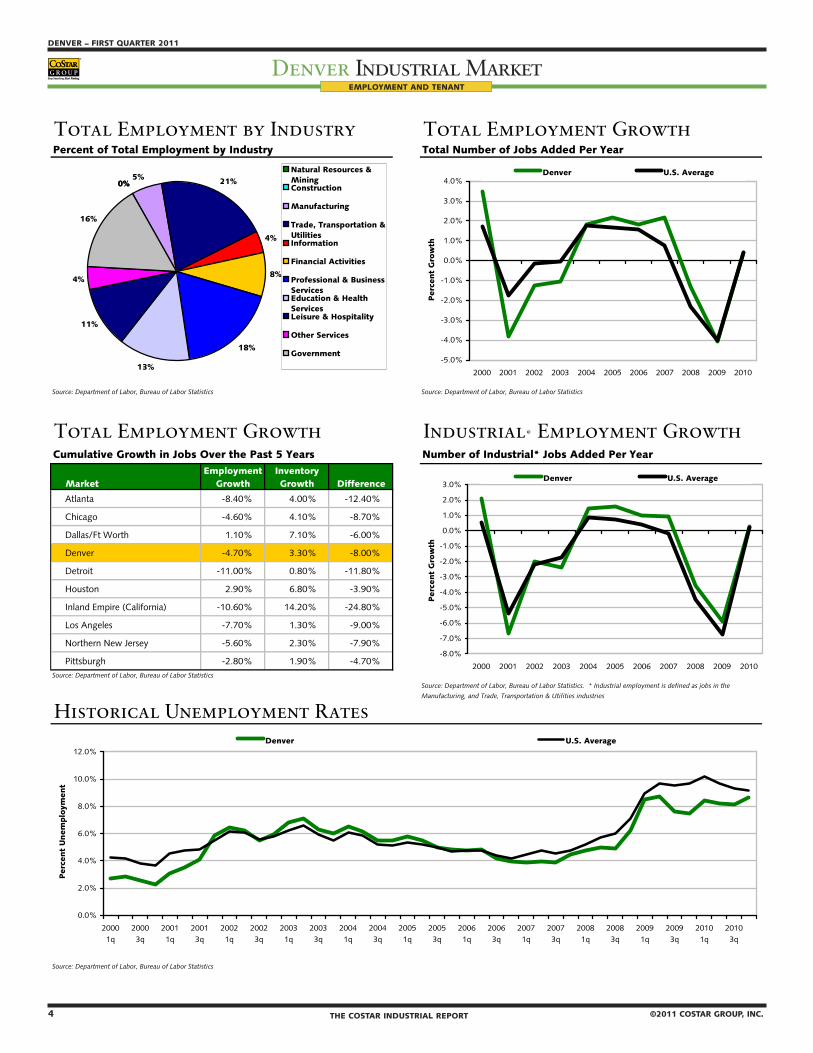
Total Employment by Industry Total Employment GrowthPercent of Total Employment by Industry Total Number of Jobs Added Per Year
Source: Department of Labor, Bureau of Labor Statistics Source: Department of Labor, Bureau of Labor Statistics
Total Employment Growth Industrial* Employment GrowthCumulative Growth in Jobs Over the Past 5 Years Number of Industrial* Jobs Added Per Year
MarketEmployment
GrowthInventory Growth Difference
Atlanta -8.40% 4.00% -12.40%
Chicago -4.60% 4.10% -8.70%
Dallas/Ft Worth 1.10% 7.10% -6.00%
Denver -4.70% 3.30% -8.00%
Detroit -11.00% 0.80% -11.80%
Houston 2.90% 6.80% -3.90%
Inland Empire (California) -10.60% 14.20% -24.80%
Los Angeles -7.70% 1.30% -9.00%
Northern New Jersey -5.60% 2.30% -7.90%
Pittsburgh -2.80% 1.90% -4.70% Source: Department of Labor, Bureau of Labor Statistics
Historical Unemployment Rates
Source: Department of Labor, Bureau of Labor Statistics
Source: Department of Labor, Bureau of Labor Statistics. * Industrial employment is defined as jobs in the
Manufacturing, and Trade, Transportation & Utilities industries
-5.0%
-4.0%
-3.0%
-2.0%
-1.0%
0.0%
1.0%
2.0%
3.0%
4.0%
2000 2001 2002 2003 2004 2005 2006 2007 2008 2009 2010
Perc
ent
Gro
wth
Denver U.S. Average
13%
11%
4%
16%
0%
18%
5% 21%
4%
8%
0%
Natural Resources &MiningConstruction
Manufacturing
Trade, Transportation &UtilitiesInformation
Financial Activities
Professional & BusinessServicesEducation & HealthServicesLeisure & Hospitality
Other Services
Government
-8.0%
-7.0%
-6.0%
-5.0%
-4.0%
-3.0%
-2.0%
-1.0%
0.0%
1.0%
2.0%
3.0%
2000 2001 2002 2003 2004 2005 2006 2007 2008 2009 2010
Perc
ent
Gro
wth
Denver U.S. Average
0.0%
2.0%
4.0%
6.0%
8.0%
10.0%
12.0%
20001q
20003q
20011q
20013q
20021q
20023q
20031q
20033q
20041q
20043q
20051q
20053q
20061q
20063q
20071q
20073q
20081q
20083q
20091q
20093q
20101q
20103q
Perc
ent
Unem
plo
yment
Denver U.S. Average
EMPLOYMENT AND TENANT
4 THE COSTAR INDUSTRIAL REPORT ©2011 COSTAR GROUP, INC.
DENVER – FIRST QUARTER 2011
Denver Industrial MarketFIRST QUARTER 2011 – DENVER
Denver Industrial Market
©2011 COSTAR GROUP, INC. THE COSTAR INDUSTRIAL REPORT 5
EMPLOYMENT AND TENANT
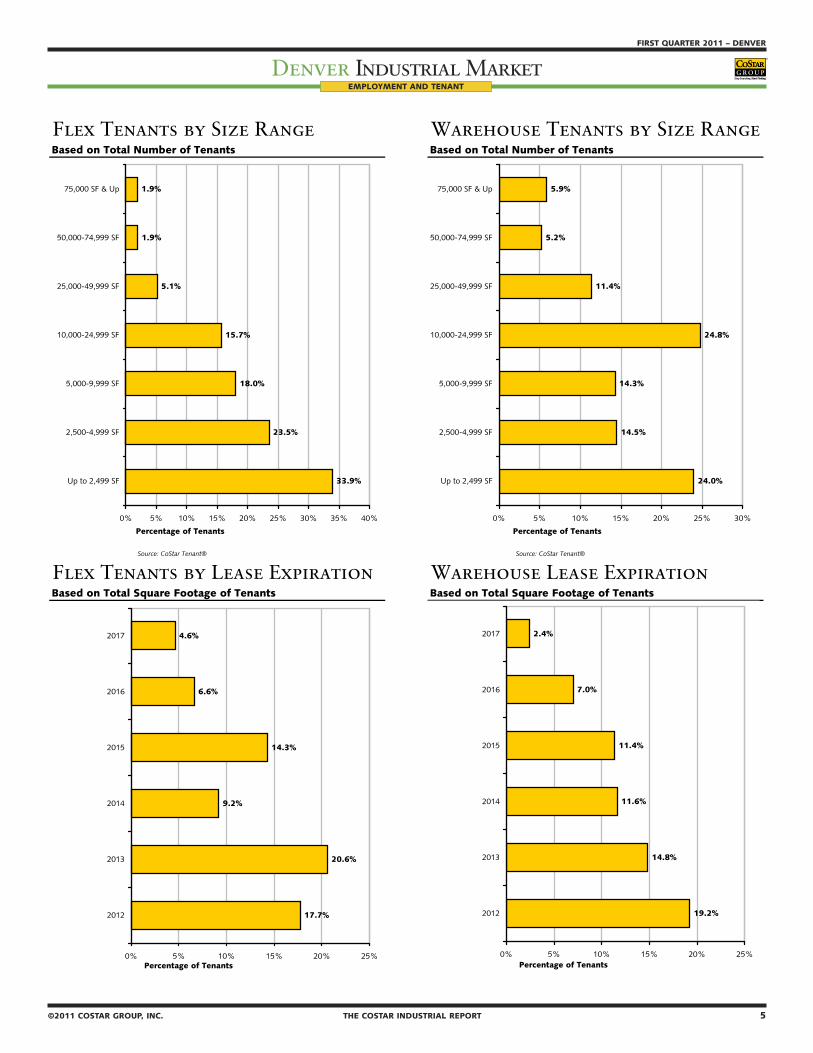
Flex Tenants by Size Range Warehouse Tenants by Size RangeBased on Total Number of Tenants Based on Total Number of Tenants
Source: CoStar Tenant® Source: CoStar Tenant®
Flex Tenants by Lease Expiration Warehouse Lease ExpirationBased on Total Square Footage of Tenants Based on Total Square Footage of Tenants
33.9%
23.5%
18.0%
15.7%
5.1%
1.9%
1.9%
0% 5% 10% 15% 20% 25% 30% 35% 40%
Up to 2,499 SF
2,500-4,999 SF
5,000-9,999 SF
10,000-24,999 SF
25,000-49,999 SF
50,000-74,999 SF
75,000 SF & Up
Percentage of Tenants
19.2%
14.8%
11.6%
11.4%
7.0%
2.4%
0% 5% 10% 15% 20% 25%
2012
2013
2014
2015
2016
2017
Percentage of Tenants
17.7%
20.6%
9.2%
14.3%
6.6%
4.6%
0% 5% 10% 15% 20% 25%
2012
2013
2014
2015
2016
2017
Percentage of Tenants
24.0%
14.5%
14.3%
24.8%
11.4%
5.2%
5.9%
0% 5% 10% 15% 20% 25% 30%
Up to 2,499 SF
2,500-4,999 SF
5,000-9,999 SF
10,000-24,999 SF
25,000-49,999 SF
50,000-74,999 SF
75,000 SF & Up
Percentage of Tenants
6 THE COSTAR INDUSTRIAL REPORT ©2011 COSTAR GROUP, INC.
DENVER – FIRST QUARTER 2011
Denver Industrial MarketFIRST QUARTER 2011 – DENVER
Denver Industrial Market
©2011 COSTAR GROUP, INC. THE COSTAR INDUSTRIAL REPORT 7
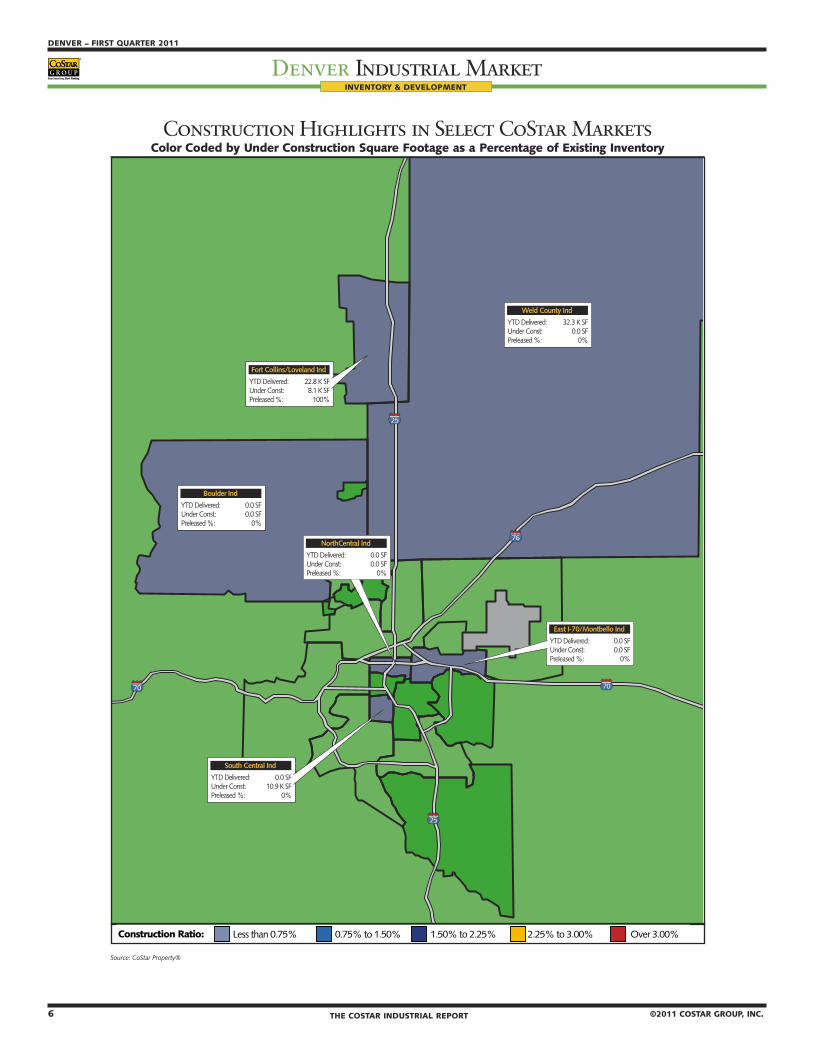
Construction Highlights in Select CoStar MarketsColor Coded by Under Construction Square Footage as a Percentage of Existing Inventory
INVENTORY & DEVELOPMENT
��
��
��
��
��
��� ���������� ���� � ������� ������ ��� ����������� �� ��
���������� ���
��� ���������� ��� ������� ������ ��� ����������� �� ��
������� ���
��� ���������� ��� ������� ������ ��� ����������� �� ��
���� �������������� ���
��� ���������� ��� ������� ������ ���� � ����������� �� ��
����� ������� ���
��� ���������� ��� ������� ������ ��� ����������� �� ��
������������ ���
��� ���������� ���� � ������� ������ ��� � ����������� �� ����
���� ���������������� ���
������������ ������ ���� ���������� �� ���������� �� ���������� �� ��������� ���� �����
Source: CoStar Property®
6 THE COSTAR INDUSTRIAL REPORT ©2011 COSTAR GROUP, INC.
DENVER – FIRST QUARTER 2011
Denver Industrial MarketFIRST QUARTER 2011 – DENVER
Denver Industrial Market
©2011 COSTAR GROUP, INC. THE COSTAR INDUSTRIAL REPORT 7
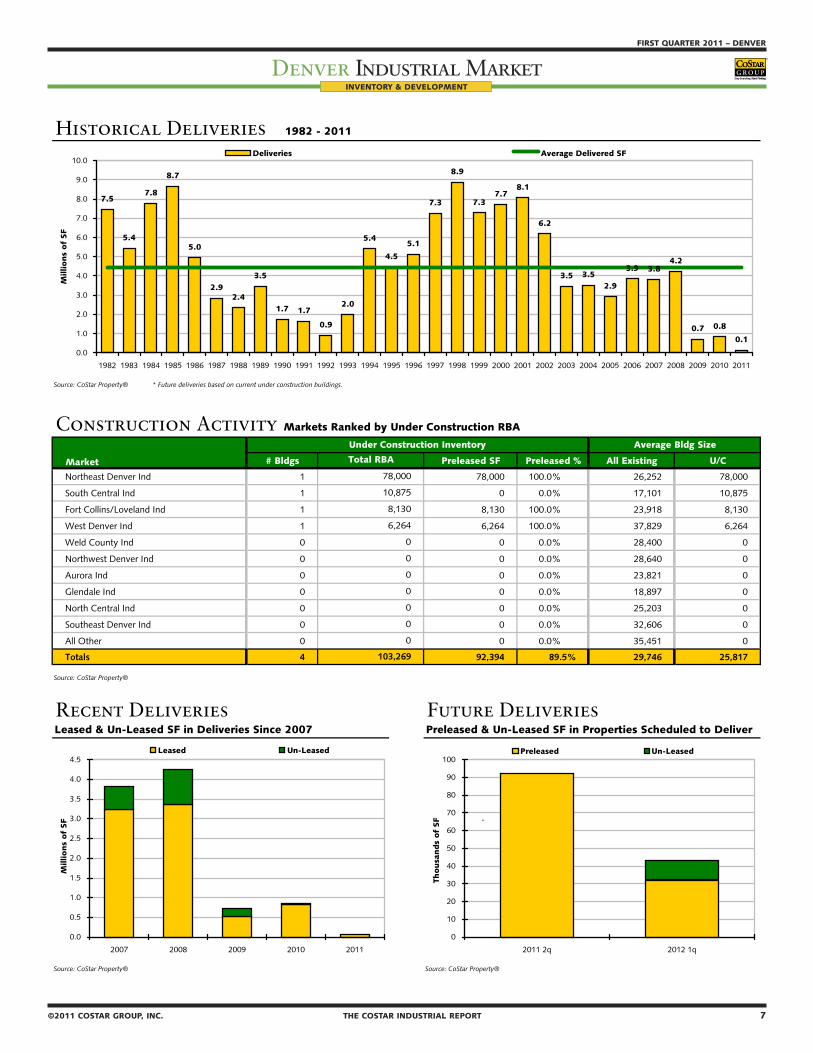
Historical Deliveries 1982 - 2011
Source: CoStar Property® * Future deliveries based on current under construction buildings.
Construction Activity Markets Ranked by Under Construction RBA
# Bldgs Preleased SF Preleased % All Existing U/C
Northeast Denver Ind 1 78,000 100.0% 26,252 78,000
South Central Ind 1 0 0.0% 17,101 10,875
Fort Collins/Loveland Ind 1 8,130 100.0% 23,918 8,130
West Denver Ind 1 6,264 100.0% 37,829 6,264
Weld County Ind 0 0 0.0% 28,400 0
Northwest Denver Ind 0 0 0.0% 28,640 0
Aurora Ind 0 0 0.0% 23,821 0
Glendale Ind 0 0 0.0% 18,897 0
North Central Ind 0 0 0.0% 25,203 0
Southeast Denver Ind 0 0 0.0% 32,606 0
All Other 0 0 0.0% 35,451 0
Totals 4 92,394 89.5% 29,746 25,817
Source: CoStar Property®
Recent Deliveries Future Deliveries Leased & Un-Leased SF in Deliveries Since 2007 Preleased & Un-Leased SF in Properties Scheduled to Deliver
Source: CoStar Property® Source: CoStar Property®
0
0
0
Market
Under Construction Inventory Average Bldg Size
Total RBA
0
78,000
103,269
10,875
8,130
6,264
0
0
0
7.5
5.4
7.8
8.7
5.0
2.92.4
3.5
1.7 1.7
0.9
2.0
5.4
4.5
5.1
7.3
8.9
7.37.7
8.1
6.2
3.5 3.52.9
3.9 3.84.2
0.7 0.8
0.1
0.0
1.0
2.0
3.0
4.0
5.0
6.0
7.0
8.0
9.0
10.0
1982 1983 1984 1985 1986 1987 1988 1989 1990 1991 1992 1993 1994 1995 1996 1997 1998 1999 2000 2001 2002 2003 2004 2005 2006 2007 2008 2009 2010 2011
Millio
ns
of
SF
Deliveries Average Delivered SF
0.0
0.5
1.0
1.5
2.0
2.5
3.0
3.5
4.0
4.5
2007 2008 2009 2010 2011
Millio
ns
of
SF
Leased Un-Leased
0
10
20
30
40
50
60
70
80
90
100
2011 2q 2012 1q
T
Thousa
nds
of
SF
Preleased Un-Leased
INVENTORY & DEVELOPMENT
8 THE COSTAR INDUSTRIAL REPORT ©2011 COSTAR GROUP, INC.
DENVER – FIRST QUARTER 2011
Denver Industrial MarketFIRST QUARTER 2011 – DENVER
Denver Industrial Market
©2011 COSTAR GROUP, INC. THE COSTAR INDUSTRIAL REPORT 9
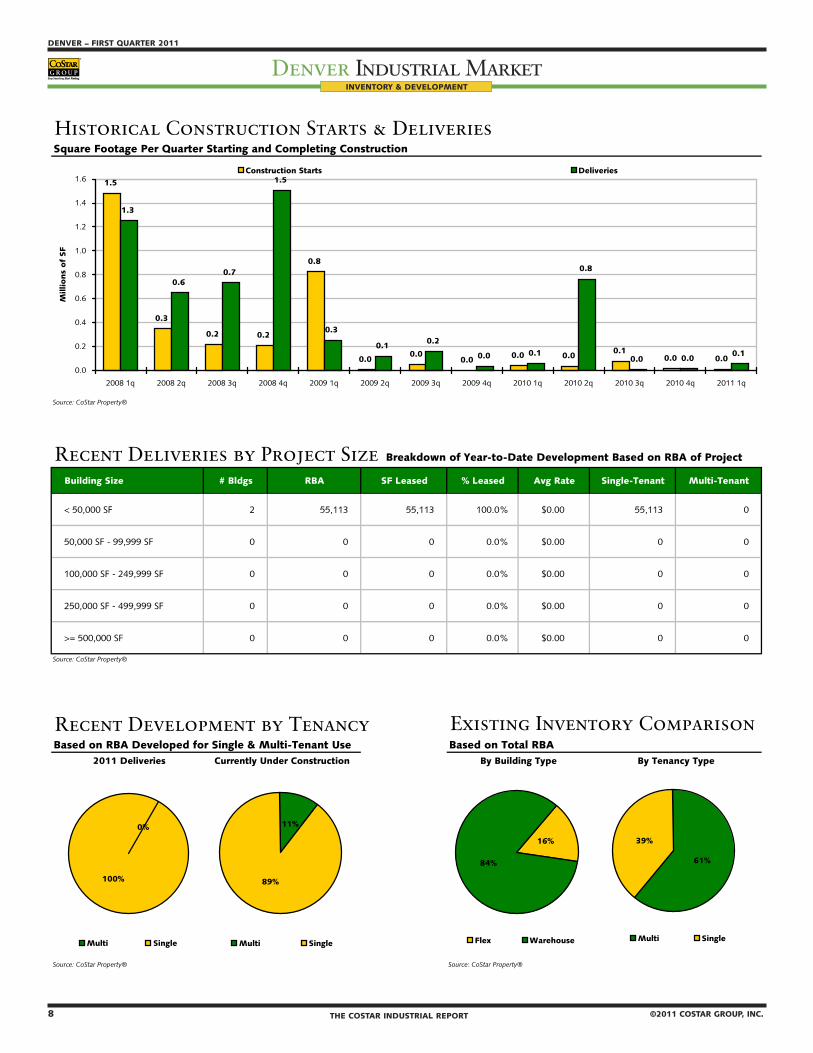
Historical Construction Starts & DeliveriesSquare Footage Per Quarter Starting and Completing Construction
Source: CoStar Property®
Recent Deliveries by Project Size Breakdown of Year-to-Date Development Based on RBA of Project
Building Size # Bldgs RBA SF Leased % Leased Avg Rate Single-Tenant Multi-Tenant
< 50,000 SF 2 55,113 55,113 100.0% $0.00 55,113 0
50,000 SF - 99,999 SF 0 0 0 0.0% $0.00 0 0
100,000 SF - 249,999 SF 0 0 0 0.0% $0.00 0 0
250,000 SF - 499,999 SF 0 0 0 0.0% $0.00 0 0
>= 500,000 SF 0 0 0 0.0% $0.00 0 0
Source: CoStar Property®
Recent Development by Tenancy Existing Inventory ComparisonBased on RBA Developed for Single & Multi-Tenant Use Based on Total RBA
2011 Deliveries
Source: CoStar Property® Source: CoStar Property®
Currently Under Construction By Building Type By Tenancy Type
1.5
0.3
0.2 0.2
0.8
0.00.0
0.0 0.0 0.00.1
0.0 0.0
1.3
0.60.7
1.5
0.3
0.10.2
0.0 0.1
0.8
0.0 0.00.1
0.0
0.2
0.4
0.6
0.8
1.0
1.2
1.4
1.6
2008 1q 2008 2q 2008 3q 2008 4q 2009 1q 2009 2q 2009 3q 2009 4q 2010 1q 2010 2q 2010 3q 2010 4q 2011 1q
Millio
ns
of
SF
Construction Starts Deliveries
11%
89%
Multi Single
100%
0%
Multi Single
16%
84%
Flex Warehouse
39%
61%
Multi Single
INVENTORY & DEVELOPMENT

8 THE COSTAR INDUSTRIAL REPORT ©2011 COSTAR GROUP, INC.
DENVER – FIRST QUARTER 2011
Denver Industrial MarketFIRST QUARTER 2011 – DENVER
Denver Industrial Market
©2011 COSTAR GROUP, INC. THE COSTAR INDUSTRIAL REPORT 9
������������������������������ �������������������������������
������������������������
���� �������������������������� ���������������������������������� ���������������� ����������������� ������������������������������������������������ ������������������������������ �������������������������
��������������������� ����
���� ����������������������������� ���������������������������������
����������� ���������������� ����������������� ������������������������������������������������� ������������������������������ ���������������������������������� ����
INVENTORY & DEVELOPMENT
���������������������������������������� �������������������������������
������������������������
���� ������������������������������������������������������� ����������������������������
����������� ����������������� ����������������� ������������������������������������������������ ������������������������������� ������������������������������������� ����
���� ������������������������ ����������������������������������� ����������������� ����������������� ������������������������������������������������ ������������������������������ ������������������������������������ ����
���� ���������������������������� ������������������������������������ ����������������� ��������������� ������������������������������������������������������� ������������������������������ ������������������������������
�������������� ����
���� ������������������������������ ���������������������������������
����������� ���������������� ����������������� ������������������������������������������������� ������������������������������� ����������������������������������� ����
���� ������������������������ ���������������������������������� ���������������� ����������������� ������������������������������������������������� ������������������������������� ���������������������������������������� ����
10 THE COSTAR INDUSTRIAL REPORT ©2011 COSTAR GROUP, INC.
DENVER – FIRST QUARTER 2011
Denver Industrial MarketFIRST QUARTER 2011 – DENVER
Denver Industrial Market
©2011 COSTAR GROUP, INC. THE COSTAR INDUSTRIAL REPORT 11
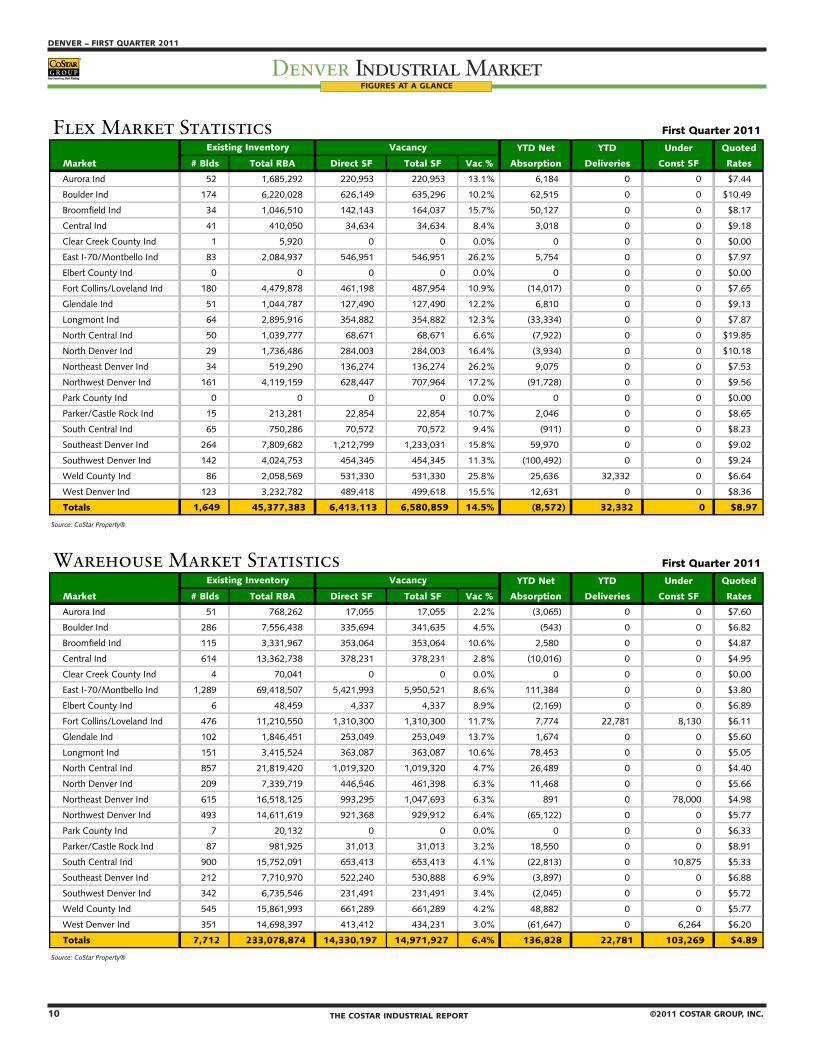
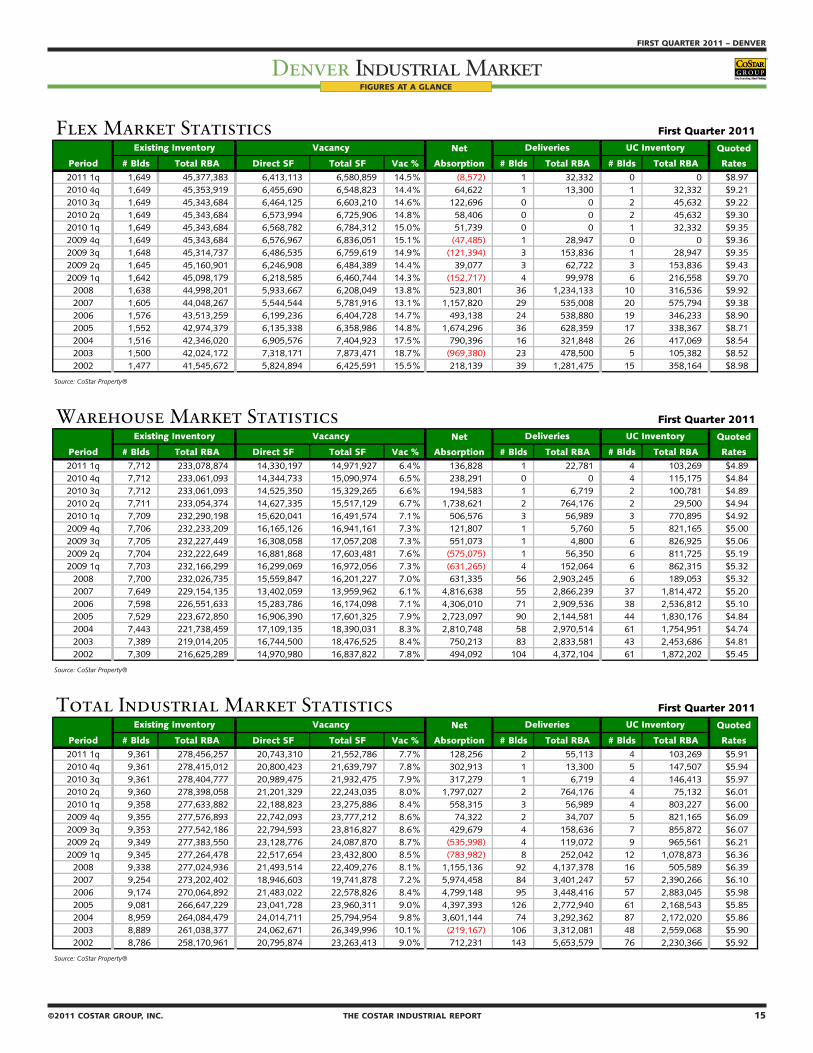
Flex Market Statistics First Quarter 2011
YTD Net YTD Under Quoted
Market # Blds Total RBA Direct SF Total SF Vac % Absorption Deliveries Const SF Rates
Aurora Ind 52 1,685,292 220,953 220,953 13.1% 6,184 0 0 $7.44
Boulder Ind 174 6,220,028 626,149 635,296 10.2% 62,515 0 0 $10.49
Broomfield Ind 34 1,046,510 142,143 164,037 15.7% 50,127 0 0 $8.17
Central Ind 41 410,050 34,634 34,634 8.4% 3,018 0 0 $9.18
Clear Creek County Ind 1 5,920 0 0 0.0% 0 0 0 $0.00
East I-70/Montbello Ind 83 2,084,937 546,951 546,951 26.2% 5,754 0 0 $7.97
Elbert County Ind 0 0 0 0 0.0% 0 0 0 $0.00
Fort Collins/Loveland Ind 180 4,479,878 461,198 487,954 10.9% (14,017) 0 0 $7.65
Glendale Ind 51 1,044,787 127,490 127,490 12.2% 6,810 0 0 $9.13
Longmont Ind 64 2,895,916 354,882 354,882 12.3% (33,334) 0 0 $7.87
North Central Ind 50 1,039,777 68,671 68,671 6.6% (7,922) 0 0 $19.85
North Denver Ind 29 1,736,486 284,003 284,003 16.4% (3,934) 0 0 $10.18
Northeast Denver Ind 34 519,290 136,274 136,274 26.2% 9,075 0 0 $7.53
Northwest Denver Ind 161 4,119,159 628,447 707,964 17.2% (91,728) 0 0 $9.56
Park County Ind 0 0 0 0 0.0% 0 0 0 $0.00
Parker/Castle Rock Ind 15 213,281 22,854 22,854 10.7% 2,046 0 0 $8.65
South Central Ind 65 750,286 70,572 70,572 9.4% (911) 0 0 $8.23
Southeast Denver Ind 264 7,809,682 1,212,799 1,233,031 15.8% 59,970 0 0 $9.02
Southwest Denver Ind 142 4,024,753 454,345 454,345 11.3% (100,492) 0 0 $9.24
Weld County Ind 86 2,058,569 531,330 531,330 25.8% 25,636 32,332 0 $6.64
West Denver Ind 123 3,232,782 489,418 499,618 15.5% 12,631 0 0 $8.36
Totals 1,649 45,377,383 6,413,113 6,580,859 14.5% (8,572) 32,332 0 $8.97
Source: CoStar Property®
Warehouse Market Statistics First Quarter 2011
YTD Net YTD Under Quoted
Market # Blds Total RBA Direct SF Total SF Vac % Absorption Deliveries Const SF Rates
Aurora Ind 51 768,262 17,055 17,055 2.2% (3,065) 0 0 $7.60
Boulder Ind 286 7,556,438 335,694 341,635 4.5% (543) 0 0 $6.82
Broomfield Ind 115 3,331,967 353,064 353,064 10.6% 2,580 0 0 $4.87
Central Ind 614 13,362,738 378,231 378,231 2.8% (10,016) 0 0 $4.95
Clear Creek County Ind 4 70,041 0 0 0.0% 0 0 0 $0.00
East I-70/Montbello Ind 1,289 69,418,507 5,421,993 5,950,521 8.6% 111,384 0 0 $3.80
Elbert County Ind 6 48,459 4,337 4,337 8.9% (2,169) 0 0 $6.89
Fort Collins/Loveland Ind 476 11,210,550 1,310,300 1,310,300 11.7% 7,774 22,781 8,130 $6.11
Glendale Ind 102 1,846,451 253,049 253,049 13.7% 1,674 0 0 $5.60
Longmont Ind 151 3,415,524 363,087 363,087 10.6% 78,453 0 0 $5.05
North Central Ind 857 21,819,420 1,019,320 1,019,320 4.7% 26,489 0 0 $4.40
North Denver Ind 209 7,339,719 446,546 461,398 6.3% 11,468 0 0 $5.66
Northeast Denver Ind 615 16,518,125 993,295 1,047,693 6.3% 891 0 78,000 $4.98
Northwest Denver Ind 493 14,611,619 921,368 929,912 6.4% (65,122) 0 0 $5.77
Park County Ind 7 20,132 0 0 0.0% 0 0 0 $6.33
Parker/Castle Rock Ind 87 981,925 31,013 31,013 3.2% 18,550 0 0 $8.91
South Central Ind 900 15,752,091 653,413 653,413 4.1% (22,813) 0 10,875 $5.33
Southeast Denver Ind 212 7,710,970 522,240 530,888 6.9% (3,897) 0 0 $6.88
Southwest Denver Ind 342 6,735,546 231,491 231,491 3.4% (2,045) 0 0 $5.72
Weld County Ind 545 15,861,993 661,289 661,289 4.2% 48,882 0 0 $5.77
West Denver Ind 351 14,698,397 413,412 434,231 3.0% (61,647) 0 6,264 $6.20
Totals 7,712 233,078,874 14,330,197 14,971,927 6.4% 136,828 22,781 103,269 $4.89
Source: CoStar Property®
Existing Inventory Vacancy
Existing Inventory Vacancy
FIGURES AT A GLANCE
10 THE COSTAR INDUSTRIAL REPORT ©2011 COSTAR GROUP, INC.
DENVER – FIRST QUARTER 2011
Denver Industrial MarketFIRST QUARTER 2011 – DENVER
Denver Industrial Market
©2011 COSTAR GROUP, INC. THE COSTAR INDUSTRIAL REPORT 11
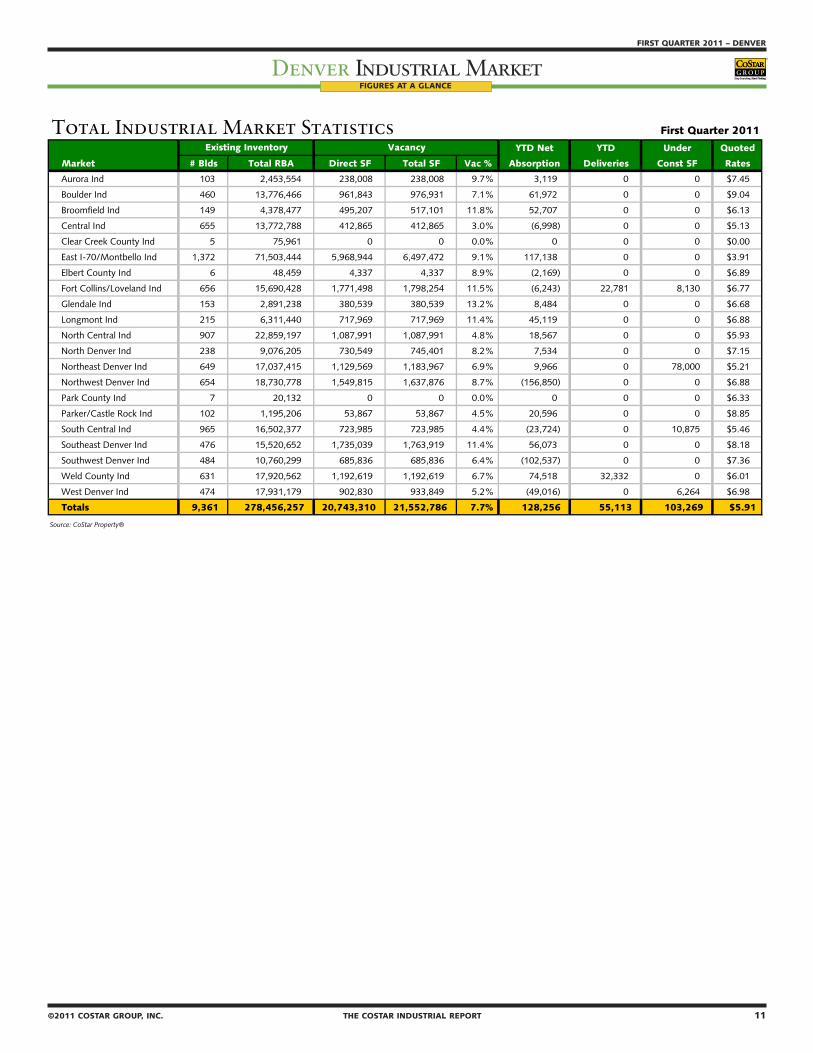
Total Industrial Market Statistics First Quarter 2011
YTD Net YTD Under Quoted
Market # Blds Total RBA Direct SF Total SF Vac % Absorption Deliveries Const SF Rates
Aurora Ind 103 2,453,554 238,008 238,008 9.7% 3,119 0 0 $7.45
Boulder Ind 460 13,776,466 961,843 976,931 7.1% 61,972 0 0 $9.04
Broomfield Ind 149 4,378,477 495,207 517,101 11.8% 52,707 0 0 $6.13
Central Ind 655 13,772,788 412,865 412,865 3.0% (6,998) 0 0 $5.13
Clear Creek County Ind 5 75,961 0 0 0.0% 0 0 0 $0.00
East I-70/Montbello Ind 1,372 71,503,444 5,968,944 6,497,472 9.1% 117,138 0 0 $3.91
Elbert County Ind 6 48,459 4,337 4,337 8.9% (2,169) 0 0 $6.89
Fort Collins/Loveland Ind 656 15,690,428 1,771,498 1,798,254 11.5% (6,243) 22,781 8,130 $6.77
Glendale Ind 153 2,891,238 380,539 380,539 13.2% 8,484 0 0 $6.68
Longmont Ind 215 6,311,440 717,969 717,969 11.4% 45,119 0 0 $6.88
North Central Ind 907 22,859,197 1,087,991 1,087,991 4.8% 18,567 0 0 $5.93
North Denver Ind 238 9,076,205 730,549 745,401 8.2% 7,534 0 0 $7.15
Northeast Denver Ind 649 17,037,415 1,129,569 1,183,967 6.9% 9,966 0 78,000 $5.21
Northwest Denver Ind 654 18,730,778 1,549,815 1,637,876 8.7% (156,850) 0 0 $6.88
Park County Ind 7 20,132 0 0 0.0% 0 0 0 $6.33
Parker/Castle Rock Ind 102 1,195,206 53,867 53,867 4.5% 20,596 0 0 $8.85
South Central Ind 965 16,502,377 723,985 723,985 4.4% (23,724) 0 10,875 $5.46
Southeast Denver Ind 476 15,520,652 1,735,039 1,763,919 11.4% 56,073 0 0 $8.18
Southwest Denver Ind 484 10,760,299 685,836 685,836 6.4% (102,537) 0 0 $7.36
Weld County Ind 631 17,920,562 1,192,619 1,192,619 6.7% 74,518 32,332 0 $6.01
West Denver Ind 474 17,931,179 902,830 933,849 5.2% (49,016) 0 6,264 $6.98
Totals 9,361 278,456,257 20,743,310 21,552,786 7.7% 128,256 55,113 103,269 $5.91
Source: CoStar Property®
Existing Inventory Vacancy
FIGURES AT A GLANCE
12 THE COSTAR INDUSTRIAL REPORT ©2011 COSTAR GROUP, INC.
DENVER – FIRST QUARTER 2011
Denver Industrial MarketFIRST QUARTER 2011 – DENVER
Denver Industrial Market
©2011 COSTAR GROUP, INC. THE COSTAR INDUSTRIAL REPORT 13
FIGURES AT A GLANCE
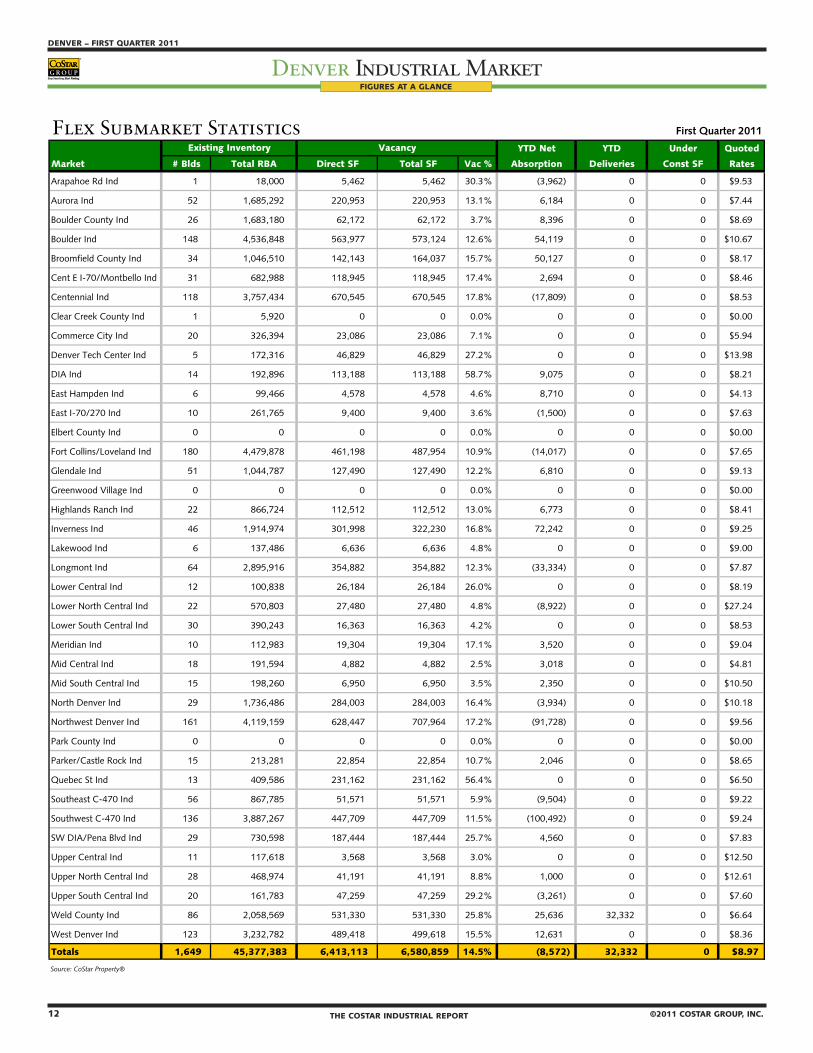
Flex Submarket Statistics First Quarter 2011
YTD Net YTD Under Quoted
Market # Blds Total RBA Direct SF Total SF Vac % Absorption Deliveries Const SF Rates
Arapahoe Rd Ind 1 18,000 5,462 5,462 30.3% (3,962) 0 0 $9.53
Aurora Ind 52 1,685,292 220,953 220,953 13.1% 6,184 0 0 $7.44
Boulder County Ind 26 1,683,180 62,172 62,172 3.7% 8,396 0 0 $8.69
Boulder Ind 148 4,536,848 563,977 573,124 12.6% 54,119 0 0 $10.67
Broomfield County Ind 34 1,046,510 142,143 164,037 15.7% 50,127 0 0 $8.17
Cent E I-70/Montbello Ind 31 682,988 118,945 118,945 17.4% 2,694 0 0 $8.46
Centennial Ind 118 3,757,434 670,545 670,545 17.8% (17,809) 0 0 $8.53
Clear Creek County Ind 1 5,920 0 0 0.0% 0 0 0 $0.00
Commerce City Ind 20 326,394 23,086 23,086 7.1% 0 0 0 $5.94
Denver Tech Center Ind 5 172,316 46,829 46,829 27.2% 0 0 0 $13.98
DIA Ind 14 192,896 113,188 113,188 58.7% 9,075 0 0 $8.21
East Hampden Ind 6 99,466 4,578 4,578 4.6% 8,710 0 0 $4.13
East I-70/270 Ind 10 261,765 9,400 9,400 3.6% (1,500) 0 0 $7.63
Elbert County Ind 0 0 0 0 0.0% 0 0 0 $0.00
Fort Collins/Loveland Ind 180 4,479,878 461,198 487,954 10.9% (14,017) 0 0 $7.65
Glendale Ind 51 1,044,787 127,490 127,490 12.2% 6,810 0 0 $9.13
Greenwood Village Ind 0 0 0 0 0.0% 0 0 0 $0.00
Highlands Ranch Ind 22 866,724 112,512 112,512 13.0% 6,773 0 0 $8.41
Inverness Ind 46 1,914,974 301,998 322,230 16.8% 72,242 0 0 $9.25
Lakewood Ind 6 137,486 6,636 6,636 4.8% 0 0 0 $9.00
Longmont Ind 64 2,895,916 354,882 354,882 12.3% (33,334) 0 0 $7.87
Lower Central Ind 12 100,838 26,184 26,184 26.0% 0 0 0 $8.19
Lower North Central Ind 22 570,803 27,480 27,480 4.8% (8,922) 0 0 $27.24
Lower South Central Ind 30 390,243 16,363 16,363 4.2% 0 0 0 $8.53
Meridian Ind 10 112,983 19,304 19,304 17.1% 3,520 0 0 $9.04
Mid Central Ind 18 191,594 4,882 4,882 2.5% 3,018 0 0 $4.81
Mid South Central Ind 15 198,260 6,950 6,950 3.5% 2,350 0 0 $10.50
North Denver Ind 29 1,736,486 284,003 284,003 16.4% (3,934) 0 0 $10.18
Northwest Denver Ind 161 4,119,159 628,447 707,964 17.2% (91,728) 0 0 $9.56
Park County Ind 0 0 0 0 0.0% 0 0 0 $0.00
Parker/Castle Rock Ind 15 213,281 22,854 22,854 10.7% 2,046 0 0 $8.65
Quebec St Ind 13 409,586 231,162 231,162 56.4% 0 0 0 $6.50
Southeast C-470 Ind 56 867,785 51,571 51,571 5.9% (9,504) 0 0 $9.22
Southwest C-470 Ind 136 3,887,267 447,709 447,709 11.5% (100,492) 0 0 $9.24
SW DIA/Pena Blvd Ind 29 730,598 187,444 187,444 25.7% 4,560 0 0 $7.83
Upper Central Ind 11 117,618 3,568 3,568 3.0% 0 0 0 $12.50
Upper North Central Ind 28 468,974 41,191 41,191 8.8% 1,000 0 0 $12.61
Upper South Central Ind 20 161,783 47,259 47,259 29.2% (3,261) 0 0 $7.60
Weld County Ind 86 2,058,569 531,330 531,330 25.8% 25,636 32,332 0 $6.64
West Denver Ind 123 3,232,782 489,418 499,618 15.5% 12,631 0 0 $8.36
Totals 1,649 45,377,383 6,413,113 6,580,859 14.5% (8,572) 32,332 0 $8.97
Source: CoStar Property®
Existing Inventory Vacancy
12 THE COSTAR INDUSTRIAL REPORT ©2011 COSTAR GROUP, INC.
DENVER – FIRST QUARTER 2011
Denver Industrial MarketFIRST QUARTER 2011 – DENVER
Denver Industrial Market
©2011 COSTAR GROUP, INC. THE COSTAR INDUSTRIAL REPORT 13
FIGURES AT A GLANCE
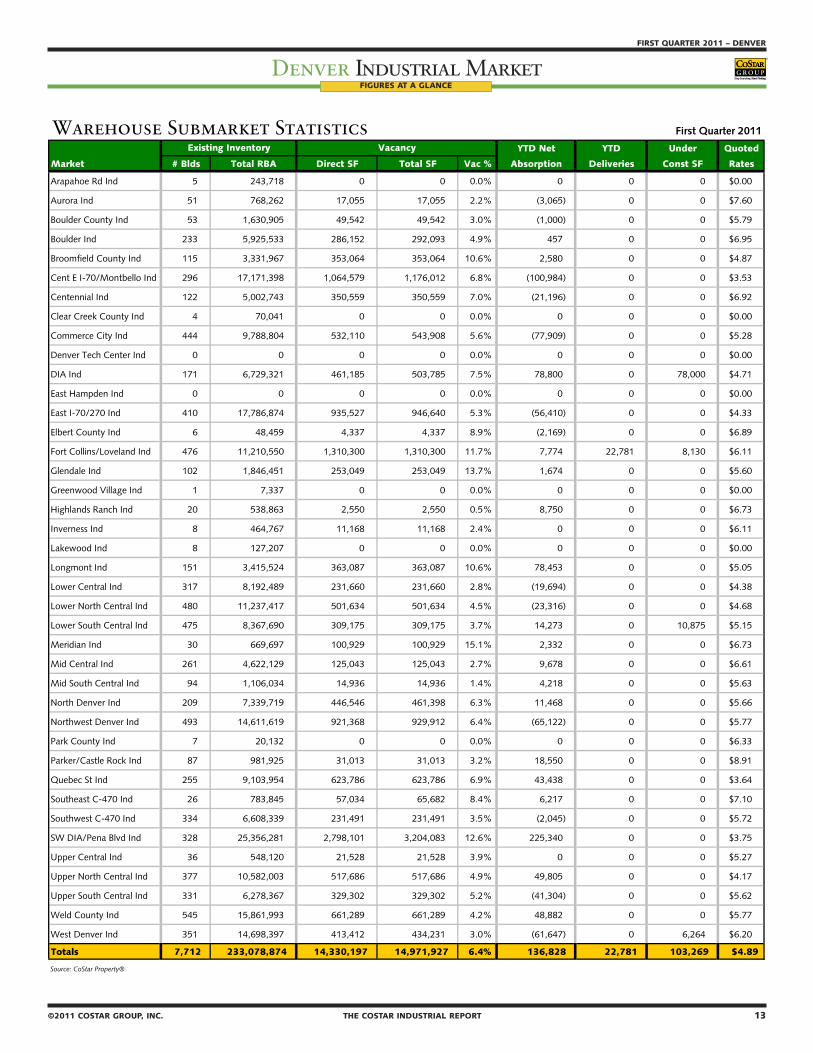
Warehouse Submarket Statistics First Quarter 2011
YTD Net YTD Under Quoted
Market # Blds Total RBA Direct SF Total SF Vac % Absorption Deliveries Const SF Rates
Arapahoe Rd Ind 5 243,718 0 0 0.0% 0 0 0 $0.00
Aurora Ind 51 768,262 17,055 17,055 2.2% (3,065) 0 0 $7.60
Boulder County Ind 53 1,630,905 49,542 49,542 3.0% (1,000) 0 0 $5.79
Boulder Ind 233 5,925,533 286,152 292,093 4.9% 457 0 0 $6.95
Broomfield County Ind 115 3,331,967 353,064 353,064 10.6% 2,580 0 0 $4.87
Cent E I-70/Montbello Ind 296 17,171,398 1,064,579 1,176,012 6.8% (100,984) 0 0 $3.53
Centennial Ind 122 5,002,743 350,559 350,559 7.0% (21,196) 0 0 $6.92
Clear Creek County Ind 4 70,041 0 0 0.0% 0 0 0 $0.00
Commerce City Ind 444 9,788,804 532,110 543,908 5.6% (77,909) 0 0 $5.28
Denver Tech Center Ind 0 0 0 0 0.0% 0 0 0 $0.00
DIA Ind 171 6,729,321 461,185 503,785 7.5% 78,800 0 78,000 $4.71
East Hampden Ind 0 0 0 0 0.0% 0 0 0 $0.00
East I-70/270 Ind 410 17,786,874 935,527 946,640 5.3% (56,410) 0 0 $4.33
Elbert County Ind 6 48,459 4,337 4,337 8.9% (2,169) 0 0 $6.89
Fort Collins/Loveland Ind 476 11,210,550 1,310,300 1,310,300 11.7% 7,774 22,781 8,130 $6.11
Glendale Ind 102 1,846,451 253,049 253,049 13.7% 1,674 0 0 $5.60
Greenwood Village Ind 1 7,337 0 0 0.0% 0 0 0 $0.00
Highlands Ranch Ind 20 538,863 2,550 2,550 0.5% 8,750 0 0 $6.73
Inverness Ind 8 464,767 11,168 11,168 2.4% 0 0 0 $6.11
Lakewood Ind 8 127,207 0 0 0.0% 0 0 0 $0.00
Longmont Ind 151 3,415,524 363,087 363,087 10.6% 78,453 0 0 $5.05
Lower Central Ind 317 8,192,489 231,660 231,660 2.8% (19,694) 0 0 $4.38
Lower North Central Ind 480 11,237,417 501,634 501,634 4.5% (23,316) 0 0 $4.68
Lower South Central Ind 475 8,367,690 309,175 309,175 3.7% 14,273 0 10,875 $5.15
Meridian Ind 30 669,697 100,929 100,929 15.1% 2,332 0 0 $6.73
Mid Central Ind 261 4,622,129 125,043 125,043 2.7% 9,678 0 0 $6.61
Mid South Central Ind 94 1,106,034 14,936 14,936 1.4% 4,218 0 0 $5.63
North Denver Ind 209 7,339,719 446,546 461,398 6.3% 11,468 0 0 $5.66
Northwest Denver Ind 493 14,611,619 921,368 929,912 6.4% (65,122) 0 0 $5.77
Park County Ind 7 20,132 0 0 0.0% 0 0 0 $6.33
Parker/Castle Rock Ind 87 981,925 31,013 31,013 3.2% 18,550 0 0 $8.91
Quebec St Ind 255 9,103,954 623,786 623,786 6.9% 43,438 0 0 $3.64
Southeast C-470 Ind 26 783,845 57,034 65,682 8.4% 6,217 0 0 $7.10
Southwest C-470 Ind 334 6,608,339 231,491 231,491 3.5% (2,045) 0 0 $5.72
SW DIA/Pena Blvd Ind 328 25,356,281 2,798,101 3,204,083 12.6% 225,340 0 0 $3.75
Upper Central Ind 36 548,120 21,528 21,528 3.9% 0 0 0 $5.27
Upper North Central Ind 377 10,582,003 517,686 517,686 4.9% 49,805 0 0 $4.17
Upper South Central Ind 331 6,278,367 329,302 329,302 5.2% (41,304) 0 0 $5.62
Weld County Ind 545 15,861,993 661,289 661,289 4.2% 48,882 0 0 $5.77
West Denver Ind 351 14,698,397 413,412 434,231 3.0% (61,647) 0 6,264 $6.20
Totals 7,712 233,078,874 14,330,197 14,971,927 6.4% 136,828 22,781 103,269 $4.89
Source: CoStar Property®
Existing Inventory Vacancy
14 THE COSTAR INDUSTRIAL REPORT ©2011 COSTAR GROUP, INC.
DENVER – FIRST QUARTER 2011
Denver Industrial MarketFIRST QUARTER 2011 – DENVER
Denver Industrial Market
©2011 COSTAR GROUP, INC. THE COSTAR INDUSTRIAL REPORT 15
FIGURES AT A GLANCE
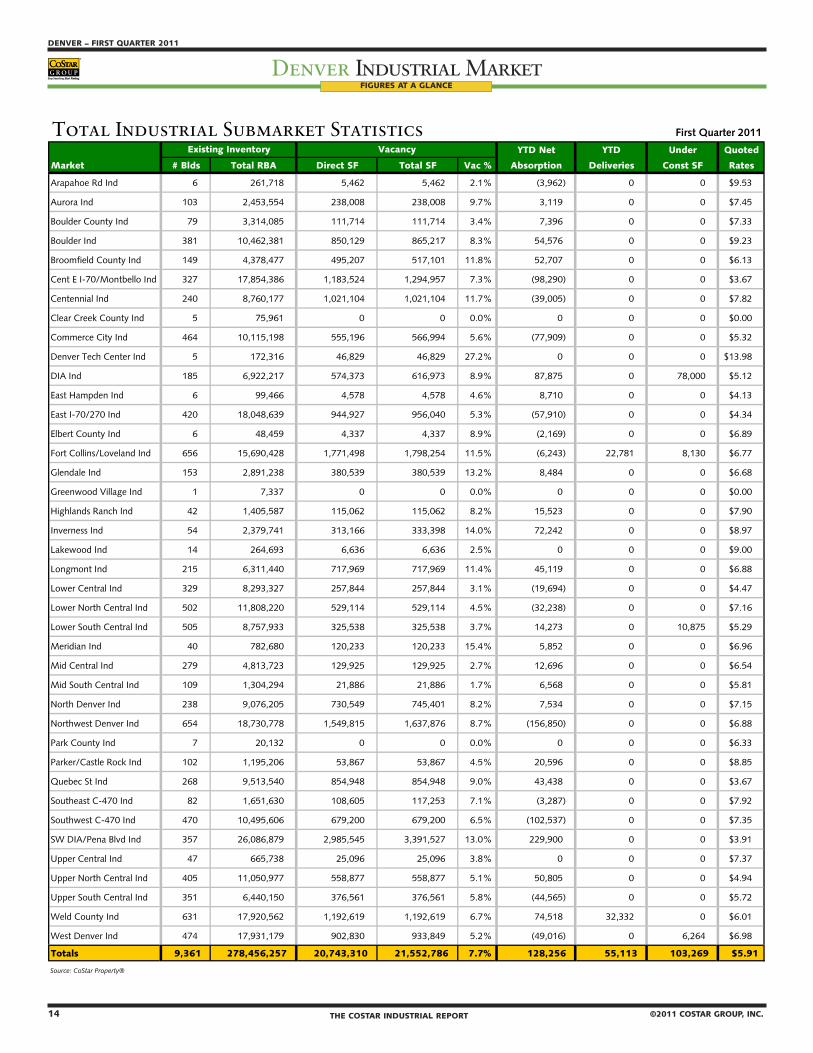
Total Industrial Submarket Statistics First Quarter 2011
YTD Net YTD Under Quoted
Market # Blds Total RBA Direct SF Total SF Vac % Absorption Deliveries Const SF Rates
Arapahoe Rd Ind 6 261,718 5,462 5,462 2.1% (3,962) 0 0 $9.53
Aurora Ind 103 2,453,554 238,008 238,008 9.7% 3,119 0 0 $7.45
Boulder County Ind 79 3,314,085 111,714 111,714 3.4% 7,396 0 0 $7.33
Boulder Ind 381 10,462,381 850,129 865,217 8.3% 54,576 0 0 $9.23
Broomfield County Ind 149 4,378,477 495,207 517,101 11.8% 52,707 0 0 $6.13
Cent E I-70/Montbello Ind 327 17,854,386 1,183,524 1,294,957 7.3% (98,290) 0 0 $3.67
Centennial Ind 240 8,760,177 1,021,104 1,021,104 11.7% (39,005) 0 0 $7.82
Clear Creek County Ind 5 75,961 0 0 0.0% 0 0 0 $0.00
Commerce City Ind 464 10,115,198 555,196 566,994 5.6% (77,909) 0 0 $5.32
Denver Tech Center Ind 5 172,316 46,829 46,829 27.2% 0 0 0 $13.98
DIA Ind 185 6,922,217 574,373 616,973 8.9% 87,875 0 78,000 $5.12
East Hampden Ind 6 99,466 4,578 4,578 4.6% 8,710 0 0 $4.13
East I-70/270 Ind 420 18,048,639 944,927 956,040 5.3% (57,910) 0 0 $4.34
Elbert County Ind 6 48,459 4,337 4,337 8.9% (2,169) 0 0 $6.89
Fort Collins/Loveland Ind 656 15,690,428 1,771,498 1,798,254 11.5% (6,243) 22,781 8,130 $6.77
Glendale Ind 153 2,891,238 380,539 380,539 13.2% 8,484 0 0 $6.68
Greenwood Village Ind 1 7,337 0 0 0.0% 0 0 0 $0.00
Highlands Ranch Ind 42 1,405,587 115,062 115,062 8.2% 15,523 0 0 $7.90
Inverness Ind 54 2,379,741 313,166 333,398 14.0% 72,242 0 0 $8.97
Lakewood Ind 14 264,693 6,636 6,636 2.5% 0 0 0 $9.00
Longmont Ind 215 6,311,440 717,969 717,969 11.4% 45,119 0 0 $6.88
Lower Central Ind 329 8,293,327 257,844 257,844 3.1% (19,694) 0 0 $4.47
Lower North Central Ind 502 11,808,220 529,114 529,114 4.5% (32,238) 0 0 $7.16
Lower South Central Ind 505 8,757,933 325,538 325,538 3.7% 14,273 0 10,875 $5.29
Meridian Ind 40 782,680 120,233 120,233 15.4% 5,852 0 0 $6.96
Mid Central Ind 279 4,813,723 129,925 129,925 2.7% 12,696 0 0 $6.54
Mid South Central Ind 109 1,304,294 21,886 21,886 1.7% 6,568 0 0 $5.81
North Denver Ind 238 9,076,205 730,549 745,401 8.2% 7,534 0 0 $7.15
Northwest Denver Ind 654 18,730,778 1,549,815 1,637,876 8.7% (156,850) 0 0 $6.88
Park County Ind 7 20,132 0 0 0.0% 0 0 0 $6.33
Parker/Castle Rock Ind 102 1,195,206 53,867 53,867 4.5% 20,596 0 0 $8.85
Quebec St Ind 268 9,513,540 854,948 854,948 9.0% 43,438 0 0 $3.67
Southeast C-470 Ind 82 1,651,630 108,605 117,253 7.1% (3,287) 0 0 $7.92
Southwest C-470 Ind 470 10,495,606 679,200 679,200 6.5% (102,537) 0 0 $7.35
SW DIA/Pena Blvd Ind 357 26,086,879 2,985,545 3,391,527 13.0% 229,900 0 0 $3.91
Upper Central Ind 47 665,738 25,096 25,096 3.8% 0 0 0 $7.37
Upper North Central Ind 405 11,050,977 558,877 558,877 5.1% 50,805 0 0 $4.94
Upper South Central Ind 351 6,440,150 376,561 376,561 5.8% (44,565) 0 0 $5.72
Weld County Ind 631 17,920,562 1,192,619 1,192,619 6.7% 74,518 32,332 0 $6.01
West Denver Ind 474 17,931,179 902,830 933,849 5.2% (49,016) 0 6,264 $6.98
Totals 9,361 278,456,257 20,743,310 21,552,786 7.7% 128,256 55,113 103,269 $5.91
Source: CoStar Property®
Existing Inventory Vacancy
14 THE COSTAR INDUSTRIAL REPORT ©2011 COSTAR GROUP, INC.
DENVER – FIRST QUARTER 2011
Denver Industrial MarketFIRST QUARTER 2011 – DENVER
Denver Industrial Market
©2011 COSTAR GROUP, INC. THE COSTAR INDUSTRIAL REPORT 15
FIGURES AT A GLANCE
Flex Market Statistics First Quarter 2011
Net Quoted
Period # Blds Total RBA Direct SF Total SF Vac % Absorption # Blds Total RBA # Blds Total RBA Rates
2011 1q 1,649 45,377,383 6,413,113 6,580,859 14.5% (8,572) 1 32,332 0 0 $8.97 2010 4q 1,649 45,353,919 6,455,690 6,548,823 14.4% 64,622 1 13,300 1 32,332 $9.21 2010 3q 1,649 45,343,684 6,464,125 6,603,210 14.6% 122,696 0 0 2 45,632 $9.22 2010 2q 1,649 45,343,684 6,573,994 6,725,906 14.8% 58,406 0 0 2 45,632 $9.30 2010 1q 1,649 45,343,684 6,568,782 6,784,312 15.0% 51,739 0 0 1 32,332 $9.35 2009 4q 1,649 45,343,684 6,576,967 6,836,051 15.1% (47,485) 1 28,947 0 0 $9.36 2009 3q 1,648 45,314,737 6,486,535 6,759,619 14.9% (121,394) 3 153,836 1 28,947 $9.35 2009 2q 1,645 45,160,901 6,246,908 6,484,389 14.4% 39,077 3 62,722 3 153,836 $9.43 2009 1q 1,642 45,098,179 6,218,585 6,460,744 14.3% (152,717) 4 99,978 6 216,558 $9.70
2008 1,638 44,998,201 5,933,667 6,208,049 13.8% 523,801 36 1,234,133 10 316,536 $9.92 2007 1,605 44,048,267 5,544,544 5,781,916 13.1% 1,157,820 29 535,008 20 575,794 $9.38 2006 1,576 43,513,259 6,199,236 6,404,728 14.7% 493,138 24 538,880 19 346,233 $8.90 2005 1,552 42,974,379 6,135,338 6,358,986 14.8% 1,674,296 36 628,359 17 338,367 $8.71 2004 1,516 42,346,020 6,905,576 7,404,923 17.5% 790,396 16 321,848 26 417,069 $8.54 2003 1,500 42,024,172 7,318,171 7,873,471 18.7% (969,380) 23 478,500 5 105,382 $8.52 2002 1,477 41,545,672 5,824,894 6,425,591 15.5% 218,139 39 1,281,475 15 358,164 $8.98
Source: CoStar Property®
Warehouse Market Statistics First Quarter 2011
Net Quoted
Period # Blds Total RBA Direct SF Total SF Vac % Absorption # Blds Total RBA # Blds Total RBA Rates
2011 1q 7,712 233,078,874 14,330,197 14,971,927 6.4% 136,828 1 22,781 4 103,269 $4.89 2010 4q 7,712 233,061,093 14,344,733 15,090,974 6.5% 238,291 0 0 4 115,175 $4.84 2010 3q 7,712 233,061,093 14,525,350 15,329,265 6.6% 194,583 1 6,719 2 100,781 $4.89 2010 2q 7,711 233,054,374 14,627,335 15,517,129 6.7% 1,738,621 2 764,176 2 29,500 $4.94 2010 1q 7,709 232,290,198 15,620,041 16,491,574 7.1% 506,576 3 56,989 3 770,895 $4.92 2009 4q 7,706 232,233,209 16,165,126 16,941,161 7.3% 121,807 1 5,760 5 821,165 $5.00 2009 3q 7,705 232,227,449 16,308,058 17,057,208 7.3% 551,073 1 4,800 6 826,925 $5.06 2009 2q 7,704 232,222,649 16,881,868 17,603,481 7.6% (575,075) 1 56,350 6 811,725 $5.19 2009 1q 7,703 232,166,299 16,299,069 16,972,056 7.3% (631,265) 4 152,064 6 862,315 $5.32
2008 7,700 232,026,735 15,559,847 16,201,227 7.0% 631,335 56 2,903,245 6 189,053 $5.32 2007 7,649 229,154,135 13,402,059 13,959,962 6.1% 4,816,638 55 2,866,239 37 1,814,472 $5.20 2006 7,598 226,551,633 15,283,786 16,174,098 7.1% 4,306,010 71 2,909,536 38 2,536,812 $5.10 2005 7,529 223,672,850 16,906,390 17,601,325 7.9% 2,723,097 90 2,144,581 44 1,830,176 $4.84 2004 7,443 221,738,459 17,109,135 18,390,031 8.3% 2,810,748 58 2,970,514 61 1,754,951 $4.74 2003 7,389 219,014,205 16,744,500 18,476,525 8.4% 750,213 83 2,833,581 43 2,453,686 $4.81 2002 7,309 216,625,289 14,970,980 16,837,822 7.8% 494,092 104 4,372,104 61 1,872,202 $5.45
Source: CoStar Property®
Total Industrial Market Statistics First Quarter 2011
Net Quoted
Period # Blds Total RBA Direct SF Total SF Vac % Absorption # Blds Total RBA # Blds Total RBA Rates
2011 1q 9,361 278,456,257 20,743,310 21,552,786 7.7% 128,256 2 55,113 4 103,269 $5.91 2010 4q 9,361 278,415,012 20,800,423 21,639,797 7.8% 302,913 1 13,300 5 147,507 $5.94 2010 3q 9,361 278,404,777 20,989,475 21,932,475 7.9% 317,279 1 6,719 4 146,413 $5.97 2010 2q 9,360 278,398,058 21,201,329 22,243,035 8.0% 1,797,027 2 764,176 4 75,132 $6.01 2010 1q 9,358 277,633,882 22,188,823 23,275,886 8.4% 558,315 3 56,989 4 803,227 $6.00 2009 4q 9,355 277,576,893 22,742,093 23,777,212 8.6% 74,322 2 34,707 5 821,165 $6.09 2009 3q 9,353 277,542,186 22,794,593 23,816,827 8.6% 429,679 4 158,636 7 855,872 $6.07 2009 2q 9,349 277,383,550 23,128,776 24,087,870 8.7% (535,998) 4 119,072 9 965,561 $6.21 2009 1q 9,345 277,264,478 22,517,654 23,432,800 8.5% (783,982) 8 252,042 12 1,078,873 $6.36
2008 9,338 277,024,936 21,493,514 22,409,276 8.1% 1,155,136 92 4,137,378 16 505,589 $6.39 2007 9,254 273,202,402 18,946,603 19,741,878 7.2% 5,974,458 84 3,401,247 57 2,390,266 $6.10 2006 9,174 270,064,892 21,483,022 22,578,826 8.4% 4,799,148 95 3,448,416 57 2,883,045 $5.98 2005 9,081 266,647,229 23,041,728 23,960,311 9.0% 4,397,393 126 2,772,940 61 2,168,543 $5.85 2004 8,959 264,084,479 24,014,711 25,794,954 9.8% 3,601,144 74 3,292,362 87 2,172,020 $5.86 2003 8,889 261,038,377 24,062,671 26,349,996 10.1% (219,167) 106 3,312,081 48 2,559,068 $5.90 2002 8,786 258,170,961 20,795,874 23,263,413 9.0% 712,231 143 5,653,579 76 2,230,366 $5.92
Source: CoStar Property®
UC Inventory
Existing Inventory Vacancy Deliveries UC Inventory
Existing Inventory Vacancy Deliveries UC Inventory
Existing Inventory Vacancy Deliveries
16 THE COSTAR INDUSTRIAL REPORT ©2011 COSTAR GROUP, INC.
DENVER – FIRST QUARTER 2011
Denver Industrial MarketFIRST QUARTER 2011 – DENVER
Denver Industrial Market
©2011 COSTAR GROUP, INC. THE COSTAR INDUSTRIAL REPORT 17
LEASING ACTIVITY
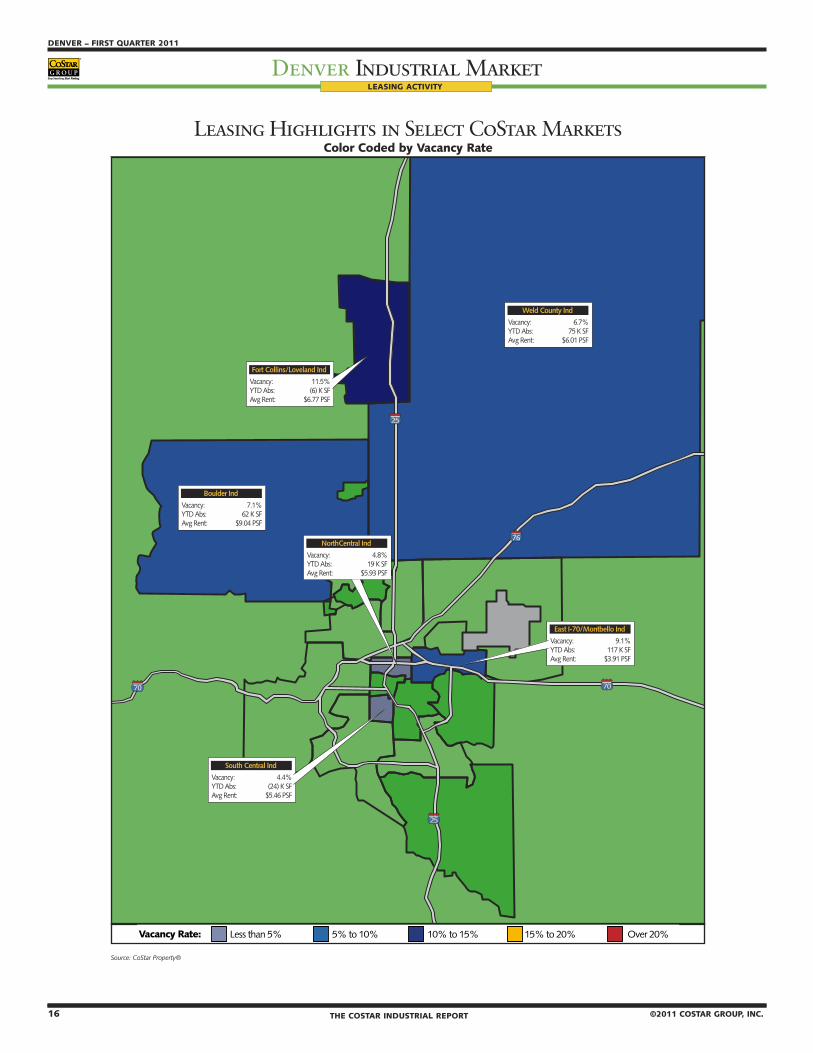
Leasing Highlights in Select CoStar MarketsColor Coded by Vacancy Rate
��
��
��
��
��
�������� ����������� �� � ����� ����� ����� ���
���������� ���
�������� ����������� �� � ����� ����� ����� ���
������� ���
�������� ����������� ��� � ����� ����� ����� ���
���� �������������� ���
�������� ����������� ���� � ����� ����� ����� ���
����� ������� ���
�������� ����������� �� � ����� ����� ����� ���
������������ ���
�������� ������������ ��� � ����� ����� ����� ���
���� ���������������� ���
������� ����� ���� ������ �� ������ �� ����� �� ������� ���� ��
Source: CoStar Property®

16 THE COSTAR INDUSTRIAL REPORT ©2011 COSTAR GROUP, INC.
DENVER – FIRST QUARTER 2011
Denver Industrial MarketFIRST QUARTER 2011 – DENVER
Denver Industrial Market
©2011 COSTAR GROUP, INC. THE COSTAR INDUSTRIAL REPORT 17
Historical Rental RatesBased on Quoted Rental Rates
Source: CoStar Property®
Vacancy by Available Space Type Vacancy by Building TypePercent of All Vacant Space in Direct vs. Sublet Percent of All Vacant Space by Building Type
Source: CoStar Property® Source: CoStar Property®
U.S. Rental Rate Comparison Future Space AvailableBased on Average Quoted Rental Rates Space Scheduled to be Available for Occupancy*
Source: CoStar Property® Source: CoStar Property® * Includes Under Construction Space
Denver United States Denver United States
$0.00
$1.00
$2.00
$3.00
$4.00
$5.00
$6.00
$7.00
$8.00
$9.00
$10.00
2009 3q 2009 4q 2010 1q 2010 2q 2010 3q 2010 4q 2011 1q
Dollar
s/SF/Y
ear
Flex Warehouse Total Market
$4.60
$4.80
$5.00
$5.20
$5.40
$5.60
$5.80
$6.00
$6.20
2009 3q 2009 4q 2010 1q 2010 2q 2010 3q 2010 4q 2011 1q
Dollar
s/SF/Y
ear
Denver United States
96%
4%
Direct Sublet
3%
97%
Direct Sublet
31%69%
Flex Warehouse
0.8
0.7
0.0
0.1
0.0 0.00.0
0.1
0.2
0.3
0.4
0.5
0.6
0.7
0.8
0.9
2011 2q 2011 3q 2011 4q 2012 1q 2012 2q 2012 3q
Mill
ions
86%
14%
Flex Warehouse
LEASING ACTIVITY
18 THE COSTAR INDUSTRIAL REPORT ©2011 COSTAR GROUP, INC.
DENVER – FIRST QUARTER 2011
Denver Industrial MarketFIRST QUARTER 2011 – DENVER
Denver Industrial Market
©2011 COSTAR GROUP, INC. THE COSTAR INDUSTRIAL REPORT 19
LEASING ACTIVITY
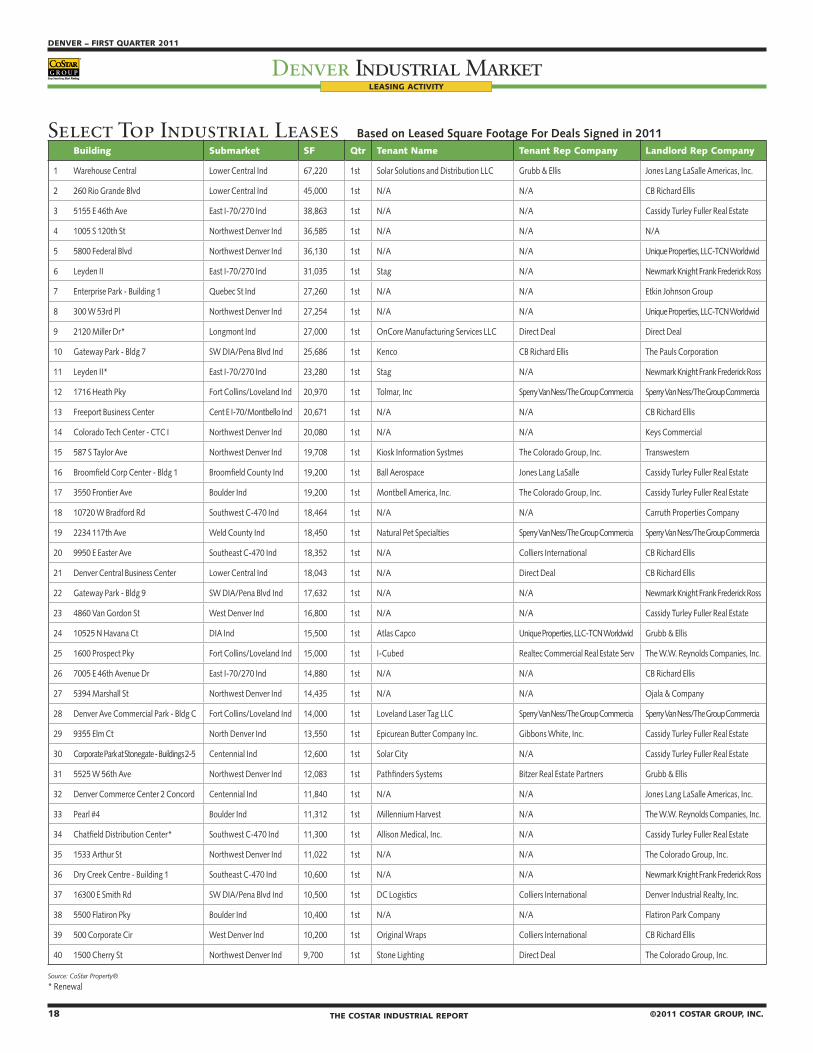
Source: CoStar Property®
* Renewal
Building Submarket SF Qtr Tenant Name Tenant Rep Company Landlord Rep Company
1 Warehouse Central Lower Central Ind 67,220 1st Solar Solutions and Distribution LLC Grubb & Ellis Jones Lang LaSalle Americas, Inc.
2 260 Rio Grande Blvd Lower Central Ind 45,000 1st N/A N/A CB Richard Ellis
3 5155 E 46th Ave East I-70/270 Ind 38,863 1st N/A N/A Cassidy Turley Fuller Real Estate
4 1005 S 120th St Northwest Denver Ind 36,585 1st N/A N/A N/A
5 5800 Federal Blvd Northwest Denver Ind 36,130 1st N/A N/A Unique Properties, LLC-TCN Worldwid
6 Leyden II East I-70/270 Ind 31,035 1st Stag N/A Newmark Knight Frank Frederick Ross
7 Enterprise Park - Building 1 Quebec St Ind 27,260 1st N/A N/A Etkin Johnson Group
8 300 W 53rd Pl Northwest Denver Ind 27,254 1st N/A N/A Unique Properties, LLC-TCN Worldwid
9 2120 Miller Dr* Longmont Ind 27,000 1st OnCore Manufacturing Services LLC Direct Deal Direct Deal
10 Gateway Park - Bldg 7 SW DIA/Pena Blvd Ind 25,686 1st Kenco CB Richard Ellis The Pauls Corporation
11 Leyden II* East I-70/270 Ind 23,280 1st Stag N/A Newmark Knight Frank Frederick Ross
12 1716 Heath Pky Fort Collins/Loveland Ind 20,970 1st Tolmar, Inc Sperry Van Ness/The Group Commercia Sperry Van Ness/The Group Commercia
13 Freeport Business Center Cent E I-70/Montbello Ind 20,671 1st N/A N/A CB Richard Ellis
14 Colorado Tech Center - CTC I Northwest Denver Ind 20,080 1st N/A N/A Keys Commercial
15 587 S Taylor Ave Northwest Denver Ind 19,708 1st Kiosk Information Systmes The Colorado Group, Inc. Transwestern
16 Broomfield Corp Center - Bldg 1 Broomfield County Ind 19,200 1st Ball Aerospace Jones Lang LaSalle Cassidy Turley Fuller Real Estate
17 3550 Frontier Ave Boulder Ind 19,200 1st Montbell America, Inc. The Colorado Group, Inc. Cassidy Turley Fuller Real Estate
18 10720 W Bradford Rd Southwest C-470 Ind 18,464 1st N/A N/A Carruth Properties Company
19 2234 117th Ave Weld County Ind 18,450 1st Natural Pet Specialties Sperry Van Ness/The Group Commercia Sperry Van Ness/The Group Commercia
20 9950 E Easter Ave Southeast C-470 Ind 18,352 1st N/A Colliers International CB Richard Ellis
21 Denver Central Business Center Lower Central Ind 18,043 1st N/A Direct Deal CB Richard Ellis
22 Gateway Park - Bldg 9 SW DIA/Pena Blvd Ind 17,632 1st N/A N/A Newmark Knight Frank Frederick Ross
23 4860 Van Gordon St West Denver Ind 16,800 1st N/A N/A Cassidy Turley Fuller Real Estate
24 10525 N Havana Ct DIA Ind 15,500 1st Atlas Capco Unique Properties, LLC-TCN Worldwid Grubb & Ellis
25 1600 Prospect Pky Fort Collins/Loveland Ind 15,000 1st I-Cubed Realtec Commercial Real Estate Serv The W.W. Reynolds Companies, Inc.
26 7005 E 46th Avenue Dr East I-70/270 Ind 14,880 1st N/A N/A CB Richard Ellis
27 5394 Marshall St Northwest Denver Ind 14,435 1st N/A N/A Ojala & Company
28 Denver Ave Commercial Park - Bldg C Fort Collins/Loveland Ind 14,000 1st Loveland Laser Tag LLC Sperry Van Ness/The Group Commercia Sperry Van Ness/The Group Commercia
29 9355 Elm Ct North Denver Ind 13,550 1st Epicurean Butter Company Inc. Gibbons White, Inc. Cassidy Turley Fuller Real Estate
30 Corporate Park at Stonegate - Buildings 2-5 Centennial Ind 12,600 1st Solar City N/A Cassidy Turley Fuller Real Estate
31 5525 W 56th Ave Northwest Denver Ind 12,083 1st Pathfinders Systems Bitzer Real Estate Partners Grubb & Ellis
32 Denver Commerce Center 2 Concord Centennial Ind 11,840 1st N/A N/A Jones Lang LaSalle Americas, Inc.
33 Pearl #4 Boulder Ind 11,312 1st Millennium Harvest N/A The W.W. Reynolds Companies, Inc.
34 Chatfield Distribution Center* Southwest C-470 Ind 11,300 1st Allison Medical, Inc. N/A Cassidy Turley Fuller Real Estate
35 1533 Arthur St Northwest Denver Ind 11,022 1st N/A N/A The Colorado Group, Inc.
36 Dry Creek Centre - Building 1 Southeast C-470 Ind 10,600 1st N/A N/A Newmark Knight Frank Frederick Ross
37 16300 E Smith Rd SW DIA/Pena Blvd Ind 10,500 1st DC Logistics Colliers International Denver Industrial Realty, Inc.
38 5500 Flatiron Pky Boulder Ind 10,400 1st N/A N/A Flatiron Park Company
39 500 Corporate Cir West Denver Ind 10,200 1st Original Wraps Colliers International CB Richard Ellis
40 1500 Cherry St Northwest Denver Ind 9,700 1st Stone Lighting Direct Deal The Colorado Group, Inc.
Select Top Industrial Leases Based on Leased Square Footage For Deals Signed in 2011
18 THE COSTAR INDUSTRIAL REPORT ©2011 COSTAR GROUP, INC.
DENVER – FIRST QUARTER 2011
Denver Industrial MarketFIRST QUARTER 2011 – DENVER
Denver Industrial Market
©2011 COSTAR GROUP, INC. THE COSTAR INDUSTRIAL REPORT 19
SALES ACTIVITY
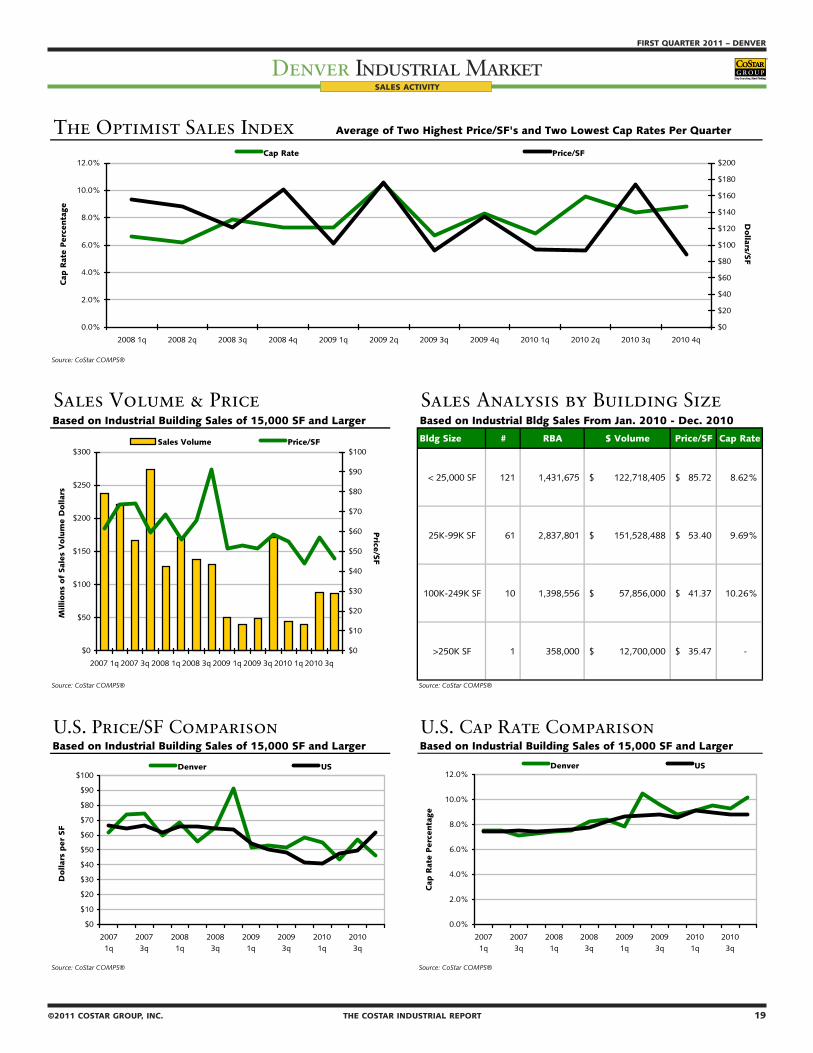
The Optimist Sales Index Average of Two Highest Price/SF's and Two Lowest Cap Rates Per Quarter
Source: CoStar COMPS®
Sales Volume & Price Sales Analysis by Building SizeBased on Industrial Building Sales of 15,000 SF and Larger Based on Industrial Bldg Sales From Jan. 2010 - Dec. 2010
Bldg Size # RBA $ Volume Price/SF Cap Rate
< 25,000 SF 121 1,431,675 122,718,405$ 85.72$ 8.62%
25K-99K SF 61 2,837,801 151,528,488$ 53.40$ 9.69%
100K-249K SF 10 1,398,556 57,856,000$ 41.37$ 10.26%
>250K SF 1 358,000 12,700,000$ 35.47$ -
Source: CoStar COMPS® Source: CoStar COMPS®
U.S. Price/SF Comparison U.S. Cap Rate ComparisonBased on Industrial Building Sales of 15,000 SF and Larger Based on Industrial Building Sales of 15,000 SF and Larger
Source: CoStar COMPS® Source: CoStar COMPS®
$0
$10
$20
$30
$40
$50
$60
$70
$80
$90
$100
20071q
20073q
20081q
20083q
20091q
20093q
20101q
20103q
Dollar
s per
SF
Denver US
$0
$50
$100
$150
$200
$250
$300
2007 1q 2007 3q 2008 1q 2008 3q 2009 1q 2009 3q 2010 1q 2010 3q
Millio
ns
of
Sal
es V
olu
me
Do
llar
s
$0
$10
$20
$30
$40
$50
$60
$70
$80
$90
$100
Price
/SF
Sales Volume Price/SF
0.0%
2.0%
4.0%
6.0%
8.0%
10.0%
12.0%
2008 1q 2008 2q 2008 3q 2008 4q 2009 1q 2009 2q 2009 3q 2009 4q 2010 1q 2010 2q 2010 3q 2010 4q
Cap
Rat
e P
erc
enta
ge
$0
$20
$40
$60
$80
$100
$120
$140
$160
$180
$200
Dollars/S
F
Cap Rate Price/SF
0.0%
2.0%
4.0%
6.0%
8.0%
10.0%
12.0%
20071q
20073q
20081q
20083q
20091q
20093q
20101q
20103q
Cap
Rat
e P
erc
enta
ge
Denver US
20 THE COSTAR INDUSTRIAL REPORT ©2011 COSTAR GROUP, INC.
DENVER – FIRST QUARTER 2011
Denver Industrial MarketFIRST QUARTER 2011 – DENVER
Denver Industrial Market
©2011 COSTAR GROUP, INC. THE COSTAR INDUSTRIAL REPORT 21
SALES ACTIVITY
���������������� ���������������������������������������������������
���������������������
���������������������������������������������������������
���������������������������������������������������������������������������������������������������������
�������������
���������
���������������������������������������������������������
�����������������������������������������������������������������������
��������������������
������
���������������������������������������������������������
�����������������������������������������������������������������������������������������
�����������������������
��������
���������������������������������������������������������
��������������������������������������������������������������������������
������������������������������
������
���������������������������������������������������������
�����������������������������������������������������������������������������������
����������������������������������
������
���������������������������������������������������������
�����������������������������������������������������������������
������������������������������������
���������
���������������������������������������������������������
������������������������������������������������������������������������������������������
�����������������������������
����������
���������������������������������������������������������
����������������������������������������������������������������������������������������������������������
�����������������������
���������
���������������������������������������������������������
�����������������������������������������������������������������������������������������������
�������������������
������
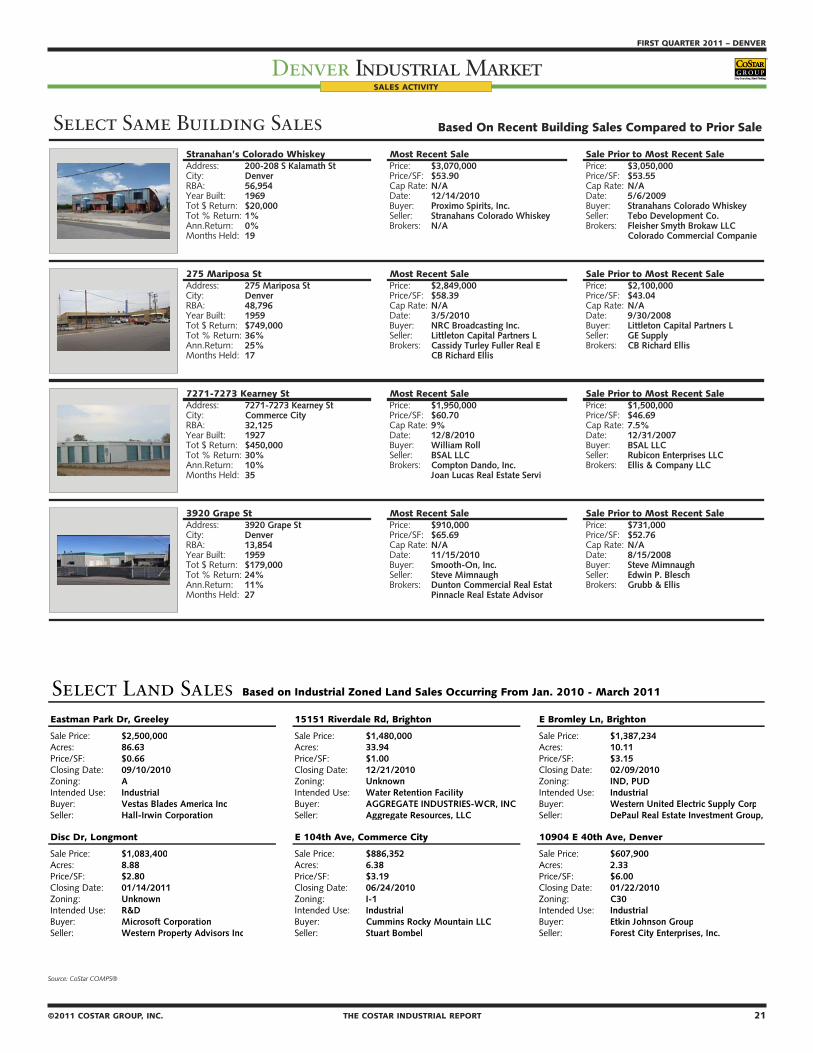
20 THE COSTAR INDUSTRIAL REPORT ©2011 COSTAR GROUP, INC.
DENVER – FIRST QUARTER 2011
Denver Industrial MarketFIRST QUARTER 2011 – DENVER
Denver Industrial Market
©2011 COSTAR GROUP, INC. THE COSTAR INDUSTRIAL REPORT 21
�������������������������� �����������������������������������������������������
�����������������������������������������������������������������������������
��������������������������������������������������
������������������������������������������������������������������������������
��������������������������������������������������������������������������������
������������������������������������������������������������������
�������������������������������������������������������������������������������������������������������������������������������
������������������������������
�����������������������������������������������������������������������������
�����������������������������������������������
�����������������������������������������������������������������
������������������������������������������������������������������������������������������������������������������������
������������������������������������������������������������������
���������������������������������������������������������������������������������
������������������������������
�����������������������������������������������������������������������������
�����������������������������������������������������������
����������������������������������������������������������������������
����������������������������������������������������������������������������������������������
������������������������������������������������������������������
��������������������������������������������������������������������������������
������������������������������
�����������������������������������������������������������������������������
���������������������������������������������
���������������������������������������������������������������
����������������������������������������������������������������������������������������������������������������
������������������������������������������������������������������
��������������������������������������������������������������������
������������������������������
���������������������
SALES ACTIVITY
Select Land Sales Based on Industrial Zoned Land Sales Occurring From Jan. 2010 - March 2011
Eastman Park Dr, Greeley 15151 Riverdale Rd, Brighton E Bromley Ln, Brighton
Sale Price: $2,500,000 Sale Price: $1,480,000 Sale Price: $1,387,234Acres: 86.63 Acres: 33.94 Acres: 10.11Price/SF: $0.66 Price/SF: $1.00 Price/SF: $3.15Closing Date: 09/10/2010 Closing Date: 12/21/2010 Closing Date: 02/09/2010Zoning: A Zoning: Unknown Zoning: IND, PUDIntended Use: Industrial Intended Use: Water Retention Facility Intended Use: IndustrialBuyer: Vestas Blades America Inc Buyer: AGGREGATE INDUSTRIES-WCR, INC Buyer: Western United Electric Supply CorpSeller: Hall-Irwin Corporation Seller: Aggregate Resources, LLC Seller: DePaul Real Estate Investment Group,
Disc Dr, Longmont E 104th Ave, Commerce City 10904 E 40th Ave, Denver
Sale Price: $1,083,400 Sale Price: $886,352 Sale Price: $607,900Acres: 8.88 Acres: 6.38 Acres: 2.33Price/SF: $2.80 Price/SF: $3.19 Price/SF: $6.00Closing Date: 01/14/2011 Closing Date: 06/24/2010 Closing Date: 01/22/2010Zoning: Unknown Zoning: I-1 Zoning: C30Intended Use: R&D Intended Use: Industrial Intended Use: IndustrialBuyer: Microsoft Corporation Buyer: Cummins Rocky Mountain LLC Buyer: Etkin Johnson GroupSeller: Western Property Advisors Inc Seller: Stuart Bombel Seller: Forest City Enterprises, Inc.
Source: CoStar COMPS®
Source: CoStar COMPS®
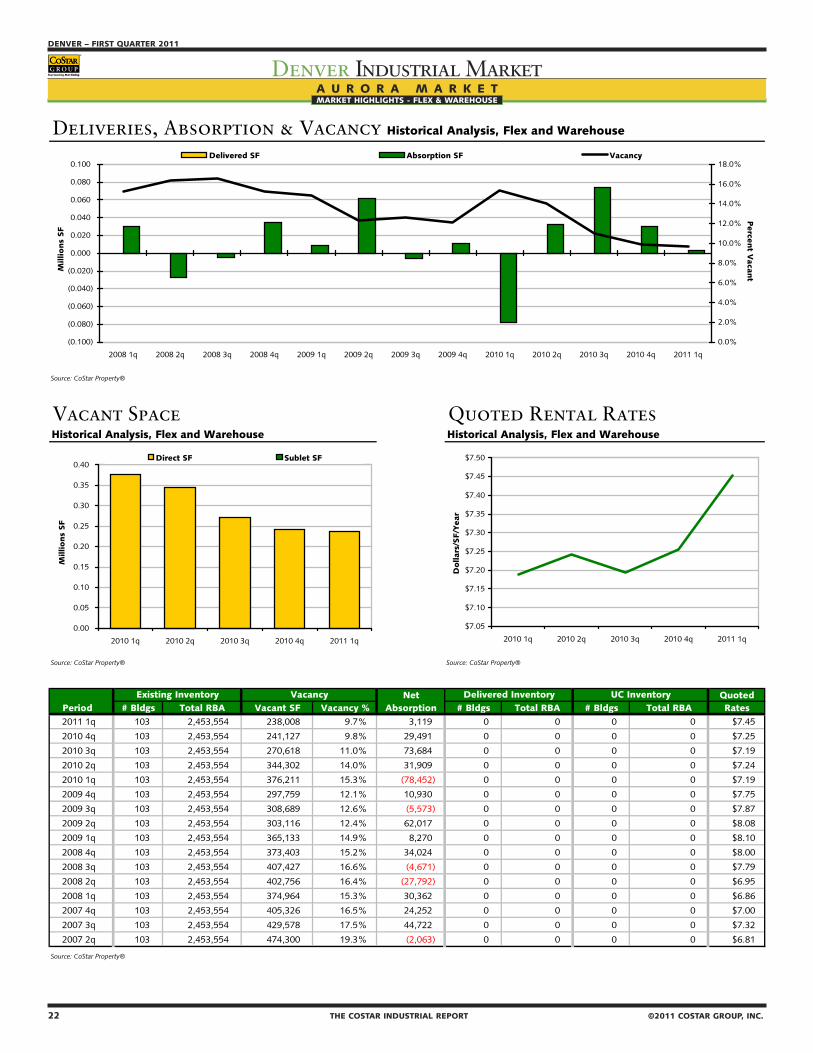
22 THE COSTAR INDUSTRIAL REPORT ©2011 COSTAR GROUP, INC.
DENVER – FIRST QUARTER 2011
Denver Industrial MarketMARKET HIGHLIGHTS - FLEX & WAREHOUSE
©2011 COSTAR GROUP, INC. THE COSTAR INDUSTRIAL REPORT 23
FIRST QUARTER 2011 – DENVER
Denver Industrial MarketMARKET HIGHLIGHTS - FLEX & WAREHOUSE
A U R O R A M A R K E T
Deliveries, Absorption & Vacancy Historical Analysis, Flex and Warehouse
Source: CoStar Property®
Vacant Space Quoted Rental RatesHistorical Analysis, Flex and Warehouse Historical Analysis, Flex and Warehouse
Source: CoStar Property® Source: CoStar Property®
Net QuotedPeriod # Bldgs Total RBA Vacant SF Vacancy % Absorption # Bldgs Total RBA # Bldgs Total RBA Rates2011 1q 103 2,453,554 238,008 9.7% 3,119 0 0 0 0 $7.45
2010 4q 103 2,453,554 241,127 9.8% 29,491 0 0 0 0 $7.25
2010 3q 103 2,453,554 270,618 11.0% 73,684 0 0 0 0 $7.19
2010 2q 103 2,453,554 344,302 14.0% 31,909 0 0 0 0 $7.24
2010 1q 103 2,453,554 376,211 15.3% (78,452) 0 0 0 0 $7.19
2009 4q 103 2,453,554 297,759 12.1% 10,930 0 0 0 0 $7.75
2009 3q 103 2,453,554 308,689 12.6% (5,573) 0 0 0 0 $7.87
2009 2q 103 2,453,554 303,116 12.4% 62,017 0 0 0 0 $8.08
2009 1q 103 2,453,554 365,133 14.9% 8,270 0 0 0 0 $8.10
2008 4q 103 2,453,554 373,403 15.2% 34,024 0 0 0 0 $8.00
2008 3q 103 2,453,554 407,427 16.6% (4,671) 0 0 0 0 $7.79
2008 2q 103 2,453,554 402,756 16.4% (27,792) 0 0 0 0 $6.95
2008 1q 103 2,453,554 374,964 15.3% 30,362 0 0 0 0 $6.86
2007 4q 103 2,453,554 405,326 16.5% 24,252 0 0 0 0 $7.00
2007 3q 103 2,453,554 429,578 17.5% 44,722 0 0 0 0 $7.32
2007 2q 103 2,453,554 474,300 19.3% (2,063) 0 0 0 0 $6.81
Source: CoStar Property®
UC InventoryDelivered InventoryExisting Inventory Vacancy
(0.100)
(0.080)
(0.060)
(0.040)
(0.020)
0.000
0.020
0.040
0.060
0.080
0.100
2008 1q 2008 2q 2008 3q 2008 4q 2009 1q 2009 2q 2009 3q 2009 4q 2010 1q 2010 2q 2010 3q 2010 4q 2011 1q
Millio
ns
SF
0.0%
2.0%
4.0%
6.0%
8.0%
10.0%
12.0%
14.0%
16.0%
18.0%
Perce
nt V
acant
Delivered SF Absorption SF Vacancy
$7.05
$7.10
$7.15
$7.20
$7.25
$7.30
$7.35
$7.40
$7.45
$7.50
2010 1q 2010 2q 2010 3q 2010 4q 2011 1q
Dollar
s/SF/Y
ear
0.00
0.05
0.10
0.15
0.20
0.25
0.30
0.35
0.40
2010 1q 2010 2q 2010 3q 2010 4q 2011 1q
Millio
ns
SF
Direct SF Sublet SF
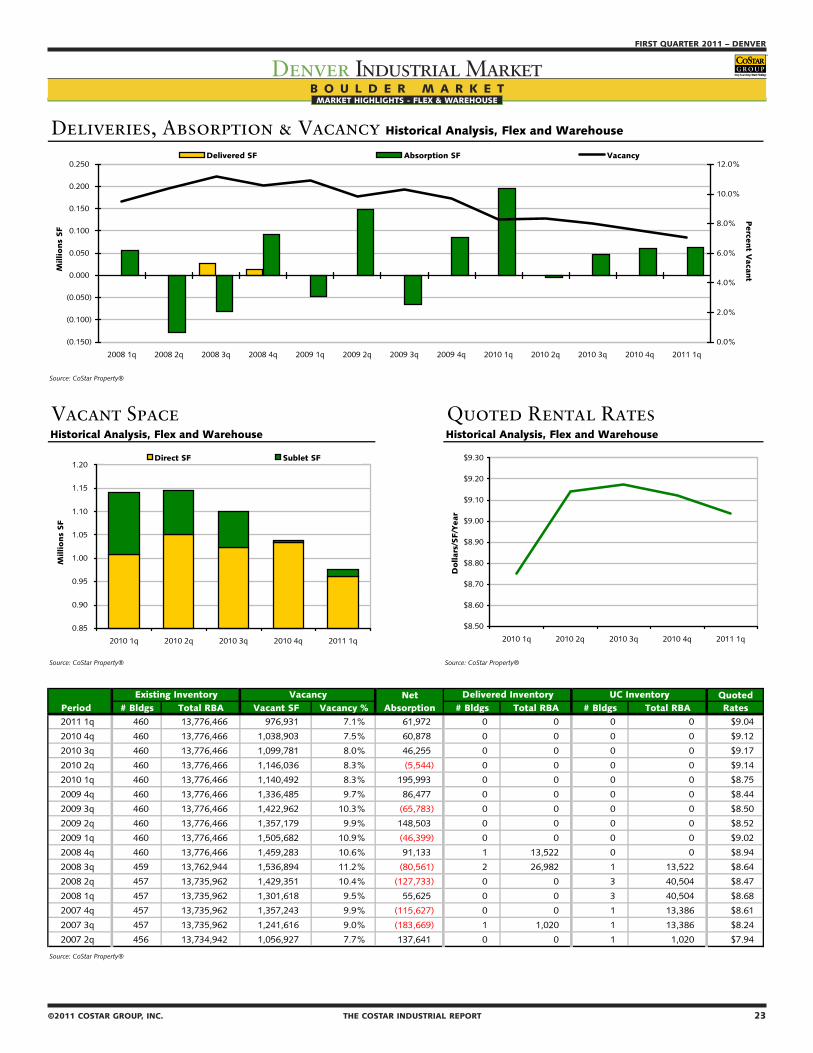
22 THE COSTAR INDUSTRIAL REPORT ©2011 COSTAR GROUP, INC.
DENVER – FIRST QUARTER 2011
Denver Industrial MarketMARKET HIGHLIGHTS - FLEX & WAREHOUSE
©2011 COSTAR GROUP, INC. THE COSTAR INDUSTRIAL REPORT 23
FIRST QUARTER 2011 – DENVER
Denver Industrial MarketMARKET HIGHLIGHTS - FLEX & WAREHOUSE
B O U L D E R M A R K E T
Deliveries, Absorption & Vacancy Historical Analysis, Flex and Warehouse
Source: CoStar Property®
Vacant Space Quoted Rental RatesHistorical Analysis, Flex and Warehouse Historical Analysis, Flex and Warehouse
Source: CoStar Property® Source: CoStar Property®
Net QuotedPeriod # Bldgs Total RBA Vacant SF Vacancy % Absorption # Bldgs Total RBA # Bldgs Total RBA Rates2011 1q 460 13,776,466 976,931 7.1% 61,972 0 0 0 0 $9.04
2010 4q 460 13,776,466 1,038,903 7.5% 60,878 0 0 0 0 $9.12
2010 3q 460 13,776,466 1,099,781 8.0% 46,255 0 0 0 0 $9.17
2010 2q 460 13,776,466 1,146,036 8.3% (5,544) 0 0 0 0 $9.14
2010 1q 460 13,776,466 1,140,492 8.3% 195,993 0 0 0 0 $8.75
2009 4q 460 13,776,466 1,336,485 9.7% 86,477 0 0 0 0 $8.44
2009 3q 460 13,776,466 1,422,962 10.3% (65,783) 0 0 0 0 $8.50
2009 2q 460 13,776,466 1,357,179 9.9% 148,503 0 0 0 0 $8.52
2009 1q 460 13,776,466 1,505,682 10.9% (46,399) 0 0 0 0 $9.02
2008 4q 460 13,776,466 1,459,283 10.6% 91,133 1 13,522 0 0 $8.94
2008 3q 459 13,762,944 1,536,894 11.2% (80,561) 2 26,982 1 13,522 $8.64
2008 2q 457 13,735,962 1,429,351 10.4% (127,733) 0 0 3 40,504 $8.47
2008 1q 457 13,735,962 1,301,618 9.5% 55,625 0 0 3 40,504 $8.68
2007 4q 457 13,735,962 1,357,243 9.9% (115,627) 0 0 1 13,386 $8.61
2007 3q 457 13,735,962 1,241,616 9.0% (183,669) 1 1,020 1 13,386 $8.24
2007 2q 456 13,734,942 1,056,927 7.7% 137,641 0 0 1 1,020 $7.94
Source: CoStar Property®
UC InventoryDelivered InventoryExisting Inventory Vacancy
(0.150)
(0.100)
(0.050)
0.000
0.050
0.100
0.150
0.200
0.250
2008 1q 2008 2q 2008 3q 2008 4q 2009 1q 2009 2q 2009 3q 2009 4q 2010 1q 2010 2q 2010 3q 2010 4q 2011 1q
Millio
ns
SF
0.0%
2.0%
4.0%
6.0%
8.0%
10.0%
12.0%
Perce
nt V
acant
Delivered SF Absorption SF Vacancy
$8.50
$8.60
$8.70
$8.80
$8.90
$9.00
$9.10
$9.20
$9.30
2010 1q 2010 2q 2010 3q 2010 4q 2011 1q
Dollar
s/SF/Y
ear
0.85
0.90
0.95
1.00
1.05
1.10
1.15
1.20
2010 1q 2010 2q 2010 3q 2010 4q 2011 1q
Millio
ns
SF
Direct SF Sublet SF

24 THE COSTAR INDUSTRIAL REPORT ©2011 COSTAR GROUP, INC.
DENVER – FIRST QUARTER 2011
Denver Industrial MarketMARKET HIGHLIGHTS - FLEX & WAREHOUSE
©2011 COSTAR GROUP, INC. THE COSTAR INDUSTRIAL REPORT 25
FIRST QUARTER 2011 – DENVER
Denver Industrial MarketMARKET HIGHLIGHTS - FLEX & WAREHOUSE
B R O O M F I E L D M A R K E T
Deliveries, Absorption & Vacancy Historical Analysis, Flex and Warehouse
Source: CoStar Property®
Vacant Space Quoted Rental RatesHistorical Analysis, Flex and Warehouse Historical Analysis, Flex and Warehouse
Source: CoStar Property® Source: CoStar Property®
Net QuotedPeriod # Bldgs Total RBA Vacant SF Vacancy % Absorption # Bldgs Total RBA # Bldgs Total RBA Rates2011 1q 149 4,378,477 517,101 11.8% 52,707 0 0 0 0 $6.13
2010 4q 149 4,378,477 569,808 13.0% 3,481 0 0 0 0 $5.98
2010 3q 149 4,378,477 573,289 13.1% 711 0 0 0 0 $6.07
2010 2q 149 4,378,477 574,000 13.1% (82,241) 0 0 0 0 $6.21
2010 1q 149 4,378,477 491,759 11.2% (38,377) 0 0 0 0 $6.23
2009 4q 149 4,378,477 453,382 10.4% 99,955 0 0 0 0 $6.37
2009 3q 149 4,378,477 553,337 12.6% (13,916) 0 0 0 0 $6.70
2009 2q 149 4,378,477 539,421 12.3% (118,202) 0 0 0 0 $6.65
2009 1q 149 4,378,477 421,219 9.6% (22,120) 0 0 0 0 $6.70
2008 4q 149 4,378,477 399,099 9.1% (14,271) 0 0 0 0 $6.77
2008 3q 149 4,378,477 384,828 8.8% 65,108 0 0 0 0 $6.90
2008 2q 149 4,378,477 449,936 10.3% (52,330) 0 0 0 0 $7.00
2008 1q 149 4,378,477 397,606 9.1% 131,408 0 0 0 0 $7.04
2007 4q 149 4,378,477 529,014 12.1% 48,090 0 0 0 0 $7.41
2007 3q 149 4,378,477 577,104 13.2% (5,435) 0 0 0 0 $6.94
2007 2q 149 4,378,477 571,669 13.1% 129,400 0 0 0 0 $6.87
Source: CoStar Property®
UC InventoryDelivered InventoryExisting Inventory Vacancy
(0.150)
(0.100)
(0.050)
0.000
0.050
0.100
0.150
2008 1q 2008 2q 2008 3q 2008 4q 2009 1q 2009 2q 2009 3q 2009 4q 2010 1q 2010 2q 2010 3q 2010 4q 2011 1q
Millio
ns
SF
0.0%
2.0%
4.0%
6.0%
8.0%
10.0%
12.0%
14.0%
Perce
nt V
acant
Delivered SF Absorption SF Vacancy
$5.85
$5.90
$5.95
$6.00
$6.05
$6.10
$6.15
$6.20
$6.25
$6.30
2010 1q 2010 2q 2010 3q 2010 4q 2011 1q
Dollar
s/SF/Y
ear
0.00
0.10
0.20
0.30
0.40
0.50
0.60
0.70
2010 1q 2010 2q 2010 3q 2010 4q 2011 1q
Millio
ns
SF
Direct SF Sublet SF
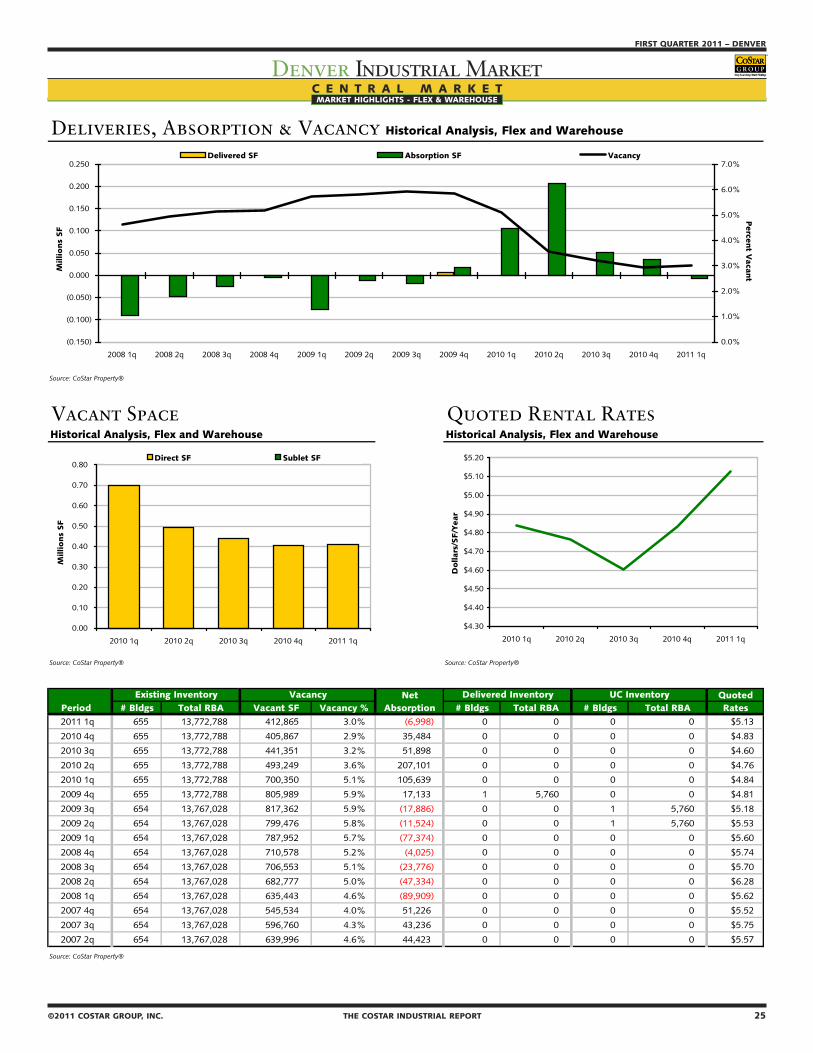
24 THE COSTAR INDUSTRIAL REPORT ©2011 COSTAR GROUP, INC.
DENVER – FIRST QUARTER 2011
Denver Industrial MarketMARKET HIGHLIGHTS - FLEX & WAREHOUSE
©2011 COSTAR GROUP, INC. THE COSTAR INDUSTRIAL REPORT 25
FIRST QUARTER 2011 – DENVER
Denver Industrial MarketMARKET HIGHLIGHTS - FLEX & WAREHOUSE
C E N T R A L M A R K E TMARKET HIGHLIGHTS - FLEX & WAREHOUSE
Deliveries, Absorption & Vacancy Historical Analysis, Flex and Warehouse
Source: CoStar Property®
Vacant Space Quoted Rental RatesHistorical Analysis, Flex and Warehouse Historical Analysis, Flex and Warehouse
Source: CoStar Property® Source: CoStar Property®
Net QuotedPeriod # Bldgs Total RBA Vacant SF Vacancy % Absorption # Bldgs Total RBA # Bldgs Total RBA Rates2011 1q 655 13,772,788 412,865 3.0% (6,998) 0 0 0 0 $5.13
2010 4q 655 13,772,788 405,867 2.9% 35,484 0 0 0 0 $4.83
2010 3q 655 13,772,788 441,351 3.2% 51,898 0 0 0 0 $4.60
2010 2q 655 13,772,788 493,249 3.6% 207,101 0 0 0 0 $4.76
2010 1q 655 13,772,788 700,350 5.1% 105,639 0 0 0 0 $4.84
2009 4q 655 13,772,788 805,989 5.9% 17,133 1 5,760 0 0 $4.81
2009 3q 654 13,767,028 817,362 5.9% (17,886) 0 0 1 5,760 $5.18
2009 2q 654 13,767,028 799,476 5.8% (11,524) 0 0 1 5,760 $5.53
2009 1q 654 13,767,028 787,952 5.7% (77,374) 0 0 0 0 $5.60
2008 4q 654 13,767,028 710,578 5.2% (4,025) 0 0 0 0 $5.74
2008 3q 654 13,767,028 706,553 5.1% (23,776) 0 0 0 0 $5.70
2008 2q 654 13,767,028 682,777 5.0% (47,334) 0 0 0 0 $6.28
2008 1q 654 13,767,028 635,443 4.6% (89,909) 0 0 0 0 $5.62
2007 4q 654 13,767,028 545,534 4.0% 51,226 0 0 0 0 $5.52
2007 3q 654 13,767,028 596,760 4.3% 43,236 0 0 0 0 $5.75
2007 2q 654 13,767,028 639,996 4.6% 44,423 0 0 0 0 $5.57
Source: CoStar Property®
UC InventoryDelivered InventoryExisting Inventory Vacancy
(0.150)
(0.100)
(0.050)
0.000
0.050
0.100
0.150
0.200
0.250
2008 1q 2008 2q 2008 3q 2008 4q 2009 1q 2009 2q 2009 3q 2009 4q 2010 1q 2010 2q 2010 3q 2010 4q 2011 1q
Millio
ns
SF
0.0%
1.0%
2.0%
3.0%
4.0%
5.0%
6.0%
7.0%
Perce
nt V
acant
Delivered SF Absorption SF Vacancy
$4.30
$4.40
$4.50
$4.60
$4.70
$4.80
$4.90
$5.00
$5.10
$5.20
2010 1q 2010 2q 2010 3q 2010 4q 2011 1q
Dollar
s/SF/Y
ear
0.00
0.10
0.20
0.30
0.40
0.50
0.60
0.70
0.80
2010 1q 2010 2q 2010 3q 2010 4q 2011 1q
Millio
ns
SF
Direct SF Sublet SF
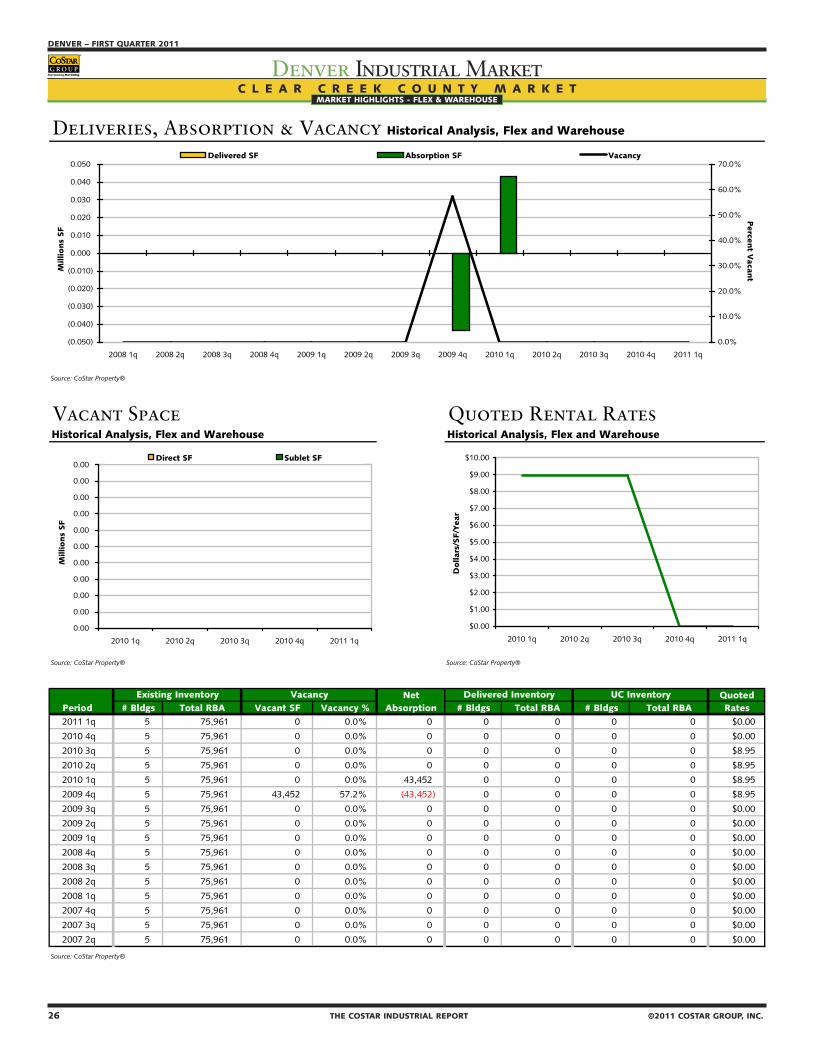
26 THE COSTAR INDUSTRIAL REPORT ©2011 COSTAR GROUP, INC.
DENVER – FIRST QUARTER 2011
Denver Industrial MarketMARKET HIGHLIGHTS - FLEX & WAREHOUSE
©2011 COSTAR GROUP, INC. THE COSTAR INDUSTRIAL REPORT 27
FIRST QUARTER 2011 – DENVER
Denver Industrial MarketMARKET HIGHLIGHTS - FLEX & WAREHOUSE
C L E A R C R E E K C O U N T Y M A R K E TMARKET HIGHLIGHTS - FLEX & WAREHOUSE
Deliveries, Absorption & Vacancy Historical Analysis, Flex and Warehouse
Source: CoStar Property®
Vacant Space Quoted Rental RatesHistorical Analysis, Flex and Warehouse Historical Analysis, Flex and Warehouse
Source: CoStar Property® Source: CoStar Property®
Net QuotedPeriod # Bldgs Total RBA Vacant SF Vacancy % Absorption # Bldgs Total RBA # Bldgs Total RBA Rates2011 1q 5 75,961 0 0.0% 0 0 0 0 0 $0.00
2010 4q 5 75,961 0 0.0% 0 0 0 0 0 $0.00
2010 3q 5 75,961 0 0.0% 0 0 0 0 0 $8.95
2010 2q 5 75,961 0 0.0% 0 0 0 0 0 $8.95
2010 1q 5 75,961 0 0.0% 43,452 0 0 0 0 $8.95
2009 4q 5 75,961 43,452 57.2% (43,452) 0 0 0 0 $8.95
2009 3q 5 75,961 0 0.0% 0 0 0 0 0 $0.00
2009 2q 5 75,961 0 0.0% 0 0 0 0 0 $0.00
2009 1q 5 75,961 0 0.0% 0 0 0 0 0 $0.00
2008 4q 5 75,961 0 0.0% 0 0 0 0 0 $0.00
2008 3q 5 75,961 0 0.0% 0 0 0 0 0 $0.00
2008 2q 5 75,961 0 0.0% 0 0 0 0 0 $0.00
2008 1q 5 75,961 0 0.0% 0 0 0 0 0 $0.00
2007 4q 5 75,961 0 0.0% 0 0 0 0 0 $0.00
2007 3q 5 75,961 0 0.0% 0 0 0 0 0 $0.00
2007 2q 5 75,961 0 0.0% 0 0 0 0 0 $0.00
Source: CoStar Property®
UC InventoryDelivered InventoryExisting Inventory Vacancy
(0.050)
(0.040)
(0.030)
(0.020)
(0.010)
0.000
0.010
0.020
0.030
0.040
0.050
2008 1q 2008 2q 2008 3q 2008 4q 2009 1q 2009 2q 2009 3q 2009 4q 2010 1q 2010 2q 2010 3q 2010 4q 2011 1q
Millio
ns
SF
0.0%
10.0%
20.0%
30.0%
40.0%
50.0%
60.0%
70.0%
Perce
nt V
acant
Delivered SF Absorption SF Vacancy
$0.00
$1.00
$2.00
$3.00
$4.00
$5.00
$6.00
$7.00
$8.00
$9.00
$10.00
2010 1q 2010 2q 2010 3q 2010 4q 2011 1q
Dollar
s/SF/Y
ear
0.00
0.00
0.00
0.00
0.00
0.00
0.00
0.00
0.00
0.00
0.00
2010 1q 2010 2q 2010 3q 2010 4q 2011 1q
Millio
ns
SF
Direct SF Sublet SF
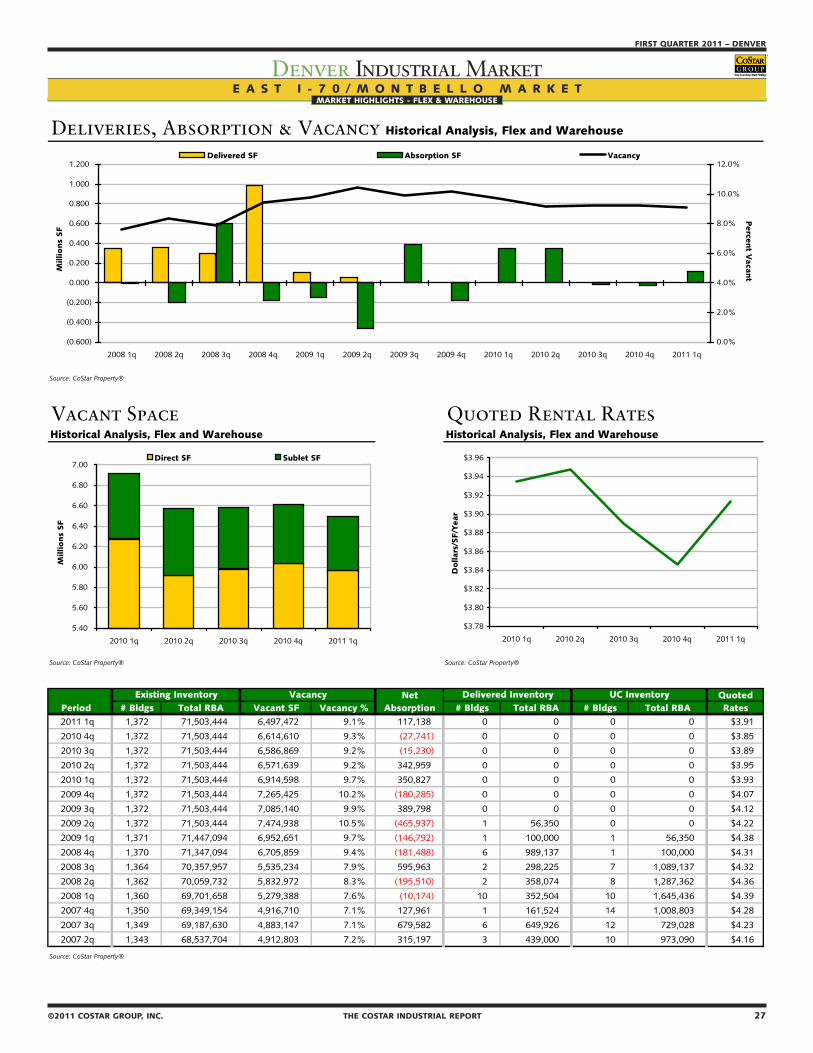
26 THE COSTAR INDUSTRIAL REPORT ©2011 COSTAR GROUP, INC.
DENVER – FIRST QUARTER 2011
Denver Industrial MarketMARKET HIGHLIGHTS - FLEX & WAREHOUSE
©2011 COSTAR GROUP, INC. THE COSTAR INDUSTRIAL REPORT 27
FIRST QUARTER 2011 – DENVER
Denver Industrial MarketMARKET HIGHLIGHTS - FLEX & WAREHOUSE
E A S T I - 7 0 / M O N T B E L L O M A R K E T
Deliveries, Absorption & Vacancy Historical Analysis, Flex and Warehouse
Source: CoStar Property®
Vacant Space Quoted Rental RatesHistorical Analysis, Flex and Warehouse Historical Analysis, Flex and Warehouse
Source: CoStar Property® Source: CoStar Property®
Net QuotedPeriod # Bldgs Total RBA Vacant SF Vacancy % Absorption # Bldgs Total RBA # Bldgs Total RBA Rates2011 1q 1,372 71,503,444 6,497,472 9.1% 117,138 0 0 0 0 $3.91
2010 4q 1,372 71,503,444 6,614,610 9.3% (27,741) 0 0 0 0 $3.85
2010 3q 1,372 71,503,444 6,586,869 9.2% (15,230) 0 0 0 0 $3.89
2010 2q 1,372 71,503,444 6,571,639 9.2% 342,959 0 0 0 0 $3.95
2010 1q 1,372 71,503,444 6,914,598 9.7% 350,827 0 0 0 0 $3.93
2009 4q 1,372 71,503,444 7,265,425 10.2% (180,285) 0 0 0 0 $4.07
2009 3q 1,372 71,503,444 7,085,140 9.9% 389,798 0 0 0 0 $4.12
2009 2q 1,372 71,503,444 7,474,938 10.5% (465,937) 1 56,350 0 0 $4.22
2009 1q 1,371 71,447,094 6,952,651 9.7% (146,792) 1 100,000 1 56,350 $4.38
2008 4q 1,370 71,347,094 6,705,859 9.4% (181,488) 6 989,137 1 100,000 $4.31
2008 3q 1,364 70,357,957 5,535,234 7.9% 595,963 2 298,225 7 1,089,137 $4.32
2008 2q 1,362 70,059,732 5,832,972 8.3% (195,510) 2 358,074 8 1,287,362 $4.36
2008 1q 1,360 69,701,658 5,279,388 7.6% (10,174) 10 352,504 10 1,645,436 $4.39
2007 4q 1,350 69,349,154 4,916,710 7.1% 127,961 1 161,524 14 1,008,803 $4.28
2007 3q 1,349 69,187,630 4,883,147 7.1% 679,582 6 649,926 12 729,028 $4.23
2007 2q 1,343 68,537,704 4,912,803 7.2% 315,197 3 439,000 10 973,090 $4.16
Source: CoStar Property®
UC InventoryDelivered InventoryExisting Inventory Vacancy
(0.600)
(0.400)
(0.200)
0.000
0.200
0.400
0.600
0.800
1.000
1.200
2008 1q 2008 2q 2008 3q 2008 4q 2009 1q 2009 2q 2009 3q 2009 4q 2010 1q 2010 2q 2010 3q 2010 4q 2011 1q
Millio
ns
SF
0.0%
2.0%
4.0%
6.0%
8.0%
10.0%
12.0%
Perce
nt V
acant
Delivered SF Absorption SF Vacancy
$3.78
$3.80
$3.82
$3.84
$3.86
$3.88
$3.90
$3.92
$3.94
$3.96
2010 1q 2010 2q 2010 3q 2010 4q 2011 1q
Dollar
s/SF/Y
ear
5.40
5.60
5.80
6.00
6.20
6.40
6.60
6.80
7.00
2010 1q 2010 2q 2010 3q 2010 4q 2011 1q
Millio
ns
SF
Direct SF Sublet SF

28 THE COSTAR INDUSTRIAL REPORT ©2011 COSTAR GROUP, INC.
DENVER – FIRST QUARTER 2011
Denver Industrial MarketMARKET HIGHLIGHTS - FLEX & WAREHOUSE
©2011 COSTAR GROUP, INC. THE COSTAR INDUSTRIAL REPORT 29
FIRST QUARTER 2011 – DENVER
Denver Industrial MarketMARKET HIGHLIGHTS - FLEX & WAREHOUSE
E L B E R T C O U N T Y M A R K E T
Deliveries, Absorption & Vacancy Historical Analysis, Flex and Warehouse
Source: CoStar Property®
Vacant Space Quoted Rental RatesHistorical Analysis, Flex and Warehouse Historical Analysis, Flex and Warehouse
Source: CoStar Property® Source: CoStar Property®
Net QuotedPeriod # Bldgs Total RBA Vacant SF Vacancy % Absorption # Bldgs Total RBA # Bldgs Total RBA Rates2011 1q 6 48,459 4,337 8.9% (2,169) 0 0 0 0 $6.89
2010 4q 6 48,459 2,168 4.5% 2,908 0 0 0 0 $6.54
2010 3q 6 48,459 5,076 10.5% (5,076) 0 0 0 0 $0.00
2010 2q 6 48,459 0 0.0% 0 0 0 0 0 $0.00
2010 1q 6 48,459 0 0.0% 0 0 0 0 0 $0.00
2009 4q 6 48,459 0 0.0% 0 0 0 0 0 $0.00
2009 3q 6 48,459 0 0.0% 0 0 0 0 0 $0.00
2009 2q 6 48,459 0 0.0% 0 0 0 0 0 $0.00
2009 1q 6 48,459 0 0.0% 0 0 0 0 0 $0.00
2008 4q 6 48,459 0 0.0% 0 0 0 0 0 $0.00
2008 3q 6 48,459 0 0.0% 0 0 0 0 0 $0.00
2008 2q 6 48,459 0 0.0% 0 0 0 0 0 $0.00
2008 1q 6 48,459 0 0.0% 0 0 0 0 0 $0.00
2007 4q 6 48,459 0 0.0% 0 0 0 0 0 $0.00
2007 3q 6 48,459 0 0.0% 0 0 0 0 0 $0.00
2007 2q 6 48,459 0 0.0% 0 0 0 0 0 $0.00
Source: CoStar Property®
UC InventoryDelivered InventoryExisting Inventory Vacancy
(0.006)
(0.005)
(0.004)
(0.003)
(0.002)
(0.001)
0.000
0.001
0.002
0.003
0.004
2008 1q 2008 2q 2008 3q 2008 4q 2009 1q 2009 2q 2009 3q 2009 4q 2010 1q 2010 2q 2010 3q 2010 4q 2011 1q
Millio
ns
SF
0.0%
2.0%
4.0%
6.0%
8.0%
10.0%
12.0%
Perce
nt V
acant
Delivered SF Absorption SF Vacancy
$0.00
$1.00
$2.00
$3.00
$4.00
$5.00
$6.00
$7.00
$8.00
2010 1q 2010 2q 2010 3q 2010 4q 2011 1q
Dollar
s/SF/Y
ear
0.00
0.00
0.00
0.00
0.00
0.01
0.01
2010 1q 2010 2q 2010 3q 2010 4q 2011 1q
Millio
ns
SF
Direct SF Sublet SF
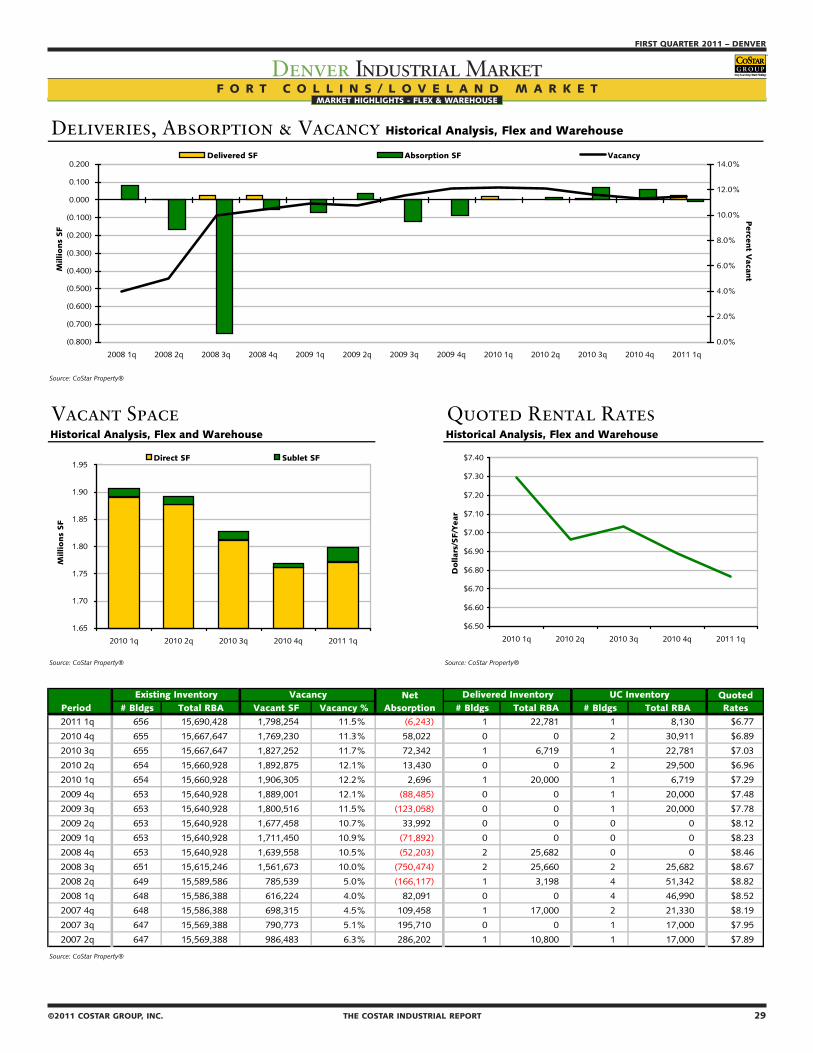
28 THE COSTAR INDUSTRIAL REPORT ©2011 COSTAR GROUP, INC.
DENVER – FIRST QUARTER 2011
Denver Industrial MarketMARKET HIGHLIGHTS - FLEX & WAREHOUSE
©2011 COSTAR GROUP, INC. THE COSTAR INDUSTRIAL REPORT 29
FIRST QUARTER 2011 – DENVER
Denver Industrial MarketMARKET HIGHLIGHTS - FLEX & WAREHOUSE
F O R T C O L L I N S / L O V E L A N D M A R K E T
Deliveries, Absorption & Vacancy Historical Analysis, Flex and Warehouse
Source: CoStar Property®
Vacant Space Quoted Rental RatesHistorical Analysis, Flex and Warehouse Historical Analysis, Flex and Warehouse
Source: CoStar Property® Source: CoStar Property®
Net QuotedPeriod # Bldgs Total RBA Vacant SF Vacancy % Absorption # Bldgs Total RBA # Bldgs Total RBA Rates2011 1q 656 15,690,428 1,798,254 11.5% (6,243) 1 22,781 1 8,130 $6.77
2010 4q 655 15,667,647 1,769,230 11.3% 58,022 0 0 2 30,911 $6.89
2010 3q 655 15,667,647 1,827,252 11.7% 72,342 1 6,719 1 22,781 $7.03
2010 2q 654 15,660,928 1,892,875 12.1% 13,430 0 0 2 29,500 $6.96
2010 1q 654 15,660,928 1,906,305 12.2% 2,696 1 20,000 1 6,719 $7.29
2009 4q 653 15,640,928 1,889,001 12.1% (88,485) 0 0 1 20,000 $7.48
2009 3q 653 15,640,928 1,800,516 11.5% (123,058) 0 0 1 20,000 $7.78
2009 2q 653 15,640,928 1,677,458 10.7% 33,992 0 0 0 0 $8.12
2009 1q 653 15,640,928 1,711,450 10.9% (71,892) 0 0 0 0 $8.23
2008 4q 653 15,640,928 1,639,558 10.5% (52,203) 2 25,682 0 0 $8.46
2008 3q 651 15,615,246 1,561,673 10.0% (750,474) 2 25,660 2 25,682 $8.67
2008 2q 649 15,589,586 785,539 5.0% (166,117) 1 3,198 4 51,342 $8.82
2008 1q 648 15,586,388 616,224 4.0% 82,091 0 0 4 46,990 $8.52
2007 4q 648 15,586,388 698,315 4.5% 109,458 1 17,000 2 21,330 $8.19
2007 3q 647 15,569,388 790,773 5.1% 195,710 0 0 1 17,000 $7.95
2007 2q 647 15,569,388 986,483 6.3% 286,202 1 10,800 1 17,000 $7.89
Source: CoStar Property®
UC InventoryDelivered InventoryExisting Inventory Vacancy
(0.800)
(0.700)
(0.600)
(0.500)
(0.400)
(0.300)
(0.200)
(0.100)
0.000
0.100
0.200
2008 1q 2008 2q 2008 3q 2008 4q 2009 1q 2009 2q 2009 3q 2009 4q 2010 1q 2010 2q 2010 3q 2010 4q 2011 1q
Millio
ns
SF
0.0%
2.0%
4.0%
6.0%
8.0%
10.0%
12.0%
14.0%
Perce
nt V
acant
Delivered SF Absorption SF Vacancy
$6.50
$6.60
$6.70
$6.80
$6.90
$7.00
$7.10
$7.20
$7.30
$7.40
2010 1q 2010 2q 2010 3q 2010 4q 2011 1q
Dollar
s/SF/Y
ear
1.65
1.70
1.75
1.80
1.85
1.90
1.95
2010 1q 2010 2q 2010 3q 2010 4q 2011 1q
Millio
ns
SF
Direct SF Sublet SF
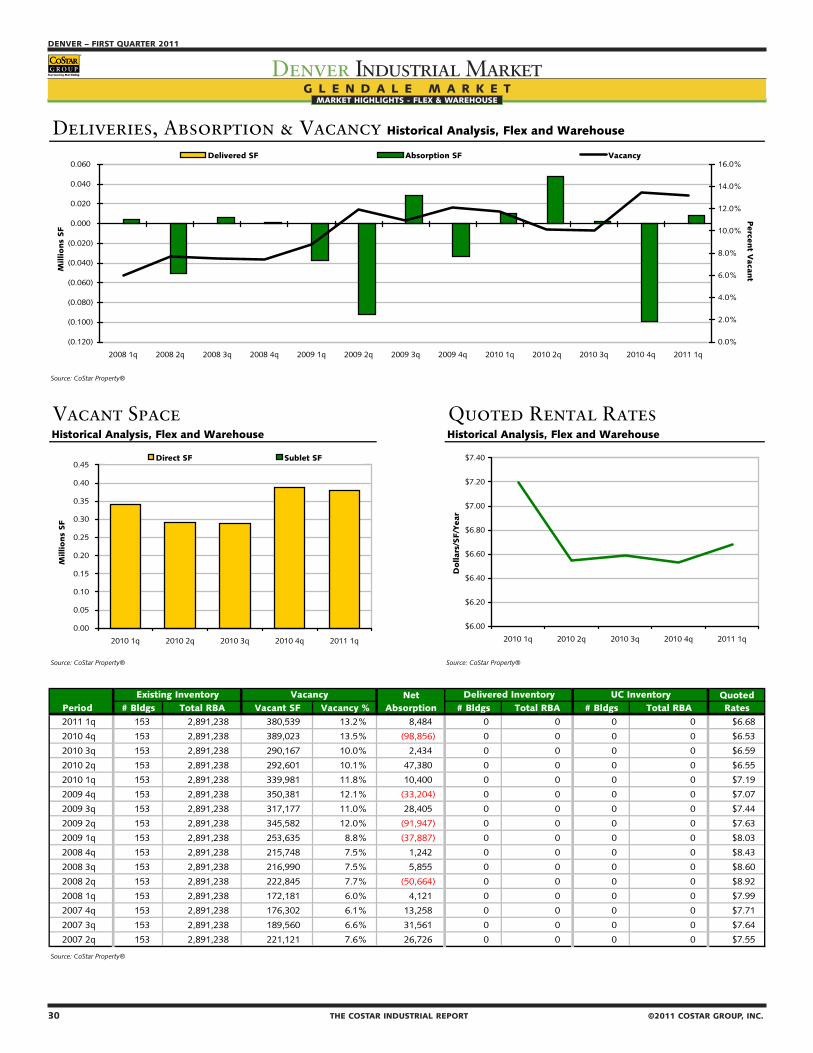
30 THE COSTAR INDUSTRIAL REPORT ©2011 COSTAR GROUP, INC.
DENVER – FIRST QUARTER 2011
Denver Industrial MarketMARKET HIGHLIGHTS - FLEX & WAREHOUSE
©2011 COSTAR GROUP, INC. THE COSTAR INDUSTRIAL REPORT 31
FIRST QUARTER 2011 – DENVER
Denver Industrial MarketMARKET HIGHLIGHTS - FLEX & WAREHOUSE
G L E N D A L E M A R K E T
Deliveries, Absorption & Vacancy Historical Analysis, Flex and Warehouse
Source: CoStar Property®
Vacant Space Quoted Rental RatesHistorical Analysis, Flex and Warehouse Historical Analysis, Flex and Warehouse
Source: CoStar Property® Source: CoStar Property®
Net QuotedPeriod # Bldgs Total RBA Vacant SF Vacancy % Absorption # Bldgs Total RBA # Bldgs Total RBA Rates2011 1q 153 2,891,238 380,539 13.2% 8,484 0 0 0 0 $6.68
2010 4q 153 2,891,238 389,023 13.5% (98,856) 0 0 0 0 $6.53
2010 3q 153 2,891,238 290,167 10.0% 2,434 0 0 0 0 $6.59
2010 2q 153 2,891,238 292,601 10.1% 47,380 0 0 0 0 $6.55
2010 1q 153 2,891,238 339,981 11.8% 10,400 0 0 0 0 $7.19
2009 4q 153 2,891,238 350,381 12.1% (33,204) 0 0 0 0 $7.07
2009 3q 153 2,891,238 317,177 11.0% 28,405 0 0 0 0 $7.44
2009 2q 153 2,891,238 345,582 12.0% (91,947) 0 0 0 0 $7.63
2009 1q 153 2,891,238 253,635 8.8% (37,887) 0 0 0 0 $8.03
2008 4q 153 2,891,238 215,748 7.5% 1,242 0 0 0 0 $8.43
2008 3q 153 2,891,238 216,990 7.5% 5,855 0 0 0 0 $8.60
2008 2q 153 2,891,238 222,845 7.7% (50,664) 0 0 0 0 $8.92
2008 1q 153 2,891,238 172,181 6.0% 4,121 0 0 0 0 $7.99
2007 4q 153 2,891,238 176,302 6.1% 13,258 0 0 0 0 $7.71
2007 3q 153 2,891,238 189,560 6.6% 31,561 0 0 0 0 $7.64
2007 2q 153 2,891,238 221,121 7.6% 26,726 0 0 0 0 $7.55
Source: CoStar Property®
UC InventoryDelivered InventoryExisting Inventory Vacancy
(0.120)
(0.100)
(0.080)
(0.060)
(0.040)
(0.020)
0.000
0.020
0.040
0.060
2008 1q 2008 2q 2008 3q 2008 4q 2009 1q 2009 2q 2009 3q 2009 4q 2010 1q 2010 2q 2010 3q 2010 4q 2011 1q
Millio
ns
SF
0.0%
2.0%
4.0%
6.0%
8.0%
10.0%
12.0%
14.0%
16.0%
Perce
nt V
acant
Delivered SF Absorption SF Vacancy
$6.00
$6.20
$6.40
$6.60
$6.80
$7.00
$7.20
$7.40
2010 1q 2010 2q 2010 3q 2010 4q 2011 1q
Dollar
s/SF/Y
ear
0.00
0.05
0.10
0.15
0.20
0.25
0.30
0.35
0.40
0.45
2010 1q 2010 2q 2010 3q 2010 4q 2011 1q
Millio
ns
SF
Direct SF Sublet SF
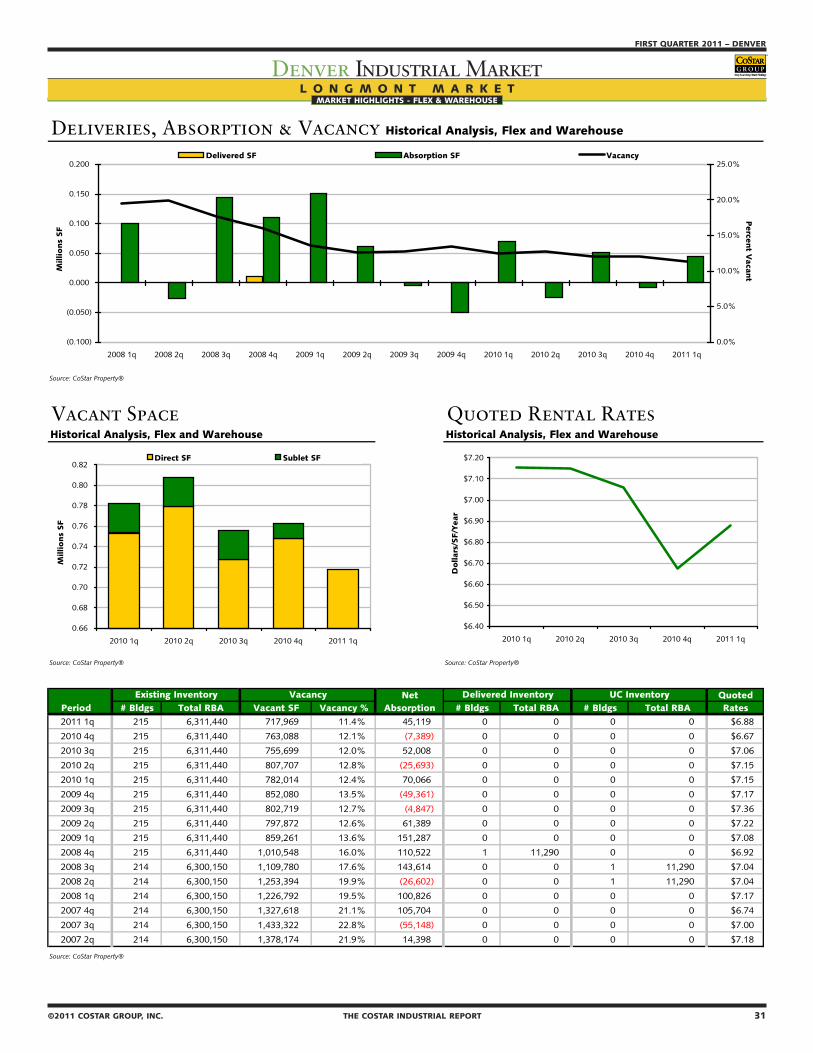
30 THE COSTAR INDUSTRIAL REPORT ©2011 COSTAR GROUP, INC.
DENVER – FIRST QUARTER 2011
Denver Industrial MarketMARKET HIGHLIGHTS - FLEX & WAREHOUSE
©2011 COSTAR GROUP, INC. THE COSTAR INDUSTRIAL REPORT 31
FIRST QUARTER 2011 – DENVER
Denver Industrial MarketMARKET HIGHLIGHTS - FLEX & WAREHOUSE
L O N G M O N T M A R K E T
Deliveries, Absorption & Vacancy Historical Analysis, Flex and Warehouse
Source: CoStar Property®
Vacant Space Quoted Rental RatesHistorical Analysis, Flex and Warehouse Historical Analysis, Flex and Warehouse
Source: CoStar Property® Source: CoStar Property®
Net QuotedPeriod # Bldgs Total RBA Vacant SF Vacancy % Absorption # Bldgs Total RBA # Bldgs Total RBA Rates2011 1q 215 6,311,440 717,969 11.4% 45,119 0 0 0 0 $6.88
2010 4q 215 6,311,440 763,088 12.1% (7,389) 0 0 0 0 $6.67
2010 3q 215 6,311,440 755,699 12.0% 52,008 0 0 0 0 $7.06
2010 2q 215 6,311,440 807,707 12.8% (25,693) 0 0 0 0 $7.15
2010 1q 215 6,311,440 782,014 12.4% 70,066 0 0 0 0 $7.15
2009 4q 215 6,311,440 852,080 13.5% (49,361) 0 0 0 0 $7.17
2009 3q 215 6,311,440 802,719 12.7% (4,847) 0 0 0 0 $7.36
2009 2q 215 6,311,440 797,872 12.6% 61,389 0 0 0 0 $7.22
2009 1q 215 6,311,440 859,261 13.6% 151,287 0 0 0 0 $7.08
2008 4q 215 6,311,440 1,010,548 16.0% 110,522 1 11,290 0 0 $6.92
2008 3q 214 6,300,150 1,109,780 17.6% 143,614 0 0 1 11,290 $7.04
2008 2q 214 6,300,150 1,253,394 19.9% (26,602) 0 0 1 11,290 $7.04
2008 1q 214 6,300,150 1,226,792 19.5% 100,826 0 0 0 0 $7.17
2007 4q 214 6,300,150 1,327,618 21.1% 105,704 0 0 0 0 $6.74
2007 3q 214 6,300,150 1,433,322 22.8% (55,148) 0 0 0 0 $7.00
2007 2q 214 6,300,150 1,378,174 21.9% 14,398 0 0 0 0 $7.18
Source: CoStar Property®
UC InventoryDelivered InventoryExisting Inventory Vacancy
(0.100)
(0.050)
0.000
0.050
0.100
0.150
0.200
2008 1q 2008 2q 2008 3q 2008 4q 2009 1q 2009 2q 2009 3q 2009 4q 2010 1q 2010 2q 2010 3q 2010 4q 2011 1q
Millio
ns
SF
0.0%
5.0%
10.0%
15.0%
20.0%
25.0%
Perce
nt V
acant
Delivered SF Absorption SF Vacancy
$6.40
$6.50
$6.60
$6.70
$6.80
$6.90
$7.00
$7.10
$7.20
2010 1q 2010 2q 2010 3q 2010 4q 2011 1q
Dollar
s/SF/Y
ear
0.66
0.68
0.70
0.72
0.74
0.76
0.78
0.80
0.82
2010 1q 2010 2q 2010 3q 2010 4q 2011 1q
Millio
ns
SF
Direct SF Sublet SF
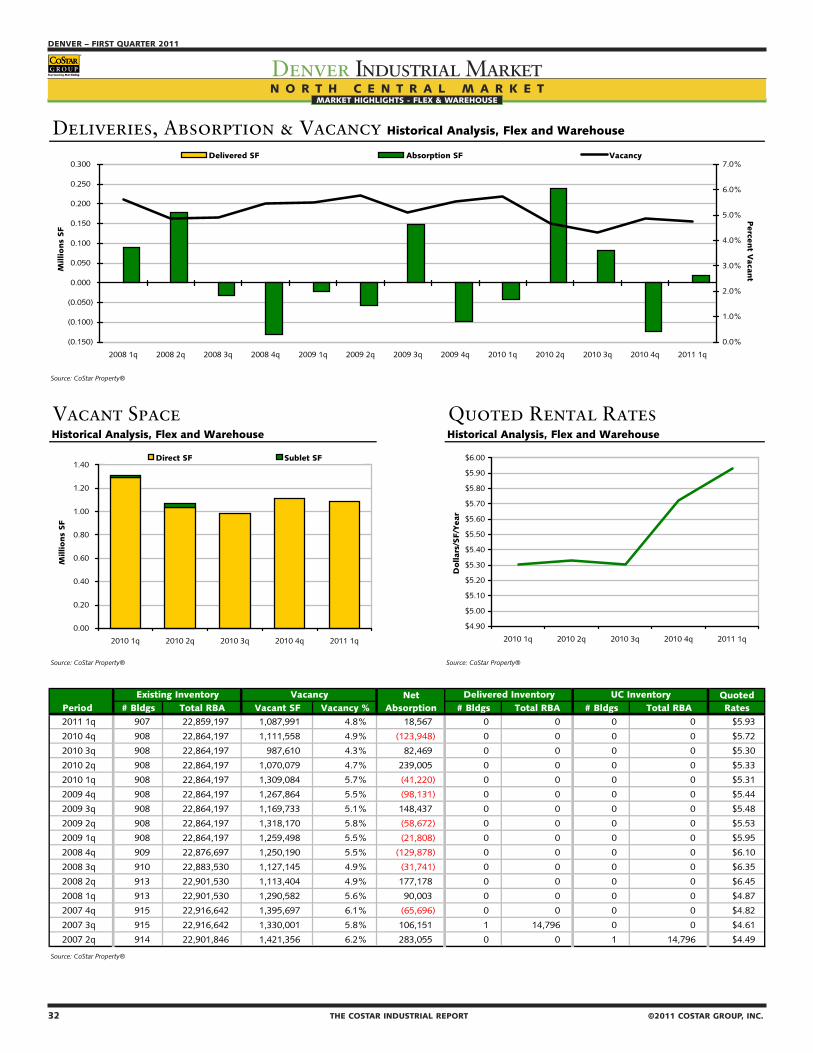
32 THE COSTAR INDUSTRIAL REPORT ©2011 COSTAR GROUP, INC.
DENVER – FIRST QUARTER 2011
Denver Industrial MarketMARKET HIGHLIGHTS - FLEX & WAREHOUSE
©2011 COSTAR GROUP, INC. THE COSTAR INDUSTRIAL REPORT 33
FIRST QUARTER 2011 – DENVER
Denver Industrial MarketMARKET HIGHLIGHTS - FLEX & WAREHOUSE
N O R T H C E N T R A L M A R K E T
Deliveries, Absorption & Vacancy Historical Analysis, Flex and Warehouse
Source: CoStar Property®
Vacant Space Quoted Rental RatesHistorical Analysis, Flex and Warehouse Historical Analysis, Flex and Warehouse
Source: CoStar Property® Source: CoStar Property®
Net QuotedPeriod # Bldgs Total RBA Vacant SF Vacancy % Absorption # Bldgs Total RBA # Bldgs Total RBA Rates2011 1q 907 22,859,197 1,087,991 4.8% 18,567 0 0 0 0 $5.93
2010 4q 908 22,864,197 1,111,558 4.9% (123,948) 0 0 0 0 $5.72
2010 3q 908 22,864,197 987,610 4.3% 82,469 0 0 0 0 $5.30
2010 2q 908 22,864,197 1,070,079 4.7% 239,005 0 0 0 0 $5.33
2010 1q 908 22,864,197 1,309,084 5.7% (41,220) 0 0 0 0 $5.31
2009 4q 908 22,864,197 1,267,864 5.5% (98,131) 0 0 0 0 $5.44
2009 3q 908 22,864,197 1,169,733 5.1% 148,437 0 0 0 0 $5.48
2009 2q 908 22,864,197 1,318,170 5.8% (58,672) 0 0 0 0 $5.53
2009 1q 908 22,864,197 1,259,498 5.5% (21,808) 0 0 0 0 $5.95
2008 4q 909 22,876,697 1,250,190 5.5% (129,878) 0 0 0 0 $6.10
2008 3q 910 22,883,530 1,127,145 4.9% (31,741) 0 0 0 0 $6.35
2008 2q 913 22,901,530 1,113,404 4.9% 177,178 0 0 0 0 $6.45
2008 1q 913 22,901,530 1,290,582 5.6% 90,003 0 0 0 0 $4.87
2007 4q 915 22,916,642 1,395,697 6.1% (65,696) 0 0 0 0 $4.82
2007 3q 915 22,916,642 1,330,001 5.8% 106,151 1 14,796 0 0 $4.61
2007 2q 914 22,901,846 1,421,356 6.2% 283,055 0 0 1 14,796 $4.49
Source: CoStar Property®
UC InventoryDelivered InventoryExisting Inventory Vacancy
(0.150)
(0.100)
(0.050)
0.000
0.050
0.100
0.150
0.200
0.250
0.300
2008 1q 2008 2q 2008 3q 2008 4q 2009 1q 2009 2q 2009 3q 2009 4q 2010 1q 2010 2q 2010 3q 2010 4q 2011 1q
Millio
ns
SF
0.0%
1.0%
2.0%
3.0%
4.0%
5.0%
6.0%
7.0%
Perce
nt V
acant
Delivered SF Absorption SF Vacancy
$4.90
$5.00
$5.10
$5.20
$5.30
$5.40
$5.50
$5.60
$5.70
$5.80
$5.90
$6.00
2010 1q 2010 2q 2010 3q 2010 4q 2011 1q
Dollar
s/SF/Y
ear
0.00
0.20
0.40
0.60
0.80
1.00
1.20
1.40
2010 1q 2010 2q 2010 3q 2010 4q 2011 1q
Millio
ns
SF
Direct SF Sublet SF
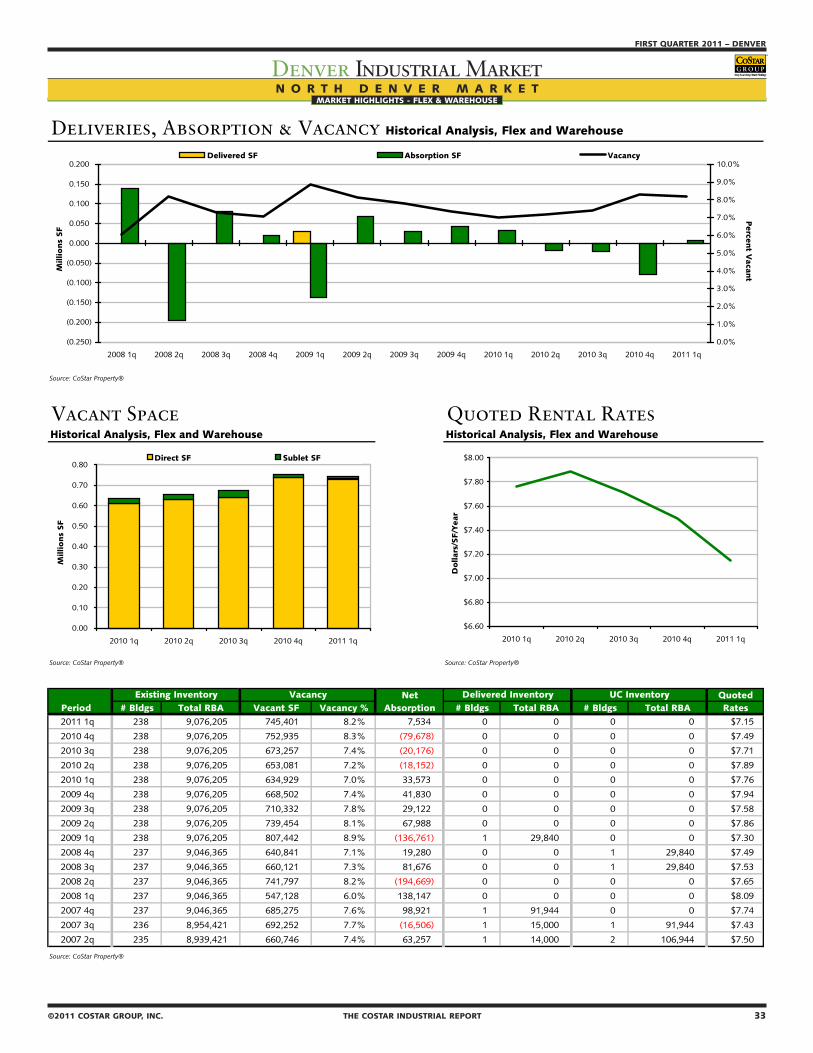
32 THE COSTAR INDUSTRIAL REPORT ©2011 COSTAR GROUP, INC.
DENVER – FIRST QUARTER 2011
Denver Industrial MarketMARKET HIGHLIGHTS - FLEX & WAREHOUSE
©2011 COSTAR GROUP, INC. THE COSTAR INDUSTRIAL REPORT 33
FIRST QUARTER 2011 – DENVER
Denver Industrial MarketMARKET HIGHLIGHTS - FLEX & WAREHOUSE
N O R T H D E N V E R M A R K E T
Deliveries, Absorption & Vacancy Historical Analysis, Flex and Warehouse
Source: CoStar Property®
Vacant Space Quoted Rental RatesHistorical Analysis, Flex and Warehouse Historical Analysis, Flex and Warehouse
Source: CoStar Property® Source: CoStar Property®
Net QuotedPeriod # Bldgs Total RBA Vacant SF Vacancy % Absorption # Bldgs Total RBA # Bldgs Total RBA Rates2011 1q 238 9,076,205 745,401 8.2% 7,534 0 0 0 0 $7.15
2010 4q 238 9,076,205 752,935 8.3% (79,678) 0 0 0 0 $7.49
2010 3q 238 9,076,205 673,257 7.4% (20,176) 0 0 0 0 $7.71
2010 2q 238 9,076,205 653,081 7.2% (18,152) 0 0 0 0 $7.89
2010 1q 238 9,076,205 634,929 7.0% 33,573 0 0 0 0 $7.76
2009 4q 238 9,076,205 668,502 7.4% 41,830 0 0 0 0 $7.94
2009 3q 238 9,076,205 710,332 7.8% 29,122 0 0 0 0 $7.58
2009 2q 238 9,076,205 739,454 8.1% 67,988 0 0 0 0 $7.86
2009 1q 238 9,076,205 807,442 8.9% (136,761) 1 29,840 0 0 $7.30
2008 4q 237 9,046,365 640,841 7.1% 19,280 0 0 1 29,840 $7.49
2008 3q 237 9,046,365 660,121 7.3% 81,676 0 0 1 29,840 $7.53
2008 2q 237 9,046,365 741,797 8.2% (194,669) 0 0 0 0 $7.65
2008 1q 237 9,046,365 547,128 6.0% 138,147 0 0 0 0 $8.09
2007 4q 237 9,046,365 685,275 7.6% 98,921 1 91,944 0 0 $7.74
2007 3q 236 8,954,421 692,252 7.7% (16,506) 1 15,000 1 91,944 $7.43
2007 2q 235 8,939,421 660,746 7.4% 63,257 1 14,000 2 106,944 $7.50
Source: CoStar Property®
UC InventoryDelivered InventoryExisting Inventory Vacancy
(0.250)
(0.200)
(0.150)
(0.100)
(0.050)
0.000
0.050
0.100
0.150
0.200
2008 1q 2008 2q 2008 3q 2008 4q 2009 1q 2009 2q 2009 3q 2009 4q 2010 1q 2010 2q 2010 3q 2010 4q 2011 1q
Millio
ns
SF
0.0%
1.0%
2.0%
3.0%
4.0%
5.0%
6.0%
7.0%
8.0%
9.0%
10.0%
Perce
nt V
acant
Delivered SF Absorption SF Vacancy
$6.60
$6.80
$7.00
$7.20
$7.40
$7.60
$7.80
$8.00
2010 1q 2010 2q 2010 3q 2010 4q 2011 1q
Dollar
s/SF/Y
ear
0.00
0.10
0.20
0.30
0.40
0.50
0.60
0.70
0.80
2010 1q 2010 2q 2010 3q 2010 4q 2011 1q
Millio
ns
SF
Direct SF Sublet SF
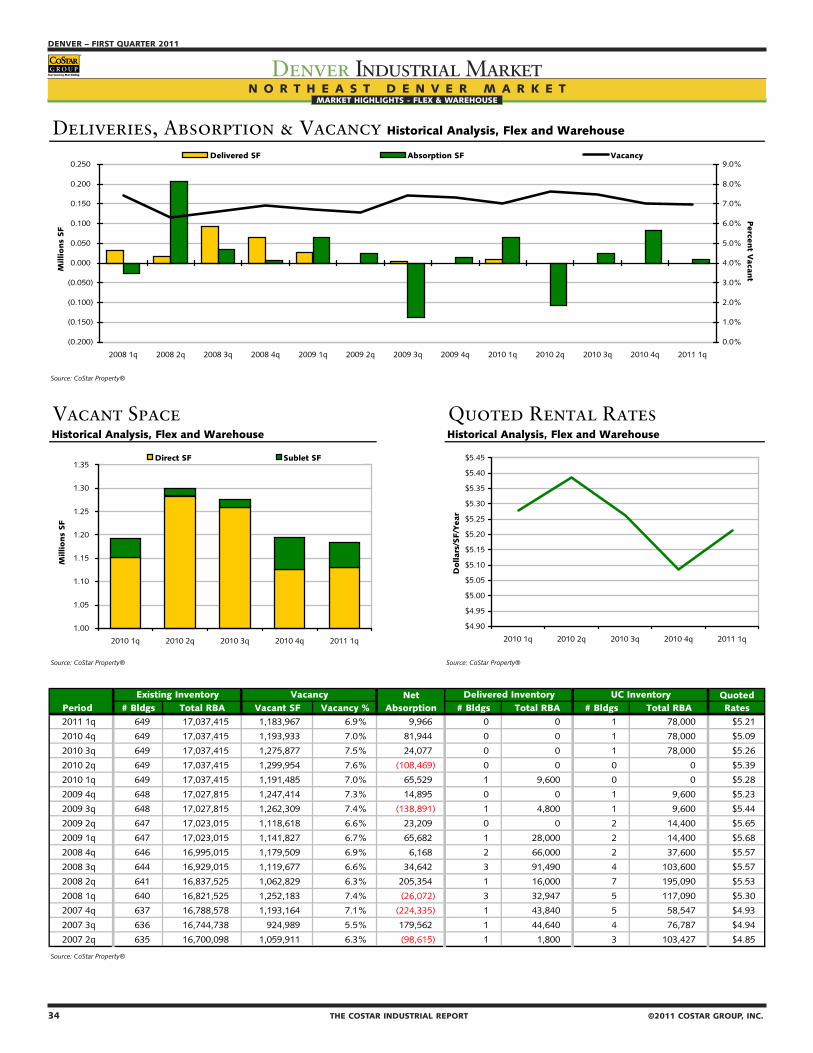
34 THE COSTAR INDUSTRIAL REPORT ©2011 COSTAR GROUP, INC.
DENVER – FIRST QUARTER 2011
Denver Industrial MarketMARKET HIGHLIGHTS - FLEX & WAREHOUSE
©2011 COSTAR GROUP, INC. THE COSTAR INDUSTRIAL REPORT 35
FIRST QUARTER 2011 – DENVER
Denver Industrial MarketMARKET HIGHLIGHTS - FLEX & WAREHOUSE
N O R T H E A S T D E N V E R M A R K E T
Deliveries, Absorption & Vacancy Historical Analysis, Flex and Warehouse
Source: CoStar Property®
Vacant Space Quoted Rental RatesHistorical Analysis, Flex and Warehouse Historical Analysis, Flex and Warehouse
Source: CoStar Property® Source: CoStar Property®
Net QuotedPeriod # Bldgs Total RBA Vacant SF Vacancy % Absorption # Bldgs Total RBA # Bldgs Total RBA Rates2011 1q 649 17,037,415 1,183,967 6.9% 9,966 0 0 1 78,000 $5.21
2010 4q 649 17,037,415 1,193,933 7.0% 81,944 0 0 1 78,000 $5.09
2010 3q 649 17,037,415 1,275,877 7.5% 24,077 0 0 1 78,000 $5.26
2010 2q 649 17,037,415 1,299,954 7.6% (108,469) 0 0 0 0 $5.39
2010 1q 649 17,037,415 1,191,485 7.0% 65,529 1 9,600 0 0 $5.28
2009 4q 648 17,027,815 1,247,414 7.3% 14,895 0 0 1 9,600 $5.23
2009 3q 648 17,027,815 1,262,309 7.4% (138,891) 1 4,800 1 9,600 $5.44
2009 2q 647 17,023,015 1,118,618 6.6% 23,209 0 0 2 14,400 $5.65
2009 1q 647 17,023,015 1,141,827 6.7% 65,682 1 28,000 2 14,400 $5.68
2008 4q 646 16,995,015 1,179,509 6.9% 6,168 2 66,000 2 37,600 $5.57
2008 3q 644 16,929,015 1,119,677 6.6% 34,642 3 91,490 4 103,600 $5.57
2008 2q 641 16,837,525 1,062,829 6.3% 205,354 1 16,000 7 195,090 $5.53
2008 1q 640 16,821,525 1,252,183 7.4% (26,072) 3 32,947 5 117,090 $5.30
2007 4q 637 16,788,578 1,193,164 7.1% (224,335) 1 43,840 5 58,547 $4.93
2007 3q 636 16,744,738 924,989 5.5% 179,562 1 44,640 4 76,787 $4.94
2007 2q 635 16,700,098 1,059,911 6.3% (98,615) 1 1,800 3 103,427 $4.85
Source: CoStar Property®
UC InventoryDelivered InventoryExisting Inventory Vacancy
(0.200)
(0.150)
(0.100)
(0.050)
0.000
0.050
0.100
0.150
0.200
0.250
2008 1q 2008 2q 2008 3q 2008 4q 2009 1q 2009 2q 2009 3q 2009 4q 2010 1q 2010 2q 2010 3q 2010 4q 2011 1q
Millio
ns
SF
0.0%
1.0%
2.0%
3.0%
4.0%
5.0%
6.0%
7.0%
8.0%
9.0%
Perce
nt V
acant
Delivered SF Absorption SF Vacancy
$4.90
$4.95
$5.00
$5.05
$5.10
$5.15
$5.20
$5.25
$5.30
$5.35
$5.40
$5.45
2010 1q 2010 2q 2010 3q 2010 4q 2011 1q
Dollar
s/SF/Y
ear
1.00
1.05
1.10
1.15
1.20
1.25
1.30
1.35
2010 1q 2010 2q 2010 3q 2010 4q 2011 1q
Millio
ns
SF
Direct SF Sublet SF
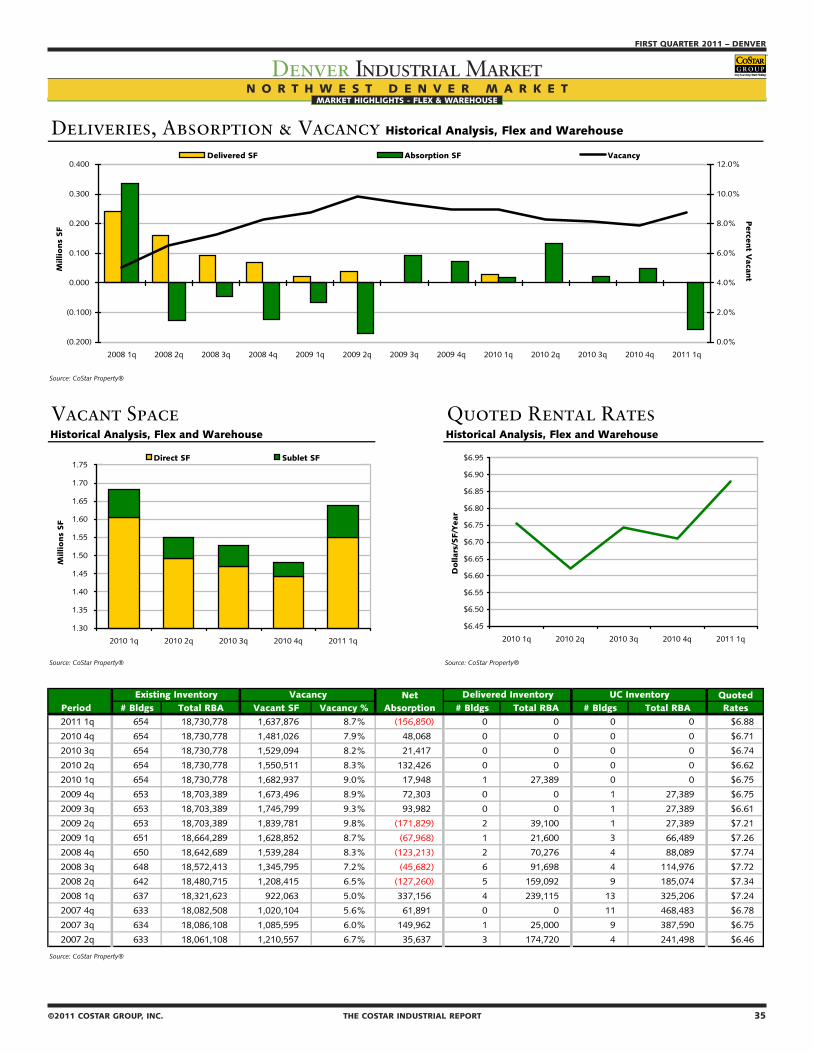
34 THE COSTAR INDUSTRIAL REPORT ©2011 COSTAR GROUP, INC.
DENVER – FIRST QUARTER 2011
Denver Industrial MarketMARKET HIGHLIGHTS - FLEX & WAREHOUSE
©2011 COSTAR GROUP, INC. THE COSTAR INDUSTRIAL REPORT 35
FIRST QUARTER 2011 – DENVER
Denver Industrial MarketMARKET HIGHLIGHTS - FLEX & WAREHOUSE
N O R T H W E S T D E N V E R M A R K E T
Deliveries, Absorption & Vacancy Historical Analysis, Flex and Warehouse
Source: CoStar Property®
Vacant Space Quoted Rental RatesHistorical Analysis, Flex and Warehouse Historical Analysis, Flex and Warehouse
Source: CoStar Property® Source: CoStar Property®
Net QuotedPeriod # Bldgs Total RBA Vacant SF Vacancy % Absorption # Bldgs Total RBA # Bldgs Total RBA Rates2011 1q 654 18,730,778 1,637,876 8.7% (156,850) 0 0 0 0 $6.88
2010 4q 654 18,730,778 1,481,026 7.9% 48,068 0 0 0 0 $6.71
2010 3q 654 18,730,778 1,529,094 8.2% 21,417 0 0 0 0 $6.74
2010 2q 654 18,730,778 1,550,511 8.3% 132,426 0 0 0 0 $6.62
2010 1q 654 18,730,778 1,682,937 9.0% 17,948 1 27,389 0 0 $6.75
2009 4q 653 18,703,389 1,673,496 8.9% 72,303 0 0 1 27,389 $6.75
2009 3q 653 18,703,389 1,745,799 9.3% 93,982 0 0 1 27,389 $6.61
2009 2q 653 18,703,389 1,839,781 9.8% (171,829) 2 39,100 1 27,389 $7.21
2009 1q 651 18,664,289 1,628,852 8.7% (67,968) 1 21,600 3 66,489 $7.26
2008 4q 650 18,642,689 1,539,284 8.3% (123,213) 2 70,276 4 88,089 $7.74
2008 3q 648 18,572,413 1,345,795 7.2% (45,682) 6 91,698 4 114,976 $7.72
2008 2q 642 18,480,715 1,208,415 6.5% (127,260) 5 159,092 9 185,074 $7.34
2008 1q 637 18,321,623 922,063 5.0% 337,156 4 239,115 13 325,206 $7.24
2007 4q 633 18,082,508 1,020,104 5.6% 61,891 0 0 11 468,483 $6.78
2007 3q 634 18,086,108 1,085,595 6.0% 149,962 1 25,000 9 387,590 $6.75
2007 2q 633 18,061,108 1,210,557 6.7% 35,637 3 174,720 4 241,498 $6.46
Source: CoStar Property®
UC InventoryDelivered InventoryExisting Inventory Vacancy
(0.200)
(0.100)
0.000
0.100
0.200
0.300
0.400
2008 1q 2008 2q 2008 3q 2008 4q 2009 1q 2009 2q 2009 3q 2009 4q 2010 1q 2010 2q 2010 3q 2010 4q 2011 1q
Millio
ns
SF
0.0%
2.0%
4.0%
6.0%
8.0%
10.0%
12.0%
Perce
nt V
acant
Delivered SF Absorption SF Vacancy
$6.45
$6.50
$6.55
$6.60
$6.65
$6.70
$6.75
$6.80
$6.85
$6.90
$6.95
2010 1q 2010 2q 2010 3q 2010 4q 2011 1q
Dollar
s/SF/Y
ear
1.30
1.35
1.40
1.45
1.50
1.55
1.60
1.65
1.70
1.75
2010 1q 2010 2q 2010 3q 2010 4q 2011 1q
Millio
ns
SF
Direct SF Sublet SF

36 THE COSTAR INDUSTRIAL REPORT ©2011 COSTAR GROUP, INC.
DENVER – FIRST QUARTER 2011
Denver Industrial MarketMARKET HIGHLIGHTS - FLEX & WAREHOUSE
©2011 COSTAR GROUP, INC. THE COSTAR INDUSTRIAL REPORT 37
FIRST QUARTER 2011 – DENVER
Denver Industrial MarketMARKET HIGHLIGHTS - FLEX & WAREHOUSE
P A R K C O U N T Y M A R K E T
Deliveries, Absorption & Vacancy Historical Analysis, Flex and Warehouse
Source: CoStar Property®
Vacant Space Quoted Rental RatesHistorical Analysis, Flex and Warehouse Historical Analysis, Flex and Warehouse
Source: CoStar Property® Source: CoStar Property®
Net QuotedPeriod # Bldgs Total RBA Vacant SF Vacancy % Absorption # Bldgs Total RBA # Bldgs Total RBA Rates2011 1q 7 20,132 0 0.0% 0 0 0 0 0 $6.33
2010 4q 7 20,132 0 0.0% 0 0 0 0 0 $6.33
2010 3q 7 20,132 0 0.0% 0 0 0 0 0 $6.33
2010 2q 7 20,132 0 0.0% 0 0 0 0 0 $0.00
2010 1q 7 20,132 0 0.0% 0 0 0 0 0 $0.00
2009 4q 7 20,132 0 0.0% 0 0 0 0 0 $0.00
2009 3q 7 20,132 0 0.0% 0 0 0 0 0 $0.00
2009 2q 7 20,132 0 0.0% 0 0 0 0 0 $0.00
2009 1q 7 20,132 0 0.0% 0 0 0 0 0 $0.00
2008 4q 7 20,132 0 0.0% 0 0 0 0 0 $0.00
2008 3q 7 20,132 0 0.0% 0 0 0 0 0 $0.00
2008 2q 7 20,132 0 0.0% 0 0 0 0 0 $0.00
2008 1q 7 20,132 0 0.0% 0 0 0 0 0 $0.00
2007 4q 7 20,132 0 0.0% 0 0 0 0 0 $0.00
2007 3q 7 20,132 0 0.0% 0 0 0 0 0 $0.00
2007 2q 7 20,132 0 0.0% 0 0 0 0 0 $0.00
Source: CoStar Property®
UC InventoryDelivered InventoryExisting Inventory Vacancy
0.000
0.000
0.000
0.000
0.000
0.000
0.000
0.000
0.000
0.000
0.000
2008 1q 2008 2q 2008 3q 2008 4q 2009 1q 2009 2q 2009 3q 2009 4q 2010 1q 2010 2q 2010 3q 2010 4q 2011 1q
Millio
ns
SF
0.0%
10.0%
20.0%
30.0%
40.0%
50.0%
60.0%
70.0%
80.0%
90.0%
100.0%
Perce
nt V
acant
Delivered SF Absorption SF Vacancy
$0.00
$1.00
$2.00
$3.00
$4.00
$5.00
$6.00
$7.00
2010 1q 2010 2q 2010 3q 2010 4q 2011 1q
Dollar
s/SF/Y
ear
0.00
0.00
0.00
0.00
0.00
0.00
0.00
0.00
0.00
0.00
0.00
2010 1q 2010 2q 2010 3q 2010 4q 2011 1q
Millio
ns
SF
Direct SF Sublet SF
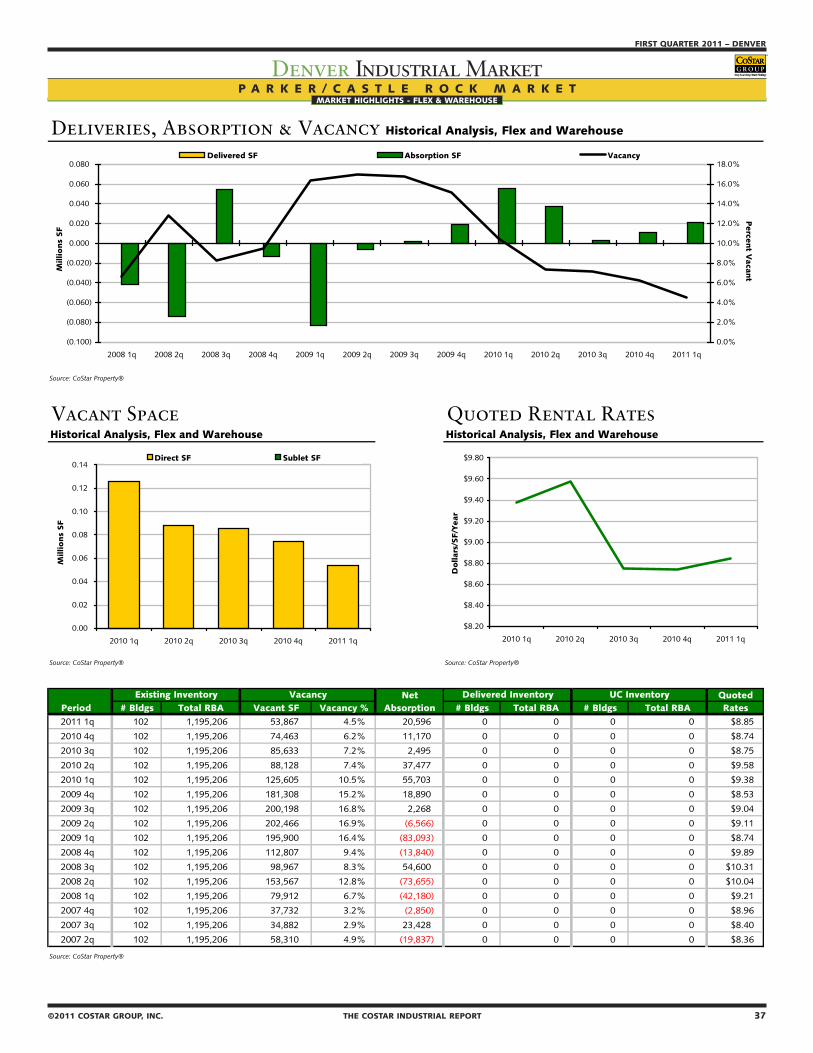
36 THE COSTAR INDUSTRIAL REPORT ©2011 COSTAR GROUP, INC.
DENVER – FIRST QUARTER 2011
Denver Industrial MarketMARKET HIGHLIGHTS - FLEX & WAREHOUSE
©2011 COSTAR GROUP, INC. THE COSTAR INDUSTRIAL REPORT 37
FIRST QUARTER 2011 – DENVER
Denver Industrial MarketMARKET HIGHLIGHTS - FLEX & WAREHOUSE
P A R K E R / C A S T L E R O C K M A R K E T
Deliveries, Absorption & Vacancy Historical Analysis, Flex and Warehouse
Source: CoStar Property®
Vacant Space Quoted Rental RatesHistorical Analysis, Flex and Warehouse Historical Analysis, Flex and Warehouse
Source: CoStar Property® Source: CoStar Property®
Net QuotedPeriod # Bldgs Total RBA Vacant SF Vacancy % Absorption # Bldgs Total RBA # Bldgs Total RBA Rates2011 1q 102 1,195,206 53,867 4.5% 20,596 0 0 0 0 $8.85
2010 4q 102 1,195,206 74,463 6.2% 11,170 0 0 0 0 $8.74
2010 3q 102 1,195,206 85,633 7.2% 2,495 0 0 0 0 $8.75
2010 2q 102 1,195,206 88,128 7.4% 37,477 0 0 0 0 $9.58
2010 1q 102 1,195,206 125,605 10.5% 55,703 0 0 0 0 $9.38
2009 4q 102 1,195,206 181,308 15.2% 18,890 0 0 0 0 $8.53
2009 3q 102 1,195,206 200,198 16.8% 2,268 0 0 0 0 $9.04
2009 2q 102 1,195,206 202,466 16.9% (6,566) 0 0 0 0 $9.11
2009 1q 102 1,195,206 195,900 16.4% (83,093) 0 0 0 0 $8.74
2008 4q 102 1,195,206 112,807 9.4% (13,840) 0 0 0 0 $9.89
2008 3q 102 1,195,206 98,967 8.3% 54,600 0 0 0 0 $10.31
2008 2q 102 1,195,206 153,567 12.8% (73,655) 0 0 0 0 $10.04
2008 1q 102 1,195,206 79,912 6.7% (42,180) 0 0 0 0 $9.21
2007 4q 102 1,195,206 37,732 3.2% (2,850) 0 0 0 0 $8.96
2007 3q 102 1,195,206 34,882 2.9% 23,428 0 0 0 0 $8.40
2007 2q 102 1,195,206 58,310 4.9% (19,837) 0 0 0 0 $8.36
Source: CoStar Property®
UC InventoryDelivered InventoryExisting Inventory Vacancy
(0.100)
(0.080)
(0.060)
(0.040)
(0.020)
0.000
0.020
0.040
0.060
0.080
2008 1q 2008 2q 2008 3q 2008 4q 2009 1q 2009 2q 2009 3q 2009 4q 2010 1q 2010 2q 2010 3q 2010 4q 2011 1q
Millio
ns
SF
0.0%
2.0%
4.0%
6.0%
8.0%
10.0%
12.0%
14.0%
16.0%
18.0%
Perce
nt V
acant
Delivered SF Absorption SF Vacancy
$8.20
$8.40
$8.60
$8.80
$9.00
$9.20
$9.40
$9.60
$9.80
2010 1q 2010 2q 2010 3q 2010 4q 2011 1q
Dollar
s/SF/Y
ear
0.00
0.02
0.04
0.06
0.08
0.10
0.12
0.14
2010 1q 2010 2q 2010 3q 2010 4q 2011 1q
Millio
ns
SF
Direct SF Sublet SF
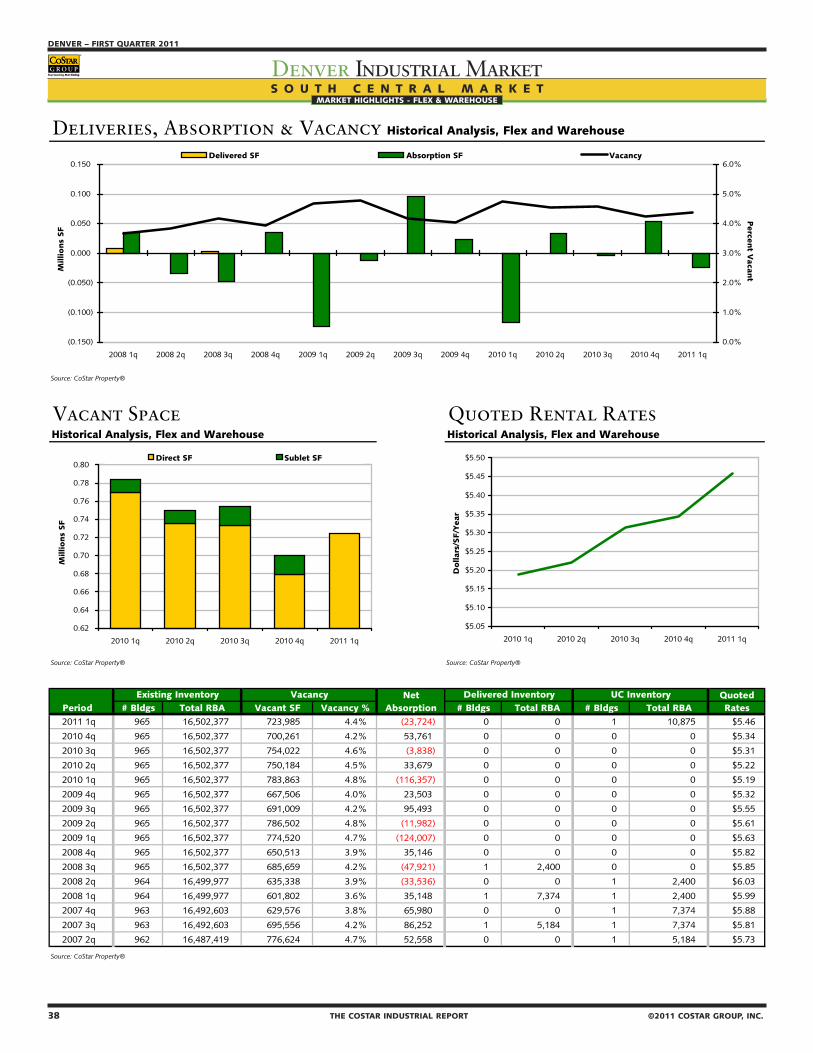
38 THE COSTAR INDUSTRIAL REPORT ©2011 COSTAR GROUP, INC.
DENVER – FIRST QUARTER 2011
Denver Industrial MarketMARKET HIGHLIGHTS - FLEX & WAREHOUSE
©2011 COSTAR GROUP, INC. THE COSTAR INDUSTRIAL REPORT 39
FIRST QUARTER 2011 – DENVER
Denver Industrial MarketMARKET HIGHLIGHTS - FLEX & WAREHOUSE
S O U T H C E N T R A L M A R K E T
Deliveries, Absorption & Vacancy Historical Analysis, Flex and Warehouse
Source: CoStar Property®
Vacant Space Quoted Rental RatesHistorical Analysis, Flex and Warehouse Historical Analysis, Flex and Warehouse
Source: CoStar Property® Source: CoStar Property®
Net QuotedPeriod # Bldgs Total RBA Vacant SF Vacancy % Absorption # Bldgs Total RBA # Bldgs Total RBA Rates2011 1q 965 16,502,377 723,985 4.4% (23,724) 0 0 1 10,875 $5.46
2010 4q 965 16,502,377 700,261 4.2% 53,761 0 0 0 0 $5.34
2010 3q 965 16,502,377 754,022 4.6% (3,838) 0 0 0 0 $5.31
2010 2q 965 16,502,377 750,184 4.5% 33,679 0 0 0 0 $5.22
2010 1q 965 16,502,377 783,863 4.8% (116,357) 0 0 0 0 $5.19
2009 4q 965 16,502,377 667,506 4.0% 23,503 0 0 0 0 $5.32
2009 3q 965 16,502,377 691,009 4.2% 95,493 0 0 0 0 $5.55
2009 2q 965 16,502,377 786,502 4.8% (11,982) 0 0 0 0 $5.61
2009 1q 965 16,502,377 774,520 4.7% (124,007) 0 0 0 0 $5.63
2008 4q 965 16,502,377 650,513 3.9% 35,146 0 0 0 0 $5.82
2008 3q 965 16,502,377 685,659 4.2% (47,921) 1 2,400 0 0 $5.85
2008 2q 964 16,499,977 635,338 3.9% (33,536) 0 0 1 2,400 $6.03
2008 1q 964 16,499,977 601,802 3.6% 35,148 1 7,374 1 2,400 $5.99
2007 4q 963 16,492,603 629,576 3.8% 65,980 0 0 1 7,374 $5.88
2007 3q 963 16,492,603 695,556 4.2% 86,252 1 5,184 1 7,374 $5.81
2007 2q 962 16,487,419 776,624 4.7% 52,558 0 0 1 5,184 $5.73
Source: CoStar Property®
UC InventoryDelivered InventoryExisting Inventory Vacancy
(0.150)
(0.100)
(0.050)
0.000
0.050
0.100
0.150
2008 1q 2008 2q 2008 3q 2008 4q 2009 1q 2009 2q 2009 3q 2009 4q 2010 1q 2010 2q 2010 3q 2010 4q 2011 1q
Millio
ns
SF
0.0%
1.0%
2.0%
3.0%
4.0%
5.0%
6.0%
Perce
nt V
acant
Delivered SF Absorption SF Vacancy
$5.05
$5.10
$5.15
$5.20
$5.25
$5.30
$5.35
$5.40
$5.45
$5.50
2010 1q 2010 2q 2010 3q 2010 4q 2011 1q
Dollar
s/SF/Y
ear
0.62
0.64
0.66
0.68
0.70
0.72
0.74
0.76
0.78
0.80
2010 1q 2010 2q 2010 3q 2010 4q 2011 1q
Millio
ns
SF
Direct SF Sublet SF
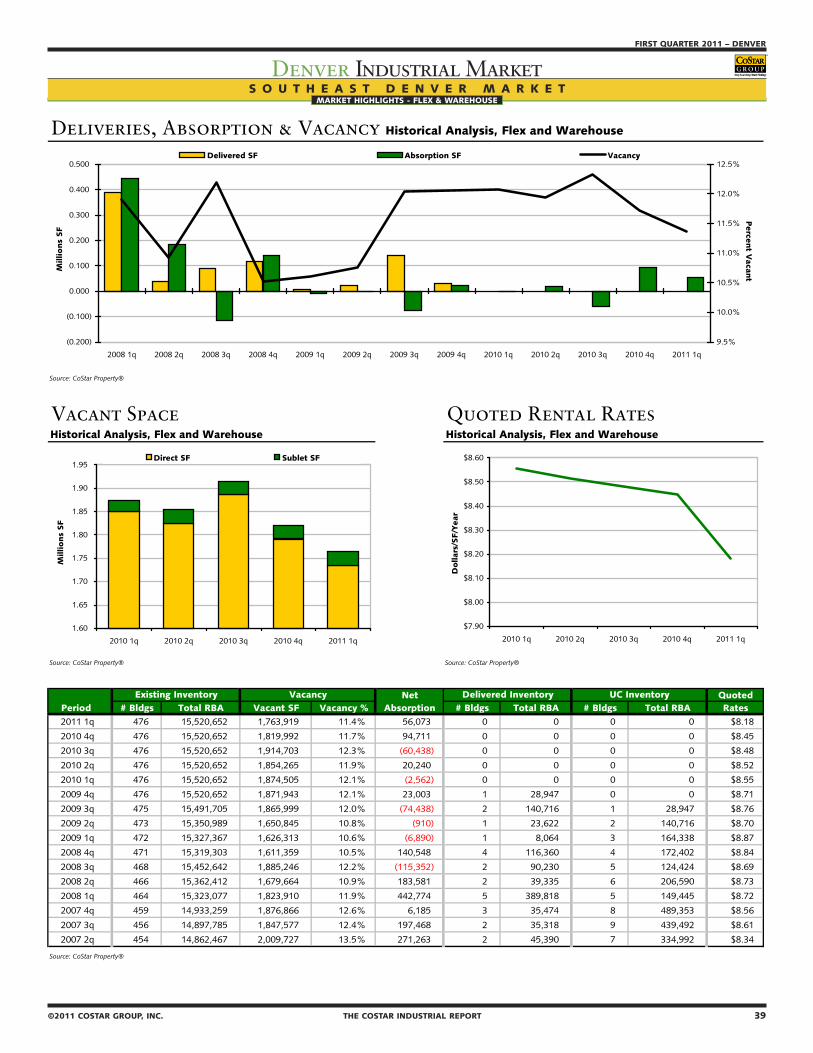
38 THE COSTAR INDUSTRIAL REPORT ©2011 COSTAR GROUP, INC.
DENVER – FIRST QUARTER 2011
Denver Industrial MarketMARKET HIGHLIGHTS - FLEX & WAREHOUSE
©2011 COSTAR GROUP, INC. THE COSTAR INDUSTRIAL REPORT 39
FIRST QUARTER 2011 – DENVER
Denver Industrial MarketMARKET HIGHLIGHTS - FLEX & WAREHOUSE
S O U T H E A S T D E N V E R M A R K E T
Deliveries, Absorption & Vacancy Historical Analysis, Flex and Warehouse
Source: CoStar Property®
Vacant Space Quoted Rental RatesHistorical Analysis, Flex and Warehouse Historical Analysis, Flex and Warehouse
Source: CoStar Property® Source: CoStar Property®
Net QuotedPeriod # Bldgs Total RBA Vacant SF Vacancy % Absorption # Bldgs Total RBA # Bldgs Total RBA Rates2011 1q 476 15,520,652 1,763,919 11.4% 56,073 0 0 0 0 $8.18
2010 4q 476 15,520,652 1,819,992 11.7% 94,711 0 0 0 0 $8.45
2010 3q 476 15,520,652 1,914,703 12.3% (60,438) 0 0 0 0 $8.48
2010 2q 476 15,520,652 1,854,265 11.9% 20,240 0 0 0 0 $8.52
2010 1q 476 15,520,652 1,874,505 12.1% (2,562) 0 0 0 0 $8.55
2009 4q 476 15,520,652 1,871,943 12.1% 23,003 1 28,947 0 0 $8.71
2009 3q 475 15,491,705 1,865,999 12.0% (74,438) 2 140,716 1 28,947 $8.76
2009 2q 473 15,350,989 1,650,845 10.8% (910) 1 23,622 2 140,716 $8.70
2009 1q 472 15,327,367 1,626,313 10.6% (6,890) 1 8,064 3 164,338 $8.87
2008 4q 471 15,319,303 1,611,359 10.5% 140,548 4 116,360 4 172,402 $8.84
2008 3q 468 15,452,642 1,885,246 12.2% (115,352) 2 90,230 5 124,424 $8.69
2008 2q 466 15,362,412 1,679,664 10.9% 183,581 2 39,335 6 206,590 $8.73
2008 1q 464 15,323,077 1,823,910 11.9% 442,774 5 389,818 5 149,445 $8.72
2007 4q 459 14,933,259 1,876,866 12.6% 6,185 3 35,474 8 489,353 $8.56
2007 3q 456 14,897,785 1,847,577 12.4% 197,468 2 35,318 9 439,492 $8.61
2007 2q 454 14,862,467 2,009,727 13.5% 271,263 2 45,390 7 334,992 $8.34
Source: CoStar Property®
UC InventoryDelivered InventoryExisting Inventory Vacancy
(0.200)
(0.100)
0.000
0.100
0.200
0.300
0.400
0.500
2008 1q 2008 2q 2008 3q 2008 4q 2009 1q 2009 2q 2009 3q 2009 4q 2010 1q 2010 2q 2010 3q 2010 4q 2011 1q
Millio
ns
SF
9.5%
10.0%
10.5%
11.0%
11.5%
12.0%
12.5%
Perce
nt V
acant
Delivered SF Absorption SF Vacancy
$7.90
$8.00
$8.10
$8.20
$8.30
$8.40
$8.50
$8.60
2010 1q 2010 2q 2010 3q 2010 4q 2011 1q
Dollar
s/SF/Y
ear
1.60
1.65
1.70
1.75
1.80
1.85
1.90
1.95
2010 1q 2010 2q 2010 3q 2010 4q 2011 1q
Millio
ns
SF
Direct SF Sublet SF
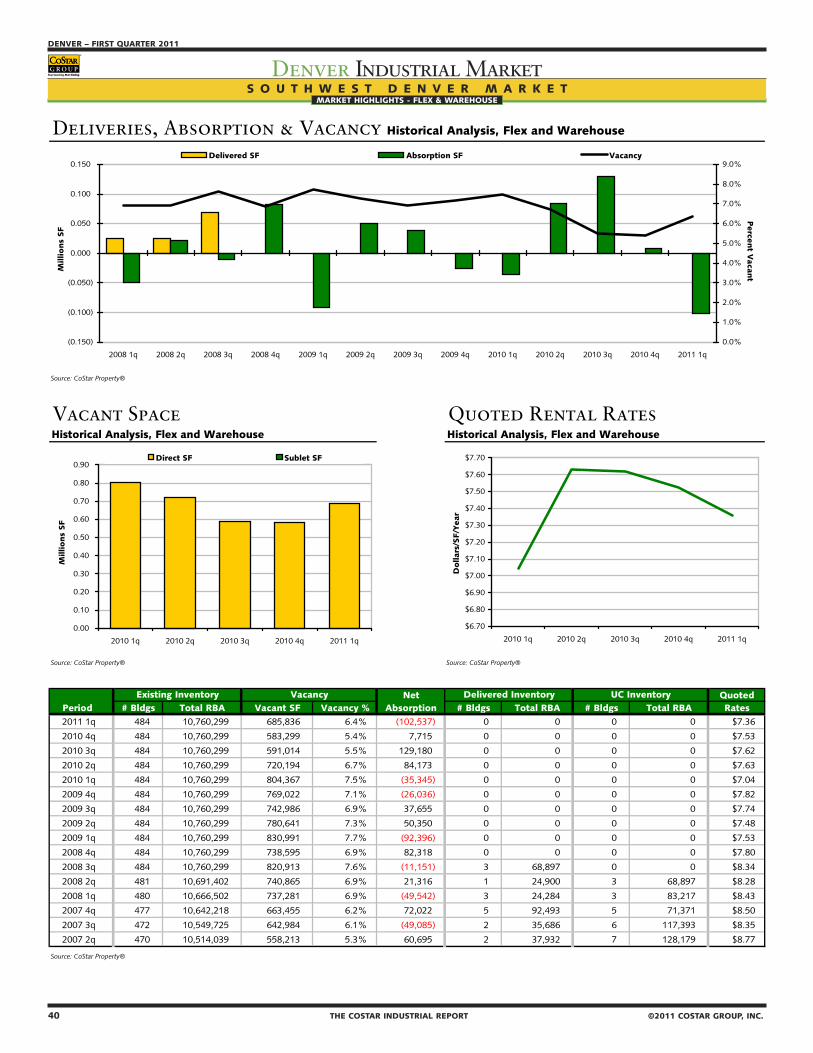
40 THE COSTAR INDUSTRIAL REPORT ©2011 COSTAR GROUP, INC.
DENVER – FIRST QUARTER 2011
Denver Industrial MarketMARKET HIGHLIGHTS - FLEX & WAREHOUSE
©2011 COSTAR GROUP, INC. THE COSTAR INDUSTRIAL REPORT 41
FIRST QUARTER 2011 – DENVER
Denver Industrial MarketMARKET HIGHLIGHTS - FLEX & WAREHOUSE
S O U T H W E S T D E N V E R M A R K E T
Deliveries, Absorption & Vacancy Historical Analysis, Flex and Warehouse
Source: CoStar Property®
Vacant Space Quoted Rental RatesHistorical Analysis, Flex and Warehouse Historical Analysis, Flex and Warehouse
Source: CoStar Property® Source: CoStar Property®
Net QuotedPeriod # Bldgs Total RBA Vacant SF Vacancy % Absorption # Bldgs Total RBA # Bldgs Total RBA Rates2011 1q 484 10,760,299 685,836 6.4% (102,537) 0 0 0 0 $7.36
2010 4q 484 10,760,299 583,299 5.4% 7,715 0 0 0 0 $7.53
2010 3q 484 10,760,299 591,014 5.5% 129,180 0 0 0 0 $7.62
2010 2q 484 10,760,299 720,194 6.7% 84,173 0 0 0 0 $7.63
2010 1q 484 10,760,299 804,367 7.5% (35,345) 0 0 0 0 $7.04
2009 4q 484 10,760,299 769,022 7.1% (26,036) 0 0 0 0 $7.82
2009 3q 484 10,760,299 742,986 6.9% 37,655 0 0 0 0 $7.74
2009 2q 484 10,760,299 780,641 7.3% 50,350 0 0 0 0 $7.48
2009 1q 484 10,760,299 830,991 7.7% (92,396) 0 0 0 0 $7.53
2008 4q 484 10,760,299 738,595 6.9% 82,318 0 0 0 0 $7.80
2008 3q 484 10,760,299 820,913 7.6% (11,151) 3 68,897 0 0 $8.34
2008 2q 481 10,691,402 740,865 6.9% 21,316 1 24,900 3 68,897 $8.28
2008 1q 480 10,666,502 737,281 6.9% (49,542) 3 24,284 3 83,217 $8.43
2007 4q 477 10,642,218 663,455 6.2% 72,022 5 92,493 5 71,371 $8.50
2007 3q 472 10,549,725 642,984 6.1% (49,085) 2 35,686 6 117,393 $8.35
2007 2q 470 10,514,039 558,213 5.3% 60,695 2 37,932 7 128,179 $8.77
Source: CoStar Property®
UC InventoryDelivered InventoryExisting Inventory Vacancy
(0.150)
(0.100)
(0.050)
0.000
0.050
0.100
0.150
2008 1q 2008 2q 2008 3q 2008 4q 2009 1q 2009 2q 2009 3q 2009 4q 2010 1q 2010 2q 2010 3q 2010 4q 2011 1q
Millio
ns
SF
0.0%
1.0%
2.0%
3.0%
4.0%
5.0%
6.0%
7.0%
8.0%
9.0%
Perce
nt V
acant
Delivered SF Absorption SF Vacancy
$6.70
$6.80
$6.90
$7.00
$7.10
$7.20
$7.30
$7.40
$7.50
$7.60
$7.70
2010 1q 2010 2q 2010 3q 2010 4q 2011 1q
Dollar
s/SF/Y
ear
0.00
0.10
0.20
0.30
0.40
0.50
0.60
0.70
0.80
0.90
2010 1q 2010 2q 2010 3q 2010 4q 2011 1q
Millio
ns
SF
Direct SF Sublet SF
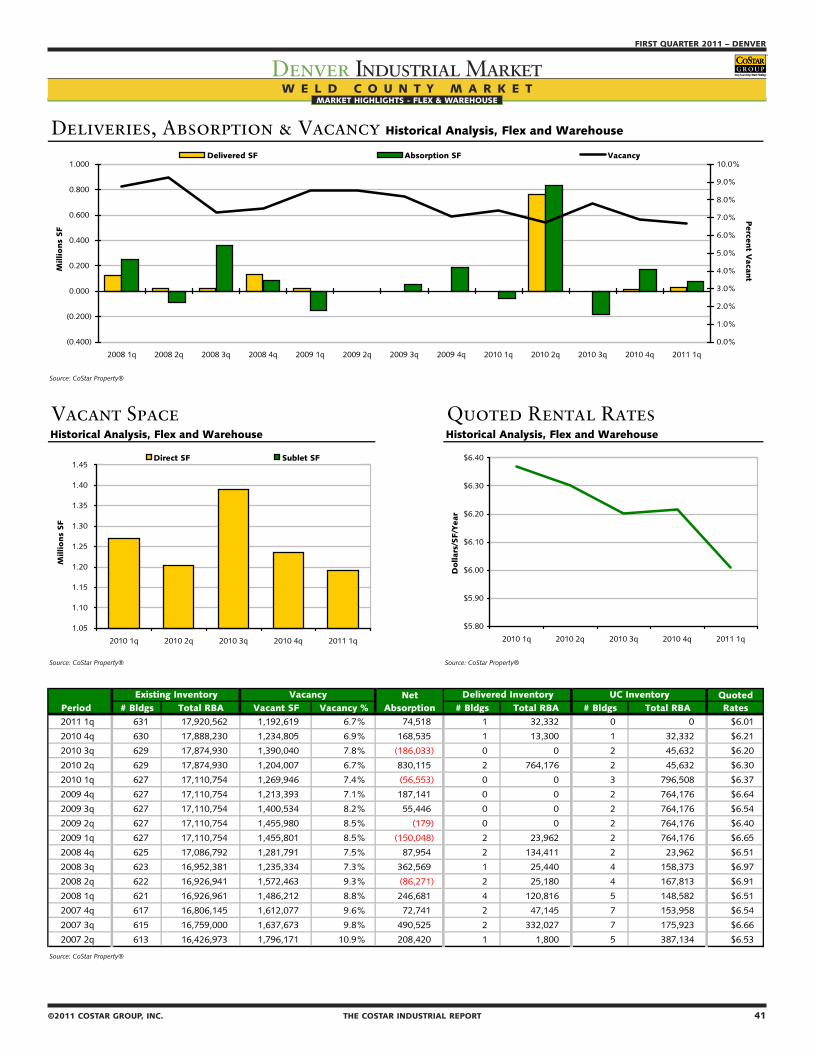
40 THE COSTAR INDUSTRIAL REPORT ©2011 COSTAR GROUP, INC.
DENVER – FIRST QUARTER 2011
Denver Industrial MarketMARKET HIGHLIGHTS - FLEX & WAREHOUSE
©2011 COSTAR GROUP, INC. THE COSTAR INDUSTRIAL REPORT 41
FIRST QUARTER 2011 – DENVER
Denver Industrial MarketMARKET HIGHLIGHTS - FLEX & WAREHOUSE
W E L D C O U N T Y M A R K E T
Deliveries, Absorption & Vacancy Historical Analysis, Flex and Warehouse
Source: CoStar Property®
Vacant Space Quoted Rental RatesHistorical Analysis, Flex and Warehouse Historical Analysis, Flex and Warehouse
Source: CoStar Property® Source: CoStar Property®
Net QuotedPeriod # Bldgs Total RBA Vacant SF Vacancy % Absorption # Bldgs Total RBA # Bldgs Total RBA Rates2011 1q 631 17,920,562 1,192,619 6.7% 74,518 1 32,332 0 0 $6.01
2010 4q 630 17,888,230 1,234,805 6.9% 168,535 1 13,300 1 32,332 $6.21
2010 3q 629 17,874,930 1,390,040 7.8% (186,033) 0 0 2 45,632 $6.20
2010 2q 629 17,874,930 1,204,007 6.7% 830,115 2 764,176 2 45,632 $6.30
2010 1q 627 17,110,754 1,269,946 7.4% (56,553) 0 0 3 796,508 $6.37
2009 4q 627 17,110,754 1,213,393 7.1% 187,141 0 0 2 764,176 $6.64
2009 3q 627 17,110,754 1,400,534 8.2% 55,446 0 0 2 764,176 $6.54
2009 2q 627 17,110,754 1,455,980 8.5% (179) 0 0 2 764,176 $6.40
2009 1q 627 17,110,754 1,455,801 8.5% (150,048) 2 23,962 2 764,176 $6.65
2008 4q 625 17,086,792 1,281,791 7.5% 87,954 2 134,411 2 23,962 $6.51
2008 3q 623 16,952,381 1,235,334 7.3% 362,569 1 25,440 4 158,373 $6.97
2008 2q 622 16,926,941 1,572,463 9.3% (86,271) 2 25,180 4 167,813 $6.91
2008 1q 621 16,926,961 1,486,212 8.8% 246,681 4 120,816 5 148,582 $6.51
2007 4q 617 16,806,145 1,612,077 9.6% 72,741 2 47,145 7 153,958 $6.54
2007 3q 615 16,759,000 1,637,673 9.8% 490,525 2 332,027 7 175,923 $6.66
2007 2q 613 16,426,973 1,796,171 10.9% 208,420 1 1,800 5 387,134 $6.53
Source: CoStar Property®
UC InventoryDelivered InventoryExisting Inventory Vacancy
(0.400)
(0.200)
0.000
0.200
0.400
0.600
0.800
1.000
2008 1q 2008 2q 2008 3q 2008 4q 2009 1q 2009 2q 2009 3q 2009 4q 2010 1q 2010 2q 2010 3q 2010 4q 2011 1q
Millio
ns
SF
0.0%
1.0%
2.0%
3.0%
4.0%
5.0%
6.0%
7.0%
8.0%
9.0%
10.0%
Perce
nt V
acant
Delivered SF Absorption SF Vacancy
$5.80
$5.90
$6.00
$6.10
$6.20
$6.30
$6.40
2010 1q 2010 2q 2010 3q 2010 4q 2011 1q
Dollar
s/SF/Y
ear
1.05
1.10
1.15
1.20
1.25
1.30
1.35
1.40
1.45
2010 1q 2010 2q 2010 3q 2010 4q 2011 1q
Millio
ns
SF
Direct SF Sublet SF
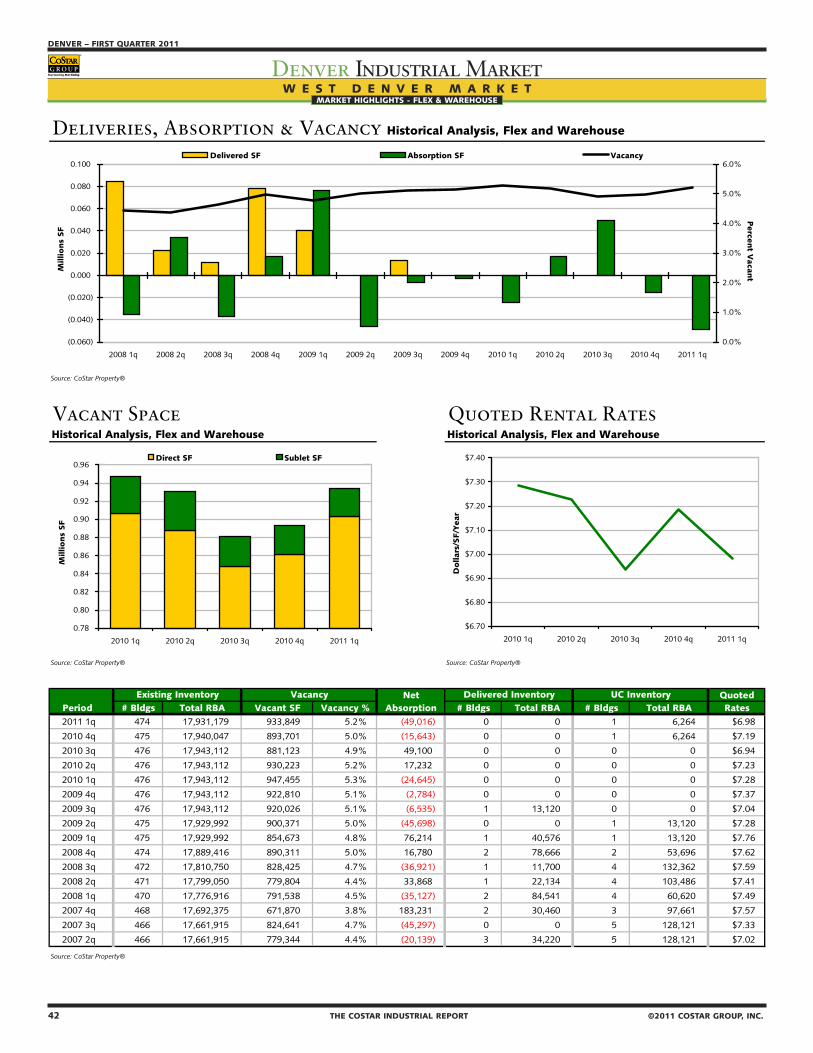
42 THE COSTAR INDUSTRIAL REPORT ©2011 COSTAR GROUP, INC.
DENVER – FIRST QUARTER 2011
Denver Industrial MarketMARKET HIGHLIGHTS - FLEX & WAREHOUSE
W E S T D E N V E R M A R K E T
Deliveries, Absorption & Vacancy Historical Analysis, Flex and Warehouse
Source: CoStar Property®
Vacant Space Quoted Rental RatesHistorical Analysis, Flex and Warehouse Historical Analysis, Flex and Warehouse
Source: CoStar Property® Source: CoStar Property®
Net QuotedPeriod # Bldgs Total RBA Vacant SF Vacancy % Absorption # Bldgs Total RBA # Bldgs Total RBA Rates2011 1q 474 17,931,179 933,849 5.2% (49,016) 0 0 1 6,264 $6.98
2010 4q 475 17,940,047 893,701 5.0% (15,643) 0 0 1 6,264 $7.19
2010 3q 476 17,943,112 881,123 4.9% 49,100 0 0 0 0 $6.94
2010 2q 476 17,943,112 930,223 5.2% 17,232 0 0 0 0 $7.23
2010 1q 476 17,943,112 947,455 5.3% (24,645) 0 0 0 0 $7.28
2009 4q 476 17,943,112 922,810 5.1% (2,784) 0 0 0 0 $7.37
2009 3q 476 17,943,112 920,026 5.1% (6,535) 1 13,120 0 0 $7.04
2009 2q 475 17,929,992 900,371 5.0% (45,698) 0 0 1 13,120 $7.28
2009 1q 475 17,929,992 854,673 4.8% 76,214 1 40,576 1 13,120 $7.76
2008 4q 474 17,889,416 890,311 5.0% 16,780 2 78,666 2 53,696 $7.62
2008 3q 472 17,810,750 828,425 4.7% (36,921) 1 11,700 4 132,362 $7.59
2008 2q 471 17,799,050 779,804 4.4% 33,868 1 22,134 4 103,486 $7.41
2008 1q 470 17,776,916 791,538 4.5% (35,127) 2 84,541 4 60,620 $7.49
2007 4q 468 17,692,375 671,870 3.8% 183,231 2 30,460 3 97,661 $7.57
2007 3q 466 17,661,915 824,641 4.7% (45,297) 0 0 5 128,121 $7.33
2007 2q 466 17,661,915 779,344 4.4% (20,139) 3 34,220 5 128,121 $7.02
Source: CoStar Property®
UC InventoryDelivered InventoryExisting Inventory Vacancy
(0.060)
(0.040)
(0.020)
0.000
0.020
0.040
0.060
0.080
0.100
2008 1q 2008 2q 2008 3q 2008 4q 2009 1q 2009 2q 2009 3q 2009 4q 2010 1q 2010 2q 2010 3q 2010 4q 2011 1q
Millio
ns
SF
0.0%
1.0%
2.0%
3.0%
4.0%
5.0%
6.0%
Perce
nt V
acant
Delivered SF Absorption SF Vacancy
$6.70
$6.80
$6.90
$7.00
$7.10
$7.20
$7.30
$7.40
2010 1q 2010 2q 2010 3q 2010 4q 2011 1q
Dollar
s/SF/Y
ear
0.78
0.80
0.82
0.84
0.86
0.88
0.90
0.92
0.94
0.96
2010 1q 2010 2q 2010 3q 2010 4q 2011 1q
Millio
ns
SF
Direct SF Sublet SF