Embed Size (px)
Citation preview
Six Sigma Overview
October 13, 2003Don CarlsonTechnology & OperationsEnterprise Solutions
• What is Six Sigma?• Why Six Sigma?• Why Six Sigma at Bank of America?• Connection to Strategy.
Agenda
• Metric• Benchmark• Vision• Philosophy• Method• Tool• Symbol• Goal• Value
The Many Facets of Six Sigma
• Six Sigma Was Developed at Motorola in the 1980’s As a Method to Improve Process Quality.
• It Was First Used to Improve Manufacturing Process Capability and Then Migrated to Business Processes Capability
• Companies That Have Deployed Six Sigma: Bank of America, Motorola, GE, IBM, Kodak and Many More
• The Basic Premise Is, All Processes Have Variation. Variation Is the Enemy.
More About Six Sigma
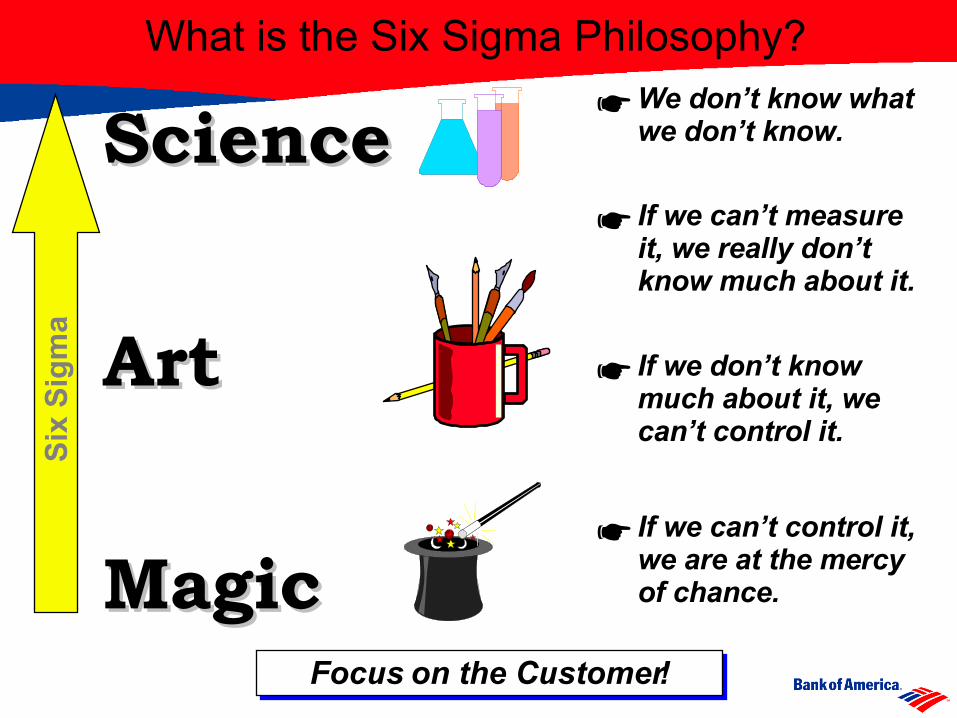
SSciencecience
AArtrt
MMagicagic
Six
Sig
ma
☛ We don’t know what we don’t know.
☛ If we can’t measure it, we really don’t know much about it.
☛ If we don’t know much about it, we can’t control it.
☛ If we can’t control it, we are at the mercy of chance.
What is the Six Sigma Philosophy?
Focus on the Customer!
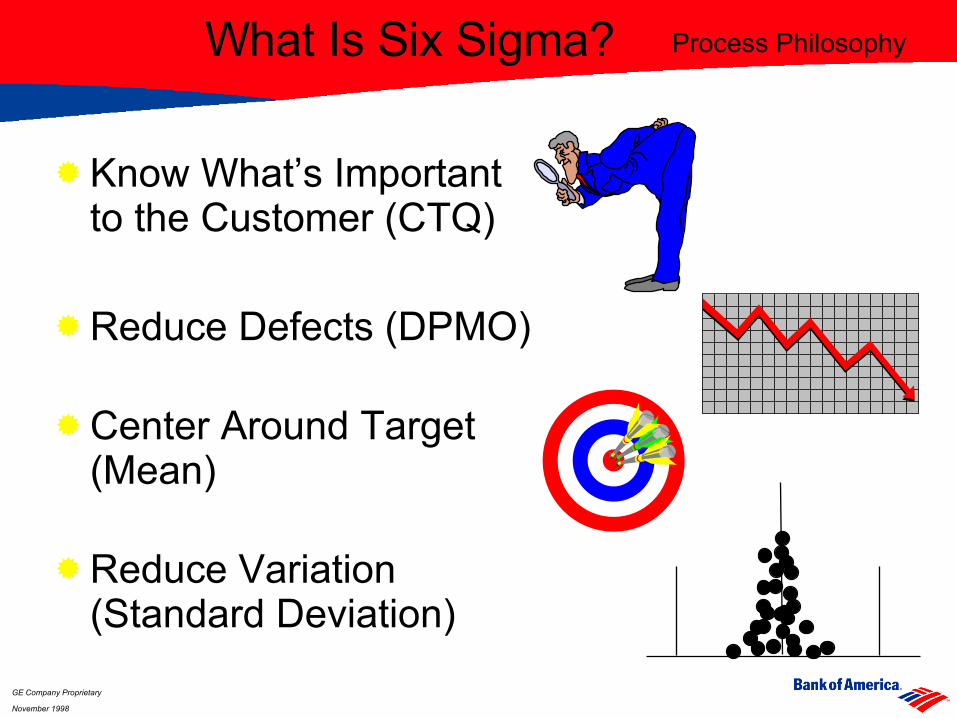
Process Philosophy
Know What’s Importantto the Customer (CTQ)
Reduce Defects (DPMO)
Center Around Target (Mean)
Reduce Variation (Standard Deviation)
?
GE Company Proprietary
November 1998
What Is Six Sigma?
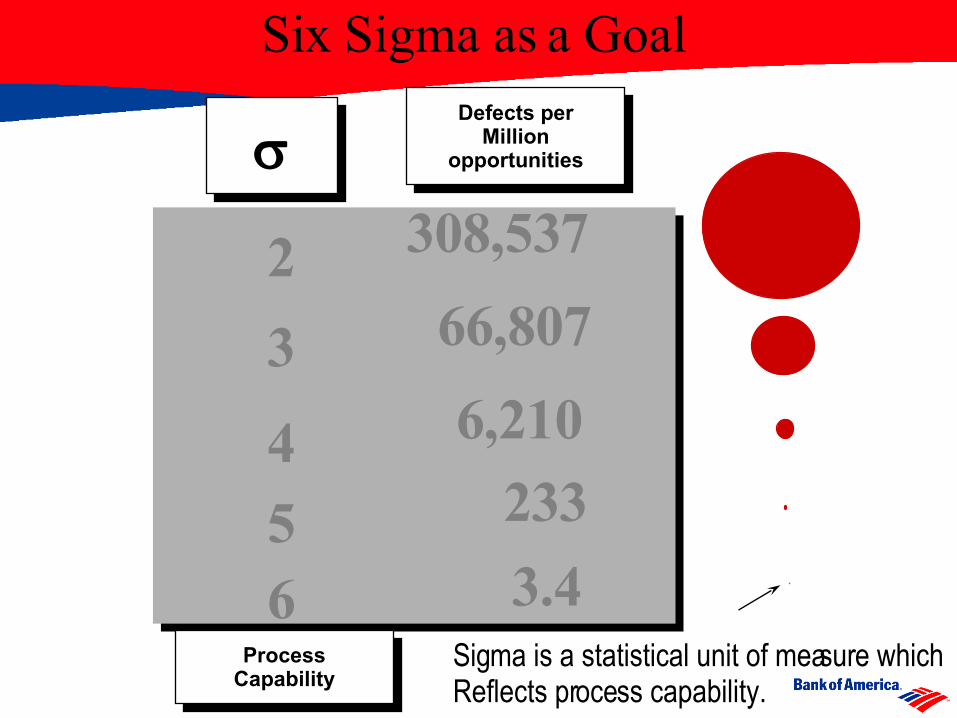
2
3
4
56
308,537
66,807
6,210
Defects per
Million opportunities
233
3.4 .
ProcessCapability
Sigma is a statistical unit of measure whichReflects process capability.
Six Sigma as a Goal
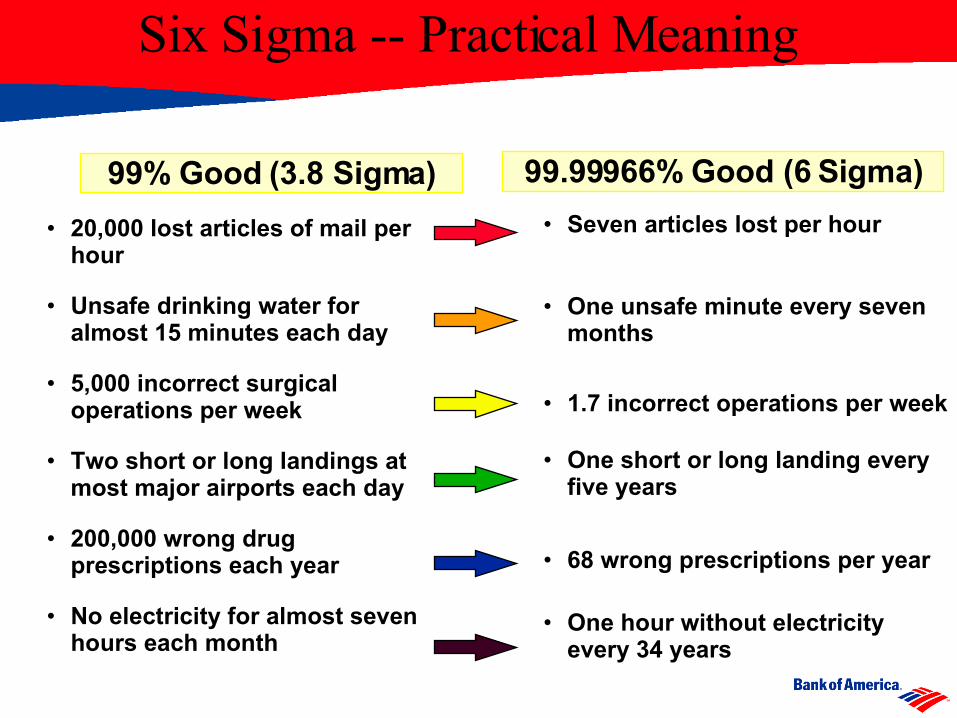
99.99966% Good (6 Sigma)
• 20,000 lost articles of mail per hour
• Unsafe drinking water for almost 15 minutes each day
• 5,000 incorrect surgical operations per week
• Two short or long landings at most major airports each day
• 200,000 wrong drug prescriptions each year
• No electricity for almost seven hours each month
• Seven articles lost per hour
• One unsafe minute every seven months
• 1.7 incorrect operations per week
• One short or long landing every five years
• 68 wrong prescriptions per year
• One hour without electricity every 34 years
99% Good (3.8 Sigma)
Six Sigma -- Practical Meaning
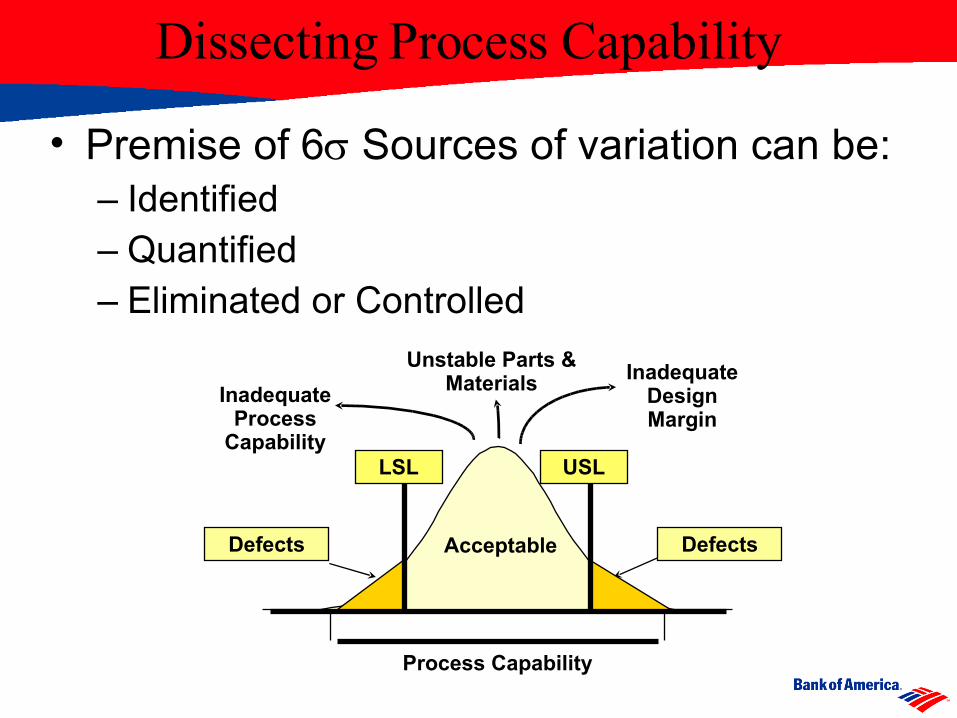
Dissecting Process Capability
Defects
Process Capability
Inadequate Design Margin
Inadequate Process
Capability
Unstable Parts & Materials
Defects Acceptable
• Premise of 6 Sources of variation can be:– Identified– Quantified– Eliminated or Controlled
LSL USL
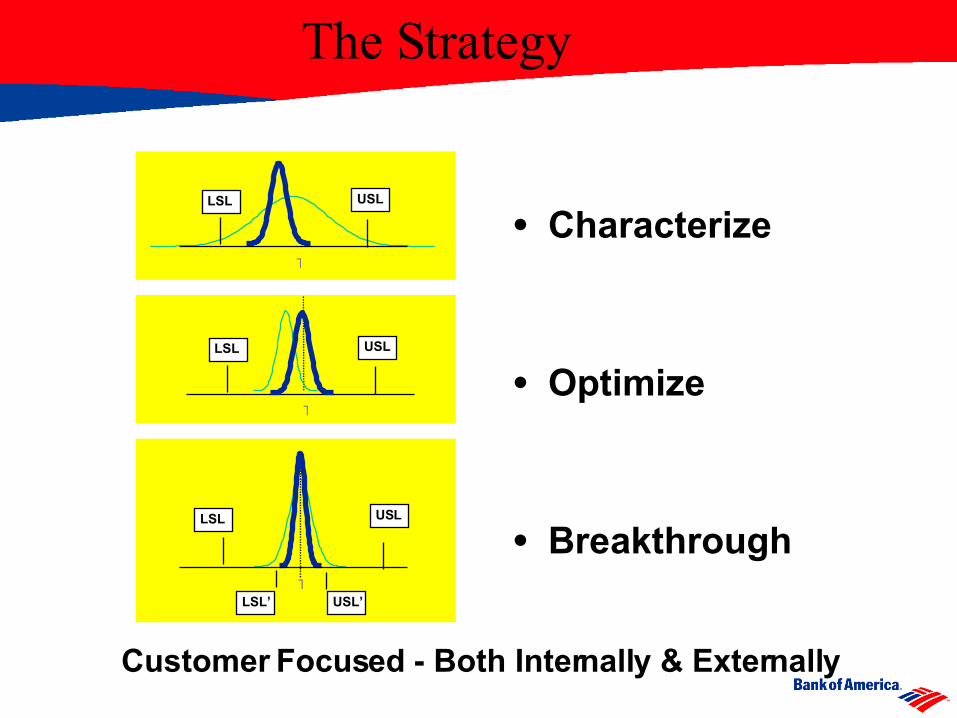
• Characterize
• Optimize
• Breakthrough
USL
T
LSL
USL
T
LSL
T
USLLSL
USL’LSL’
The Strategy
Customer Focused - Both Internally & Externally
• What is Six Sigma?• Why Six Sigma?• Why Six Sigma at Bank of America?• Connection to Strategy.
Agenda
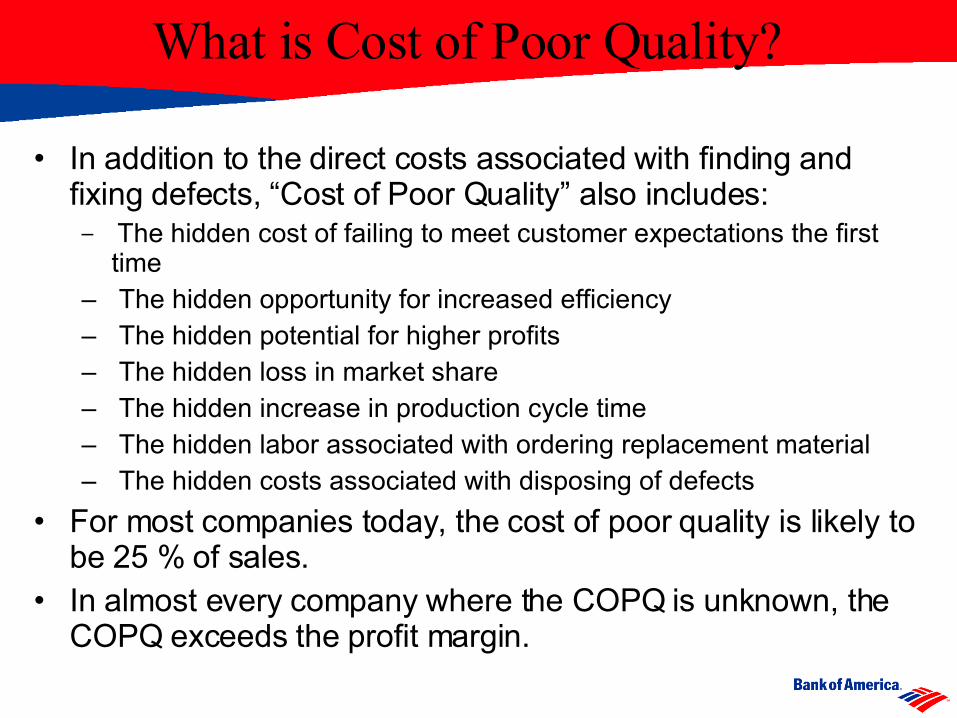
What is Cost of Poor Quality?
• In addition to the direct costs associated with finding and fixing defects, “Cost of Poor Quality” also includes:
– The hidden cost of failing to meet customer expectations the first time
– The hidden opportunity for increased efficiency– The hidden potential for higher profits– The hidden loss in market share– The hidden increase in production cycle time– The hidden labor associated with ordering replacement material– The hidden costs associated with disposing of defects
• For most companies today, the cost of poor quality is likely to be 25 % of sales.
• In almost every company where the COPQ is unknown, the COPQ exceeds the profit margin.
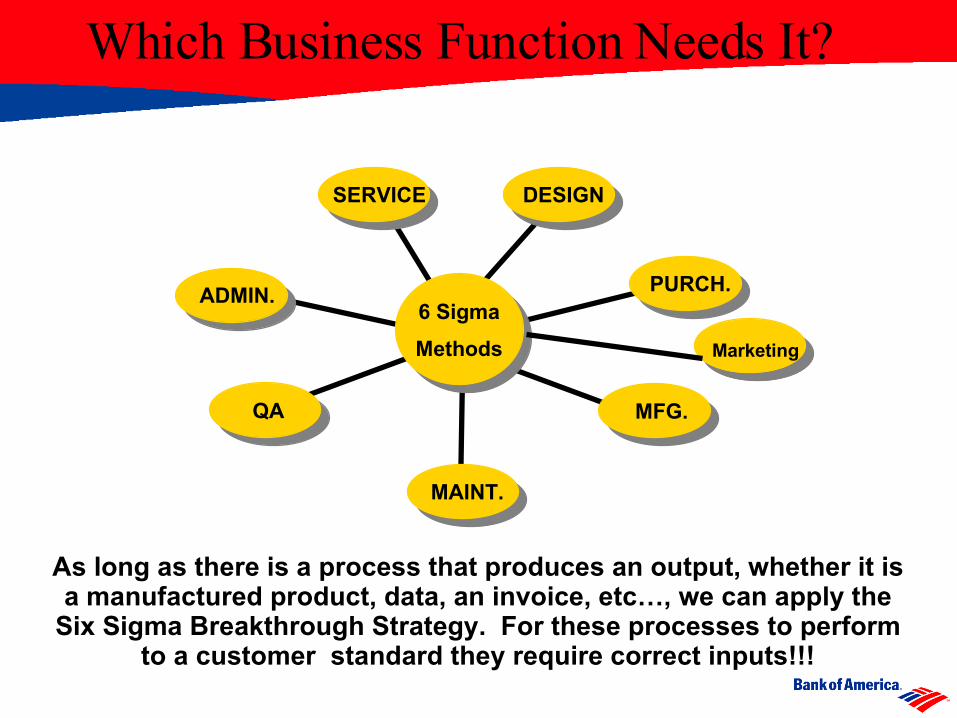
Which Business Function Needs It?
As long as there is a process that produces an output, whether it isa manufactured product, data, an invoice, etc…, we can apply the
Six Sigma Breakthrough Strategy. For these processes to perform to a customer standard they require correct inputs!!!
6 Sigma
Methods
MFG.
DESIGNSERVICE
PURCH.
MAINT.
ADMIN.
QA
Marketing
Why Six Sigma?
“Six Sigma will enable Bank of America to make the breakthrough improvements in customer satisfaction and shareholder value that we must achieve to reach our goal of becoming one of the world’s most admired companies. That’s why I’m committed to using it as a performance management discipline throughout our company.”
Ken Lewis, Chairman and Chief Executive Officer Bank of America
Ken Lewis’ “Vision”
• What is Six Sigma?• Why Six Sigma?• Why Six Sigma at Bank of America?• Connection to Strategy.
Agenda
Priori tization & Root Cause Counter Measures & Activi ties Who When Process C apabilityExpected
Benefits/ImpactTarget Achieved?/Impact
1. Value for Money1. De clining market perception compared to c ompetit io n. 1. Increase customer percept io n of val ue p rovided CI, KPRO, EI , HI thru
2. Inadequate ma rgins, di scounts, profitabili ty, p romotions, as perceived by customers/channel partners
2. Of fer simpli fie d/compet iti ve price/payment p la ns CI, KPRO,EI, DI
3. Of fer different iated le ad ership products KPRO,D&AI,CI 12 pp.4. Improve effectiveness of promotions, advertising CI,DI
5. Improve operat in g co sts and e ffi ciencies C&GS 2000
2. Customer Service/Technical Support1. Proce ss no t cu stomer-focused 1. Re-s tructure/re-en gineer org. t o meet needs; customer focused integrated process improvements KPRO,D&AI,DI,HI thru
2. Lack of c los ed loop process to correct customer problems 2. Additional technical support HI,D&AI,GCSS3. Un sat isfa ctory resp onse time, problem resolution 3. Custo mer esca la tion process; problem resolution; technical training EI 2000
3. Product Performance1. Prod ucts/serv ice s do not p erform to VOC re quirements 1. Improve product pe rformance and re li ab il ity; drive to six sig ma quality stand ards CI,KPRO, C&GS,D&AI,
DI,EIon-goi ng
2. Prod uct /servi ce performance monitori ng vs. VOC does not o ccur 2. Insti tute post-launch monitoring fo r all majo r product introductions CI,KPRO thru 2000
3. Prod ucts/serv ice s performance are not ea sy to u se 3. Focus on ease of use aspects for product desig n D&AI ,CI on-goi ng
4. Sales/Marketing Support1. Insuffici en t business growth sup po rt 1. Redesign/r estructure SF, training, tar get key, cus to mer relationship management CI,EI,KPRO, DI,HI, thru
2. Inadequate contact- new product/program info rmation, merchandising, IM
2. Expand alternative vehicles of delivery CI,HI, KPRO 10 p p
3. Insuffici en t kn owle dge: Bus.-Tech. 3. Custo mer training EI
4. Custo mer communi cations DI, EI,C&GS 2000
5. Ease of Doing Business1. Cu ts a cross p erformance areas (Sales, O&D, Bil ling & Credit , Cust.
Svc., Te ch. S upport)
1. Improve supply chain management (see ISC MBF for details) All BU's (&Regions) thru US&CR order transaction
surveys show ~9pp improvement ( 1Q00)
2. Un responsive , lack of follow-through , functional sil os wi th limited
scop e
2. Responsibility/acco untability, T raining, Communica tion s DI,CI,EI,GCSS
3. Un sat isfa ctory problem resolution 3. Re-engineer, re -structure organiza ti on to me et customer needs CI,KPRO,US&CR, EAM ER
11 p p
4. Simplify/imp rove processes, incl ud e problem resolut ion, contracts, accounts manage ment HI,DI,US&CR,EAME R,G
CSS
2000
6. Product Availabili ty1. No n-integrated sup pl y chain resul ts in sub-op ti mal o rder/delivery 1. See ISC MBF for de ta il s All BU's thru 20 00
PROBLEM STATEMENT: Kodak's aggregate corporate cust omer satisfact ion is at 76 %, which is lower than world cla ss benchmarks of 90%+. This gap of 15-20 pp represents a $1B-2B revenue opportunity for the company.
Benchmark: 90%+
72%69%
0%
50%
100%
YE 99 1Q00 2Q00 3Q00 4Q00
% S
ati
sfa
cti
on81.0%
0%
50%
100%
YE99 1Q00 2Q00 3Q00 4Q00
% S
ati
sfa
cti
on
NotPlanned
Overall Customer Satisfac tion (Key Drivers )
0%
25%
50%
75%
100%
Value
/Pric
e
Cust
.S
vc./
Tec
h.Su
pp.
Prod
. P
erf.
Sale
s/M
ktg.
Supp
.
Eas
e Do
ingB
us.
Prod
. A
vail
(O&D
)
Per
cent
of
BU
's
78%
0%
50%
100%
YE99 1Q00 2Q00 3Q 00 4Q00
% S
ati
sfa
cti
on
NotPlanned
Overall Product Quality/Per f. Overall Service QualityOverall Customer SatisfactionW t. 0 .50 W t. 0.25
Customer Satisfaction Benchmark
69% 68%
76% 77%
50%
60%
70%
80%
90%
100%
EK 97* E K 98* EK 99** EK 1Q00
Per
cen
t S
atis
fact
ion
*O ld M etr ic : O ve ra l l C us to m er S a t
* *Ne w M etr ic: Cus to m er S a tis fa cti on S c ore
Opportunity Ga p
Wt. 0.25
Benchmark Benchma rk Benchmark
79.7%71.3% 65.1%
93.2%
64.6% 70.4%81.6% 76.5%80.0%
71.8%65.5%
93.2%
64.9% 70.4%82.5% 76.9%
0%
50%
100%
CI HI KPRO EI DI D&AI C&GS EK Overal l
% S
ati
sfa
ctio
n
YE99 1Q00Improvement
No rdst rom, Lexus 92%
BMW Mercedes 86%Co ke 84%
Customer Satisfaction Score
Customer Segment MBF
Priori tization & Root Cause Counter Measures & Activities Who When Process C apabilityExp ected
Benef its/ImpactTarget Ach ieved?/Impact
1. Value for Money1. De clining ma rket perception compared to competitio n. 1. In crease custo mer perceptio n of value provided CI, KPR O, EI, HI thru
2. In adequate ma rgins, discounts, profi tabi li ty, p romotions, a s perceived by customers/channel p artn ers
2. Off er simplified/competit ive price/payment p lans CI, KPR O,EI , DI
3. Off er diffe rentiated le adership products KPRO,D&AI,CI 12 p p.4. Improve e ffe ctive ness o f p romo ti ons, a dvertising CI,D I
5. Improve o perating costs and e fficiencies C&GS 2000
2. Cus tomer Service/Technical Support1. Process no t cu sto mer-fo cused 1. Re-s tructure /re-engineer org. to meet needs; cus to mer focused i ntegrated process i mprovements KPRO,D&AI,DI ,H I thru
2. Lack of c losed loop process to correct customer problems 2. Addit ional te chnica l su pport HI,D &AI,GCSS3. Un satisfa cto ry response time, pr oblem resolution 3. Customer escala tion process; problem resolu tion; te chnica l tr ain ing EI 2000
3. Product Performance1. Products/serv ices d o not p erfo rm to VOC re quirements 1. Improve p roduct performance a nd reliability; drive to s ix sigma quality standard s CI,KPR O, C&GS,D&AI,
DI,EIo n-going
2. Product/service performance mo ni toring vs. VO C does not o ccur 2. In sti tute post- la unch monitoring for al l major product in t roductions CI,KPR O th ru 2000
3. Products/serv ices p erfo rmance are n ot easy to u se 3. Fo cus on ease of use aspects fo r product desig n D&AI ,CI o n-going
4. Sales/Mar keting S uppor t1. In sufficient b usiness growth support 1. Redesign/r estructure SF, training, target key, cus to mer relationship management CI,EI, KPRO, DI,HI , thru
2. In adequate contact- new product/program info rmation, merch andising, IM
2. Expand al ternative vehic les of de livery CI,H I, KPRO 10 p p
3. In sufficient kn ow le dge: Bu s.-Te ch. 3. Customer training EI
4. Customer communications DI, EI ,C &GS 2000
5. Ease of Doing Business1. Cu ts a cross performance a reas (Sales, O&D, Bil li ng & Credi t, Cu st.
Svc., Te ch. Support)
1. Improve su pply ch ain management (se e ISC MBF fo r deta ils) Al l BU 's (&Re gions) thru US&CR order transact io n
su rveys sh ow ~9pp improvement ( 1Q00)
2. Un responsive , lack of fol low-through, fu nctio nal silos with li mited
scope
2. Responsib ility/accounta bi li ty, Training, C ommunica tions DI,C I,EI ,GCSS
3. Un satisfa cto ry problem resolut ion 3. Re-engineer, re-structure organiza tion to meet customer needs CI,KPR O,U S&CR,
EAM ER
11 p p
4. Simpl if y/improve processes, i nclude pro blem resolu tion, co ntracts, acc ounts management HI,D I,US&CR ,EAME R,G
CSS
2000
6. Product Availabili ty1. No n-integrated supply chain results i n sub-optimal o rder/delivery 1. See ISC MBF for de ta il s Al l BU 's thru 2000
PROBLEM STATEMENT: Kodak's aggregate corporate customer satisfaction is a t 76 %, which is low er than w orld cla ss benchmarks of 90%+. This gap of 15-20 pp represents a $1B-2B revenue opportunity for the company.
Benchmark: 90%+
72%69%
0%
50%
100%
YE99 1Q00 2Q00 3Q00 4Q00
% S
ati
sfa
cti
on
81.0%
0%
50%
100%
YE99 1Q00 2Q00 3Q00 4Q00
% S
ati
sfa
cti
on
NotPlanned
Overall C us tome r Satis faction (Ke y Drivers )
0%
25%
50%
75%
100%
Value
/Pric
e
Cust
.S
vc./
Tec
h.Su
pp.
Pro
d. P
erf.
Sale
s/M
ktg.
Supp
.
Eas
e Do
ingB
us.
Prod
. A
vail
(O&
D)
Per
cent
of
BU
's
78%
0%
50%
100%
YE99 1Q00 2Q00 3Q00 4Q00
% S
ati
sfa
cti
on
NotPlanned
Overall Product Quality/Per f. Overall Service QualityOverall Customer SatisfactionW t. 0.50 W t. 0.25
Customer Satisfa ction Benchm ark
6 9% 68%
76% 77%
50%
60%
70%
80%
90%
100%
EK 97* E K 98* EK 99** E K 1Q00
Per
cen
t S
atis
fact
ion
*O ld M etr ic: O ve ra ll C us to m er Sa t
**N e w M e tr ic: Cu sto m er Sa tis fa cti on Sc or e
Opportunity Ga p
Wt. 0.25
Benchmark Benchmark Benchmark
79.7%71.3% 65.1%
93.2 %
64. 6% 70.4 %81.6% 76. 5%80. 0%
71.8%65.5%
93.2%
64.9 % 70.4 %82 .5% 76. 9%
0 %
50 %
100 %
CI HI KPRO EI DI D&AI C&G S E K Overall
% S
ati
sfa
cti
on
YE99 1Q00Improvement
Nordstrom, Lexus 9 2%
BMW Mercedes 86%Coke 84%
Customer Satisfact ion Score
Deposits Golden Thread MBF
Green Belt Project Application Problem Definition (What is the Defect? What is the magnitude of the defect? What is the improvement goal (at least 50% improvement) and timeframe for this project?):
Primary Metric (measure of defect): Secondary Metric (counterbalancing measure):
What will be the impact of the improvement from a customer’s standpoint? What is the expected savings or revenue increase? High Level Process Map and Multilevel Pareto are attached. _______ Financial Director Signature: _____________________________________________________________ Date: (Agrees that the potential financial benefits can be achieved and measured) Customer Segment Leader Signature_______________________________________________________ Date: Champion’s Signature: __________________________________________________________________ Date: Complete after project is approved for class enrollment Name of Green Belt Candidate: Project Team Members:
Green Belt Project
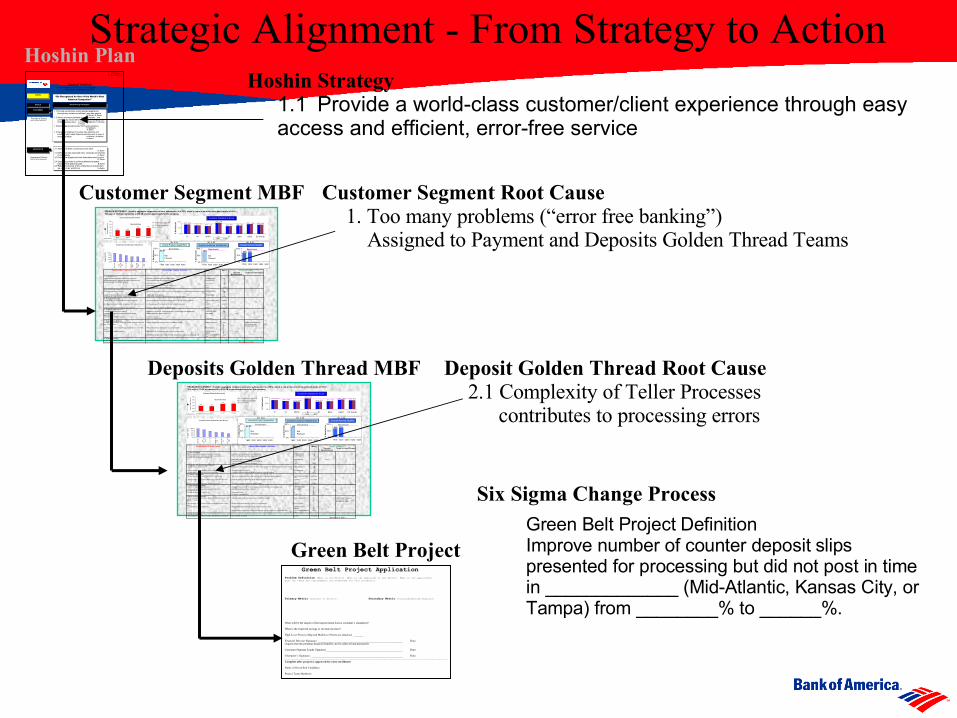
Customer Segment Root Cause1. Too many problems (“error free banking”) Assigned to Payment and Deposits Golden Thread Teams
Deposit Golden Thread Root Cause2.1 Complexity of Teller Processes
contributes to processing errors
Green Belt Project Definition Improve number of counter deposit slips presented for processing but did not post in time in _____________ (Mid-Atlantic, Kansas City, or Tampa) from ________% to ______%.
Strategic Alignment - From Strategy to Action
Bank of America
Ken Lewis, Chairman and CEO
1.1 Provide a world-class customer/client experience through easy access and efficient, error-free service
C. Goslee / B. Desoer
1.2 Attract and retain profitable customers/clients…and continuously reward them for keeping and bringing more of their business to us G. Taylor / R. DeMartini / A. Brinkley
E. Brown
1.3 Become the trusted advisor for financial solutions R. DeMartini E. Brown
1.4 Develop and deliver innovative new products and solutions which make financial services work in ways it never has before A. Brinkley / B. Desoer
E. Brown
“Be Recognized As One of the World’s Most Admired Companies”
VISION
Breakthrough Strategies GOALS
ASSOCIATE
Provider of Choice 92% Customer Satisfaction
Employer of Choice 90% Associate Satisfaction
2nd Draft
CUSTOMER
2.1 Attract and retain a world-class work force S. Alphin
2.2 Define and align Associate roles, measures and rewards to our strategy S. Alphin
2.3 Provide the support and tools Associates need to excel B. Desoer
2.4 Enable Associates to achieve professional growth balanced with personal goals B. Desoer
2.5 Reflect the diversity of the communities and customers we serve in our work force S. Alphin
Hoshin PlanHoshin Strategy
1.1 Provide a world-class customer/client experience through easy access and efficient, error-free service
Six Sigma Change Process
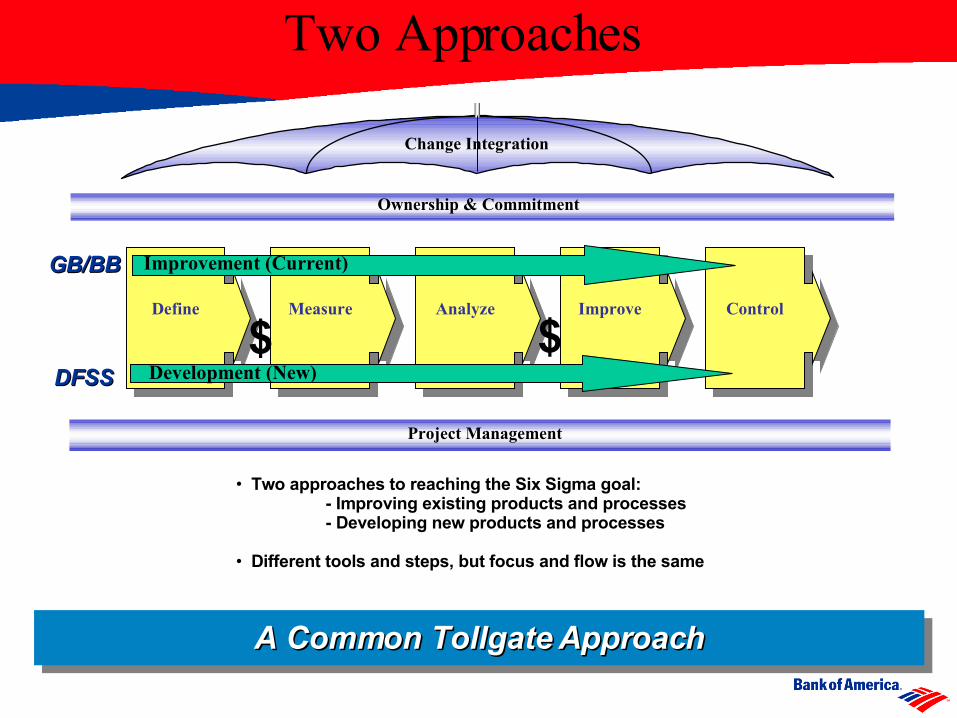
A Common Tollgate ApproachA Common Tollgate Approach
Project Management
Ownership & Commitment
Change Integration
Define Measure Analyze Improve Control
Improvement (Current)
Development (New)
• Two approaches to reaching the Six Sigma goal: - Improving existing products and processes- Developing new products and processes
• Different tools and steps, but focus and flow is the same
DFSSDFSS
$ $
GB/BBGB/BB
Two Approaches
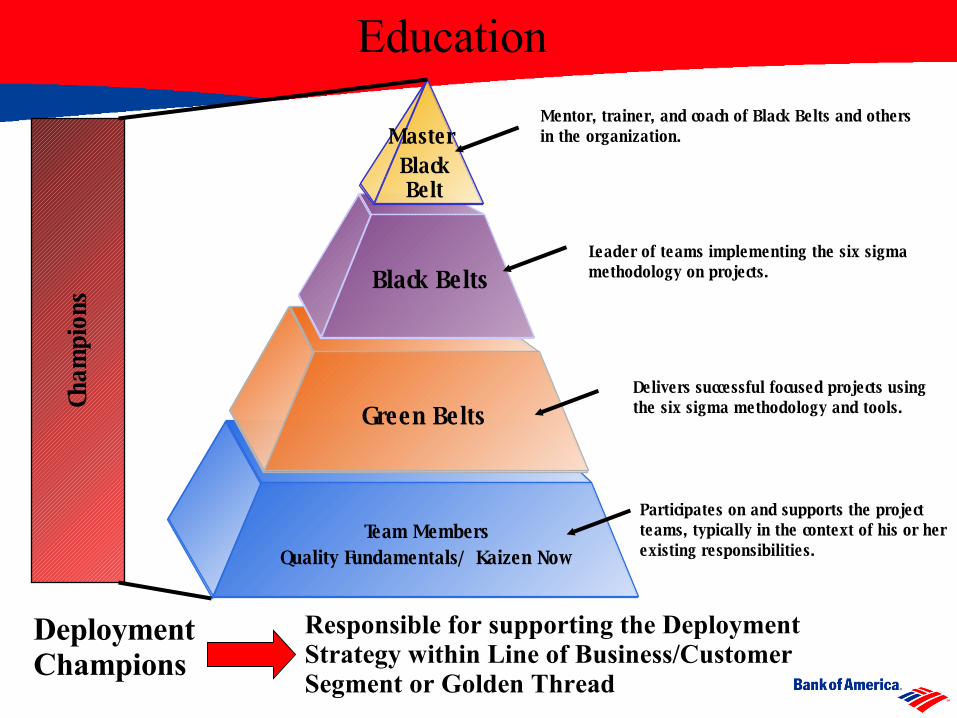
Master Black Belt
Black Belts
Green Belts
Team MembersQuality Fundamentals/ Kaizen Now
Cham
pion
s
Mentor, trainer, and coach of Black Belts and others in the organization.
Leader of teams implementing the six sigma methodology on projects.
Delivers successful focused projects using the six sigma methodology and tools.
Participates on and supports the project teams, typically in the context of his or her existing responsibilities.
Responsible for supporting the Deployment Strategy within Line of Business/Customer Segment or Golden Thread
DeploymentChampions
Education
• Leadership Commitment, Competence, & Involvement
• Methodology & Tools• Data Driven• Statistically Validated
• Best People 100% Dedicated to Defect Reduction
• Project Focused• Aligned to Strategic Goals (Hoshin, MBF)• High ROI Expectations
What Makes Six Sigma Different?
Six Sigma & Leadership
Six Sigma only works when Leadership is passionate about excellence and willing to change. • Fundamentals of Leadership
– Challenge the process– Inspire a shared vision– Enable others to act– Model the way– Encourage the heart
• Six Sigma is a catalyst for leaders
Bank of America Executive Officer team
• Ken Lewis – certified Green Belt
• Jim Hance – certified Green Belt
• Amy Brinkley – certified Green Belt
• Ed Brown – certified Green Belt
• Rich DeMartini – certified Green Belt
• Barbara Desoer – certified Green Belt
• Gene Taylor – certified Green Belt
The Bank of America executive officer team are all certified Green Belts
Executive Commitment
“Sustaining the intensity of our Six Sigma work is critical for Bank of America to
achieve its strategic goals. Six Sigma has enabled us to generate more
than $300MM in first-year productivity gains for the company. It
has also had a significant impact upon the leadership team with our personal
education and certification as Six Sigma Green Belts. As we look to the future, our
leadership charge is to keep Six Sigma a top priority and use it to produce organic
customer revenue growth.”
Ken Lewis (10/9/02)
Results

Questions?