Embed Size (px)
Citation preview

Report on the Economic Well-Beingof U.S. Households in 2014
May 2015
BOARD OF GOVERNOR S O F THE F EDERAL R E S ERV E SY S T EM

Report on the Economic Well-Beingof U.S. Households in 2014
May 2015
BOARD OF GOVERNOR S O F THE F EDERAL R E S ERV E SY S T EM

This and other Federal Reserve Board reports and publications are available online at
www.federalreserve.gov/publications/default.htm.
To order copies of Federal Reserve Board publications offered in print,
see the Board’s Publication Order Form (www.federalreserve.gov/pubs/orderform.pdf)
or contact:
Publications Fulfillment
Mail Stop N-127
Board of Governors of the Federal Reserve System
Washington, DC 20551
(ph) 202-452-3245
(fax) 202-728-5886
(e-mail) [email protected]
Preface
This survey and report were prepared by the Con-
sumer and Community Development Research Sec-
tion of the Federal Reserve Board’s Division of Con-
sumer and Community Affairs (DCCA).
DCCA directs consumer- and community-related
functions performed by the Board, including con-
ducting research on financial services policies and
practices and their implications for consumer finan-
cial stability, community development, and neighbor-
hood stabilization.
DCCA staff members Jeff Larrimore, Mario Arthur-
Bentil, Sam Dodini, and Logan Thomas prepared
this report. Federal Reserve staff members Eric Bel-
sky, Anna Alvarez Boyd, Andrea Brachtesende, Alex-
andra Brown, David Buchholz, Angelyque Campbell,
Lisa Dettling, Allen Fishbein, Daniel Gorin, Arturo
Gonzalez, Joanne Hsu, Geng Li, Barbara Lipman,
Alejandra Lopez-Fernandini, Ellen Merry, Barbara
Robles, John Sabelhaus, Maximilian Schmeiser,
Jenny Schuetz, and PJ Tabit provided valuable com-
ments and feedback on the design of the survey and
drafting of this report. The authors would also like
to thank Don Dillman at Washington State Univer-
sity for his insights on the survey.
iii


Executive Summary ................................................................................................................. 1
Key Findings .............................................................................................................................. 1
Introduction ............................................................................................................................... 5
Survey Background .................................................................................................................... 5
Overall Economic Well-Being .............................................................................................. 7
Current Economic Circumstances ................................................................................................ 7
Employment ............................................................................................................................... 8
Financial Expectations ................................................................................................................ 9
Housing and Household Living Arrangements ........................................................... 11
Living Arrangements ................................................................................................................. 11
Renters .................................................................................................................................... 11
Homeowners ............................................................................................................................ 12
Funding for Home Purchase Down Payment .............................................................................. 15
Economic Fragility and Emergency Savings ................................................................. 17
Financial Hardships ................................................................................................................... 17
Emergency Savings .................................................................................................................. 17
Health-Care Expenses ............................................................................................................... 19
Savings and Spending ........................................................................................................... 21
Spending Relative to Income ..................................................................................................... 21
Savings Rate and Reasons for Saving ........................................................................................ 22
Banking, Credit Access, and Credit Usage .................................................................... 25
Unbanked and Underbanked ..................................................................................................... 25
Access to Credit ....................................................................................................................... 25
Mortgages ................................................................................................................................ 27
Credit Cards ............................................................................................................................. 27
Education and Student Loans ........................................................................................... 29
Student Loans Overview ........................................................................................................... 29
Student Loan Payment Status by Demographic and Education Characteristics ............................ 30
Value of Higher Education by Educational Characteristics ........................................................... 33
Reasons for Not Starting or Not Finishing College ...................................................................... 34
Retirement ................................................................................................................................ 37
Planning for Retirement ............................................................................................................. 37
v
Contents

Saving for Retirement ................................................................................................................ 38
Expectations in Retirement ........................................................................................................ 41
Experiences in Retirement ......................................................................................................... 41
Conclusion ................................................................................................................................ 43
Appendix 1: Technical Appendix on Survey Methodology ..................................... 45
Appendix 2: Survey of Household Economics andDecisionmaking—Questionnaire ...................................................................................... 47
Appendix 3: Consumer Responses to Survey Questionnaire .................................. 83
vi
Executive Summary
As the economy of the United States continues to
rebound from the Great Recession, the well-being of
households and consumers provides important infor-
mation about the scope and pace of the economic
recovery. In order to monitor the financial and eco-
nomic status of American consumers, the Federal
Reserve Board began conducting the Survey of
Household Economics and Decisionmaking in 2013
and conducted the survey for a second time in Octo-
ber 2014. The findings from the October 2014 survey
are covered in this report. Topics examined in the
survey include the financial health of individuals on a
number of levels, such as overall well-being, housing,
economic fragility, savings and spending, access to
credit, education and student loans, and retirement
planning.
Key Findings
Overall, since the previous survey in 2013, individuals
and their families experienced only mild improvements
in their overall well-being, but they are increasingly
optimistic about the trajectory of their well-being
going forward.
• Sixty-five percent of respondents report that their
families are either “doing okay” or “living comfort-
ably” financially, compared to 62 percent in 2013.
• Forty-nine percent of part-time workers and
36 percent of all workers would prefer to work
more hours at their current wage if they were able
to do so.
• Twenty-nine percent of respondents expect their
income to be higher in the year after the survey
than in the year prior to the survey. In the 2013 sur-
vey, 21 percent of respondents expected their
income to increase.
The survey also asks questions about a number of
specific aspects of individuals’ financial lives:
Housing
Most renters express a preference for homeownership.
Homeowners are generally optimistic about the trajec-
tory of their home values. However, many renters, and
especially lower-income renters, indicate that financial
barriers to homeownership prevent them from purchas-
ing a home.
• The most common reasons renters cite for renting
rather than owning a home are a perceived inability
to afford the necessary down payment (50 percent)
or a perceived inability to qualify for a mortgage
(31 percent).
• Forty-three percent of homeowners who have
owned their home for at least a year believe that the
value of their home is higher than it was in 2013,
37 percent believe the value is about the same, and
13 percent believe that it is now lower.
• Fourteen percent of homeowners with a mortgage
believe that they owe more on their mortgage than
their house is worth, while 70 percent report that
the value of their home exceeds the amount of
their mortgage.
Economic Fragility
Although the survey finds that economic hardships are
common, many individuals are ill-prepared for a finan-
cial disruption and would struggle to cover emergency
expenses.
• Forty-seven percent of respondents say they either
could not cover an emergency expense costing
$400, or would cover it by selling something or bor-
rowing money.
• Thirty-one percent of respondents report going
without some form of medical care in the
12 months before the survey because they could
not afford it.
1

• Just under one-quarter of respondents indicate that
they or a family member living with them experi-
enced some form of financial hardship in the year
prior to the survey.
Savings and Spending
Most respondents report that they saved at least some
of their income in the past year, although a sizeable
minority indicate that their spending exceeds their
income.
• Twenty percent of respondents report that their
spending exceeded their income in the 12 months
prior to the survey.
• Sixty-three percent of respondents indicate that
they saved at least some money in the past year.
Banking and Credit
A majority of individuals believe that credit is available
to them should they desire it. However, a sizeable
minority of those who applied for credit report that
they experienced difficulties getting approved.
• Sixty percent of respondents indicate they are
either somewhat or very confident they would be
approved for a mortgage if they were to apply.
• Just under one-third of those who applied for
credit in the 12 months prior to the survey were
turned down or given less credit than they
applied for.
• Seventy-six percent of respondents have at least
one credit card. Of those with a credit card, a slight
majority (56 percent) report that they always paid
their credit card bill in full in the previous year.
• One-fifth of respondents have no bank account or
have used some form of alternative financial service
in the past year.
Education and Student Loans
The perceived value of a postsecondary education var-
ies widely depending on program completion, type, and
major. In addition, respondents who fail to complete a
degree are disproportionately likely to fall behind on
their student loan payments.
• Twenty-three percent of adults report currently
having education debt of some kind, with 15 per-
cent of all respondents having such debt for their
own education, 6 percent for their spouse’s/
partner’s education, and 6 percent for their child’s
or grandchild’s education.
• Education debt is not exclusively financed through
student loans, as 14 percent of respondents with
education debt report that they have credit card
debt from educational expenses, 5 percent used a
home equity loan to pay for education, and 11 per-
cent have some other non-student loan debt that
was used to pay for education.
• Among respondents who borrowed for their own
education, those who failed to complete an associ-
ate degree or bachelor’s degree, those who attended
for-profit institutions, and those who were first-
generation college students are more likely to be
behind on their payments than others.
• Family responsibilities are the most common rea-
son given for not completing a degree after starting
college, cited by 38 percent of the respondents who
dropped out as a reason for not continuing their
education.
Retirement
Many individuals report that they are not planning for
retirement and not saving for retirement. Additionally,
even among those who are saving, respondents indicate
that they lack confidence in their ability to manage
their retirement investments.
• Thirty-nine percent of non-retirees have given little
or no thought to financial planning for retirement
and 31 percent have no retirement savings or
pension.
• Over one-half of non-retirees with self-directed
retirement accounts are either “not confident” or
only “slightly confident” in their ability to make
the right investment decisions when investing the
money in these accounts.
• Forty-five percent of non-retirees who plan to
retire expect to continue working in some capacity
during retirement to generate additional income to
cover expenses.
Differences in Well-Being by Household Income Level
Across a range of dimensions, individuals in lower-
income households express a higher frequency of finan-
cial challenges. These lower-income respondents are
less prepared for financial hardship, less likely to be
saving, and more likely to expect to never stop working.
• Twenty-two percent of respondents with a house-
hold income under $40,000 expect that their
income will be higher in the 12 months following
the survey, whereas 36 percent of those whose
2 Economic Well-Being of U.S. Households, 2014

income is over $100,000 expect income growth over
the same period.
• Over two-thirds of respondents with a household
income under $40,000 report that they would sell
something or borrow money to cover a $400 emer-
gency expense or could not cover the expense at all.
• Among respondents who save, those with a house-
hold income under $40,000 are most likely to be
saving for unexpected expenses, while those with an
income over $100,000 are most likely to be saving
for retirement.
May 2015 3

Introduction
In October 2014, the Federal Reserve Board’s Divi-
sion of Consumer and Community Affairs con-
ducted the second Survey of Household Economics
and Decisionmaking (SHED). The first survey was
conducted in September 2013.
The SHED aims to capture a snapshot of the finan-
cial and economic well-being of U.S. households, as
well as to monitor their recovery from the recent
recession and identify any risks to their financial sta-
bility. In doing so, it collects information on house-
holds that is not readily available from other sources
or is not available in combination with other vari-
ables of interest. The survey was designed in consul-
tation with Federal Reserve System staff and outside
academics with relevant research backgrounds.
The SHED provides a nationally representative snap-
shot of the economic situation of households in the
United States at the time of the survey, as well their
perspective on financial conditions in the recent past
and expectations for conditions in the near future.
The survey focuses on a range of topics, including
• the personal finances of households;
• economic fragility and emergency savings;
• savings and spending;
• housing and living arrangements;
• banking, credit access, and credit usage;
• education and student debt; and
• retirement.
Survey Background
The SHED was designed by Board staff and is
administered by GfK, an online consumer research
company, on behalf of the Board. The questions in
the survey are designed to better illuminate the activi-
ties, experiences, and attitudes of individual consum-
ers regarding their financial lives and the financial
well-being of those in their household. They are
intended to complement and augment the existing
base of knowledge from other data sources, including
the Board’s own Survey of Consumer Finances
(SCF).1 In most cases, original questions are asked of
respondents, although occasionally questions mirror
those from other surveys in order to provide direct
comparisons and understand how certain variables
interact with others. In this year’s survey, many of
the questions from the 2013 survey are repeated to
enable longitudinal tracking, while new questions are
introduced as well.
The survey is conducted using a sample of
adults ages 18 and over from KnowledgePanel®, a
probability-based web panel designed by GfK that
includes more than 50,000 individuals from randomly
sampled households. The sample for the survey was
drawn from the overall panel based on three criteria.
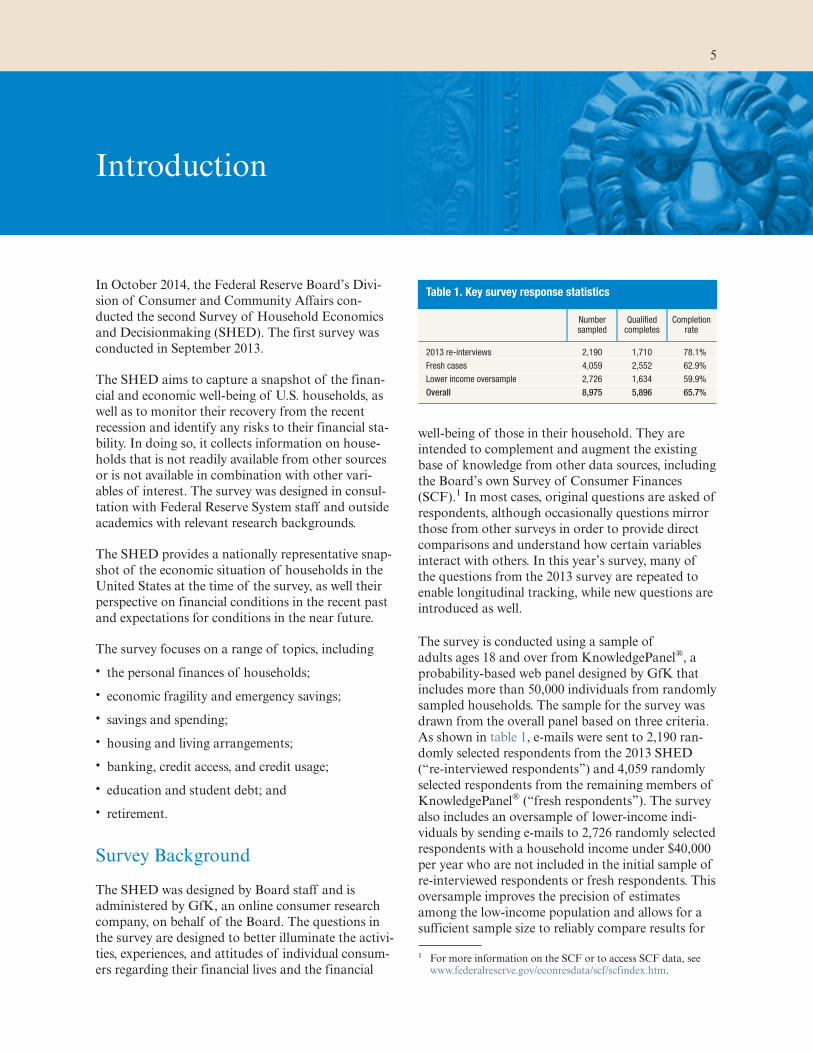
As shown in table 1, e-mails were sent to 2,190 ran-
domly selected respondents from the 2013 SHED
(“re-interviewed respondents”) and 4,059 randomly
selected respondents from the remaining members of
KnowledgePanel® (“fresh respondents”). The survey
also includes an oversample of lower-income indi-
viduals by sending e-mails to 2,726 randomly selected
respondents with a household income under $40,000
per year who are not included in the initial sample of
re-interviewed respondents or fresh respondents. This
oversample improves the precision of estimates
among the low-income population and allows for a
sufficient sample size to reliably compare results for
1 For more information on the SCF or to access SCF data, seewww.federalreserve.gov/econresdata/scf/scfindex.htm.
Table 1. Key survey response statistics
Numbersampled
Qualifiedcompletes
Completionrate
2013 re-interviews 2,190 1,710 78.1%
Fresh cases 4,059 2,552 62.9%
Lower income oversample 2,726 1,634 59.9%
Overall 8,975 5,896 65.7%
5

certain questions of interest across segments of the
population. Overall, of the 8,975 respondents con-
tacted for the survey, 5,896 respondents completed it,
yielding an overall final stage completion rate of
65.7 percent. The respondents completed the survey
in approximately 19 minutes (median time). Recog-
nizing that the sample demographics may differ from
that of the overall U.S. population, especially given
the oversample of respondents making under
$40,000, survey results are weighted based on the
demographic characteristics of the respondents to
match characteristics from 2014 March Current
Population Survey. Further details on the survey
methodology are included in appendix 1.
As is the case with all surveys, some cautions in inter-
preting the survey results are prudent. Although the
survey was designed to be nationally representative,
some degree of selection bias beyond that which can
be corrected through weighting is possible nonethe-
less (see appendix 1). Further, the results are all self-
reported, and respondents’ knowledge and memory
may not always be completely accurate when answer-
ing survey questions. In anticipation of this chal-
lenge, certain questions were designed to avoid the
appearance of false precision. For example, the sur-
vey could ask respondents what their credit score is,
but expectations were modest that many consumers
would actually know the precise answer. Rather, the
survey asks, “If you had to guess, how would you
rate your current credit score?”—then it offers a
range of imprecise but nonetheless meaningful
options ranging from Poor to Excellent. In this way,
the survey anticipates that typical respondents may
have some limitations on their ability to precisely
know and remember the answers to certain questions.
Readers of the survey results are encouraged to keep
these limitations in mind.
The following sections of this report summarize key
findings from the SHED. The numbers cited in this
report are derived from the Board survey unless oth-
erwise noted. All data are weighted to yield estimates
for the U.S. adult population. Only a subset of ques-
tions asked in the SHED are discussed in the report;
however, the complete survey questionnaire is sum-
marized in appendix 2. The responses to all the sur-
vey questions are presented in appendix 3 in the
order that the questions were asked of respondents.
6 Economic Well-Being of U.S. Households, 2014
Overall Economic Well-Being
Respondents to the survey are asked a range of ques-
tions relating to their financial well-being, including
how they are currently faring overall, the change in
their economic well-being in recent years, and their
expectations for the future. The survey finds that indi-
viduals and their families showed only mild improve-
ments in their overall economic well-being relative to
2013. The results also suggest that a number of work-
ers either wish that they could work more hours at
their current wage, or are piecing together employment
by working multiple jobs. However, while some
respondents are struggling economically, most respon-
dents still believe that they are better off than their
parents were, and a plurality expect that their children
will be better off than they are.
Current Economic Circumstances
When asked how they are currently managing finan-
cially, 25 percent of respondents report that they are
“living comfortably,” while 40 percent report that they
are “doing okay.” However, just over one-third of
respondents report that they are experiencing some
level of financial stress, as 24 percent report that they
are “just getting by” financially, and a further 10 per-
cent indicate that they are “finding it difficult to get
by” (figure 1).2 This level of overall well-being is only
marginally improved from that seen in the 2013 sur-
vey, where 25 percent said they were living comfort-
ably and 38 percent said they were doing okay.3
Perceptions of overall economic well-being are closely
linked to household income. Among respondents in
households making less than $40,000 per year, 53 per-
cent indicate that they are either finding it difficult to
get by or are just getting by.4 This fraction changes
inversely with income, with just 16 percent of those
earning more than $100,000 reporting the same.
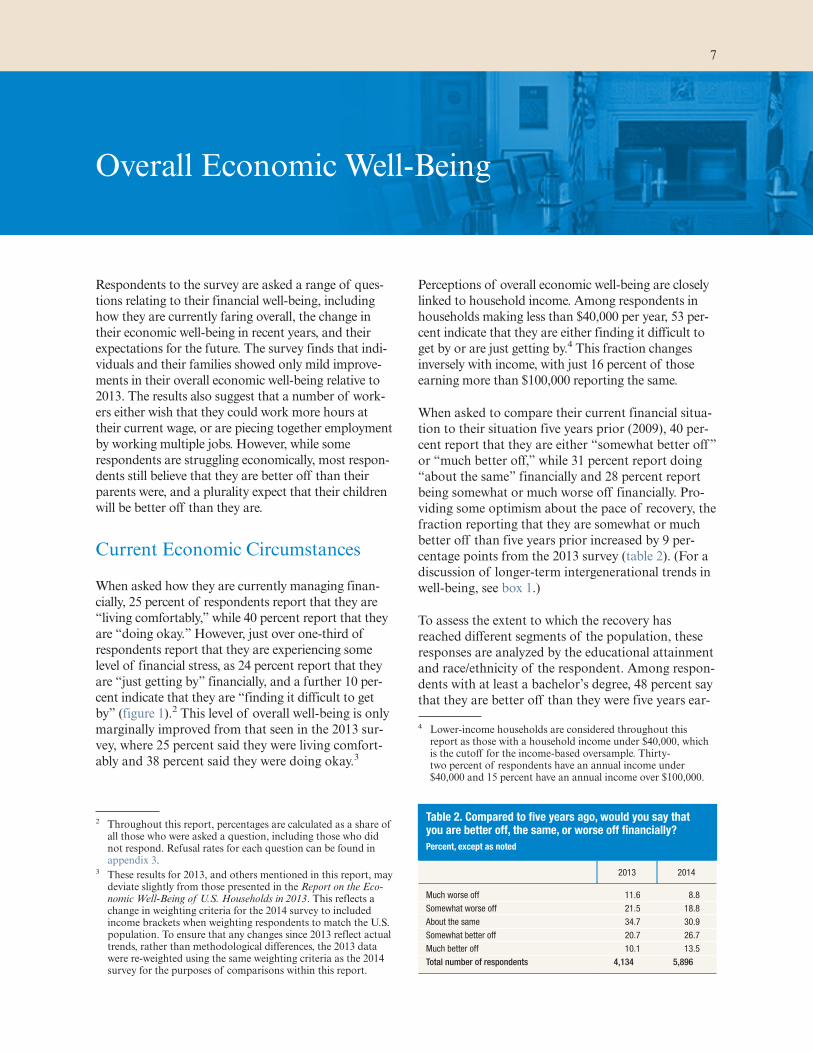
When asked to compare their current financial situa-
tion to their situation five years prior (2009), 40 per-
cent report that they are either “somewhat better off”
or “much better off,” while 31 percent report doing
“about the same” financially and 28 percent report
being somewhat or much worse off financially. Pro-
viding some optimism about the pace of recovery, the
fraction reporting that they are somewhat or much
better off than five years prior increased by 9 per-
centage points from the 2013 survey (table 2). (For a
discussion of longer-term intergenerational trends in
well-being, see box 1.)
To assess the extent to which the recovery has
reached different segments of the population, these
responses are analyzed by the educational attainment
and race/ethnicity of the respondent. Among respon-
dents with at least a bachelor’s degree, 48 percent say
that they are better off than they were five years ear-
2 Throughout this report, percentages are calculated as a share ofall those who were asked a question, including those who didnot respond. Refusal rates for each question can be found inappendix 3.
3 These results for 2013, and others mentioned in this report, maydeviate slightly from those presented in the Report on the Eco-nomic Well-Being of U.S. Households in 2013. This reflects achange in weighting criteria for the 2014 survey to includedincome brackets when weighting respondents to match the U.S.population. To ensure that any changes since 2013 reflect actualtrends, rather than methodological differences, the 2013 datawere re-weighted using the same weighting criteria as the 2014survey for the purposes of comparisons within this report.
4 Lower-income households are considered throughout thisreport as those with a household income under $40,000, whichis the cutoff for the income-based oversample. Thirty-two percent of respondents have an annual income under$40,000 and 15 percent have an annual income over $100,000.
Table 2. Compared to five years ago, would you say thatyou are better off, the same, or worse off financially?
Percent, except as noted
2013 2014
Much worse off 11.6 8.8
Somewhat worse off 21.5 18.8
About the same 34.7 30.9
Somewhat better off 20.7 26.7
Much better off 10.1 13.5
Total number of respondents 4,134 5,896
7

lier. This compares to 37 percent of respondents with
less than a bachelor’s degree who feel that their
financial situation improved over the prior five years.
This provides some evidence that the recovery is
being experienced to a greater degree for individuals
with higher educational backgrounds. However, when
comparing results by race, no similar differences
emerge: 39 percent of white respondents report being
better off than they were in 2009, while 43 percent of
both black and Hispanic respondents indicate that
they are now better off. This lack of difference in
trends of well-being by race is consistent with the
results from the 2013 SHED, which also observed
that a slightly lower fraction of whites (30 percent)
than blacks (33 percent) or Hispanics (34 percent)
felt that they were better off than they had been five
years prior.
Employment
Closely related to overall economic well-being is the
employment status of respondents. In the survey,
55 percent of respondents report being employed,
while 19 percent are retired, 7 percent are homemak-
ers, 7 percent are disabled and not working, and
7 percent are not employed (including both those
looking and not looking for work) or are on tempo-
rary layoff.5
In addition to the rate of unemployment, the level of
underemployment is an important measure of labor
market slack. One measure of underemployment is
the fraction of individuals who are working but
would like to work more if they had the opportunity
to do so. To gauge the size of this population, the
survey asks non-self-employed workers whether they
would prefer to work more, less, or the same amount
that they currently work if their hourly wage was
unchanged. Thirty-six percent of these respondents
indicate that they would prefer to work more hours
at their current wage. Among those whose current
job is part time, the fraction is even higher, with
49 percent responding that they would prefer to work
more hours at their current wage (figure 2).
One way that some workers fill this desire for addi-
tional income is by working multiple jobs. Among
employed respondents, 15 percent report having at
least two jobs. This includes 21 percent of respon-
dents who work part time at multiple jobs.
Working multiple jobs is slightly more common
among respondents with less income. Conditional on
having at least one job, 18 percent of employed
respondents whose household income is less than
$40,000 per year have at least two jobs, whereas
15 percent of those whose income is between $40,000
and $100,000 and 14 percent of those with a house-
hold income over $100,000 have at least two jobs
(table 3).65 In addition to the 55 percent of respondents who report being
employed, 2 percent of respondents indicate that they are pri-marily a student but also have a full-time or part-time job, and2 percent indicate that they are primarily retired but also have afull-time or part-time job. Overall, 59 percent of respondentsreport having a job of any kind, which closely matches theBureau of Labor Statistics’ estimate for the adult employment-population ratio. Respondents who primarily identify as havingany employment status besides “employed now,” including stu-dents and retirees, are not asked about the number of jobs.
6 Income is measured in the survey at the household level, so allreferences to the income level of individuals in this report referto the total income of all individuals in their household.
Figure 1. Which one of the following best describes how well you are managing financially these days? (by household income)
20
8
3
10
33
24
13
24
34
43
41
40
11
23
42
25
0 10 20 30 40 50 60 70 80 90 100
Less than $40,000
$40,000–$100,000
Greater than $100,000
Overall
Percent
Finding it dif!cult to get by Just getting by Doing okay Living comfortably
Note: Here and in subsequent figures, percents may not sum to 100 due to rounding and question non-response.
8 Economic Well-Being of U.S. Households, 2014

Financial Expectations
In addition to asking about the current economic
situation of respondents and the recent trajectory of
their well-being, the survey asks respondents about
their expectations for the future. Expectations for
future income growth are improved relative to that
seen in the 2013 survey. Twenty-nine percent of
respondents report that they expect their income to
be higher in the year following the survey than it was
in the preceding 12 months, compared to 9 percent
who expect it to be lower.7 In contrast, in 2013, only
21 percent of respondents expected their income to
be higher in the year following the survey. Despite
this improvement, there are still 60 percent of
7 Since the survey was fielded in late October 2014, questionsregarding the coming 12 months reflect respondents’ opinionson their incomes through approximately October 2015.Responses about the previous year should reflect the periodfrom approximately November 2013 through October 2014.
Box 1. Intergenerational Trends in Well-Being
In order to assess trends in well-being from onegeneration to the next, the survey asks respondentshow they are managing financially compared toother generations. When asked to compare them-selves financially to their parents at the same age,fifty-two percent say that they are better off, includ-ing 24 percent who say that they are much betteroff. This compares to 23 percent who say that theyare somewhat or much worse off than their parentswere at the same age.
Younger respondents, however, are somewhat lesslikely to believe that they have improved financiallycompared to their parents (figure A). While at leasthalf of respondents in each of the three older agegroups believe that they are better off than theirparents at the same age, only 46 percent ofrespondents between ages 18 and 29 feelthat way.
Looking to the future, a plurality of respondents ofall ages expect that the next generation of their fam-ily (including their children, nieces, or nephews, etc.)will be better off than they are. Forty-four percent ofrespondents expect that the next generation of theirfamily will be better off than they are at their currentage, compared to 28 percent who expect their chil-dren, nieces, or nephews to be worse off. Twenty-six percent expect that the next generation of theirfamily will be doing about the same as they are.Among respondents with children under age 18 intheir household, expectations for the future are morepositive—perhaps reflecting both parental optimismas well as a more concrete conceptualization of whorepresents the next generation of their family.Among these individuals with children, 52 percentexpect that the next generation of their family will bebetter off than they are.
Figure A. Would you say that you are better, the same, or worse off financially than your parents were at your age?
24
24
25
21
23
26
23
20
22
23
46
52
54
56
52
18–29
30–44
45–59
60+
Overall
Percent
Worse off than parents
About the same
Better off than parents
May 2015 9

respondents who expect their income to remain
about the same in the next 12 months, which may
reflect a continued lack of optimism about future
wage growth.
Optimism about future income growth is also corre-
lated with both age and income. Younger individuals
are the most optimistic about their future income tra-
jectory, with 39 percent of those under age 30 believ-
ing their income will increase in the year after the
survey, and 37 percent of those between ages 30 and
44 expecting income growth over the same period.
Expectations about income growth then decline with
age (table 4).
However, survey results also indicate that those with
lower incomes are the least optimistic about rising
incomes going forward. Among those in the lowest
income group, a smaller 22 percent of respondents
expect that their income will be higher in coming
months. Expectations about income growth then rise
with current income (table 5).
Figure 2. Would you prefer to work more, less, or about the same amount as you currently work at your current wage?(by employment status)
34
49
24
13
48
36
60
48
62
78
52
58
6
3
14
9
5
0 10 20 30 40 50 60 70 80 90 100
Work full time for someone else
Work part time for someone else
Work as a consultant or contractor
Retired, but also have a job
Student, but also have a job
Overall
Percent
Prefer to work more hours Prefer to work the same number of hours Prefer to work fewer hours
Note: Among respondents who are currently employed.
Table 3. In addition to your main job, do you also haveanother paid job? (by household income)
Percent, except as noted
Income categoriesYes, I haveanother
full-time job
Yes, I haveanother
part-time jobNo
Less than $40,000 3.0 15.1 81.8
$40,000–$100,000 2.3 12.7 85.0
Greater than $100,000 1.5 12.2 86.3
Overall 2.2 13.0 84.7
Total number of respondents 2,871
Note: Among respondents who are currently employed and are not a studentor retiree.
Table 4. During the next 12 months, do you expect yourtotal income to be higher or lower than in the previous12 months? (by age)
Percent, except as noted
Age categories LowerAbout
the sameHigher
18–29 7.3 49.5 39.3
30–44 6.3 55.1 37.2
45–59 11.0 61.6 26.5
60+ 11.4 72.1 16.0
Overall 9.1 60.2 29.2
Total number of respondents 5,896
Table 5. During the next 12 months, do you expect yourtotal income to be higher or lower than in the previous12 months? (by household income)
Percent, except as noted
Income categories LowerAbout
the sameHigher
Less than $40,000 12.0 64.5 21.6
$40,000–$100,000 8.4 60.1 30.0
Greater than $100,000 6.9 55.3 36.5
Overall 9.1 60.2 29.2
Total number of respondents 5,896
10 Economic Well-Being of U.S. Households, 2014

Housing and Household LivingArrangements
Housing represents one of the largest expenses in
most families’ financial picture and, as such, one’s
housing situation is closely tied to economic well-
being. Partially reflecting the level of resources neces-
sary to purchase and maintain a home, respondents
who own their home are more likely to report that
they are either “doing okay” or “living comfortably”
(74 percent) than those who rent (48 percent).
Recognizing the importance of housing to one’s
overall well-being, the SHED poses a series of
housing-related questions to survey participants. The
survey finds that most renters express a preference
for homeownership, but despite this preference, many
renters report that financial barriers prevent them
from purchasing a home. The survey results also
illustrate that while some homeowners are underwa-
ter on their mortgage, in general those who own a
home are optimistic that the value of their home is
increasing and that home values will continue to
appreciate in the near future.
Living Arrangements
The vast majority of respondents (80 percent) report
that they either live alone or only with their immedi-
ate family members, while 10 percent of respondents
live with their parents and 5 percent live with a room-
mate (table 6).
Of the respondents who live with someone outside of
their immediate family, 64 percent say that they are
either doing so to save money or to provide financial
assistance to those who are living with them. How-
ever, about one out of every seven respondents who is
living with someone outside of their immediate fam-
ily indicates that they are doing so, at least in part,
because of caregiving activities, with 12 percent
reporting that they are caring for a sick, disabled, or
elderly family member or friend, and 2 percent saying
that they are either doing so to provide assistance
with childcare for a child not their own or to receive
assistance with childcare from others. Those with an
income below $40,000 are nearly twice as likely to
indicate caregiving activities as a reason for living
with someone other than their immediate family
compared to those whose household income is above
$100,000 (19 percent versus 11 percent, respectively).
Renters
Sixty-one percent of survey respondents report that
they own their home, while 28 percent rent, and
10 percent neither own their home nor pay rent.
Among respondents who rent their home, the average
renter pays $808 in monthly rent, while the median
renter pays $700. The median rent is unchanged from
the 2013 survey, while the mean rent is down from
$852 in 2013.
When asked about their preference between owning
and renting, 81 percent of renters indicate that they
would prefer to own their home if they could afford
to do so. Renters are also asked why they do not own
their home, with the most common responses being
that they cannot afford a down payment to buy a
home (50 percent) or that they cannot qualify for a
mortgage (31 percent). This suggests that perceived
financial and credit barriers to homeownership are a
crucial driver of why some individuals are renting
Table 6. Which one of the following best describes yourliving arrangement?
Percent
Living alone or only with your immediate family 80.1
Living with your parents 9.7
Living with roommate(s) 4.7
Living with your extended family 3.0
Living with your adult children 2.4
Total number of respondents 5,896
11

rather than owning, despite the stated preference of
many renters for homeownership.
On the other hand, while some respondents indicate
that they rent due to an inability to qualify for a
mortgage or afford a down payment, others indicate
that they rent due to specific benefits of renting. In
particular, 27 percent of renters say that they find it
cheaper to rent than own, 25 percent say that they
find it more convenient to rent, and 12 percent say
that they simply prefer to rent. Nine percent of rent-
ers report that they are currently looking to buy a
home. (Box 2 examines the relationship between
motivation for renting and actual changes in home-
ownership status.)
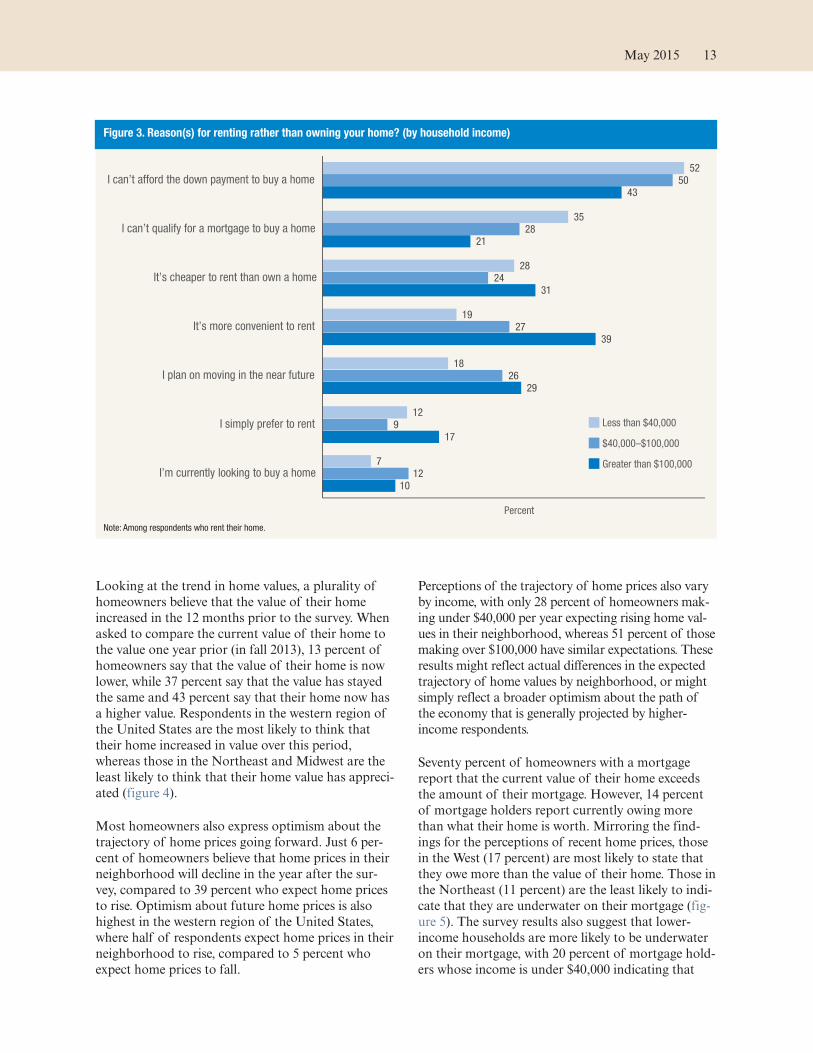
The reasons that respondents cite for why they rent
rather than own their home vary by income level (fig-
ure 3). Renters making under $40,000 are dispropor-
tionately likely to indicate that they rent due to the
financial barriers to homeownership, with 35 percent
reporting that they can’t qualify for a mortgage and
52 percent reporting that they can’t afford the down
payment. In contrast, renters with an income over
$100,000 are disproportionately likely to report that
they rent due to personal preferences, including
because it is more convenient to rent (39 percent),
because they plan on moving in the near future
(29 percent), or because they simply prefer to rent
(17 percent).
Reasons for renting also differ by age in several
notable ways. Among renters, those ages 18 to 29 are
more likely to state that they plan on moving in the
near future (36 percent) or that they are currently
looking to buy a home (13 percent) than those in
older age groups. Respondents over age 60 are most
likely to indicate that they rent because it is cheaper
to rent than to own (35 percent) or that they simply
prefer to rent (26 percent).
Homeowners
Among homeowners, 61 percent currently have a
mortgage, and among mortgage holders the average
monthly mortgage payment is $1,344, with a median
payment of $1,068. The average tenure of homeown-
ers is 15 years, while the median tenure is 12 years.
When asked why they own rather than rent, 44 per-
cent say that they own because it allows them to
build equity with their payments, 41 percent say that
they feel that it is cheaper to own than to rent, and
20 percent like the certainty it provides for their
monthly payments. Altogether, 67 percent of respon-
dents cite at least one of these three financially moti-
vated reasons for owning. However, many owners cite
non-financial benefits as important considerations.
Seventy-two percent of respondents say that they
simply prefer to own, 43 percent say they own
because there are fewer rules and they can customize
their house, and 23 percent indicate that own because
they do not like to move. Altogether, 83 percent of
respondents cite at least one of these three non-
financial motivations for owning.
Box 2. Changes in Homeownership among Re-Interviewed2013 Survey Respondents
Because a subset of survey respondents also partici-pated in the 2013 SHED, it is possible to observe howresponses change from one year to the next as wellas to track how current responses match up with ear-lier expectations of future behavior. For instance, the2013 survey asked respondents who were currentlyrenting why they rented, and 10 percent reported thatthey were currently looking to buy. Since the 2014survey asks respondents whether they now own theirhome and when they purchased, it captures thehomeownership outcomes for respondents who, in2013, said that they were planning to buy a home. Ofrespondents who were renting in 2013 and said thatthey were looking to buy, one-third actually did so. Incomparison, only 3 percent of respondents who wererenting in 2013 and did not say that they were lookingto buy subsequently purchased a home in the inter-vening year.
Similarly, the panel nature of the survey allows for acomparison of the reason for renting among respon-dents who now rent but who owned a home in theprevious year’s survey. While just 9 percent of all rent-ers in the 2014 survey say they are currently lookingto buy a home, 26 percent of renters who owned ahome in 2013 say they are currently looking to buy.This suggests that a sizeable fraction of respondentswho transitioned recently from owning to renting viewit as a temporary state. Renters who previouslyowned are also less likely to say that it is more conve-nient to rent (17 percent) or that they cannot afford thedown payment on a house (22 percent) than are rent-ers who did not previously own.
12 Economic Well-Being of U.S. Households, 2014
Looking at the trend in home values, a plurality of
homeowners believe that the value of their home
increased in the 12 months prior to the survey. When
asked to compare the current value of their home to
the value one year prior (in fall 2013), 13 percent of
homeowners say that the value of their home is now
lower, while 37 percent say that the value has stayed
the same and 43 percent say that their home now has
a higher value. Respondents in the western region of
the United States are the most likely to think that
their home increased in value over this period,
whereas those in the Northeast and Midwest are the
least likely to think that their home value has appreci-
ated (figure 4).
Most homeowners also express optimism about the
trajectory of home prices going forward. Just 6 per-
cent of homeowners believe that home prices in their
neighborhood will decline in the year after the sur-
vey, compared to 39 percent who expect home prices
to rise. Optimism about future home prices is also
highest in the western region of the United States,
where half of respondents expect home prices in their
neighborhood to rise, compared to 5 percent who
expect home prices to fall.
Perceptions of the trajectory of home prices also vary
by income, with only 28 percent of homeowners mak-
ing under $40,000 per year expecting rising home val-
ues in their neighborhood, whereas 51 percent of those
making over $100,000 have similar expectations. These
results might reflect actual differences in the expected
trajectory of home values by neighborhood, or might
simply reflect a broader optimism about the path of
the economy that is generally projected by higher-
income respondents.
Seventy percent of homeowners with a mortgage
report that the current value of their home exceeds
the amount of their mortgage. However, 14 percent
of mortgage holders report currently owing more
than what their home is worth. Mirroring the find-
ings for the perceptions of recent home prices, those
in the West (17 percent) are most likely to state that
they owe more than the value of their home. Those in
the Northeast (11 percent) are the least likely to indi-
cate that they are underwater on their mortgage (fig-
ure 5). The survey results also suggest that lower-
income households are more likely to be underwater
on their mortgage, with 20 percent of mortgage hold-
ers whose income is under $40,000 indicating that
Figure 3. Reason(s) for renting rather than owning your home? (by household income)
52
35
28
19
18
12
7
50
28
24
27
26
9
12
43
21
31
39
29
17
10
I can’t afford the down payment to buy a home
I can’t qualify for a mortgage to buy a home
It’s cheaper to rent than own a home
It’s more convenient to rent
I plan on moving in the near future
I simply prefer to rent
I’m currently looking to buy a home
Percent
Less than $40,000
$40,000–$100,000
Greater than $100,000
Note: Among respondents who rent their home.
May 2015 13

Figure 4. Compared to 12 months ago, do you think the value of your home today is higher, lower, or stayed the same?(by region)
Lower: 12%
Same: 45%
Higher: 37%
Lower: 16%
Same: 42%
Higher: 38%
Lower: 14%
Same: 36%
Higher: 41%
Lower: 10%
Same: 27%
Higher: 57%
Note: Among respondents who have owned their home since at least 2012.
Figure 5. Does the total amount of money you currently owe on your primary home exceed the current value ofyour home? (by region)
17%
14%
15%
11%
Percent who owe more than current home value
Note: Among respondents who own their home and have a mortgage.
14 Economic Well-Being of U.S. Households, 2014
they owe more than their home is worth. This com-
pares to 16 percent of those with incomes between
$40,000 and $100,000 and 11 percent of those with
incomes over $100,000 who believe that they are
underwater on their mortgage.
Perhaps reflecting the perceived improvements in
home values, a relatively small fraction of homeown-
ers indicate an inability to sell their home. When
asked if they wanted to sell their home or had tried
to sell their home over the prior 12 months, 8 percent
report they kept their home off the market despite
wanting to sell and only 1 percent report that they
had listed their home but had been unable to sell it. A
further 1 percent indicate that their home is currently
on the market.
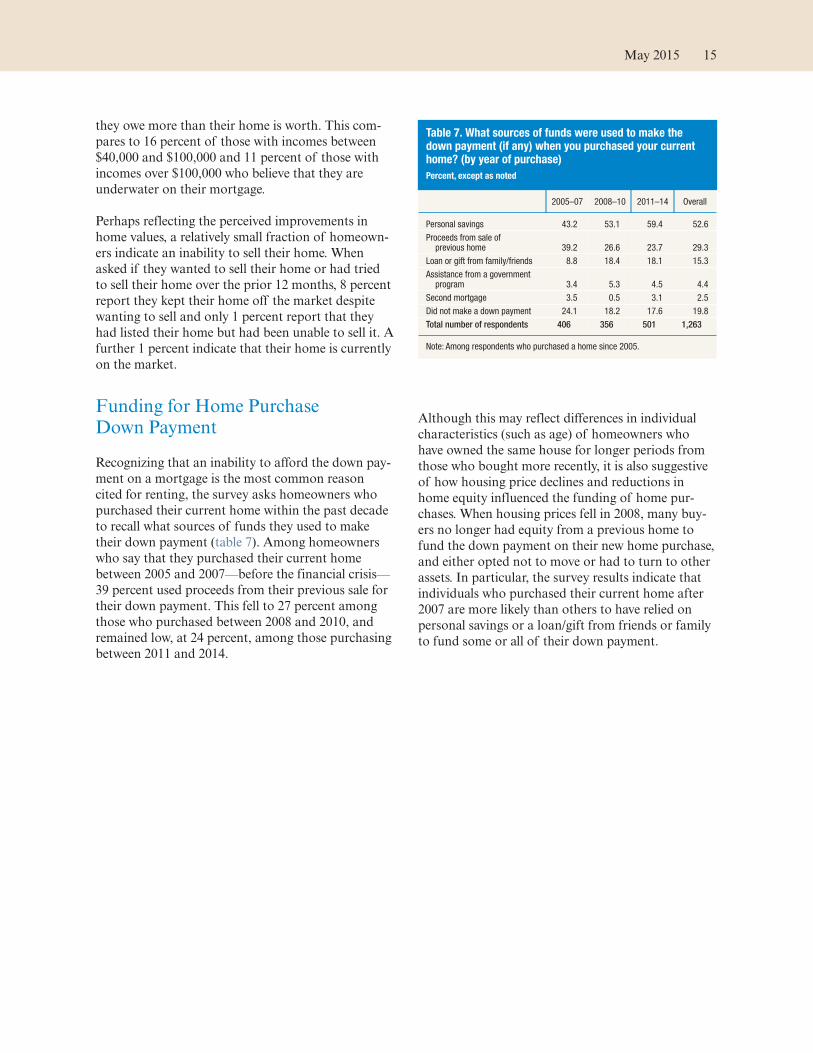
Funding for Home PurchaseDown Payment
Recognizing that an inability to afford the down pay-
ment on a mortgage is the most common reason
cited for renting, the survey asks homeowners who
purchased their current home within the past decade
to recall what sources of funds they used to make
their down payment (table 7). Among homeowners
who say that they purchased their current home
between 2005 and 2007—before the financial crisis—
39 percent used proceeds from their previous sale for
their down payment. This fell to 27 percent among
those who purchased between 2008 and 2010, and
remained low, at 24 percent, among those purchasing
between 2011 and 2014.
Although this may reflect differences in individual
characteristics (such as age) of homeowners who
have owned the same house for longer periods from
those who bought more recently, it is also suggestive
of how housing price declines and reductions in
home equity influenced the funding of home pur-
chases. When housing prices fell in 2008, many buy-
ers no longer had equity from a previous home to
fund the down payment on their new home purchase,
and either opted not to move or had to turn to other
assets. In particular, the survey results indicate that
individuals who purchased their current home after
2007 are more likely than others to have relied on
personal savings or a loan/gift from friends or family
to fund some or all of their down payment.
Table 7. What sources of funds were used to make thedown payment (if any) when you purchased your currenthome? (by year of purchase)
Percent, except as noted
2005–07 2008–10 2011–14 Overall
Personal savings 43.2 53.1 59.4 52.6
Proceeds from sale ofprevious home 39.2 26.6 23.7 29.3
Loan or gift from family/friends 8.8 18.4 18.1 15.3
Assistance from a governmentprogram 3.4 5.3 4.5 4.4
Second mortgage 3.5 0.5 3.1 2.5
Did not make a down payment 24.1 18.2 17.6 19.8
Total number of respondents 406 356 501 1,263
Note: Among respondents who purchased a home since 2005.
May 2015 15

Economic Fragility and Emergency Savings
A key consideration regarding household finances
and overall economic well-being is the ability to with-
stand financial disruption. Almost a quarter of
respondents indicate that they experienced some
form of financial hardship in the year leading up to
the survey, and the results demonstrate that house-
holds throughout the income distribution struggle to
maintain a financial safety net that could minimize
the repercussions from such events. This lack of a
financial safety net is reflected in economic behaviors,
as respondents report leaning on friends or family to
overcome financial hardships or report going without
medical treatment due to an inability to pay.
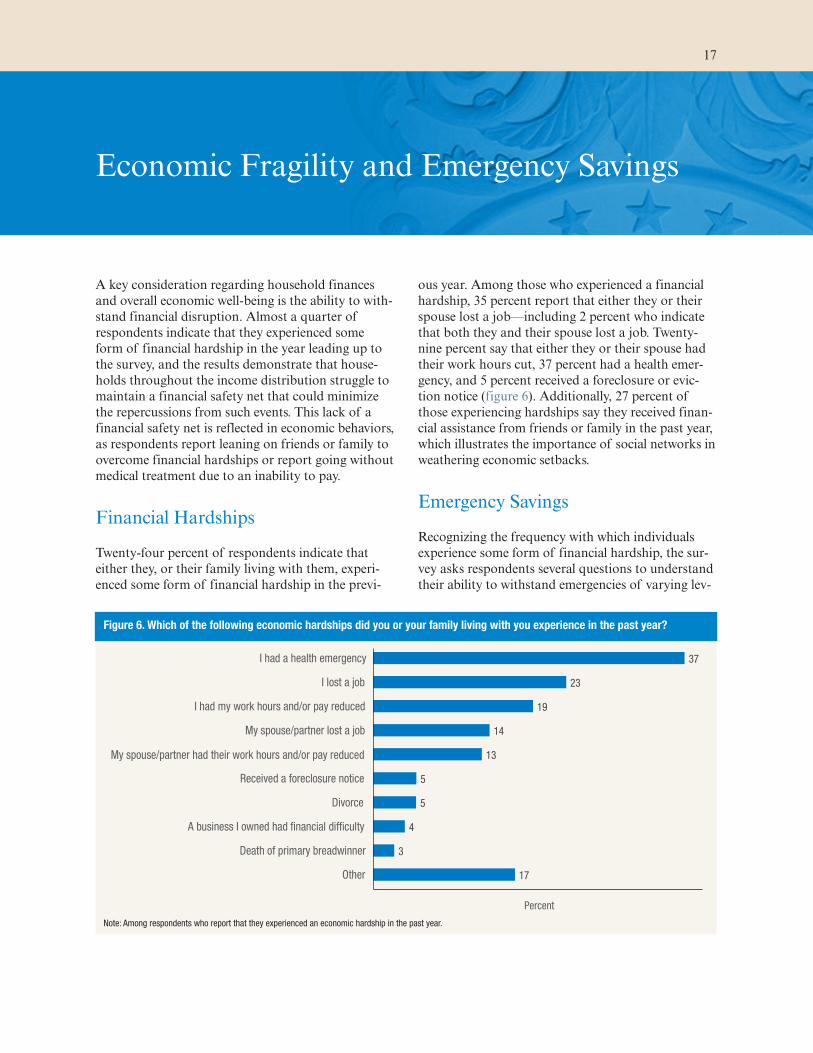
Financial Hardships
Twenty-four percent of respondents indicate that
either they, or their family living with them, experi-
enced some form of financial hardship in the previ-
ous year. Among those who experienced a financial
hardship, 35 percent report that either they or their
spouse lost a job—including 2 percent who indicate
that both they and their spouse lost a job. Twenty-
nine percent say that either they or their spouse had
their work hours cut, 37 percent had a health emer-
gency, and 5 percent received a foreclosure or evic-
tion notice (figure 6). Additionally, 27 percent of
those experiencing hardships say they received finan-
cial assistance from friends or family in the past year,
which illustrates the importance of social networks in
weathering economic setbacks.
Emergency Savings
Recognizing the frequency with which individuals
experience some form of financial hardship, the sur-
vey asks respondents several questions to understand
their ability to withstand emergencies of varying lev-
Figure 6. Which of the following economic hardships did you or your family living with you experience in the past year?
37
23
19
14
13
5
5
4
3
17
I had a health emergency
I lost a job
I had my work hours and/or pay reduced
My spouse/partner lost a job
My spouse/partner had their work hours and/or pay reduced
Received a foreclosure notice
Divorce
A business I owned had !nancial dif!culty
Death of primary breadwinner
Other
Percent
Note: Among respondents who report that they experienced an economic hardship in the past year.
17

els of severity. Although the results vary by the sever-
ity of the emergency presented, many households
appear ill-prepared for financial emergencies.
When asked if they have set aside an emergency or
rainy day fund that would cover three months of
expenses, only 45 percent of respondents indicate
that they do. However, it is possible that personal sav-
ings alone do not fully reflect the way that individuals
prepare for such a large financial disruption. To cap-
ture the possibility that many individuals’ approach
for weathering a severe disruption includes other
strategies, the survey asks respondents who indicate
that they do not have three months of emergency sav-
ings on hand a follow-up question, “If you were to
lose your main source of income (e.g., job, govern-
ment benefits), could you cover your expenses for
3 months by borrowing money, using savings, selling
assets, or borrowing from friends/family?” An addi-
tional 21 percent of respondents indicate that they
could cover three months of expenses using this
broad array of options.
When combining the 21 percent of respondents who
could cover three months of expenses using assets or
borrowing with the 45 percent who could cover three
months of expenses using their personal savings,
66 percent of all respondents report that they are pre-
pared for a three-month financial disruption. How-
ever, 32 percent of respondents are not prepared for a
three-month long financial disruption and could not
cover their expenses in such a situation, even by
borrowing.
To determine individuals’ preparedness for a smaller-
scale financial disruption, respondents are also asked
how they would pay for a hypothetical emergency
expense that would cost $400. Just over half (53 per-
cent) report that they could fairly easily handle such
an expense, paying for it entirely using cash, money
currently in their checking/savings account, or on a
credit card that they would pay in full at their next
statement (referred to here as “cash or its functional
equivalent”). The remaining 47 percent indicate that
such an expense would be more challenging to
handle. Specifically, respondents indicate that they
simply could not cover the expense (14 percent);
would sell something (10 percent); or would rely on
one or more means of borrowing to pay for at least
part of the expense, including paying with a credit
card that they pay off over time (18 percent), borrow-
ing from friends or family (13 percent), or using a
payday loan (2 percent).
The approach to paying a $400 emergency expense
varies substantially by income, and by the race and
ethnicity of the respondent. Only 31 percent of
respondents whose household income is under
$40,000 would pay the $400 expense using cash or its
functional equivalent, whereas 56 percent of respon-
dents in the middle income group and 73 percent of
respondents making over $100,000 would pay this
way (figure 7). Similarly, while 59 percent of white
respondents say that they would pay such an expense
using cash or its functional equivalent, only 37 per-
cent of Hispanic respondents and 33 percent of black
respondents would pay this way.
Figure 7. Percent of respondents who would completely pay an emergency expense that costs $400 using cash or a credit cardthat they pay off at the end of the month (by race/ethnicity and household income)
38
60
77
18
42
57
23
42
54
31
56
73
Less than $40,000
$40,000–$100,000
Greater than $100,000
Percent
White, non-Hispanic
Black, non-Hispanic
Hispanic
Overall
18 Economic Well-Being of U.S. Households, 2014

Respondents who indicate that they would pay the
$400 expense exclusively using resources other than
cash or its functional equivalent are also asked what
the largest expense is that they could cover using cash
on hand or money in their bank account. Thirty-
nine percent of these respondents report that the
largest expense that they could cover using cash on
hand is under $100. A further 16 percent indicate
that they could only cover an expense between $100
and $200, and 22 percent could cover an expense
between $200 and $400. The remaining 22 percent
report that they could cover over a $400 expense—
suggesting that for this subset of respondents, paying
the $400 expense using other means reflects a prefer-
ence of payment methods rather than a necessity.
Health-Care Expenses
Although emergency expenses can take many forms,
out-of-pocket expenses for health care are a particu-
lar concern for many respondents. Almost a quarter
of respondents experienced what they describe as a
major unexpected medical expense that they had to
pay out of pocket in the 12 months prior to the
survey.
Many respondents also report that they went without
some type of care because they were unable to afford
it. One quarter of respondents went without dental
care in the prior 12 months because they could not
afford it. Fifteen percent went without a doctor visit,
13 percent went without prescription medicine, and
11 percent went without a visit to a specialist (fig-
ure 8). Overall, 31 percent of respondents report
going without at least one of these types of care
because they could not afford it.
The likelihood of foregoing medical care due to cost
is strongly related to one’s income. Among respon-
dents with a household income under $40,000,
45 percent report that they had gone without some
form of medical treatment in the preceding
12 months. This fraction is 31 percent among respon-
dents with incomes between $40,000 and $100,000,
and just 16 percent among respondents making over
$100,000.
Similarly, cash on hand is closely related to the deci-
sion to forego medical treatment due to the cost. Of
the people who would not cover a $400 emergency
expense using cash or its functional equivalent,
47 percent also avoided medical treatment because of
the cost. In comparison, just 17 percent of respon-
dents who would cover the $400 emergency expense
using cash or a credit card that they pay in full at the
next statement report avoiding medical treatment
because of the cost.
One potential avenue for alleviating this inability to
cover health care expenses is through health insur-
ance, which can reduce the probability of large
expenses and/or reduce the expected size of such
Figure 8. During the past 12 months, was there a time when you needed any of the following, but didn’t get it becauseyou couldn’t afford it?
25
15
13
11
8
6
Dental care
To see a doctor
Prescription medicine
To see a specialist
Follow-up care
Mental health care or counseling
Percent
Table 8. Health insurance coverage (by age)
Percent, except as noted
Age categories Not insured Insured
18–29 14.8 81.3
30–44 12.4 86.5
45–64 8.7 91.0
65+ 0.9 99.1
Overall 9.5 89.3
Total number of respondents 5,896
May 2015 19
expenses. According to the survey, 89 percent of
respondents were covered by some type of health
insurance or health coverage plan when the survey
was conducted, which is up from 85 percent who
were insured in the 2013 survey. Approximately 3 per-
cent of respondents report receiving their insurance
through a Health Insurance Exchange. The 89 per-
cent of respondents with health insurance coverage
includes approximately 87 percent of people ages
18 to 64 who are insured, and more than 99 percent
of people over age 65 who have health insurance
(table 8).
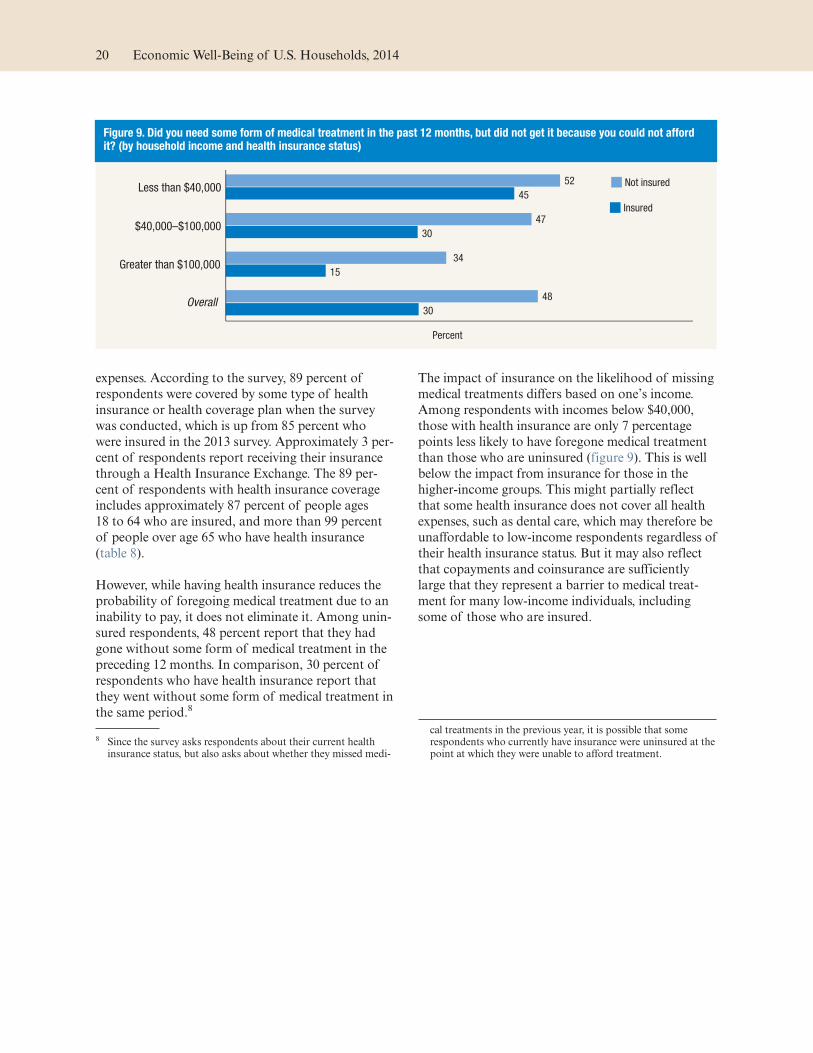
However, while having health insurance reduces the
probability of foregoing medical treatment due to an
inability to pay, it does not eliminate it. Among unin-
sured respondents, 48 percent report that they had
gone without some form of medical treatment in the
preceding 12 months. In comparison, 30 percent of
respondents who have health insurance report that
they went without some form of medical treatment in
the same period.8
The impact of insurance on the likelihood of missing
medical treatments differs based on one’s income.
Among respondents with incomes below $40,000,
those with health insurance are only 7 percentage
points less likely to have foregone medical treatment
than those who are uninsured (figure 9). This is well
below the impact from insurance for those in the
higher-income groups. This might partially reflect
that some health insurance does not cover all health
expenses, such as dental care, which may therefore be
unaffordable to low-income respondents regardless of
their health insurance status. But it may also reflect
that copayments and coinsurance are sufficiently
large that they represent a barrier to medical treat-
ment for many low-income individuals, including
some of those who are insured.
8 Since the survey asks respondents about their current healthinsurance status, but also asks about whether they missed medi-
cal treatments in the previous year, it is possible that somerespondents who currently have insurance were uninsured at thepoint at which they were unable to afford treatment.
Figure 9. Did you need some form of medical treatment in the past 12 months, but did not get it because you could not affordit? (by household income and health insurance status)
52
47
34
48
45
30
15
30
Less than $40,000
$40,000–$100,000
Greater than $100,000
Overall
Percent
Not insured
Insured
20 Economic Well-Being of U.S. Households, 2014

Savings and Spending
An important measure of economic well-being is
whether respondents feel that they have sufficient
income to cover their expenses without incurring
debt. To capture the extent to which individuals feel
that they are able to both pay for expenses and save
for the future, the survey asks a series of questions
related to their spending and their level of savings.
Most respondents report that they saved at least
some of their income in the past year, although a
sizeable minority indicate that their spending exceeds
their income. The survey also demonstrates that
spending and savings behaviors differ greatly by
income, as lower-income respondents are less likely
than higher-income respondents to be saving and
more likely to be spending more than they make.
Additionally, lower-income respondents who manage
to save are more likely to be doing so for short-term
needs, such as unexpected expenses, rather than long-
term events, such as retirement.
Spending Relative to Income
When asked how their spending compares to their
income, 41 percent say that they spent less than they
made in the past year and 37 percent report that their
spending was equal to their income. However, one-in-
five respondents report that their spending exceeded
their income.
Lower-income respondents are more likely to report
that their spending exceeded their income than those
at higher-income levels, as over a quarter of respon-
dents with incomes under $40,000 indicate that their
spending exceeded their income (figure 10). For some
respondents, this may be indicative of an inability to
finance a reasonable standard of living at their cur-
rent salary. However, the survey also offers evidence
that the higher level of debt-financed or savings-
financed consumption among low-income respon-
dents may be related to economic hardships. Among
low-income respondents who did not experience an
economic hardship in the past year, 18 percent say
that their spending exceeded their income. However,
among low-income respondents who experienced a
hardship, 46 percent say that their spending exceeded
their income.
Although responses to this question vary by income,
they do not vary much by age. Respondents ages
18 to 29 and ages 30 to 44 are each equally likely
Figure 10. In the past 12 months, would you say that your household’s total spending was more, less, or the same as yourincome? (by household income)
27
18
15
20
43
37
29
37
28
43
54
41
0 10 20 30 40 50 60 70 80 90 100
Less than $40,000
$40,000–$100,000
Greater than $100,000
Overall
Percent
Spending exceeds income Spending equals income Spending less than income
21

(22 percent) to report that their spending exceeds
their income. This is only slightly higher than among
those ages 45 to 59 (19 percent), and those over age
60 (18 percent).
Savings Rate and Reasons for Saving
The survey obtains additional detail on individuals’
savings rates by directly asking respondents who are
not fully retired what portion of their income was set
aside as savings. This question specifically asks
respondents to include 401(k) savings and other
retirement savings facilitated through work, thereby
prompting them to consider savings more broadly
than just funds saved out of their take-home pay.
Considering this broad savings measure, 62 percent
of respondents who are not fully retired indicate that
they saved at least a portion of their income in the
past year, while 30 percent say that they saved noth-
ing and 8 percent did not specify the amount saved.
Among respondents who did save, the average sav-
ings rate was 15 percent and the median was
10 percent.
Reflecting differences in disposable resources, the
likelihood of saving is closely related to one’s income.
Thirty-nine percent of respondents with a household
income under $40,000 per year saved some of their
income in the past year, whereas 67 percent of those
in the middle income group and 79 percent in the
highest income group indicate that they saved a por-
tion of their income (figure 11). However, among
those who saved at least a portion of their income,
there are few differences in the average rate of sav-
ings, with those of all three income categories saving
an average of 14 to 16 percent and a median of
10 percent of their income.
The survey asks those who saved to select all of the
applicable reasons for why they were saving. The top
Figure 11. Percent of income saved among non-retirees (by household income)
53
15
11
5
8
8
25
24
18
14
12
8
14
20
21
20
18
7
30
20
17
13
13
8
Zero
1–5%
6–10%
11–20%
21%+
Did not state amount saved
Less than $40,000
$40,000–$100,000
Greater than $100,000
Overall
Percent of respondents
Note: Among respondents not currently retired.
22 Economic Well-Being of U.S. Households, 2014

reasons for saving are for their retirement (57 per-
cent), unexpected expenses (57 percent), and “just to
save” (50 percent).
The frequency of these common reasons for saving
differ, however, based on where respondents fall in
the income distribution (table 9). Among savers mak-
ing over $100,000, retirement is the most commonly
cited reason for saving—mentioned by 70 percent of
respondents. This exceeds the 58 percent in this
income group who are saving for unexpected
expenses. The middle income category of respon-
dents who saved some of their income say they are
saving for retirement (54 percent) about as frequently
as unexpected expenses (57 percent). However,
among respondents who saved some of their income
and make under $40,000, only 37 percent say that
they are saving for retirement, compared to 53 per-
cent who are saving for unexpected expenses.
Table 9. Which of the following categories, if any, are yousaving money for? (by household income)
Percent responding yes, except as noted
Less than$40,000
$40,000–$100,000
Greaterthan
$100,000Overall
Retirement 37.4 54.2 70.1 57.1
Unexpected expenses 53.2 57.1 58.0 56.7
Just to save 49.5 50.0 51.4 50.4
Pay off debts 28.5 31.4 25.4 28.6
Your children 22.3 24.3 27.1 25.0
Major appliance 25.0 25.0 21.6 23.7
Education 15.8 15.7 24.8 19.2
Home purchase 18.5 17.7 13.6 16.3
Taxes 11.5 13.4 20.3 15.7
Leave inheritance orcharitable donation 7.8 8.1 11.6 9.3
Other 4.9 3.5 4.1 4.0
Total number of respondents 2,587
Note: Among respondents who report saving some part of their income.
May 2015 23


Banking, Credit Access, and Credit Usage
Banking and credit access can be important tools for
wealth accumulation and for establishing the
resources to withstand short-term economic hard-
ships. Given the importance of banking and credit
for economic well-being and individuals’ long-run
economic trajectory, the SHED asks several ques-
tions pertaining to the use of banking services, credit
availability, and the demand for credit among respon-
dents. The survey finds that lacking a bank account
or using alternative financial services is prevalent
among lower-income respondents. The results also
show that a sizeable minority of those who applied
for credit had difficulties getting approved. However,
despite the challenges that some face when trying to
access credit, a majority of respondents do feel that
credit is available to them should they desire it.
Unbanked and Underbanked
Based on the results of the survey, 8 percent of
respondents are considered unbanked, as they do not
have a checking, savings, or money market account.
A further 12 percent of respondents are under-
banked, defined as having a bank account but also
using an alternative financial service such as a check
cashing service, money order, pawn shop loan, auto
title loan, paycheck advance, or payday loan.9
The likelihood of being unbanked or underbanked
varies substantially by income, with lower-income
respondents being much less likely to have a tradi-
tional banking relationship (table 10). Among
respondents with incomes under $40,000 per year,
17 percent are unbanked and 19 percent are
underbanked.
Access to Credit
The survey also inquires about respondents’ demand
for credit in the past year. Thirty-seven percent of
respondents applied for some type of credit in the
prior 12 months, up from 31 percent in the 2013 sur-
vey. Among those who applied for credit, credit cards
and auto loans were the most common application
types, with 65 percent reporting that they applied for
a credit card and 26 percent reporting that they
applied for an auto loan (figure 12).
Twenty-four percent of respondents who applied for
credit were denied credit at least once (9 percent of
the entire population). However, some respondents
who applied for credit were also limited in their credit
access without receiving an outright denial—either
by being offered less credit than they desired or by
putting off a credit application because they expected
to be denied (table 11). Overall, 32 percent of respon-
dents who applied for credit were either denied out-
right or offered less credit than they applied for.
Thirty-five percent of those who applied were denied,
offered less credit, or put off applying for additional
credit due to a fear of denial.
9 Among the respondents who do not have a checking, savings, ormoney market account, 63 percent use some form of alternativefinancial services, while 36 percent neither have a traditionalbank account nor use alternative financial services.
The percentage of respondents who report not having a bankaccount in the SHED is similar to that seen in the 2013 FederalDeposit Insurance Corporation (FDIC) National Survey ofUnbanked and Underbanked Households, which found that7.7 percent of households do not have a bank account (seewww.fdic.gov/householdsurvey/2013report.pdf). The fraction ofSHED respondents who are underbanked, however, is lowerthan that seen in the FDIC survey. This partially reflects differ-ences in definitions of who is underbanked, as the FDIC surveyconsiders individuals who used remittances as underbankedwhile the SHED does not.
Table 10. Unbanked and underbanked respondents(by household income)
Percent, except as noted
Income categories Fully banked Unbanked Underbanked
Less than $40,000 63.2 16.7 19.2
$40,000–$100,000 83.2 4.6 11.3
Greater than $100,000 92.3 1.6 5.6
Overall 79.4 7.6 12.2
Total number of respondents 5,896
25

The survey also asks respondents who did not apply
for credit whether they desired credit but chose not to
submit an application. Twelve percent of respondents
who did not submit a credit application in the past
year report that they had a desire for additional
credit. When asked why they did not act on their
desire for credit by submitting an application, these
respondents were closely split between thinking that
their application would be denied and simply not
wanting to take on more debt (figure 13).
Considering the entire population, including both
those who applied and did not apply for credit,
16 percent of respondents indicate that they were
denied credit outright, offered less credit than they
desired, or thought they would be denied so put off
some or all of their credit applications. The rate of
denial, or expected denial, is higher among respon-
dents with incomes under $40,000. Among respon-
dents in this income group, 24 percent of respon-
dents were denied credit, offered less credit, or
thought they would be denied.
The survey also finds that respondents who are
denied credit, offered less credit, or who expected to
be denied are more likely to have used some form of
alternative financial services in the prior year. Thirty-
eight percent of these individuals used alternative
financial services, which compares to 15 percent of
the overall population who did so. This may indicate
that some individuals who cannot receive credit
through traditional channels are turning to alterna-
tive financial services instead. However, it also may
reflect underlying differences in either the credit
needs, creditworthiness, or financial choices of those
who use alternative financial services and those who
do not.
Figure 12. Types of credit applied for in the past 12 months
65
26
13
7
7
6
6
8
Credit card
Car/auto loan
Student loan
Re�nance of a home mortgage
Mortgage to buy a new home
Home equity loan or line of credit
Personal loan from friends or family
Other
Percent
Note: Among respondents who reported having applied for credit in prior 12 months.
Table 11. In the past 12 months, has each of the followinghappened to you?
Percent, except as noted
Yes No
Denied credit 24.4 73.6
Offered less credit than applied for 15.5 81.1
Also put off applying for other credit because youthought you would be denied 18.7 78.0
Total number of respondents 2,054
Note: Among those who reported having applied for credit in prior 12 months.
Figure 13. Why did you choose not to submit a creditapplication when you desired credit in the past 12 months?
Thought you
might be
denied, 40%
Did not want
more debt, 44%
Obtained money
some other way,
7%
Other/refused, 9%
Note: Among respondents who desired credit in the past 12 months but did notsubmit a credit application.
26 Economic Well-Being of U.S. Households, 2014
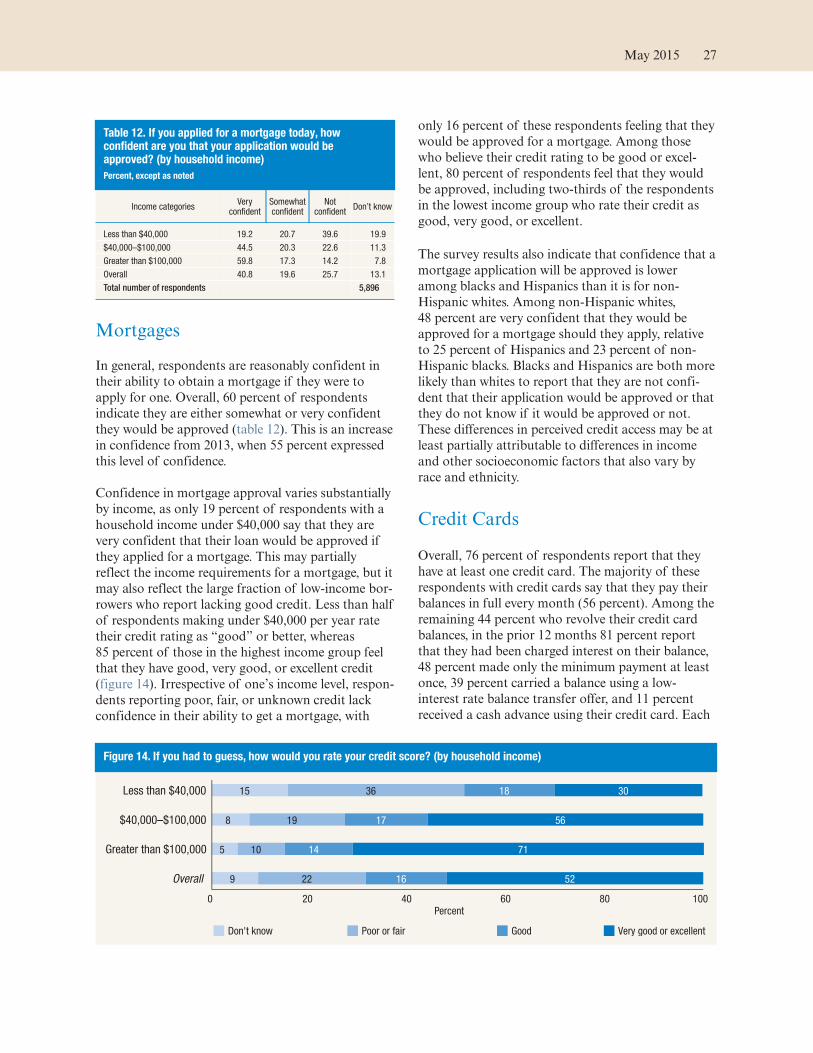
Mortgages
In general, respondents are reasonably confident in
their ability to obtain a mortgage if they were to
apply for one. Overall, 60 percent of respondents
indicate they are either somewhat or very confident
they would be approved (table 12). This is an increase
in confidence from 2013, when 55 percent expressed
this level of confidence.
Confidence in mortgage approval varies substantially
by income, as only 19 percent of respondents with a
household income under $40,000 say that they are
very confident that their loan would be approved if
they applied for a mortgage. This may partially
reflect the income requirements for a mortgage, but it
may also reflect the large fraction of low-income bor-
rowers who report lacking good credit. Less than half
of respondents making under $40,000 per year rate
their credit rating as “good” or better, whereas
85 percent of those in the highest income group feel
that they have good, very good, or excellent credit
(figure 14). Irrespective of one’s income level, respon-
dents reporting poor, fair, or unknown credit lack
confidence in their ability to get a mortgage, with
only 16 percent of these respondents feeling that they
would be approved for a mortgage. Among those
who believe their credit rating to be good or excel-
lent, 80 percent of respondents feel that they would
be approved, including two-thirds of the respondents
in the lowest income group who rate their credit as
good, very good, or excellent.
The survey results also indicate that confidence that a
mortgage application will be approved is lower
among blacks and Hispanics than it is for non-
Hispanic whites. Among non-Hispanic whites,
48 percent are very confident that they would be
approved for a mortgage should they apply, relative
to 25 percent of Hispanics and 23 percent of non-
Hispanic blacks. Blacks and Hispanics are both more
likely than whites to report that they are not confi-
dent that their application would be approved or that
they do not know if it would be approved or not.
These differences in perceived credit access may be at
least partially attributable to differences in income
and other socioeconomic factors that also vary by
race and ethnicity.
Credit Cards
Overall, 76 percent of respondents report that they
have at least one credit card. The majority of these
respondents with credit cards say that they pay their
balances in full every month (56 percent). Among the
remaining 44 percent who revolve their credit card
balances, in the prior 12 months 81 percent report
that they had been charged interest on their balance,
48 percent made only the minimum payment at least
once, 39 percent carried a balance using a low-
interest rate balance transfer offer, and 11 percent
received a cash advance using their credit card. Each
Table 12. If you applied for a mortgage today, howconfident are you that your application would beapproved? (by household income)
Percent, except as noted
Income categoriesVery
confidentSomewhatconfident
Notconfident
Don’t know
Less than $40,000 19.2 20.7 39.6 19.9
$40,000–$100,000 44.5 20.3 22.6 11.3
Greater than $100,000 59.8 17.3 14.2 7.8
Overall 40.8 19.6 25.7 13.1
Total number of respondents 5,896
Figure 14. If you had to guess, how would you rate your credit score? (by household income)
15
8
5
9
36
19
10
22
18
17
14
16
30
56
71
52
0 20 40 60 80 100
Less than $40,000
$40,000–$100,000
Greater than $100,000
Overall
Percent
Don't know Poor or fair Good Very good or excellent
May 2015 27
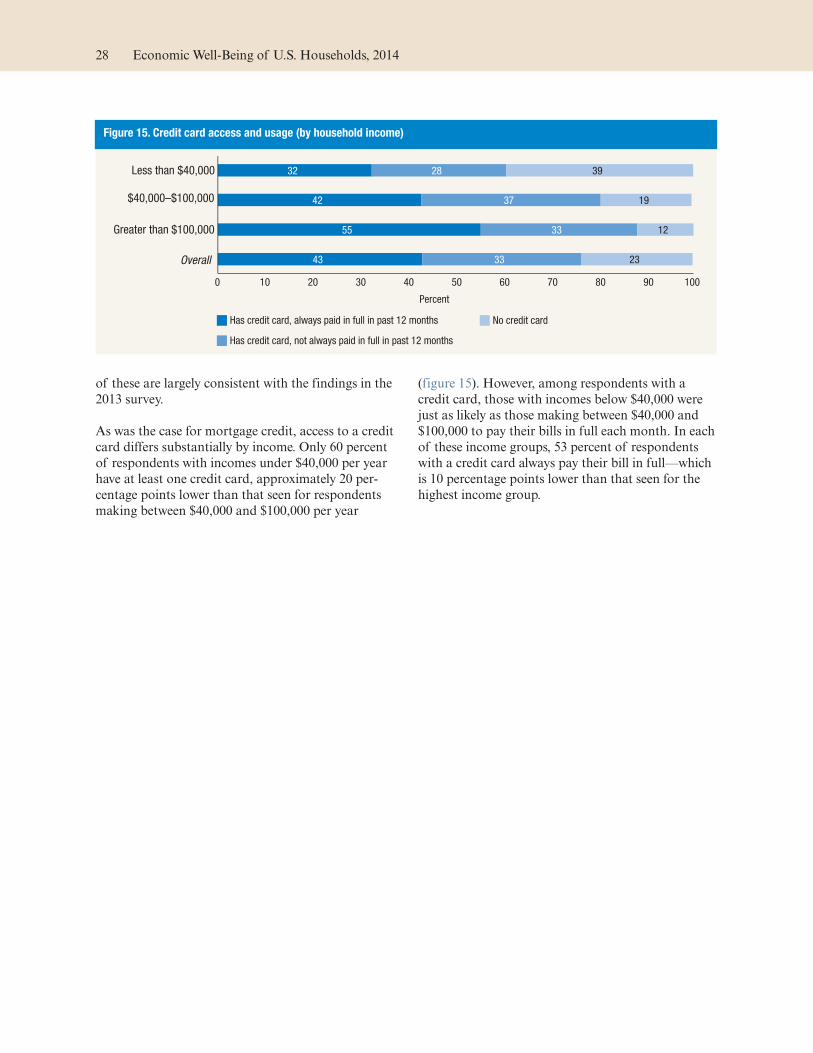
of these are largely consistent with the findings in the
2013 survey.
As was the case for mortgage credit, access to a credit
card differs substantially by income. Only 60 percent
of respondents with incomes under $40,000 per year
have at least one credit card, approximately 20 per-
centage points lower than that seen for respondents
making between $40,000 and $100,000 per year
(figure 15). However, among respondents with a
credit card, those with incomes below $40,000 were
just as likely as those making between $40,000 and
$100,000 to pay their bills in full each month. In each
of these income groups, 53 percent of respondents
with a credit card always pay their bill in full—which
is 10 percentage points lower than that seen for the
highest income group.
Figure 15. Credit card access and usage (by household income)
32
42
55
43
28
37
33
33
39
19
12
23
0 10 20 30 40 50 60 70 80 90 100
Less than $40,000
$40,000–$100,000
Greater than $100,000
Overall
Percent
Has credit card, always paid in full in past 12 months
Has credit card, not always paid in full in past 12 months
No credit card
28 Economic Well-Being of U.S. Households, 2014
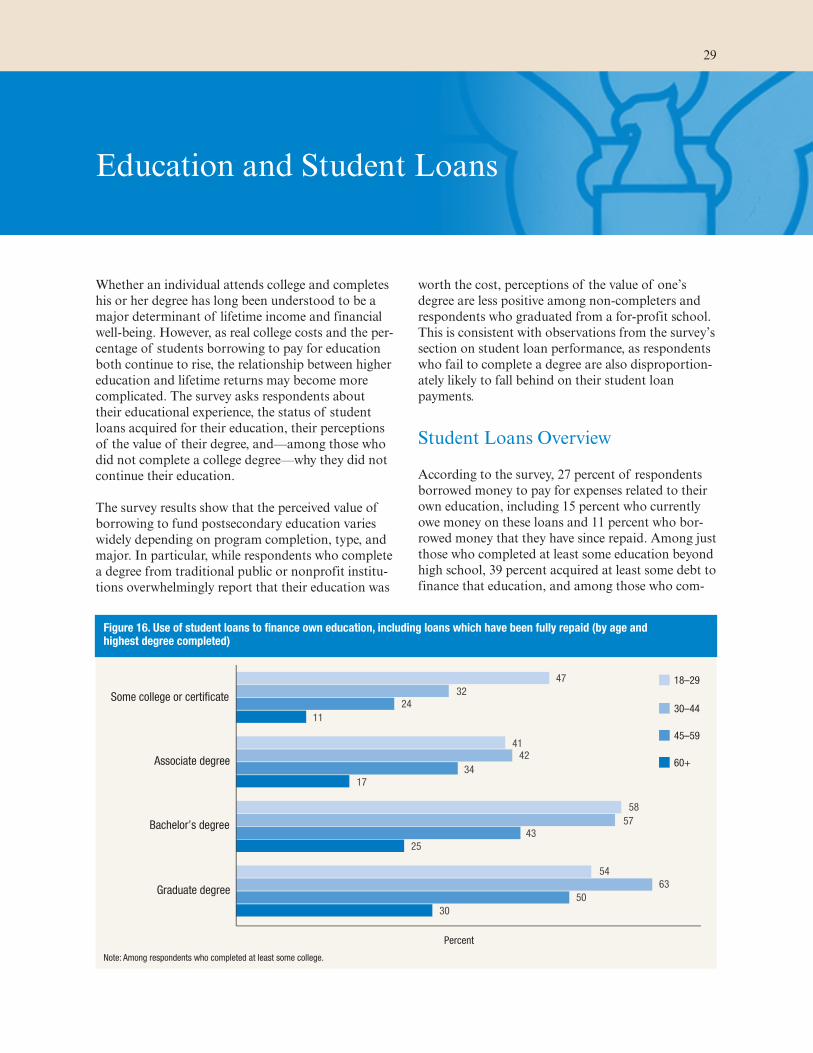
Education and Student Loans
Whether an individual attends college and completes
his or her degree has long been understood to be a
major determinant of lifetime income and financial
well-being. However, as real college costs and the per-
centage of students borrowing to pay for education
both continue to rise, the relationship between higher
education and lifetime returns may become more
complicated. The survey asks respondents about
their educational experience, the status of student
loans acquired for their education, their perceptions
of the value of their degree, and—among those who
did not complete a college degree—why they did not
continue their education.
The survey results show that the perceived value of
borrowing to fund postsecondary education varies
widely depending on program completion, type, and
major. In particular, while respondents who complete
a degree from traditional public or nonprofit institu-
tions overwhelmingly report that their education was
worth the cost, perceptions of the value of one’s
degree are less positive among non-completers and
respondents who graduated from a for-profit school.
This is consistent with observations from the survey’s
section on student loan performance, as respondents
who fail to complete a degree are also disproportion-
ately likely to fall behind on their student loan
payments.
Student Loans Overview
According to the survey, 27 percent of respondents
borrowed money to pay for expenses related to their
own education, including 15 percent who currently
owe money on these loans and 11 percent who bor-
rowed money that they have since repaid. Among just
those who completed at least some education beyond
high school, 39 percent acquired at least some debt to
finance that education, and among those who com-
Figure 16. Use of student loans to finance own education, including loans which have been fully repaid (by age andhighest degree completed)
47
41
58
54
32
42
57
63
24
34
43
50
11
17
25
30
Some college or certi!cate
Associate degree
Bachelor’s degree
Graduate degree
18–29
30–44
45–59
60+
Percent
Note: Among respondents who completed at least some college.
29
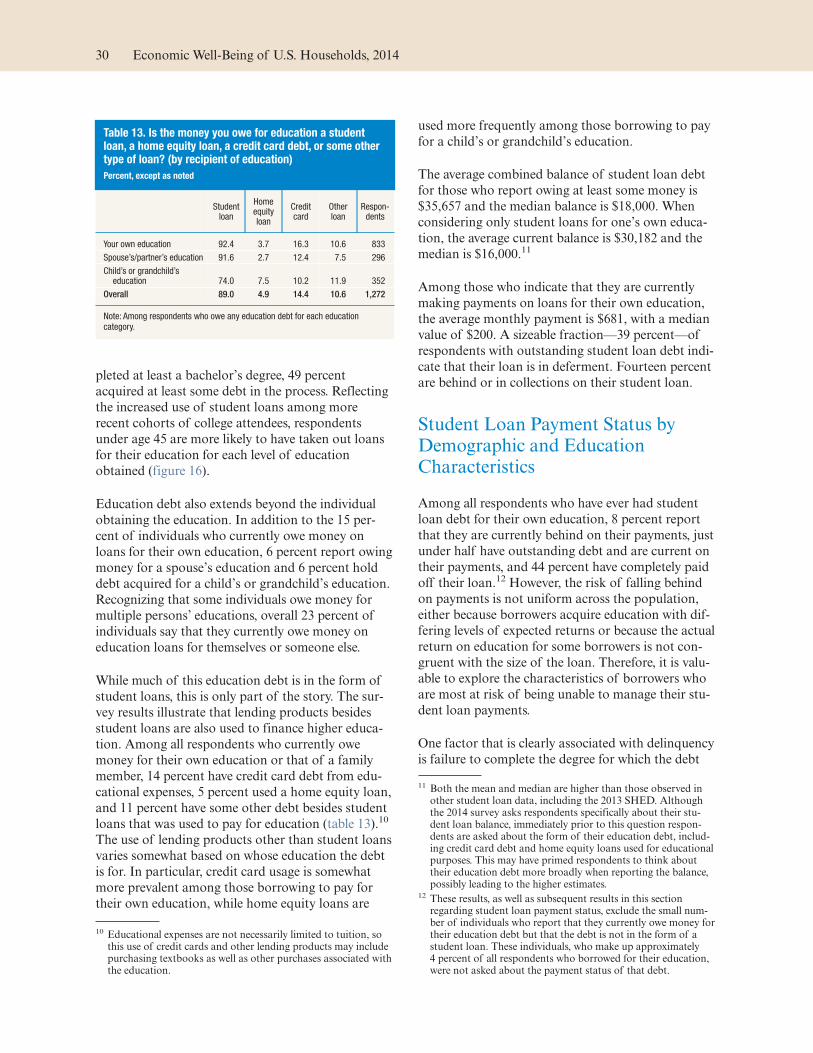
pleted at least a bachelor’s degree, 49 percent
acquired at least some debt in the process. Reflecting
the increased use of student loans among more
recent cohorts of college attendees, respondents
under age 45 are more likely to have taken out loans
for their education for each level of education
obtained (figure 16).
Education debt also extends beyond the individual
obtaining the education. In addition to the 15 per-
cent of individuals who currently owe money on
loans for their own education, 6 percent report owing
money for a spouse’s education and 6 percent hold
debt acquired for a child’s or grandchild’s education.
Recognizing that some individuals owe money for
multiple persons’ educations, overall 23 percent of
individuals say that they currently owe money on
education loans for themselves or someone else.
While much of this education debt is in the form of
student loans, this is only part of the story. The sur-
vey results illustrate that lending products besides
student loans are also used to finance higher educa-
tion. Among all respondents who currently owe
money for their own education or that of a family
member, 14 percent have credit card debt from edu-
cational expenses, 5 percent used a home equity loan,
and 11 percent have some other debt besides student
loans that was used to pay for education (table 13).10
The use of lending products other than student loans
varies somewhat based on whose education the debt
is for. In particular, credit card usage is somewhat
more prevalent among those borrowing to pay for
their own education, while home equity loans are
used more frequently among those borrowing to pay
for a child’s or grandchild’s education.
The average combined balance of student loan debt
for those who report owing at least some money is
$35,657 and the median balance is $18,000. When
considering only student loans for one’s own educa-
tion, the average current balance is $30,182 and the
median is $16,000.11
Among those who indicate that they are currently
making payments on loans for their own education,
the average monthly payment is $681, with a median
value of $200. A sizeable fraction—39 percent—of
respondents with outstanding student loan debt indi-
cate that their loan is in deferment. Fourteen percent
are behind or in collections on their student loan.
Student Loan Payment Status byDemographic and EducationCharacteristics
Among all respondents who have ever had student
loan debt for their own education, 8 percent report
that they are currently behind on their payments, just
under half have outstanding debt and are current on
their payments, and 44 percent have completely paid
off their loan.12 However, the risk of falling behind
on payments is not uniform across the population,
either because borrowers acquire education with dif-
fering levels of expected returns or because the actual
return on education for some borrowers is not con-
gruent with the size of the loan. Therefore, it is valu-
able to explore the characteristics of borrowers who
are most at risk of being unable to manage their stu-
dent loan payments.
One factor that is clearly associated with delinquency
is failure to complete the degree for which the debt
10 Educational expenses are not necessarily limited to tuition, sothis use of credit cards and other lending products may includepurchasing textbooks as well as other purchases associated withthe education.
11 Both the mean and median are higher than those observed inother student loan data, including the 2013 SHED. Althoughthe 2014 survey asks respondents specifically about their stu-dent loan balance, immediately prior to this question respon-dents are asked about the form of their education debt, includ-ing credit card debt and home equity loans used for educationalpurposes. This may have primed respondents to think abouttheir education debt more broadly when reporting the balance,possibly leading to the higher estimates.
12 These results, as well as subsequent results in this sectionregarding student loan payment status, exclude the small num-ber of individuals who report that they currently owe money fortheir education debt but that the debt is not in the form of astudent loan. These individuals, who make up approximately4 percent of all respondents who borrowed for their education,were not asked about the payment status of that debt.
Table 13. Is the money you owe for education a studentloan, a home equity loan, a credit card debt, or some othertype of loan? (by recipient of education)
Percent, except as noted
Studentloan
Homeequityloan
Creditcard
Otherloan
Respon-dents
Your own education 92.4 3.7 16.3 10.6 833
Spouse’s/partner’s education 91.6 2.7 12.4 7.5 296
Child’s or grandchild’seducation 74.0 7.5 10.2 11.9 352
Overall 89.0 4.9 14.4 10.6 1,272
Note: Among respondents who owe any education debt for each educationcategory.
30 Economic Well-Being of U.S. Households, 2014
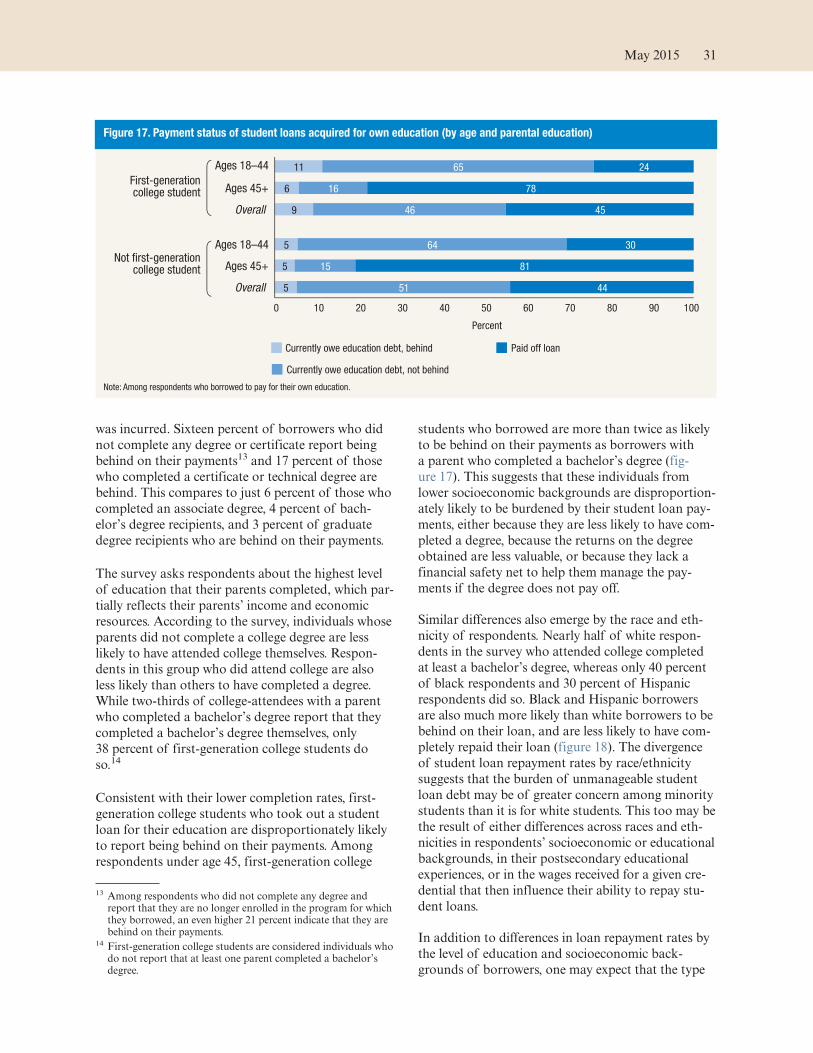
was incurred. Sixteen percent of borrowers who did
not complete any degree or certificate report being
behind on their payments13 and 17 percent of those
who completed a certificate or technical degree are
behind. This compares to just 6 percent of those who
completed an associate degree, 4 percent of bach-
elor’s degree recipients, and 3 percent of graduate
degree recipients who are behind on their payments.
The survey asks respondents about the highest level
of education that their parents completed, which par-
tially reflects their parents’ income and economic
resources. According to the survey, individuals whose
parents did not complete a college degree are less
likely to have attended college themselves. Respon-
dents in this group who did attend college are also
less likely than others to have completed a degree.
While two-thirds of college-attendees with a parent
who completed a bachelor’s degree report that they
completed a bachelor’s degree themselves, only
38 percent of first-generation college students do
so.14
Consistent with their lower completion rates, first-
generation college students who took out a student
loan for their education are disproportionately likely
to report being behind on their payments. Among
respondents under age 45, first-generation college
students who borrowed are more than twice as likely
to be behind on their payments as borrowers with
a parent who completed a bachelor’s degree (fig-
ure 17). This suggests that these individuals from
lower socioeconomic backgrounds are disproportion-
ately likely to be burdened by their student loan pay-
ments, either because they are less likely to have com-
pleted a degree, because the returns on the degree
obtained are less valuable, or because they lack a
financial safety net to help them manage the pay-
ments if the degree does not pay off.
Similar differences also emerge by the race and eth-
nicity of respondents. Nearly half of white respon-
dents in the survey who attended college completed
at least a bachelor’s degree, whereas only 40 percent
of black respondents and 30 percent of Hispanic
respondents did so. Black and Hispanic borrowers
are also much more likely than white borrowers to be
behind on their loan, and are less likely to have com-
pletely repaid their loan (figure 18). The divergence
of student loan repayment rates by race/ethnicity
suggests that the burden of unmanageable student
loan debt may be of greater concern among minority
students than it is for white students. This too may be
the result of either differences across races and eth-
nicities in respondents’ socioeconomic or educational
backgrounds, in their postsecondary educational
experiences, or in the wages received for a given cre-
dential that then influence their ability to repay stu-
dent loans.
In addition to differences in loan repayment rates by
the level of education and socioeconomic back-
grounds of borrowers, one may expect that the type
13 Among respondents who did not complete any degree andreport that they are no longer enrolled in the program for whichthey borrowed, an even higher 21 percent indicate that they arebehind on their payments.
14 First-generation college students are considered individuals whodo not report that at least one parent completed a bachelor’sdegree.
Figure 17. Payment status of student loans acquired for own education (by age and parental education)
11
6
9
5
5
5
65
16
46
64
15
51
24
78
45
30
81
44
0 10 20 30 40 50 60 70 80 90 100
Ages 18–44
Ages 45+
Overall
Ages 18–44
Ages 45+
Overall
First-generation college student
Not !rst-generationcollege student
Percent
Currently owe education debt, behind
Currently owe education debt, not behind
Paid off loan
Note: Among respondents who borrowed to pay for their own education.
May 2015 31

of institution attended could impact the ability to
repay student loans. These differences can be
explored since the survey asks respondents the name
of the institution attended for their undergraduate
education or, in the case of students who did not
complete at least an associate degree, their most
recent educational program. Institutions can then be
separated into for-profit, nonprofit, and public
schools using the Carnegie Classification of Institu-
tions of Higher Education™.15
The survey observes that borrowers who attended
for-profit institutions are more likely to report being
behind on student loans payments than those who
attended public or nonprofit schools (table 14). While
6 percent of students who attended a public institu-
tion are behind on their student loan payments,
16 percent of those who attended a for-profit institu-
tion report that they are behind.
This high default rate for students who attended for-
profit institutions may be partially attributable to dif-
ferences in the rate of return across education sec-
tors.16 However, just as degree completion is closely
related to the socioeconomic and demographic back-
grounds of students, students attending for-profit
institutions are disproportionately likely to be first-
generation college students or minority students and
are less likely to complete their degree. Over 95 per-
cent of respondents who attended for-profit institu-
tions went to either part-time/two-year institutions or
to institutions classified by the Carnegie Classifica-
tion™ as having inclusive admissions criteria. In con-
trast, over half of students attending nonprofit or
public institutions went to schools with selective or
more selective admissions.17
15 For more details on the Carnegie Classification, see http://carnegieclassifications.iu.edu/.
16 See David J. Deming, Claudia Goldin, and Lawrence F. Katz(2012), “The For-Profit Postsecondary School Sector: NimbleCritters or Agile Predators?” Journal of Economic Perspectives,vol. 26 (1), pp. 139–64, for a discussion of the rates of return byeducation sector.
17 The Carnegie Classification™ defines selective institutions asthose whose first-year students’ test scores place most of theseinstitutions in roughly the middle two-fifths of baccalaureateinstitutions and more selective institutions as those whose first-year students’ test scores place these institutions in roughly thetop fifth of baccalaureate institutions. Inclusive institutions
Figure 18. Payment status of student loans acquired for own education (by race/ethnicity and age)
5
2
4
16
11
14
20
10
18
67
13
46
73
25
54
53
30
49
29
85
50
11
64
32
27
60
33
0 10 20 30 40 50 60 70 80 90 100
Ages 18–44
Ages 45+
Overall
Ages 18–44
Ages 45+
Overall
Ages 18–44
Ages 45+
Overall
White,
non-Hispanic
Black,
non-Hispanic
Hispanic
Percent
Currently owe education debt, behind Currently owe education debt, not behind Paid off loan
Note: Among respondents who borrowed to pay for their own education.
Table 14. Payment status of student loans acquired forown education (by sector of institution attended)
Percent, except as noted
Currently oweeducation debt,
behind
Currently oweeducation debt,not behind
Paid offloan
Public 5.8 50.6 43.7
Private nonprofit 3.3 44.6 52.1
Private for-profit 16.4 60.3 23.4
Overall 7.9 48.0 44.1
Total number of respondents 1,461
Note: Among respondents who took out student loans for their own education.
32 Economic Well-Being of U.S. Households, 2014

One way to assess whether the differences in payment
status between for-profit, nonprofit, and public insti-
tutions is simply due to difference in their selectivity
is by comparing the student loan payment status of
respondents who attended for-profit schools to those
who attended two-year or inclusive public or non-
profit institutions, and excluding those who attended
selective public or nonprofit schools. These two-year
and inclusive institutions have admissions profiles
closer to those of many for-profit institutions. When
doing so, the gap between public, nonprofit, and for-
profit institutions shrinks but does not disappear
completely. Nine percent of students who borrowed
to attend a two-year or inclusive public or nonprofit
institution report that they are behind on their stu-
dent loans. While this is a higher rate of being behind
on loans than that seen for all students attending
public or nonprofit institutions, it remains below the
16 percent of students who borrowed to attend a for-
profit institution that are behind.
Student loan repayment status is likely related to a
number of factors, including the returns to educa-
tion, the economic resources of the borrower, as well
as the educational preparation of students prior to
enrolling in college. The high rate of being behind on
loans among individuals who attended for-profit
institutions, who are first-generation college students,
or who fail to complete their degree suggests that
some combination of these explanations impacts the
likelihood of default. However, the close link
between these educational characteristics and demo-
graphic characteristics also means that further
research is necessary to fully separate the various
potential explanations.
Value of Higher Education byEducational Characteristics
To obtain further information about the perceived
returns to higher education, the survey also asks all
respondents who attended at least some college,
including those who did not borrow for their educa-
tion, whether they feel that the lifetime financial ben-
efits of their education outweigh the lifetime finan-
cial costs. As was the case for the payment status on
student loans, responses to this question vary sub-
stantially based on demographics of the respondent
and the characteristics of their education.
The more education that respondents completed, the
more likely they are to indicate that the benefits of
their undergraduate education exceed the costs.
Among individuals with some education beyond high
school but who did not complete at least an associate
degree, just 33 percent say that the financial benefits
of that education exceed the costs, while 30 percent
say that the costs outweighed the benefits. However,
43 percent of those completing an associate degree,
61 percent of those completing a bachelor’s degree,
and 80 percent of those completing a graduate
degree indicate that the financial benefits of their
undergraduate education exceed the costs. (Just over
75 percent of respondents who have a graduate
degree also say that the lifetime financial benefits of
their graduate degree exceed the costs.)
The impact of completing a degree on the perceived
value of the education differs substantially based on
the type of institution attended. Among respondents
who attended a for-profit institution, whether the
individual completed their degree has almost no
impact on whether they feel that the education was a
good investment (figure 19).
extend educational opportunities to a wide range of studentswith respect to their academic preparation (see http://carnegieclassifications.iu.edu/descriptions/undergraduate_profile.php for further information on the selectivityclassifications).
Table 15. Overall, how would you say the lifetime financialbenefits of your bachelor’s or associate degree programcompare to its financial costs? (by field of study)
Percent, except as noted
Benefitsoutweighcosts
Aboutthe same
Costsoutweighbenefits
Engineering 79.5 12.7 7.7
Life sciences 74.4 14.9 10.7
Physical sciences/math 69.9 18.9 10.9
Health 67.4 14.0 18.5
Education 67.3 10.7 21.0
Business/management 65.2 20.7 13.5
Computer/information sciences 64.3 24.2 11.6
Law 63.1 19.9 17.1
Social/behavioral sciences 51.1 25.3 23.7
Humanities 50.8 28.4 20.8
Vocational/technical training 45.8 35.9 17.0
Undeclared 36.1 37.5 22.0
Other 49.5 22.6 27.9
Refused to state 20.5 29.0 15.0
Overall 62.7 20.3 16.5
Total number of respondents 2,279
Note: Among respondents who completed at least an associate degree.
May 2015 33
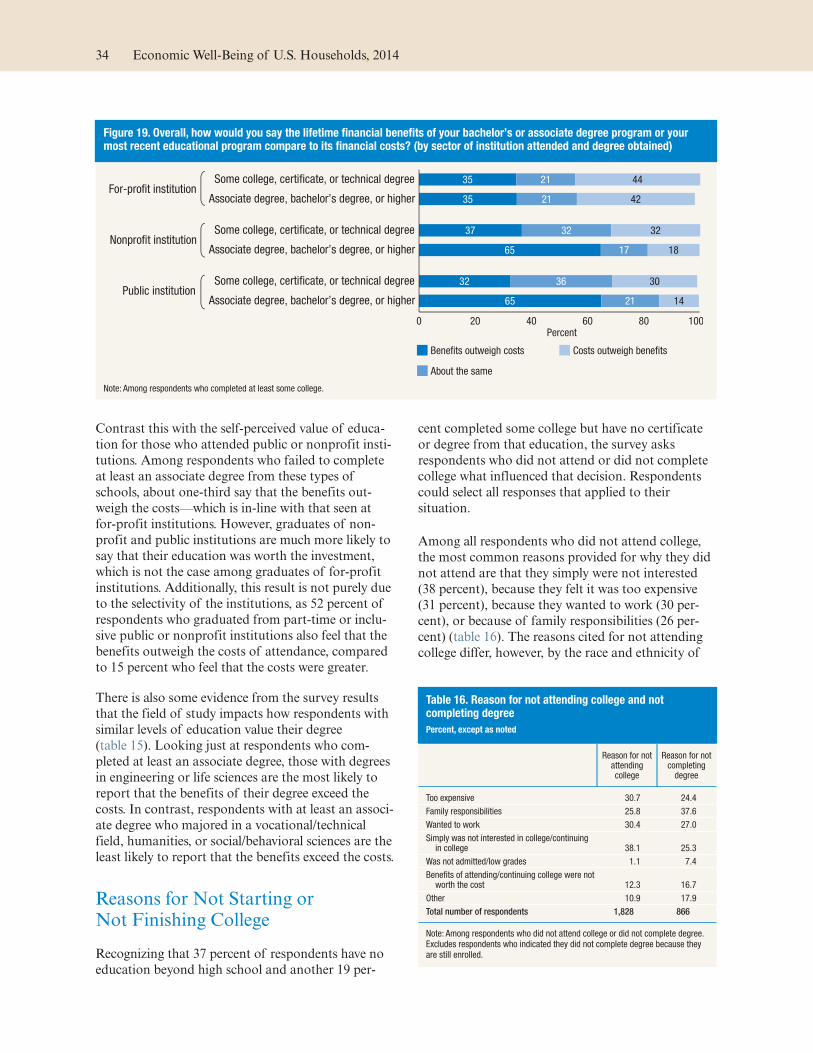
Contrast this with the self-perceived value of educa-
tion for those who attended public or nonprofit insti-
tutions. Among respondents who failed to complete
at least an associate degree from these types of
schools, about one-third say that the benefits out-
weigh the costs—which is in-line with that seen at
for-profit institutions. However, graduates of non-
profit and public institutions are much more likely to
say that their education was worth the investment,
which is not the case among graduates of for-profit
institutions. Additionally, this result is not purely due
to the selectivity of the institutions, as 52 percent of
respondents who graduated from part-time or inclu-
sive public or nonprofit institutions also feel that the
benefits outweigh the costs of attendance, compared
to 15 percent who feel that the costs were greater.
There is also some evidence from the survey results
that the field of study impacts how respondents with
similar levels of education value their degree
(table 15). Looking just at respondents who com-
pleted at least an associate degree, those with degrees
in engineering or life sciences are the most likely to
report that the benefits of their degree exceed the
costs. In contrast, respondents with at least an associ-
ate degree who majored in a vocational/technical
field, humanities, or social/behavioral sciences are the
least likely to report that the benefits exceed the costs.
Reasons for Not Starting orNot Finishing College
Recognizing that 37 percent of respondents have no
education beyond high school and another 19 per-
cent completed some college but have no certificate
or degree from that education, the survey asks
respondents who did not attend or did not complete
college what influenced that decision. Respondents
could select all responses that applied to their
situation.
Among all respondents who did not attend college,
the most common reasons provided for why they did
not attend are that they simply were not interested
(38 percent), because they felt it was too expensive
(31 percent), because they wanted to work (30 per-
cent), or because of family responsibilities (26 per-
cent) (table 16). The reasons cited for not attending
college differ, however, by the race and ethnicity of
Figure 19. Overall, how would you say the lifetime financial benefits of your bachelor’s or associate degree program or yourmost recent educational program compare to its financial costs? (by sector of institution attended and degree obtained)
65
32
65
37
35
35
21
36
17
32
21
21
14
30
18
32
42
44
0 20 40 60 80 100
Associate degree, bachelor’s degree, or higher
Some college, certi!cate, or technical degree
Associate degree, bachelor’s degree, or higher
Some college, certi!cate, or technical degree
Associate degree, bachelor’s degree, or higher
Some college, certi!cate, or technical degree
Public institution
Nonpro!t institution
For-pro!t institution
Percent
Bene!ts outweigh costs
About the same
Costs outweigh bene!ts
Note: Among respondents who completed at least some college.
Table 16. Reason for not attending college and notcompleting degree
Percent, except as noted
Reason for notattendingcollege
Reason for notcompletingdegree
Too expensive 30.7 24.4
Family responsibilities 25.8 37.6
Wanted to work 30.4 27.0
Simply was not interested in college/continuingin college 38.1 25.3
Was not admitted/low grades 1.1 7.4
Benefits of attending/continuing college were notworth the cost 12.3 16.7
Other 10.9 17.9
Total number of respondents 1,828 866
Note: Among respondents who did not attend college or did not complete degree.Excludes respondents who indicated they did not complete degree because theyare still enrolled.
34 Economic Well-Being of U.S. Households, 2014
respondents. A lack of interest is cited most fre-
quently by white respondents (43 percent), but is only
the third-most common response among black and
Hispanic respondents (28 percent each). Hispanic
respondents, instead, most frequently cite family
responsibilities (43 percent) as the reason for not
attending college, while black respondents most fre-
quently indicate that they wanted to work (37 per-
cent) or had family responsibilities (29 percent)
which prevented them from continuing their
education.
Turning to students who attended college but did not
finish and are no longer enrolled, 38 percent say that
they dropped out due to family responsibilities. This
exceeds the fraction seen for any other reason by at
least 11 percentage points. The most common
responses to this question are consistent across racial
and ethnic groups, with blacks, whites, and Hispanics
all citing family responsibilities most frequently as a
reason for not completing their education. However,
Hispanics are more likely than whites or blacks to say
that they left school because it was too expensive,
while whites are more likely than blacks or Hispanics
to say that they left school because they were simply
not interested or because they did not think the ben-
efits were worth the cost.
The reasons why respondents did not complete their
college degree also differ notably by gender. Forty-
three percent of women who started college, but left
without completing their degree, state that family
responsibilities were a reason that they did not con-
tinue their education. This is substantially greater
than the 32 percent of men who say that family
responsibilities prevented them from completing their
degree. The gender gap in citing family responsibili-
ties is at least as large among younger respondents.
Among respondents under age 45 who did not com-
plete their degree, 49 percent of women and 28 per-
cent of men say that family responsibilities played a
role.
May 2015 35


Retirement
Just as education and student loans are important for
the financial well-being of individuals entering adult-
hood, retirement savings and retirement planning are
important for the economic well-being of respon-
dents later in life. To assess respondents’ prepared-
ness for their retirement years, the survey asks ques-
tions that probe their retirement plans, their retire-
ment savings, and their expected path toward
retirement. In general, the results demonstrate that
many individuals want to save for retirement, but also
that many individuals—especially those with lower
incomes—are failing to do so. Additionally, even
among those who are saving for retirement, a major-
ity of respondents indicate that they have no or lim-
ited confidence in their ability to manage their retire-
ment investments.
Planning for Retirement
The survey asks respondents about their planning for
retirement and their progress toward saving for retire-
ment. Although the long-term shift from defined-
benefit (e.g., pension) to defined-contribution (e.g.,
401(k)) plans places significant responsibilities on
individuals to plan for their own retirement, many
respondents are not saving for retirement, lack confi-
dence in their ability to invest their retirement sav-
ings, or appear ill-informed about their retirement
accounts.18
Only 13 percent of respondents who are not cur-
rently retired report that they have given “a lot” of
thought to financial planning for their retirement,
while an additional 21 percent have given it “a fair
amount” of thought. Thirty-nine percent of respon-
dents say that they have thought only “a little” or
“none at all” about financial planning for retirement.
As might be expected, the amount of thought given
to retirement planning varies considerably by age.
The proportion of those ages 18 to 29 who say they
have given no thought at all to retirement planning
was the highest of any age group, at 31 percent.
Those closer to retirement age are more likely to indi-
cate that they have given thought to retirement plan-
ning. That said, slightly less than half of non-retired
respondents ages 45 and above say they have given “a
fair amount” or “a lot” of thought to retirement
planning.
The extent to which individuals have planned for
retirement appears to be closely related to their
income (table 17). Of those with a six-figure income,
for instance, 21 percent report that they have given
financial planning for retirement “a lot” of thought,
roughly double the rate for those making under
$40,000.
Individuals also express a range of expectations for
their path to retirement. Among those who have not
yet retired and do not indicate that they are out of
work due to a disability, only 22 percent anticipate
that they will experience the traditional notion of
retirement, which is working full time until a retire-
ment date and then no longer working at all. Con-
versely, for 26 percent of this population, their
“retirement plan” was to keep working as long as
possible. An additional 12 percent indicate that they
18 For a summary of how the distribution of such plans haschanged over time, see www.dol.gov/ebsa/pdf/historicaltables.pdf.
Table 17. How much thought have you given to the financialplanning for your retirement? (by household income)
Percent, except as noted
Less than$40,000
$40,000–$100,000
Greaterthan
$100,000Overall
None at all 28.8 14.0 10.0 17.1
A little 22.6 24.5 19.3 22.4
Some 26.1 26.5 21.3 24.8
A fair amount 10.9 24.2 27.6 21.4
A lot 10.4 9.6 20.7 13.1
Total number of respondents 4,414
Note: Among respondents who are not currently retired.
37

do not plan to retire. Many respondents plan to ease
out of the labor force, with 12 percent planning to
retire from their current career but then find a differ-
ent part-time job, 9 percent planning to reduce their
hours as they approach retirement, 8 percent plan-
ning to retire and then work for themselves, and an
additional 3 percent planning to retire and then find
a different full-time job.
Responses to the question about the path to retire-
ment also vary by income, indicating that expecta-
tions around retirement are closely linked to financial
circumstances. Fifty-five percent of those with a
household income less than $40,000 per year (who
are not retired and not out of the labor market due
to a disability) indicate that they either plan to keep
working as long as possible or do not plan to retire.
Only 27 percent of the parallel group making
$100,000 or more say the same (table 18). Conversely,
28 percent of those with a six-figure income report
that they intend to work full time until a retirement
date and then stop working, whereas only 11 percent
of those making less than $40,000 intend to do so.
Saving for Retirement
A lack of preparedness for retirement is not signaled
by a lack of planning alone. Many respondents, par-
ticularly those with limited incomes, indicate that
they simply have few or no financial resources avail-
able for retirement. When asked what types of retire-
ment savings or pension they have, 31 percent of
non-retired respondents report that they have no
retirement savings or pension whatsoever.
Those who do have retirement savings were asked to
indicate all the ways they are saving for retirement.
The most commonly reported form of retirement
savings is a defined contribution plan, such as a
401(k) or 403(b) plan, which 47 percent of people
possess. This is more than double the 22 percent of
respondents who participate in a traditional defined
benefit pension plan through an employer. Twenty-
nine percent of respondents report that they have an
individual retirement account (IRA), and 37 percent
indicate that they have savings outside of a formal
retirement account. Additionally, 15 percent of
respondents report having real estate or land that
they plan to sell or rent to generate income during
retirement, and 7 percent report having retirement
savings through the ownership of a business.
Patterns of retirement savings also differ substan-
tially, and predictably, by age. The percentage of
people indicating that they lack retirement savings
decreases with age. Nearly half of those ages 18 to 29
report that they have no retirement savings or pen-
sion, whereas approximately three-quarters of non-
retirees over age 45 have at least some savings.
However, whether respondents have retirement sav-
ings as they approach retirement is highly dependent
on their employment status (figure 20). While almost
90 percent of respondents over age 45 have retire-
ment savings, less than a third of those who are out
of work due to a disability do. Since 12 percent of
non-retired respondents ages 45 to 59 and 20 percent
of non-retired respondents over age 60 report having
a disability, these individuals compose a sizeable frac-
tion of the respondents who lack savings as they
approach retirement age.
The reported frequency of having retirement savings
also increases sharply with income (table 19). Eighty-
two percent of respondents making over $100,000
Table 18. Which one of the following best describes your plan for retirement? (by household income)
Percent, except as noted
Less than $40,000 $40,000–$100,000 Greater than $100,000 Overall
I do not plan to retire 17.0 11.3 7.5 11.5
Work fewer hours as I get close to retirement 9.4 10.4 7.6 9.3
Retire from my current career, but then find a different full-time job 2.5 2.5 3.0 2.6
Retire from my current career, but then find a different part-time job 8.6 12.2 15.8 12.5
Retire from my current career, but then work for myself 4.9 7.6 11.3 8.1
Work full time until I retire, then stop working altogether 11.2 23.1 28.1 21.6
Keep working as long as possible 37.8 24.6 19.9 26.5
Other 7.2 6.4 5.3 6.3
Total number of respondents 3,894
Note: Among respondents who are not currently retired or out of work due to a disability.
38 Economic Well-Being of U.S. Households, 2014

per year report having at least some retirement sav-
ings, and 74 percent of those making between
$40,000 and $100,000 per year have savings. But
among respondents making under $40,000 per year,
only 42 percent have any retirement savings.
Since saving for retirement varies by employment sta-
tus, individuals in lower-income households are less
likely to have savings in part because they are less
likely to be working. However, full-time workers in
lower-income households are still much less likely to
have savings (60 percent) than full-time workers in
households with an income over $40,000 (89 per-
cent). This suggests that a portion of the gap is also
due to either differences in retirement benefits for the
types of jobs held by individuals lower in the income
distribution, or the fact that even these low-income
individuals who work full time lack the financial
capacity to save and contribute to retirement
accounts.
Figure 20. Presence of any retirement savings (by age and employment status)
61
23
47
5
47
81
29
63
27
71
88
48
80
32
77
90
62
83
31
75
Employed
Not employed or temporarily laid-off
Homemaker
Disabled and not working
Overall
Percent
18–29
30–44
45–59
60+
Note: Among respondents not currently retired.
Table 19. What types of retirement savings or pension do you have? (by household income)
Percent, except as noted
Less than $40,000 $40,000–$100,000 Greater than $100,000 Overall
401(k), 403(b), thrift, or other defined contribution pension plan throughan employer 21.0 54.0 61.2 46.6
Defined benefit pension through an employer 8.8 22.0 34.1 21.8
Individual Retirement Account (IRA) or Roth IRA 12.8 29.7 43.4 28.9
Savings outside a retirement account 17.3 38.3 54.7 37.1
Ownership of real estate or land that you plan to sell or rent to generateincome in retirement 8.2 12.8 25.2 15.2
Ownership of my business 4.0 4.9 11.2 6.5
Other retirement savings 6.2 9.0 18.9 11.2
Total number of respondents 4,414
Note: Among respondents who are not currently retired.
May 2015 39

To better understand why some individuals are not
saving for their retirement, the survey asks employed
respondents who do not participate in a 401(k) plan
(or similar) through work to state all of the reasons
why they do not participate. Forty-two percent of
respondents who do not participate in a plan indicate
that they do not participate because their employer
does not offer a plan, and 6 percent say that their
employer offers a plan but does not match contribu-
tions (figure 21). The frequency of these responses is
almost identical for workers of all three income levels.
Twenty-nine percent of all workers, including 35 per-
cent of workers with incomes under $40,000, say that
they do not participate in a plan because they cannot
afford to contribute to the plan. Additionally, 15 per-
cent say that they do not participate in such a plan
because they are unsure of the best way to invest
their money in the plan, and 10 percent say that they
plan to invest but have not yet signed up.
Many respondents also express a lack of knowledge
about both the amount they are contributing to their
retirement plan and the level of the 401(k) match
provided by their employer. When asked what frac-
tion of their paycheck they contribute to their
401(k) plan, 23 percent of respondents who have a
401(k) retirement account say that they do not know
what portion of their salary they contribute. Addi-
tionally, 41 percent of respondents whose employer
offers a plan say they do not know the maximum
fraction of their salary that their employer will
match. This includes 73 percent of those who do not
have savings in a 401(k) type account, but also
30 percent of those who do.
A number of respondents also indicate that they lack
confidence in their ability to manage their invest-
ments. Just over half of respondents with self-
directed retirement accounts (including 401(k), IRA,
and savings outside retirement accounts) are either
“not confident” or only “slightly confident” in their
ability to make the right investment decisions when
investing money in these accounts (figure 22).
Even when respondents do have established retire-
ment savings accounts, a subset of non-retired
respondents report drawing on these resources.
Figure 21. Please select all the reasons below for why you do not currently invest in a 401(k), 403(b), thrift, or other definedcontribution plan from work.
42
29
15
12
10
6
4
9
Employer does not offer a plan
Unable to afford contributions to a retirement plan
Unsure of best way to invest money contributed to the retirement plan
Prefer to save for retirement in other ways
Plan to invest through the retirement plan but have not signed up yet
Employer offers a plan but does not match contributions
Prefer to spend the money rather than save
Other
Percent
Note: Among respondents not currently retired who do not have 401(k), 403(b), or thrift retirement savings.
Figure 22. How confident are you in your ability to make theright investment decisions when managing and investingthe money in your retirement accounts?
Very con�dent, 12%
Mostly con�dent, 36%Slightly con�dent, 34%
Not con�dent, 17%
Note: Among respondents with retirement savings in a self-directed retirementaccount.
40 Economic Well-Being of U.S. Households, 2014

Six percent of those with retirement savings report
that they borrowed money from a retirement account
during the year before the survey. Moreover, 5 per-
cent of those with such accounts report that they
cashed out (permanently withdrew) some of their
retirement savings in the prior 12 months, and 1 per-
cent indicate that they both borrowed money from
and cashed out retirement accounts in that time.
Additionally, 6 percent of non-retirees without retire-
ment savings say that they borrowed from and/or
cashed out their retirement savings, reflecting that
some individuals previously had savings but have
depleted the funds in those accounts.19
Expectations in Retirement
In addition to asking respondents about the retire-
ment savings that they currently hold, the survey asks
respondents about the sources of income that they
plan to use to pay for expenses in retirement. There
are differences by age in the sources of funds that
respondents expect to use to pay for retirement
expenses. This is especially apparent with respect to
Social Security. Only 44 percent of those under age
30 say that they anticipate that Social Security ben-
efits will be part of their plan to pay for expenses in
retirement. This percentage steadily increases by age
cohort, up to 92 percent of those over age 60 expect-
ing to receive Social Security income in retirement. It
is unclear whether these differences simply highlight
the fact that older adults are likely to be thinking
more actively about Social Security or if they repre-
sent diminishing levels of confidence among younger
people about the future availability of Social Security
benefits. Similarly, traditional defined-benefits pen-
sion plans are less common as an expected source of
retirement funding among younger respondents.
Thirty-six percent of those ages 60 and older are
counting on income from a defined-benefit pension,
while only 22 percent of those ages 18 to 29 plan on
receiving income from a defined-benefit pension.
Many respondents expect continued employment to
be a significant source of retirement income, with
45 percent of all respondents expecting to continue
working in some capacity to cover their expenses and
26 percent expecting their spouse to continue work-
ing (table 20). Forty-six percent of respondents plan
to rely on savings they hold outside formal retirement
accounts to cover their expenses, while 37 percent
plan to draw on savings in an IRA and 20 percent
expect to sell or rent land or real estate to pay for
retirement expenses.
Experiences in Retirement
The survey asks respondents who are currently
retired about their experiences in retirement and
about how they manage their expenses. The most
19 Some of these non-retired respondents may be cashing out fromtheir retirement account to pay for retirement expenses as theynear retirement. However, only 18 percent of respondents whocashed out a retirement account, 14 percent of those who bor-rowed money, and 7 percent of those who both borrowed andcashed out are over age 60, suggesting that may are doing so forother purposes.
Table 20. Which of the following do you expect will be a source of funds for you in retirement? (by age)
Percent, except as noted
18–29 30–44 45–59 60+ Overall
Social Security 44.3 56.6 79.5 91.7 64.7
I will continue working 43.3 48.0 43.1 47.3 45.1
Spouse/partner will continue working 26.0 30.3 23.8 18.6 25.8
Defined benefit pension from work 22.5 27.4 43.5 36.3 32.3
401(k), 403(b), thrift or other defined contribution pension planfrom work 44.4 60.5 60.8 38.1 54.0
Individual Retirement Account (IRA) 31.6 37.5 41.5 35.8 37.0
Savings outside a retirement account 45.6 46.8 47.4 44.9 46.5
Income from real estate or the sale of real estate 14.9 20.8 20.8 23.7 19.6
Income from a business or the sale of a business 6.2 7.8 6.4 7.8 6.9
Rely on children, grandchildren, or other family 4.7 5.2 4.4 6.1 4.9
Rely on inheritance 8.6 9.0 7.6 5.1 8.0
Other retirement savings 12.2 12.4 19.0 15.7 14.8
Total number of respondents 3,838
Note: Among respondents who are not currently retired and plan to retire.
May 2015 41
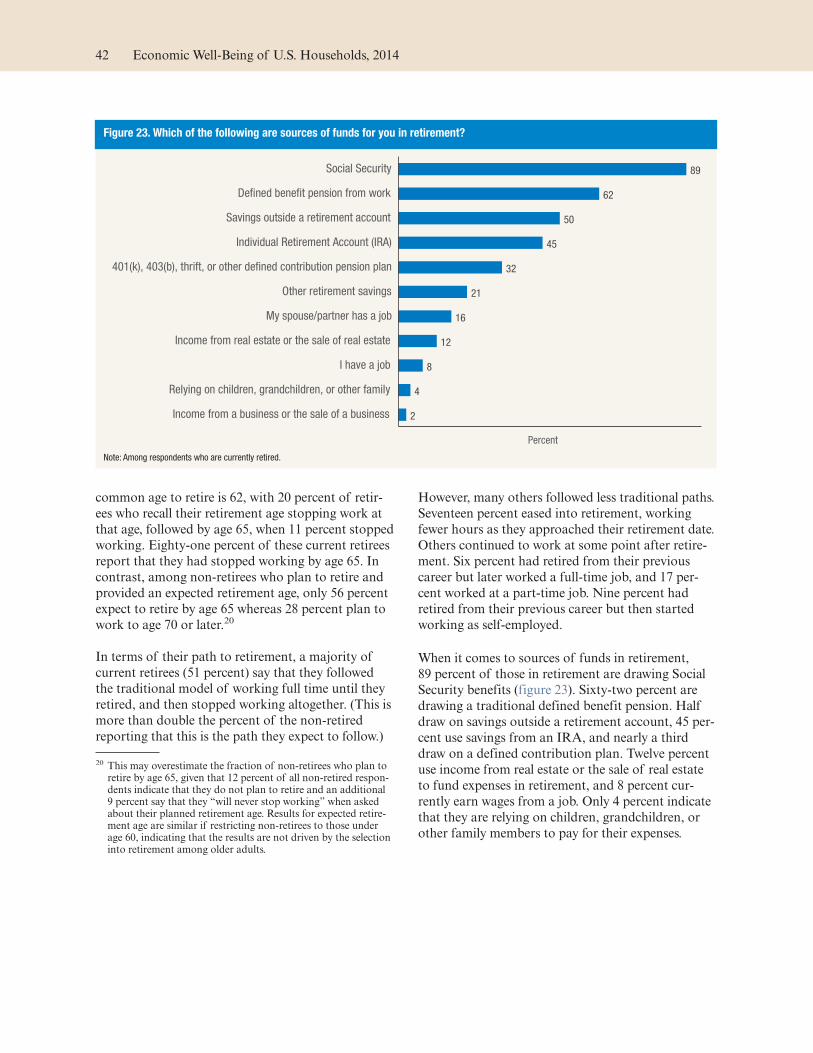
common age to retire is 62, with 20 percent of retir-
ees who recall their retirement age stopping work at
that age, followed by age 65, when 11 percent stopped
working. Eighty-one percent of these current retirees
report that they had stopped working by age 65. In
contrast, among non-retirees who plan to retire and
provided an expected retirement age, only 56 percent
expect to retire by age 65 whereas 28 percent plan to
work to age 70 or later.20
In terms of their path to retirement, a majority of
current retirees (51 percent) say that they followed
the traditional model of working full time until they
retired, and then stopped working altogether. (This is
more than double the percent of the non-retired
reporting that this is the path they expect to follow.)
However, many others followed less traditional paths.
Seventeen percent eased into retirement, working
fewer hours as they approached their retirement date.
Others continued to work at some point after retire-
ment. Six percent had retired from their previous
career but later worked a full-time job, and 17 per-
cent worked at a part-time job. Nine percent had
retired from their previous career but then started
working as self-employed.
When it comes to sources of funds in retirement,
89 percent of those in retirement are drawing Social
Security benefits (figure 23). Sixty-two percent are
drawing a traditional defined benefit pension. Half
draw on savings outside a retirement account, 45 per-
cent use savings from an IRA, and nearly a third
draw on a defined contribution plan. Twelve percent
use income from real estate or the sale of real estate
to fund expenses in retirement, and 8 percent cur-
rently earn wages from a job. Only 4 percent indicate
that they are relying on children, grandchildren, or
other family members to pay for their expenses.
20 This may overestimate the fraction of non-retirees who plan toretire by age 65, given that 12 percent of all non-retired respon-dents indicate that they do not plan to retire and an additional9 percent say that they “will never stop working” when askedabout their planned retirement age. Results for expected retire-ment age are similar if restricting non-retirees to those underage 60, indicating that the results are not driven by the selectioninto retirement among older adults.
Figure 23. Which of the following are sources of funds for you in retirement?
89
62
50
45
32
21
16
12
8
4
2
Social Security
De!ned bene!t pension from work
Savings outside a retirement account
Individual Retirement Account (IRA)
401(k), 403(b), thrift, or other de!ned contribution pension plan
Other retirement savings
My spouse/partner has a job
Income from real estate or the sale of real estate
I have a job
Relying on children, grandchildren, or other family
Income from a business or the sale of a business
Percent
Note: Among respondents who are currently retired.
42 Economic Well-Being of U.S. Households, 2014
Conclusion
The results of this survey highlight the range of eco-
nomic challenges that are faced by some individuals,
households, and families in the United States several
years after the Great Recession.
In general, the majority of the population is continu-
ing to recover from the financial crisis and the effects
it had on their personal finances and financial well-
being. Most people report that they are living com-
fortably or doing okay, an increasing fraction of the
population expects income growth in the coming
year, and a majority of Americans feel that credit is
sufficiently available to them.
However, despite these reasons for optimism about
the economic conditions in the United States, the
findings in this survey highlight that economic chal-
lenges remain for a significant portion of the popula-
tion. Forty-seven percent of respondents say they
either could not cover an emergency expense costing
$400, or would cover it by selling something or bor-
rowing money. Nearly a third of respondents went
without some medical treatment in the past year
because they could not afford it. Further, 36 percent
of all workers, and 49 percent of those working part
time, would prefer to work more hours at the same
pay if they were able to.
The survey also highlights the extent to which these
economic challenges are particularly prevalent
among respondents with less income. Among those
making under $40,000 per year, over half report that
they are either finding it difficult to get by or are just
getting by, only 31 percent would cover a $400 emer-
gency expense without borrowing money or selling
something, and just 42 percent have any retirement
savings. Lower income respondents disproportion-
ately lack retirement savings, and their expectations
reflect this: 55 percent of non-retired, non-disabled
individuals making under $40,000 per year expect to
never retire or plan to keep working as long as
possible.
Several pockets of concern also emerge in the survey
results with respect to education, retirement plan-
ning, and credit access. Although respondents with a
postsecondary degree overwhelmingly feel that the
lifetime benefits exceed the cost, non-completers
report a vastly different experience. Those who do
not complete an associate or bachelor’s degree are
disproportionately likely to be behind on their stu-
dent loan payments and to feel that their education
was not worth the cost. Recognizing that many non-
completers are first-generation college students who
come from backgrounds with fewer economic
resources, the combination of student loan debt and
no degree may represent a further hindrance toward
economic advancement for these individuals.
In an era where self-directed retirement planning is
increasingly expected, the survey illustrates the extent
to which individuals do not feel confident in their
ability to manage their retirement investments. Just
over half of respondents with self-directed retirement
accounts are either “not confident” or only “slightly
confident” in their ability to make the right invest-
ment decisions when investing the money in these
accounts. This lack of confidence poses a potential
risk on the path to retirement for younger genera-
tions of workers for whom self-directed retirement
accounts are increasingly the norm.
A sizeable portion of the population also indicates
that they are interested in obtaining credit but are
unable to find it through the traditional financial
channels, with many indicating that they are instead
relying on some form of alternative financial services.
Approximately one-sixth of respondents were denied
credit, were offered less credit than they desired, or
desired credit but did not apply for fear of denial. Of
those who were denied, offered less credit, or feared
denial, 38 percent used some form of alternative
financial services such as a payday loan, check cash-
ing service, pawn shop loan, auto title loan, paycheck
advance, or money order.
43

Although the U.S. economy is recovering from the
Great Recession and most individuals appear to be
generally stable financially, there are clearly segments
of the population who are still struggling on one or
more dimensions. These consumers remain vulner-
able to economic hardship in the case of further
financial disruption or are at risk of economic hard-
ship in the future due to an inability to save for future
needs such as retirement. The survey results highlight
the need to continue to monitor these vulnerable
populations and assess the extent to which they are,
or are not, benefitting from broader economic
recovery.
44 Economic Well-Being of U.S. Households, 2014

Appendix 1: Technical Appendix onSurvey Methodology
The SHED was designed by Board staff and admin-
istered by GfK, an online consumer research com-
pany, on behalf of the Board. In order to create a
nationally representative probability-based sample,
GfK’s KnowledgePanel® selected respondents based
on both random digit dialing and address-based sam-
pling (ABS). Since 2009 new respondents have been
recruited using ABS. To recruit respondents, GfK
sends out mailings to a random selection of residen-
tial postal addresses. Out of 100 mailings, approxi-
mately 14 households contact GfK and express an
interest in joining the panel. Of those who contact
GfK, three-quarters complete the process and
become members of the panel.21 If the person con-
tacted is interested in participating but does not have
a computer or Internet access, GfK provides him or
her with a laptop and access to the Internet. Panel
respondents are continuously lost to attrition and
added to replenish the panel, so the recruitment rate
and enrollment rate may vary over time.
There are several reasons that a probability-based
Internet panel was selected as the method for this
survey rather than an alternative survey method. The
first reason is that these types of Internet surveys
have been found to be representative of the popula-
tion.22 The second reason is that the ABS Internet
panel allows the same respondents to be
re-interviewed in subsequent surveys with relative
ease, as they remain in the panel for several years.
The third reason is that Internet panel surveys have
numerous existing data points on respondents from
previously administered surveys, including detailed
demographic and economic information. This allows
for the inclusion of additional information on
respondents without increasing respondent burden.
Lastly, collecting data through an ABS Internet panel
survey is cost effective, and can be done relatively
quickly.
A total of 8,975 KnowledgePanel® members received
e-mail invitations to complete this survey, including a
one-time oversample of respondents with a house-
hold income under $40,000. The sample included a
random selection of 2,190 out of the 4,134 Knowl-
edgePanel® respondents who participated in the
Board’s 2013 Survey of Household Economics and
Decisionmaking and an additional 4,059 randomly
selected KnowledgePanel® respondents who did not
participate in the Board’s previous survey. It also
included 2,726 randomly selected KnowledgePanel®
respondents whose household income was under
$40,000. (See table 1 in main text.) The lower-income
oversample was included in the study to ensure suffi-
cient coverage of this population for key questions of
interest. From these three components of the sample,
a total of 5,896 people (excluding breakoffs)
responded to the e-mail request to participate and
completed the survey yielding a final stage comple-
tion rate of 65.6 percent. The recruitment rate for the
primary sample, reported by GfK, was 13.9 percent
and the profile rate was 64.1 percent, for a cumula-
tive response rate of 5.8 percent.
To enhance the completion rate, GfK sent e-mail
reminders to non-responders on days three and seven
of the field period.23 GfK maintains an ongoing
modest incentive program to encourage Knowl-
edgePanel® members to participate. Incentives take
the form of raffles and lotteries with cash and other
prizes. KnowledgePanel® members were offered an
additional $10 incentive for completing this survey in
addition to the standard incentives offered by GfK.
Significant resources and infrastructure are devoted
to the recruitment process for the KnowledgePanel®
21 For further details on the KnowledgePanel® sampling method-ology and comparisons between KnowledgePanel® and tele-phone surveys, see www.knowledgenetworks.com/accuracy/spring2010/disogra-spring10.html.
22 David S. Yeager, Jon A. Krosnick, LinChiat Chang, Harold S.Javitz, Matthew S. Levendusky, Alberto Simpser, and Rui Wang(2011), “Comparing the Accuracy of RDD Telephone Surveysand Internet Surveys Conducted with Probability and Non-Probability Samples,” Public Opinion Quarterly, vol. 75 (4),pp. 709–47.
23 For respondents in the fresh population sample, a third e-mailreminder was sent to non-respondents on day 10 of the fieldperiod.
45

so that the resulting panel can properly represent the
adult population of the US. Consequently, the raw
distribution of KnowledgePanel® mirrors that of the
U.S. adults fairly closely, baring occasional disparities
that may emerge for certain subgroups due to differ-
ential attrition rates among recruited panel members.
The selection methodology for general population
samples from the KnowledgePanel® ensures that the
resulting samples behave as an equal probability of
selection method (EPSEM) samples. This methodol-
ogy starts by weighting the entire KnowledgePanel®
to the benchmarks secured from the latest March
supplement of the Current Population Survey (CPS)
along several dimensions. This way, the weighted dis-
tribution of the KnowledgePanel® matches that of
the U.S. adults. Typically, the geo-demographic
dimensions used for weighting the entire Knowl-
edgePanel® include gender, age, race/ethnicity, educa-
tion, Census region, household income, home owner-
ship status, metropolitan area status, and Internet
access.
Using the above weights as the measure of size
(MOS) for each panel member, in the next step a
probability proportional to size (PPS) procedure is
used to select study specific samples. Since this survey
includes a lower-income oversample, the departure
caused by this oversample from an EPSEM design
are corrected by adjusting the corresponding design
weights accordingly with the CPS benchmarks serv-
ing as reference points.
Once the sample has been selected and fielded, and
all the study data are collected and made final, a
post-stratification process is used to adjust for any
survey non-response as well as any non-coverage or
under- and over-sampling resulting from the study
specific sample design. The following variables were
used for the adjustment of weights for this study:
gender, age, race/ethnicity, education, Census region,
residence in a metropolitan area, household income,
and access to the Internet. Demographic and geo-
graphic distributions for the noninstitutionalized,
civilian population ages 18 and over from the
March 2014 CPS are used as benchmarks in this
adjustment.
Although weights allow the sample population to
match the U.S. population based on observable char-
acteristics, similar to all survey methods, it remains
possible that non-coverage or non-response results in
differences between the sample population and the
U.S. population that are not corrected using weights.
46 Economic Well-Being of U.S. Households, 2014

Appendix 2: Survey of Household Economicsand Decisionmaking—Questionnaire
Below is a reproduction of the survey instrument in its entirety. The bracketed text
are programming instructions that (1) indicate whether or not a question is single
choice [SP] or multiple choice [MP] and (2) represent any skip pattern used to
reach that question and which questions should be grouped together on a page.
The respondents only saw the questions and response options; they did not see the
program code. Question numbers are not always sequential in order to preserve
continuity with the question numbers from the 2013 survey. Questions are listed
below in the order in which they were presented to respondents.
[DISPLAY1]
OMB Control Number: 7100-0359
Expiration Date: 04/30/2017
Click here for more information on the OMB public reporting requirements [insert
rollover indicator for ‘for more information’ using definition laid out below]
The Federal Reserve Board is interested in learning more about the financial well-
being and economic perceptions of the American people. The data collected in this
survey will be used for research, analysis, and policymaking on consumer finances
and household financial stability.We appreciate your participation in this survey. All
respondents who complete this survey will be provided with the equivalent of $10
through the GfK rewards system.
[PROGRAM INSTRUCTION]
[SHOW THIS DEFINITION USING ROLLOVER INDICATOR FUNCTION
FOR ‘FORMORE INFORMATION’ IN DISPLAY01]
The Federal Reserve may not conduct or sponsor, and an organization is not
required to respond to, a collection of information unless it displays a currently
valid OMB control number. Public reporting burden for this information collec-
tion is estimated to average 0.33 hours, including the time to gather data in the
required form and to review instructions and complete the information collection.
Send comments regarding this burden estimate or any other aspect of this collec-
tion of information, including suggestions for reducing this burden to: Secretary,
Board of Governors of the Federal Reserve System, 20th and C Streets, NW,
Washington, DC 20551, and to the Office of Management and Budget, Paperwork
Reduction Project (7100-0359), Washington, DC 20503.
47

[SHOWDISPLAY1 AND D1 ON THE SAME PAGE]
[DISPLAY1]
First, tell us a little about yourself.
[SP]
[PROMPT]
D1. Which one of the following BEST describes who you are living with?
1. Living alone or only with your immediate family (i.e., spouse/partner and/or
dependent children)
3. Living with your adult children
4. Living with your (or your spouse’s/partner’s) parents
5. Living with your (or your spouse’s/partner’s) extended family (e.g., siblings,
cousins)
6. Living with roommate(s)
CREATE DOV [LIVARR] TO BE USED IN THE LIVING ARRANGEMENTS
SECTION:
IF D1 = 2 LIVARR = “immediate family”
IF D1 = 3 LIVARR = “adult children”
IF D1 = 4 LIVARR = “parents”
IF D1 = 5 LIVARR = “extended family”
IF D1 = 6 LIVARR = “roommate(s)”
[SP]
[PROMPT]
D2. We are interested in your present job status. Which one
of the following BEST describes your current employment situation?
1. Employed now
2. Temporarily laid off
3. Not employed, but looking for a job
4. Not employed and not looking for a job
5. Homemaker
48 Economic Well-Being of U.S. Households, 2014

6. Student
7. Disabled and not working
8. Retired
[SP][IF D2 = 1]
D3. Thinking of your main job, do you:
1. Work full time for someone else
2. Work part time for someone else
3. Work for yourself (self-employed)
4. Work as a partner in a partnership (e.g., partner in law firm, medical practice)
5. Work as a consultant/contractor
[SP][IF D2 = 6]
D4A. Besides being a student, do you also have a paid job?
1. Yes, I work full time
2. Yes, I work part time
3. No
[SP][IF D2 = 8]
D4B. Besides being retired, do you also have a paid job?
1. Yes, I work full time
2. Yes, I work part time
3. No
[SP][IF D3 = 3]
D4C. In addition to your main job, do you also have another paid job?
1. Yes, I have another full-time job
2. Yes, I have another part-time job
3. No
[Textbox, 50 characters] [If D2=1 or (D4A = 1 or 2) or (D4B = 1 or 2)]
D4D. What kind of work do you do, that is, what is your occupation? (For
example: plumber, typist, farmer)
May 2015 49

[SP][IF (D3 = 1, 2, or 5) or (D4A = 1 or 2) or (D4B = 1 or 2)]
D4E. If you were paid the same hourly rate regardless of the number of hours you
work, would you prefer to:
1. Work the same number of hours that you currently work
2. Work more hours for more money
3. Work fewer hours for less money
[SP][IF PPMARIT = 1 or 6]
D5. Which one of the following BEST describes your spouse’s/partner’s current
employment status?
1. Employed full time
2. Employed part time
3. Temporarily laid off
4. Not employed, but looking for a job
5. Not employed and not looking for a job
6. Homemaker
7. Student
8. Disabled and not working
9. Retired
[SP]
D7. Do you [IF PPMARIT=1, INSERT: and/or your spouse / IF PPMARIT=6,
INSERT: and/or your partner] currently have a checking, savings or money market
account?
1. Yes
0. No
[SP]
D8A. In the past 12 months, have you used a check cashing service, money order,
pawn shop loan, auto title loan, paycheck advance/deposit advance, or a payday
loan?
1. Yes
0. No
50 Economic Well-Being of U.S. Households, 2014

[SP]
S2. Which one of the following best describes your housing arrangement?
1. I [if PPMARIT=1, insert: (and/or my spouse) / if PPMARIT=6, insert: (and/or
my partner)] own [if PPMARIT=1 or 6, insert: our, else insert:my] home
2. I [if PPMARIT=1, insert: (and/or my spouse) / if PPMARIT=6, insert: (and/or
my partner)] own [if PPMARIT=1 or 6, insert: our, else insert:my] home
3. I [if PPMARIT=1, insert: (and/or my spouse) / if PPMARIT=6, insert: (and/or
my partner)] own [if PPMARIT=1 or 6, insert: our, else insert:my] home
[If S2=1]
[NUMBER BOX range 1900-2014]
D6. In what year did you buy your current home?
[Num box 1900-2014]
***** RENT SECTION *****
[ONLY ASK RENT SECTION IF S2 = 2 OR S2=3]
[IF S2 = 2]
[SP]
R0. Would you prefer to own your home rather than rent your home if you could
afford it?
1. Definitely no
2. Probably no
3. Probably yes
4. Definitely yes
[IF S2 = 2]
[MP]
[RANDOMIZE a-f]
R1. Please select all the reasons below for why you rent your home rather than own
your home.
a. It’s cheaper to rent than own a home
b. It’s more convenient to rent (for example, you can move easily)
May 2015 51

c. I plan on moving in the near future
d. I can’t qualify for a mortgage to buy a home
e. I can’t afford the down payment to buy a home
f. I simply prefer to rent
g. I’m currently looking to buy a home
h. Other (Please specify):[txt]________________________________
[IF S2 = 2]
[NUMBER BOXWITH SP]
[ALLOW RESPONDENT TO EITHER TYPE ANSWER IN NUMBER BOX
OR CHECK DON’T KNOW, PROMPTWITH THE FOLLOWING IF BOTH:
Please enter an answer in the number box OR check ‘Don’t know.’]
R3. About how much do you [if d0=1, insert: and your spouse / if d0=2, insert:
and your partner] pay for rent each month?
$ __________ [Num box 0-99999]
888888. Don’t know [SP]
[IF S2 = 2 OR 3]
[SP]
R7. Do you expect to purchase a home in the next three years?
4. Definitely yes
3. Probably yes
2. Probably no
1. Definitely no
9. Don’t know
***** END OF RENT SECTION *****
***** OWN SECTION *****
[ONLY ASK H0 – H6 IF S2 = 1]
[IF S2=1]
[MP]
52 Economic Well-Being of U.S. Households, 2014

[RANDOMIZE a-f]
H0. Please select all the reasons below for why you own your home rather than
rent.
a. It’s cheaper to own than rent a home
b. Certainty about monthly payments
c. Building equity with payments
d. Don’t like to move
e. Less rules/able to customize house
f. Simply prefer to own
g. Other (Please specify):[txt]________________________________
[IF D6 < 2013 AND S2=1]
[SP]
H1. Compared to 12 months ago, do you think the value of your home today is
higher, lower, or stayed the same?
3. Higher value
2. Value has stayed the same
1. Lower value
8. Don’t Know
[IF S2=1]
[SP]
H4. In the next 12 months, how much do you think that home prices in your
neighborhood will change?
5. Go up by more than 5 percent
4. Go up by less than 5 percent
3. Stay about the same
2. Go down by less than 5 percent
1. Go down by more than 5 percent
8. Don’t know
[IF S2=1]
May 2015 53
[SP]
H5. Thinking about the past 12 months, which one of the following categories best
describes your situation concerning selling your current home?
1. I wanted to sell, so I put it on the market, but could not sell it
2. I wanted to sell, but did not put it on the market
3. I did not want to sell
4. My home is currently on the market
[IF S2=1]
[IF D6>=2005]
[MP]
H7. Please select all the sources below that you used to make the down-payment (if
any) when you purchased your current home:
a. Proceeds from sale of previous home
b. Personal savings
c. Loan or gift from family/friends
d. Second mortgage
e. Financial assistance from a government program or nonprofit organization
f. Did not make a down payment [EXCLUSIVE]
***** END OF OWN SECTION *****
****** MORTGAGE SECTION*****
[IF (S2 = 1)]
[SP]
M0. Do you [if PPMARIT=1, INSERT: and/or your spouse / if PPMARIT=6,
INSERT: and/or your partner] currently have a mortgage on your home? (Do not
include home equity lines of credit [insert rollover indicator for ‘home equity lines’
using definition laid out from M3; shown ‘home equity lines of credit’ in bold])
1. Yes
0. No
[IF (M0 = 1)]
54 Economic Well-Being of U.S. Households, 2014

[SP]
M2. In the past 12 months, have you [if PPMARIT=1, INSERT: or your spouse /
if PPMARIT=6, INSERT: or your partner] missed two or more payments on your
mortgage?
1. Yes
0. No
[PROGRAM INSTRUCTION]
[SHOW THIS DEFINITION USING ROLLOVER INDICATOR FUNCTION
FOR ‘HOME EQUITY LOAN’ IN M3; shown ‘home equity loan’ in bold]
HEL - home equity loan. This is a loan where you borrow a set dollar amount
upfront, and pay it back with regular monthly payments. You cannot re-borrow
money using this loan even after you have paid some money back
[SHOW THIS DEFINITION USING ROLLOVER INDICATOR FUNCTION
FOR ‘HOME EQUITY LINE’ IN M3; shown ‘home equity line’ in bold]
HELOC - home equity line of credit. You receive a line of credit for up to a given
credit limit (for example, up to $20,000) and can draw on it and make payments on
only what you have borrowed. You generally can re-borrow money over time as you
pay the money back. You are typically given checks or a bank card to access a
HELOC.
[IF (M0 = 1)]
[SP]
M3. Think about the total amount of money you currently owe on your primary
home (including any mortgage, home equity loan [insert rollover indicator for
‘home equity loan’ (show in bold) using definition from M3], or home equity line of
credit [insert rollover indicator for ‘home equity line of credit’ (show in bold) using
definition laid out from M3]).
Compared to the current value of your home, is the total amount of money
you owe:
5. A lot more
4. A little more
3. About the same (as the current value of your home)
2. A little less
1. A lot less
8. Don’t know
[IF (M0 = 1)]
May 2015 55

[NUMBER BOXWITH SP]
[ALLOW RESPONDENT TO EITHER TYPE ANSWER IN NUMBER BOX
OR CHECK DON’T KNOW, PROMPTWITH THE FOLLOWING IF BOTH:
Please enter an answer in the number box OR check ‘Don’t know’.]
M4. About how much is your total monthly mortgage payment (i.e., the amount
you send to the bank)?
$ ______[Num box $0-99999]
888888. Don’t know [SP]
***** END OFMORTGAGE SECTION *****
***** LIVING ARRANGEMENT SECTION *****
[IF (D1 = 3, 4, 5, OR 6)]
[NUMER BOX]
L0. In what year did you start living with your [INSERT LIVARR]?
____ [Num box 1900-2014]
[IF (D1 = 3, 4, 5, OR 6)]
[MP]
[Randomize a-e ]
L1. Please select all the reasons below that you (and your immediate family) cur-
rently live with your [INSERT LIVARR]
a. To save money
b. To care for sick/disabled/elderly family member or friend
c. To receive assistance with child care
d. Companionship / prefer living with others
e. To provide financial assistance to those living with me.
f. Other (Please specify):[txt]________________________________
***** END LIVING ARRANGEMENT SECTION *****
56 Economic Well-Being of U.S. Households, 2014
***** CREDIT APPLICATION SECTION *****
[ASK EVERYONE]
[SP]
A0. In the last 12 months, have you [IF PPMARIT=1, INSERT: or your spouse /
IF PPMARIT=6, INSERT: or your partner] applied for any credit (such as a
credit card, higher credit card limit, mortgage, refinance, student loan, personal
loan, or other loan)?
1. Yes
0. No
[IF A0=1]
[randomize a-g]
[MP]
A0A. Please select all of the types of credit below that you [IF PPMARIT=1,
INSERT: or your spouse / IF PPMARIT=6, INSERT: or your partner] have
applied for in the past 12 months.
a. Mortgage to buy a new home
b. Refinance of a home mortgage
c. Home equity loan or line of credit
d. Credit card
e. Car/auto loan
f. Student loan
g. Personal loan from friends or family
h. Other: __________________
[IF A0=1]
[SP]
A0B. Was there a time in the past 12 months that you [IF PPMARIT=1, INSERT:
or your spouse / IF PPMARIT=6, INSERT: or your partner] desired credit but
chose not to submit a credit application?
1. Yes
0. No
May 2015 57
IF (A0=1 “YES” OR REFUSED)
[Suppress default instructions, instead show: Please answer yes or no to each option]
A1. In the past 12 months, please tell us if each of the following has or has not
happened to you [IF PPMARIT=1, INSERT: or your spouse / IF PPMARIT=6,
INSERT: or your partner]: (Please answer yes or no to each option)
PROGRAMMING NOTE: CODE “Yes” AS 1, “No” AS 0, AND REFUSED
AS -1.
1 0
Yes No
a. [SHOW IF A0=1 “YES” OR REFUSED] You [IF PPMARIT=1, INSERT: oryour spouse / IF PPMARIT=6, INSERT: or your partner] were turned downfor credit
b. [SHOW IF A0=1 “YES” OR REFUSED] You [IF PPMARIT=1, INSERT: oryour spouse / IF PPMARIT=6, INSERT: or your partner] were approved forcredit, but were not given as much credit as you applied for
c. [SHOW IF (A0=1 “YES” OR REFUSED)] You [IF PPMARIT=1, INSERT: oryour spouse / IF PPMARIT=6, INSERT: or your partner] put off applying forcredit because you thought you might be turned down
[IF A0B=1]
[SP]
A2A. Why did you [IF PPMARIT=1, INSERT: or your spouse / IF PPMARIT=6,
INSERT: or your partner] choose not to submit a credit application when you
desired credit in the past 12 months?
1. Thought you might be turned down or denied credit
2. Simply did not want to take on more debt
3. Obtained money some other way
4. Other: [txt] _________________________
[SP]
A4. If you were to apply for a mortgage today, how confident are you that your
application would be approved?
3. Not confident
2. Somewhat confident
1. Very confident
8. Don’t know
***** END OF CREDIT APPLICATION SECTION *****
58 Economic Well-Being of U.S. Households, 2014
***** CREDIT CONDITION SECTION *****
[SP]
C1. If you had to guess, do you think your current credit score (such as a FICO
score) is:
5. Excellent
4. Very good
3. Good
2. Fair
1. Poor
8. Don’t know my score or how to rate it
[NUMBER BOX]
C2A. Do you have at least one credit card?
1. Yes
0. No
[SP][IF C2A=1]
C3. In the past 12 months, have you always paid your credit card bills in full each
month?
1. Yes
0. No
[IF C3=0]
[GRID; SP ACROSS]
[SHOW THIS TEXT INSTEAD OF DEFAULT INSTRUCTIONS: Please
answer yes or no to each option]
May 2015 59

C4. Also, in the past 12 months, have you ever:
1 0
Yes No
a. Carried over a balance on one or more of your credit cards and beencharged interest
b. Paid only the minimum payment on one or more of your credit card bills
c. Carried a balance on one or more of your credit cards at a low-interest ratefrom a special offer or promotion
d. Used a credit card for a cash advance
***** END OF CREDIT CONDITION SECTION *****
***** EDUCATION SECTION *****
[ASK EVERYONE]
[SP]
ED0: What is the highest level of school you completed or the highest degree you
have received?
1. Less than high school degree
2. High school degree or GED
3. Some college but no degree (including currently enrolled in college)
4. Certificate or technical degree
5. Associate degree
6. Bachelor’s degree
7. Master’s degree
8. Professional degree (e.g., MBA, MD, JD)
9. Doctoral degree
[If ED0 >= 3]
[SP]
ED1. Which one of the following broad categories best describes your most recent
educational program?
1. Humanities
2. Social/behavioral sciences
3. Life sciences
60 Economic Well-Being of U.S. Households, 2014

4. Physical sciences/math
5. Computer/information sciences
6. Engineering
7. Education
8. Business/management
9. Health
10. Law
11. Vocational/technical training
12. Undeclared
13. Other (Please specify): [TXT] __________
[IF ED0 =3 or 4]
[TEXT BOX]
ED2. What is the name of the school you attended for your most recent educa-
tional program?
[Display ED3 and ED4 on the same page]
[IF ED0 =3 or 4]
[NUMBER BOX]
ED3. In what year did you first attend this educational program?
_____ [Num Box, Range 1900 – 2014]
[IF ED0 =3 or 4]
[NUMBER BOX]
ED4. In what year did you last attend this educational program?
_____ [Num Box, Range 1900 – 2014]
888. Still enrolled [SP]
[If ED0 =3 or 4]
[SP]
ED5. Overall, how would you say the lifetime financial benefits of your most
recent educational program compares to its financial costs?
May 2015 61

1. Financial benefits are much larger
2. Financial benefits are somewhat larger
3. About same financial benefits and financial costs
4. Financial costs are somewhat larger
5. Financial costs are much larger
[If ED0 =3 or 4]
[MP]
ED6A.
Were each of the following were used to finance your most recent educational
program:
[PROGRAMMING NOTE: Code Yes = 1, No = 0
Yes No
a. I paid using my own savings or student loans
b. I worked while in school
c. My parent contributed (with or without the use of loans)
d. Tuition reimbursement from my employer (including military)
e. Academic scholarship
f. Financial-aid based scholarship or grant (e.g., Pell grant or other grantsdetermined from FAFSA application)
[If ED0 = 5, 6, 7, 8, or 9]
[TEXT BOX]
ED7. What is the name of the school from which you received your associate
degree or bachelor’s degree? (If you have both types of degree, please list the
school from which you received your bachelor’s degree)
[Display ED8 and ED9 on the same page]
[If ED0 = 5, 6, 7, 8, or 9]
[NUMBER BOX]
ED8. In what year did you first attend your associate degree or bachelor’s degree
program?
[Num Box, Range 1900 – 2014]
[If ED0 = 5, 6, 7, 8, or 9]
[NUMBER BOX]
62 Economic Well-Being of U.S. Households, 2014

ED9. In what year did you receive your associate degree or bachelor’s degree?
[Num Box, Range 1900 – 2014]
[If ED0 = 5, 6, 7, 8, or 9]
[SP]
ED10. Overall, how would you say the lifetime financial benefits of your bach-
elor’s or associate degree program compares to its financial costs?
1. Financial benefits are much larger
2. Financial benefits are somewhat larger
3. About same financial benefits and financial costs
4. Financial costs are somewhat larger
5. Financial costs are much larger
[If ED0 = 5, 6, 7, 8, or 9]
[MP]
ED11A. Were each of the following used to finance your associate degree or bach-
elor’s degree?
[PROGRAMMING NOTE: Code Yes = 1, No = 0]
1 0
Yes No
a. I paid using my own savings or student loans
b. I worked while in school
c. My parent contributed (with or without the use of loans)
d. Tuition reimbursement from my employer (including military)
e. Academic scholarship
f. Financial-aid based scholarship or grant (e.g., Pell grant or other grantsdetermined from FAFSA application)
[If ED0 = 7, 8, or 9]
[SP]
ED12. Now please think about the highest degree that you received (Master’s, pro-
fessional, or doctoral degree). Overall, how would you say the lifetime financial
benefits of the program from which you received your highest degree compares to
its financial costs?
1. Financial benefits are much larger
2. Financial benefits are somewhat larger
3. About same financial benefits and financial costs
May 2015 63
4. Financial costs are somewhat larger
5. Financial costs are much larger
[If ED0 = 2]
[Randomize a-f]
[MP]
ED13. Which of the following are reasons why you did not attend college?
a. Too expensive
b. Family responsibilities
c. Wanted to work
d. Simply was not interested in college
e. Was not admitted
f. Did not think benefits of attending college were worth the cost
g. Other: [TXT]_____________________________
[If ED0 = 3]
[RANDOMIZE b-f, anchor a first on list]
[MP]
ED14. Which of the following are reasons why you did not complete your college
degree?
a. Still enrolled in college [SP] [DISPLAY FIRST IN LIST]
b. Too expensive
c. Family responsibilities
d. Wanted to work
e. Simply not interested in continuing in college
f. Did not think the benefits of continuing college were worth the cost
g. Low grades
h. Other: [TXT]_____________________________
[SP]
64 Economic Well-Being of U.S. Households, 2014

ED15. What is the highest level of education that your mother completed?
1. Less than high school degree
2. High school degree or GED
3. Some college but no degree
4. Certificate or technical degree
5. Associate degree
6. Bachelor’s degree
7. Graduate degree
8. Don’t know
[SP]
ED16. What is the highest level of education that your father completed?
1. Less than high school degree
2. High school degree or GED
3. Some college but no degree
4. Certificate or technical degree
5. Associate degree
6. Bachelor’s degree
7. Graduate degree
8. Don’t know
***** END OF EDUCATION SECTION *****
***** STUDENT LOANS *****
[GRID; SP ACROSS]
[ONLY OFFER ‘999’ No Children/Grandchildren AS A CHOICE FOR c. for your
child’s or grandchild’s education]
S7. Do you currently owe any money used to pay for your own education, your
spouse’s education, or your child’s or grandchild’s education? Please include any
May 2015 65
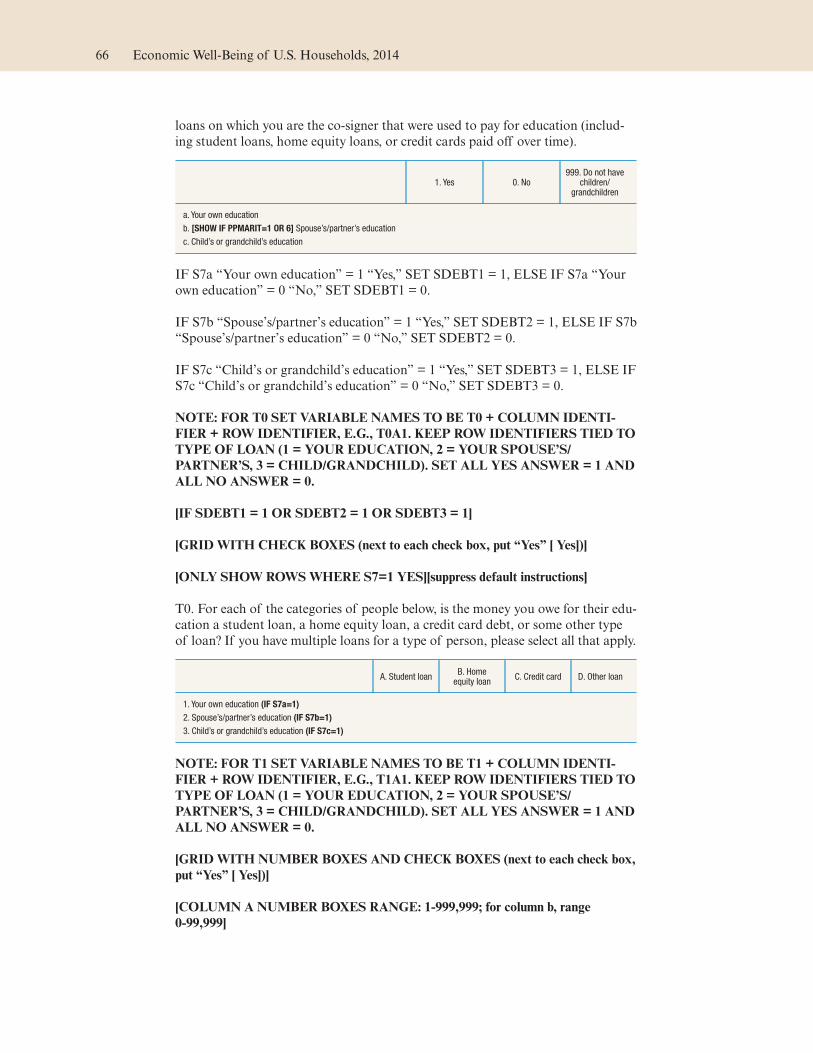
loans on which you are the co-signer that were used to pay for education (includ-
ing student loans, home equity loans, or credit cards paid off over time).
1. Yes 0. No999. Do not have
children/grandchildren
a. Your own education
b. [SHOW IF PPMARIT=1 OR 6] Spouse’s/partner’s education
c. Child’s or grandchild’s education
IF S7a “Your own education” = 1 “Yes,” SET SDEBT1 = 1, ELSE IF S7a “Your
own education” = 0 “No,” SET SDEBT1 = 0.
IF S7b “Spouse’s/partner’s education” = 1 “Yes,” SET SDEBT2 = 1, ELSE IF S7b
“Spouse’s/partner’s education” = 0 “No,” SET SDEBT2 = 0.
IF S7c “Child’s or grandchild’s education” = 1 “Yes,” SET SDEBT3 = 1, ELSE IF
S7c “Child’s or grandchild’s education” = 0 “No,” SET SDEBT3 = 0.
NOTE: FOR T0 SET VARIABLE NAMES TO BE T0 + COLUMN IDENTI-
FIER + ROW IDENTIFIER, E.G., T0A1. KEEP ROW IDENTIFIERS TIED TO
TYPE OF LOAN (1 = YOUR EDUCATION, 2 = YOUR SPOUSE’S/
PARTNER’S, 3 = CHILD/GRANDCHILD). SET ALL YES ANSWER = 1 AND
ALL NO ANSWER = 0.
[IF SDEBT1 = 1 OR SDEBT2 = 1 OR SDEBT3 = 1]
[GRIDWITH CHECK BOXES (next to each check box, put “Yes” [ Yes])]
[ONLY SHOW ROWSWHERE S7=1 YES][suppress default instructions]
T0. For each of the categories of people below, is the money you owe for their edu-
cation a student loan, a home equity loan, a credit card debt, or some other type
of loan? If you have multiple loans for a type of person, please select all that apply.
A. Student loanB. Homeequity loan
C. Credit card D. Other loan
1. Your own education (IF S7a=1)
2. Spouse’s/partner’s education (IF S7b=1)
3. Child’s or grandchild’s education (IF S7c=1)
NOTE: FOR T1 SET VARIABLE NAMES TO BE T1 + COLUMN IDENTI-
FIER + ROW IDENTIFIER, E.G., T1A1. KEEP ROW IDENTIFIERS TIED TO
TYPE OF LOAN (1 = YOUR EDUCATION, 2 = YOUR SPOUSE’S/
PARTNER’S, 3 = CHILD/GRANDCHILD). SET ALL YES ANSWER = 1 AND
ALL NO ANSWER = 0.
[GRIDWITH NUMBER BOXES AND CHECK BOXES (next to each check box,
put “Yes” [ Yes])]
[COLUMN A NUMBER BOXES RANGE: 1-999,999; for column b, range
0-99,999]
66 Economic Well-Being of U.S. Households, 2014
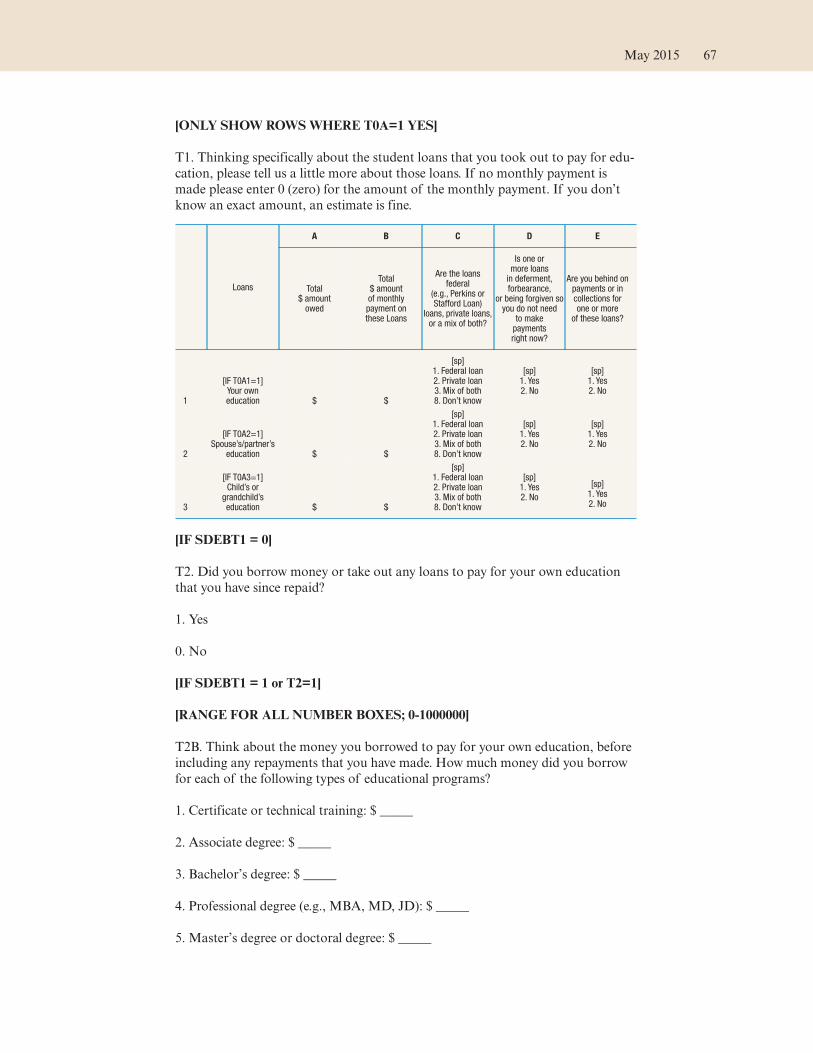
[ONLY SHOW ROWSWHERE T0A=1 YES]
T1. Thinking specifically about the student loans that you took out to pay for edu-
cation, please tell us a little more about those loans. If no monthly payment is
made please enter 0 (zero) for the amount of the monthly payment. If you don’t
know an exact amount, an estimate is fine.
Loans
A B C D E
Total$ amountowed
Total$ amountof monthlypayment onthese Loans
Are the loansfederal
(e.g., Perkins orStafford Loan)
loans, private loans,or a mix of both?
Is one ormore loansin deferment,forbearance,
or being forgiven soyou do not need
to makepaymentsright now?
Are you behind onpayments or incollections forone or more
of these loans?
1
[IF T0A1=1]Your owneducation $ $
[sp]1. Federal loan2. Private loan3. Mix of both8. Don’t know
[sp]1. Yes2. No
[sp]1. Yes2. No
2
[IF T0A2=1]Spouse’s/partner’s
education $ $
[sp]1. Federal loan2. Private loan3. Mix of both8. Don’t know
[sp]1. Yes2. No
[sp]1. Yes2. No
3
[IF T0A3=1]Child’s or
grandchild’seducation $ $
[sp]1. Federal loan2. Private loan3. Mix of both8. Don’t know
[sp]1. Yes2. No
[sp]1. Yes2. No
[IF SDEBT1 = 0]
T2. Did you borrow money or take out any loans to pay for your own education
that you have since repaid?
1. Yes
0. No
[IF SDEBT1 = 1 or T2=1]
[RANGE FOR ALL NUMBER BOXES; 0-1000000]
T2B. Think about the money you borrowed to pay for your own education, before
including any repayments that you have made. How much money did you borrow
for each of the following types of educational programs?
1. Certificate or technical training: $ _____
2. Associate degree: $ _____
3. Bachelor’s degree: $ _____
4. Professional degree (e.g., MBA, MD, JD): $ _____
5. Master’s degree or doctoral degree: $ _____
May 2015 67
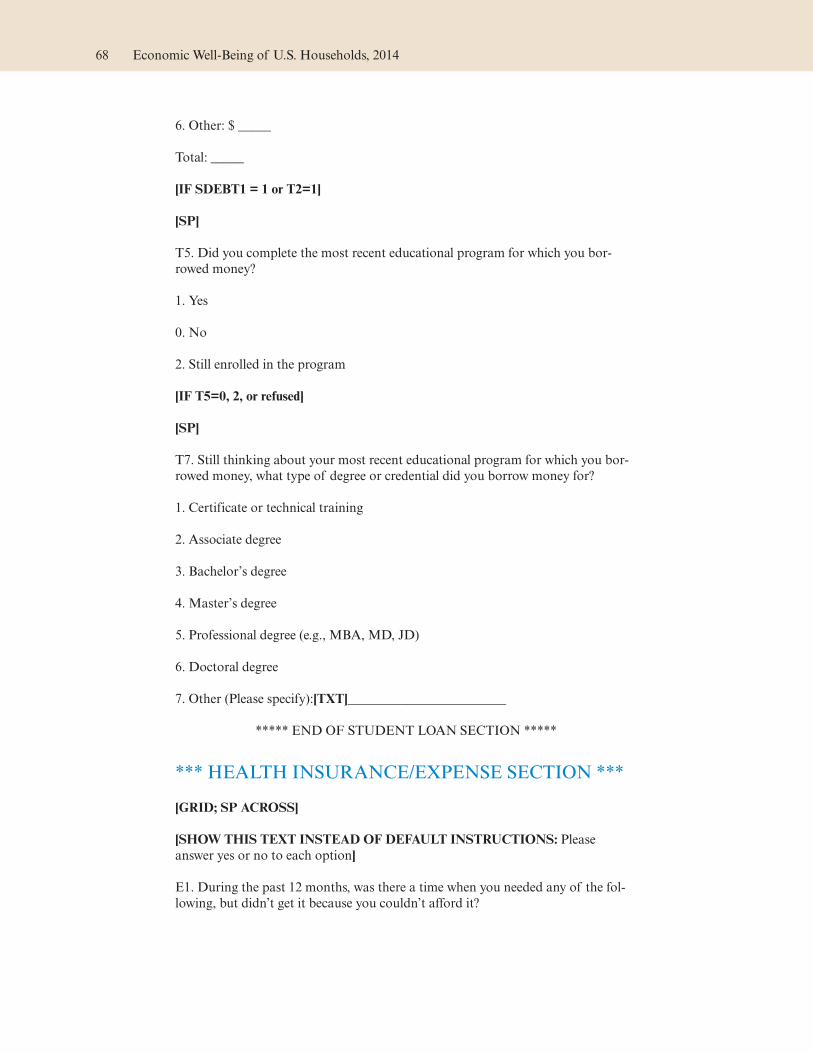
6. Other: $ _____
Total: _____
[IF SDEBT1 = 1 or T2=1]
[SP]
T5. Did you complete the most recent educational program for which you bor-
rowed money?
1. Yes
0. No
2. Still enrolled in the program
[IF T5=0, 2, or refused]
[SP]
T7. Still thinking about your most recent educational program for which you bor-
rowed money, what type of degree or credential did you borrow money for?
1. Certificate or technical training
2. Associate degree
3. Bachelor’s degree
4. Master’s degree
5. Professional degree (e.g., MBA, MD, JD)
6. Doctoral degree
7. Other (Please specify):[TXT]________________________
***** END OF STUDENT LOAN SECTION *****
*** HEALTH INSURANCE/EXPENSE SECTION ***
[GRID; SP ACROSS]
[SHOW THIS TEXT INSTEAD OF DEFAULT INSTRUCTIONS: Please
answer yes or no to each option]
E1. During the past 12 months, was there a time when you needed any of the fol-
lowing, but didn’t get it because you couldn’t afford it?
68 Economic Well-Being of U.S. Households, 2014
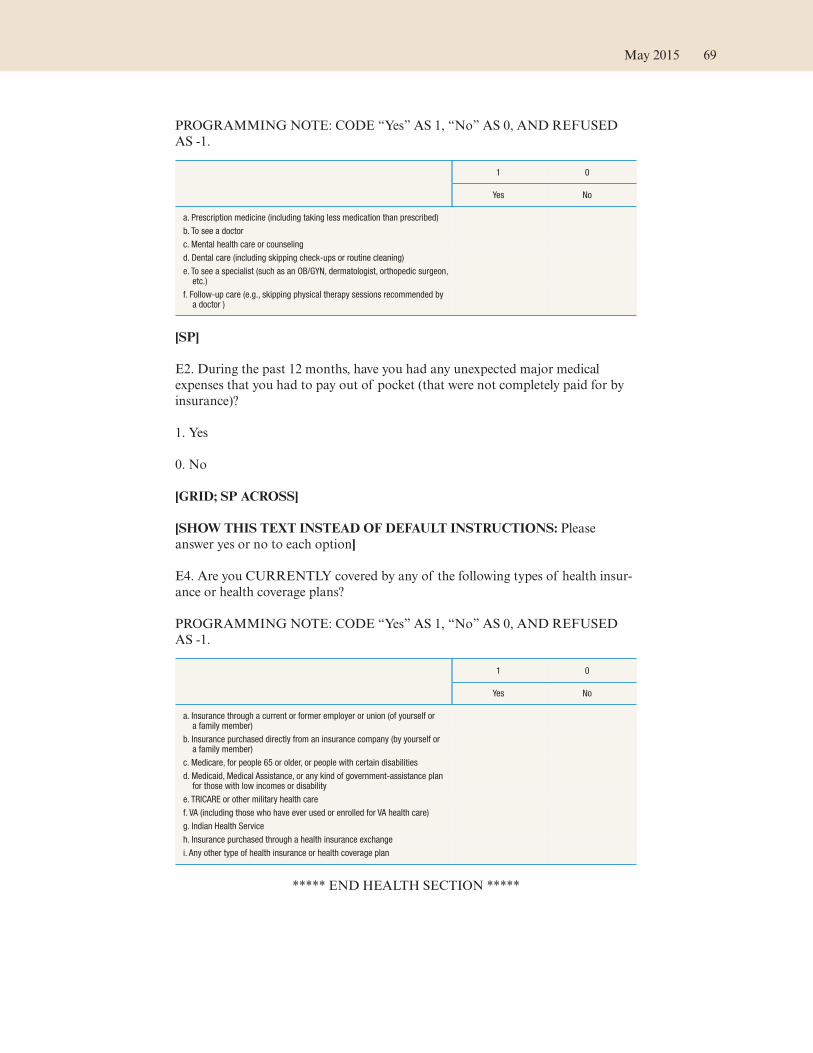
PROGRAMMING NOTE: CODE “Yes” AS 1, “No” AS 0, AND REFUSED
AS -1.
1 0
Yes No
a. Prescription medicine (including taking less medication than prescribed)
b. To see a doctor
c. Mental health care or counseling
d. Dental care (including skipping check-ups or routine cleaning)
e. To see a specialist (such as an OB/GYN, dermatologist, orthopedic surgeon,etc.)
f. Follow-up care (e.g., skipping physical therapy sessions recommended bya doctor )
[SP]
E2. During the past 12 months, have you had any unexpected major medical
expenses that you had to pay out of pocket (that were not completely paid for by
insurance)?
1. Yes
0. No
[GRID; SP ACROSS]
[SHOW THIS TEXT INSTEAD OF DEFAULT INSTRUCTIONS: Please
answer yes or no to each option]
E4. Are you CURRENTLY covered by any of the following types of health insur-
ance or health coverage plans?
PROGRAMMING NOTE: CODE “Yes” AS 1, “No” AS 0, AND REFUSED
AS -1.
1 0
Yes No
a. Insurance through a current or former employer or union (of yourself ora family member)
b. Insurance purchased directly from an insurance company (by yourself ora family member)
c. Medicare, for people 65 or older, or people with certain disabilities
d. Medicaid, Medical Assistance, or any kind of government-assistance planfor those with low incomes or disability
e. TRICARE or other military health care
f. VA (including those who have ever used or enrolled for VA health care)
g. Indian Health Service
h. Insurance purchased through a health insurance exchange
i. Any other type of health insurance or health coverage plan
***** END HEALTH SECTION *****
May 2015 69

***** FINANCIALMANAGEMENTAND STABILITY *****
[SP]
B2. Which one of the following best describes how well you are managing finan-
cially these days:
4. Living comfortably
3. Doing okay
2. Just getting by
1. Finding it difficult to get by
[PROGRAMMING NOTE – RANDOMIZE ORDER OF ASKING B3 and B4
AND RECORD ORDER IN A DOV]
DOV: B3B4
1 “B3 asked first”
2 “B4 asked first”
[SP]
B3. Compared to 12 months ago, would you say that you (and your family living
with you) are better off, the same, or worse off financially?
5. Much better off
4. Somewhat better off
3. About the same
2. Somewhat worse off
1. Much worse off
[SP]
B4. Compared to five years ago (since 2009), would you say that you (and your
family living with you) are better off, the same, or worse off financially?
5. Much better off
4. Somewhat better off
3. About the same
2. Somewhat worse off
70 Economic Well-Being of U.S. Households, 2014

1. Much worse off
[SP]
B5. Consider other people your age who had similar financial situations to you five
years ago (in 2009). When compared to these people, would you say that your cur-
rent financial situation is now:
5. A lot better than their current situation
4. A little better than their current situation
3. About the same as their current situation
2. A little worse than their current situation
1. A lot worse than their current situation
[SP]
B6. Think of your parents when they were your age. Would you say you (and your
family living with you) are better, the same, or worse off financially than they
were?
5. Much better off
4. Somewhat better off
3. About the same
2. Somewhat worse off
1. Much worse off
[SP]
B7. Think about the next generation of your family (e.g., your children, nieces,
nephews, etc.). When they are your age, do you think that they will be better off,
the same, or worse off financially than you are today?
5. Much better off
4. Somewhat better off
3. About the same
2. Somewhat worse off
1. Much worse off
** END OF FINANCIALMANAGEMENT AND STABILITY SECTION **
May 2015 71

***** RETIREMENT PLANNING *****
[SP]
[ASK IF D2 = 1-7 or Refused]
K0. How much thought have you given to the financial planning for your
retirement?
1. None at all
2. A little
3. Some
4. A fair amount
5. A lot
[SP]
[ASK IF D2 = 1-7 or Refused]
K1. Which one of the following best describes your plan for retirement?
1. I do not plan to retire [EXCLUSIVE]
2. Work fewer hours as I get close to retirement
3. Retire from my current career, but then find a different full-time job
4. Retire from my current career, but then find a different part-time job
5. Retire from my current career, but then work for myself
6. Work full time until I retire, then stop working altogether
7. Keep working as long as possible
8. Other (Please specify): [TXT] _________
[SP]
[ASK IF (D2=1-7 OR REFUSED AND K1=2, 3, 4, 5, 6, 7, 8, or refused) or
(D4b=1-2)]
K1B. At what age do you expect to retire fully, meaning completely stop working
for pay?
[Num box PPAGE-99]
72 Economic Well-Being of U.S. Households, 2014

888. Will never stop working [SP]
999. Not Sure [SP]
[SHOW THIS TEXT INSTEAD OF DEFAULT INSTRUCTIONS: Please
answer yes or no to each option]
[ASK IF D2 = 1-7 or Refused]
K2. Do you currently have each of the following types of retirement savings or
pension?
PROGRAMMING NOTE: CODE “Yes” AS 1, “No” AS 0, AND REFUSED
AS -1.
1 0
Yes No
b. 401(k), 403(b), thrift, or other defined contribution pension plan through anemployer or former employer (i.e., a retirement plan through work, whereyou contribute a percent of your salary to invest for retirement)
c. Defined benefit pension through an employer or former employer (i.e., apension that will pay you a fixed amount each year during retirement basedon a formula, your earnings, and years of service)
d. Individual Retirement Account (IRA) or Roth IRA
e. Savings outside a retirement account (e.g., a brokerage account, savingsaccount, or stock holdings)
f. Ownership of real estate or land that you plan to sell or rent to generateincome in retirement
g. Ownership of my business
h. Other retirement savings
[SP]
[ASK IF (D2 = 1-7 OR REFUSED) AND K1B<=99]
K2A. Thinking about your current savings for retirement, do you think that your
retirement savings is on track to allow you to retire with a comfortable standard of
living by your planned retirement age of [insert K1B response]?
4. Definitely yes
3. Probably yes
2. Probably no
1. Definitely no
9. Don’t know
[SP]
[ASK IF (K2A=1 or 2)]
K2B. You indicated that you do not think that your retirement savings is on track.
Which one of the following best describes your alternate savings plan or plan for
retirement?
May 2015 73

1. Continue working full time past your planned retirement age
2. Continue working part time past your planned retirement age
3. Retire at your planned retirement age but spend less in retirement
4. Retire at your planned retirement age but spend less while working to save more
for retirement
5. I have no alternate plan
6. Other [TXT] _______________
[SP]
[ASK IF (K2A=3, 4, or 9)]
K2C. If you determine that your retirement savings is no longer on track, how you
would adjust your savings plan or plans for retirement?
1. Continue working full time past your planned retirement age
2. Continue working part time past your planned retirement age
3. Retire at your planned retirement age but spend less in retirement
4. Retire at your planned retirement age but spend less while working to save more
for retirement
5. Would not adjust savings or retirement plan
6. Other [TXT] _______________
[MP; RANDOMIZE A-G]
[ASK IF (K2_b =0(no to 401(k), 403(b), thrift, or other defined contribution pen-
sion plan) or refused AND [(D3 = 1 or 2) or (D4A = 1 or 2) ]
K14. You stated that you do not participate in a 401(k), 403(b), thrift, or other
defined contribution plan from work. Please select all the reasons below for why
you do not currently invest in this type of retirement plan.
a. Employer does not offer a plan
b. Employer offers a plan but does not match contributions
c. Unable to afford contributions to a retirement plan
d. Plan to invest through the retirement plan but have not signed up yet
e. Unsure of best way to invest money contributed to the retirement plan
f. Prefer to save for retirement in other ways
74 Economic Well-Being of U.S. Households, 2014

g. Prefer to spend the money rather than save
h. Other (Please specify): [txt]________________________________
[ASK IF K2_b=1 (yes) and [(D3 = 1 or 2) or (D4A = 1 or 2)]
[NUMBER BOX]
K16: What percent of your paycheck do you contribute to your 401(k), 403(b),
thrift, or other defined contribution benefit plan?
[Num box, 0-25] ___
26. Over 25 percent
888. Don’t Know
[ASK IF (K2_b=1(yes) OR [K14a=2 (no) or refused K14b=2 (no) or refused]) AND
(D3 = 1 or 2)]
[NUMBER BOXWITH SP]
K17: Some employers will contribute to your 401(k), 403(b), or thrift account,
often matching a portion of any contributions that you make. What is the maxi-
mum percent of your salary that your employer will contribute to your account?
[Num box, 0-25] ___
26. Over 25 percent
888. Don’t know
[ASK IF (K2_b, K2_d, or K2_e=1) AND (D2 = 1-7 or Refused)]
[SP]
K18: How confident are you in your ability to make the right investment decisions
when managing and investing the money in your retirement accounts (including
IRA, 401(k), 403(b), thrift, or other retirement accounts where you choose the
investments for yourself)?
1. Very confident
2. Mostly confident
3. Slightly confident
4. Not confident
[ASK IF (K1=2, 3, 4, 5, 6, 7, 8 or refused) AND (D2 = 1-7 or Refused)]
[SHOW THIS TEXT INSTEAD OF DEFAULT INSTRUCTIONS: Please
answer yes, no, or don’t know to each option]
May 2015 75
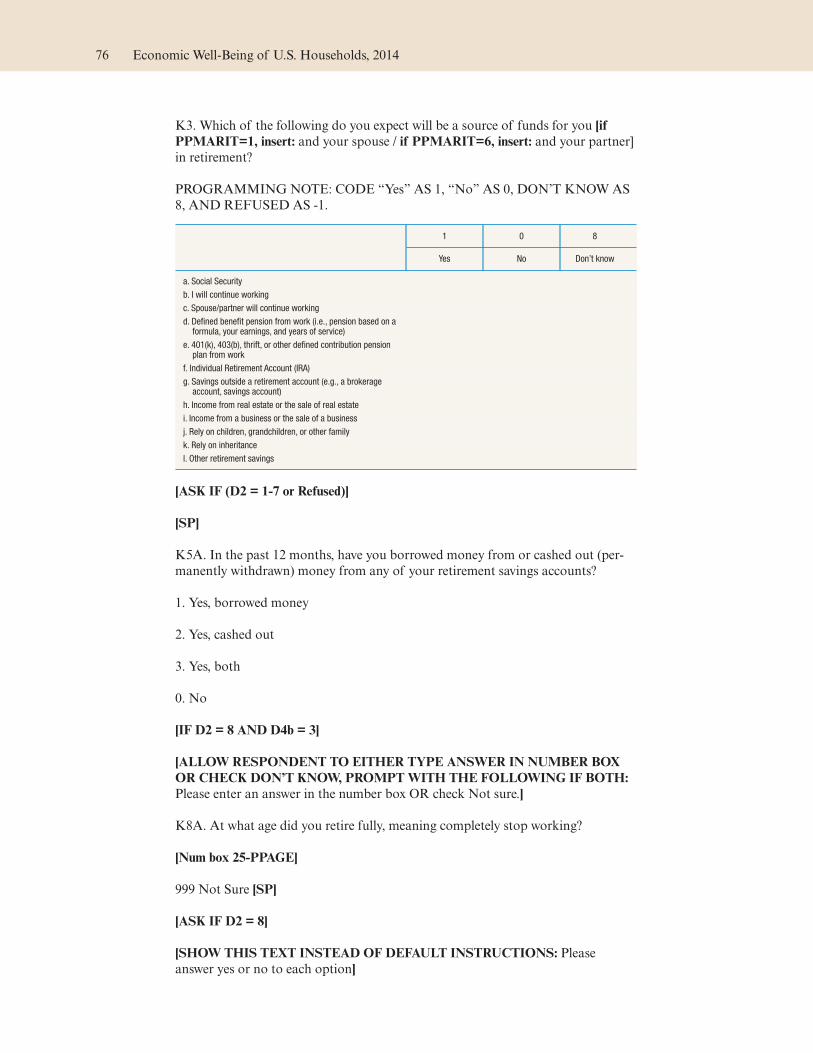
K3. Which of the following do you expect will be a source of funds for you [if
PPMARIT=1, insert: and your spouse / if PPMARIT=6, insert: and your partner]
in retirement?
PROGRAMMING NOTE: CODE “Yes” AS 1, “No” AS 0, DON’T KNOWAS
8, AND REFUSED AS -1.
1 0 8
Yes No Don’t know
a. Social Security
b. I will continue working
c. Spouse/partner will continue working
d. Defined benefit pension from work (i.e., pension based on aformula, your earnings, and years of service)
e. 401(k), 403(b), thrift, or other defined contribution pensionplan from work
f. Individual Retirement Account (IRA)
g. Savings outside a retirement account (e.g., a brokerageaccount, savings account)
h. Income from real estate or the sale of real estate
i. Income from a business or the sale of a business
j. Rely on children, grandchildren, or other family
k. Rely on inheritance
l. Other retirement savings
[ASK IF (D2 = 1-7 or Refused)]
[SP]
K5A. In the past 12 months, have you borrowed money from or cashed out (per-
manently withdrawn) money from any of your retirement savings accounts?
1. Yes, borrowed money
2. Yes, cashed out
3. Yes, both
0. No
[IF D2 = 8 AND D4b = 3]
[ALLOW RESPONDENT TO EITHER TYPE ANSWER IN NUMBER BOX
OR CHECK DON’T KNOW, PROMPTWITH THE FOLLOWING IF BOTH:
Please enter an answer in the number box OR check Not sure.]
K8A. At what age did you retire fully, meaning completely stop working?
[Num box 25-PPAGE]
999 Not Sure [SP]
[ASK IF D2 = 8]
[SHOW THIS TEXT INSTEAD OF DEFAULT INSTRUCTIONS: Please
answer yes or no to each option]
76 Economic Well-Being of U.S. Households, 2014

K9. Thinking about your transition to retirement, please tell us if you did any of
the following:
PROGRAMMING NOTE: CODE “Yes” AS 1, “No” AS 0, AND REFUSED
AS -1
1 0
Yes No
a. Worked fewer hours as I got close to retirement
b. Retired from my previous career, but then found a different full-time job
c. Retired from my previous career, but then found a different part-time job
d. Retired from my previous career, but then started working as self-employed
e. Worked full time until I retired, then stopped working altogether
f. Worked until health problems prevented me from continuing to work
[ASK IF D2 = 8]
[SHOW THIS TEXT INSTEAD OF DEFAULT INSTRUCTIONS: Please
answer yes or no to each option]
K10. Which of the following are sources of funds for you [IF PPMARIT=1,
INSERT: and your spouse / IF PPMARIT=6, INSERT: and your partner] in
retirement?
PROGRAMMING NOTE: CODE “Yes” AS 1, “No” AS 0, AND REFUSED
AS -1.
Yes No
a. Social Security
b. I have a job
c. My spouse/partner has a job
d. Defined benefit pension from work (i.e., pension based on a formula, yourearnings, and years of service)
e. 401(k), 403(b), thrift, or other defined contribution pension plan from work
f. Individual Retirement Account (IRA)
g. Savings outside a retirement account (e.g., a brokerage account, savingsaccount)
h. Income from real estate or the sale of real estate
i. Income from a business or the sale of a business
j. Relying on children, grandchildren, or other family
k. Other retirement savings
***** END RETIREMENT PLANNING SECTION *****
***** FINANCIAL HARDSHIP SECTION *****
[ASK EVERYONE]
[SP]
X1. Over the past year, have you or your family living with you experienced any
financial hardship such as a job loss, drop in income, health emergency, divorce, or
loss of your home?
1. Yes
May 2015 77
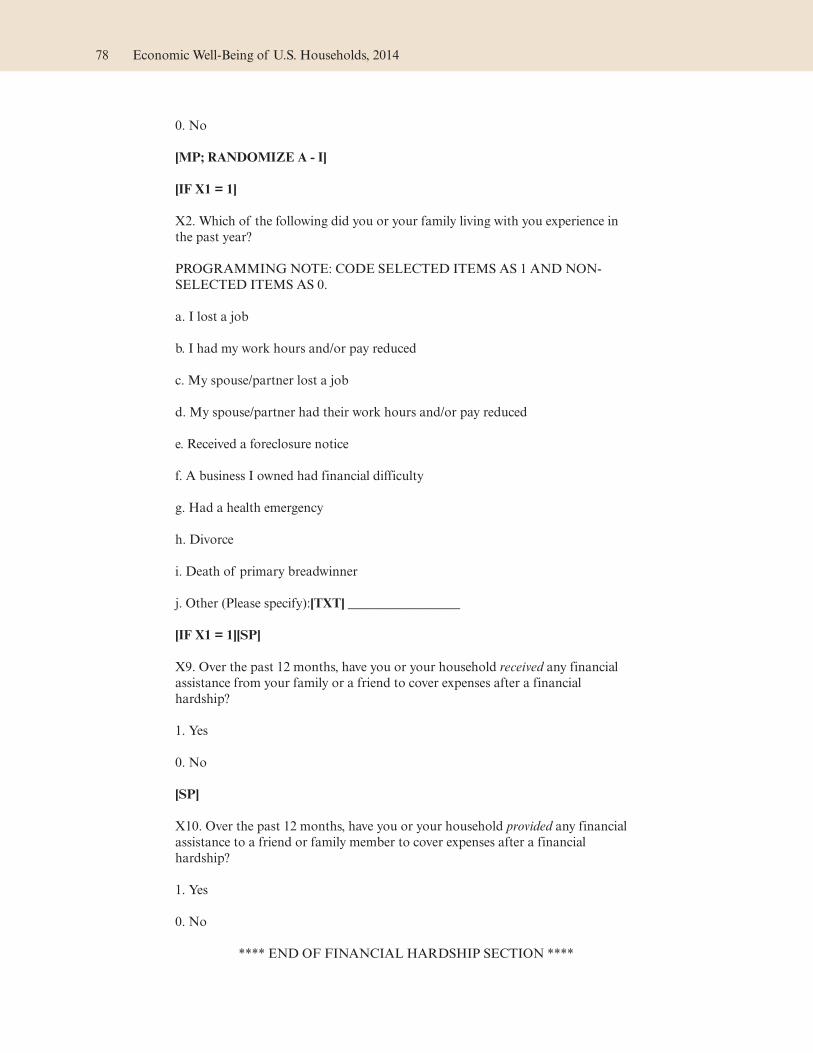
0. No
[MP; RANDOMIZE A - I]
[IF X1 = 1]
X2. Which of the following did you or your family living with you experience in
the past year?
PROGRAMMING NOTE: CODE SELECTED ITEMS AS 1 AND NON-
SELECTED ITEMS AS 0.
a. I lost a job
b. I had my work hours and/or pay reduced
c. My spouse/partner lost a job
d. My spouse/partner had their work hours and/or pay reduced
e. Received a foreclosure notice
f. A business I owned had financial difficulty
g. Had a health emergency
h. Divorce
i. Death of primary breadwinner
j. Other (Please specify):[TXT] _________________
[IF X1 = 1][SP]
X9. Over the past 12 months, have you or your household received any financial
assistance from your family or a friend to cover expenses after a financial
hardship?
1. Yes
0. No
[SP]
X10. Over the past 12 months, have you or your household provided any financial
assistance to a friend or family member to cover expenses after a financial
hardship?
1. Yes
0. No
**** END OF FINANCIAL HARDSHIP SECTION ****
78 Economic Well-Being of U.S. Households, 2014

**** INCOME AND CONSUMPTION SECTION ****
[SP]
I1. In the past 12 months, would you say that your household’s total spending was:
3. More than your income
2. The same as your income
1. Less than your income
[NUMBER BOX]
[IF (D2=1 to 7) OR (D4B = 1 or 2)]
I2. In the past 12 months, what percent of your household’s total gross income
(before taxes and deductions) did you set aside as savings?
Please include all types of savings, even those through a pension or 401(k) at work.
If you did not save any money in the past 12 months please enter zero in the box
below.
____ % [NUM-BOX 0 TO 100]
[NUMBER BOX]
[IF I2 > 0]
I2A. How do you think that the percent of your income that you saved in the past
12 months compared to the average percent saved by other people your age with
similar incomes?
a. Much lower
b. A little lower
c. About the same
d. A little higher
e. Much higher
[MP; RANDOMIZE A - J]
[IF I2 > 0]
I3. Which of the following categories, if any, are you saving money for?
PROGRAMMING NOTE: CODE SELECTED ITEMS AS 1 AND NON-
SELECTED ITEMS AS 0.
a. Education (yours or someone else’s)
May 2015 79
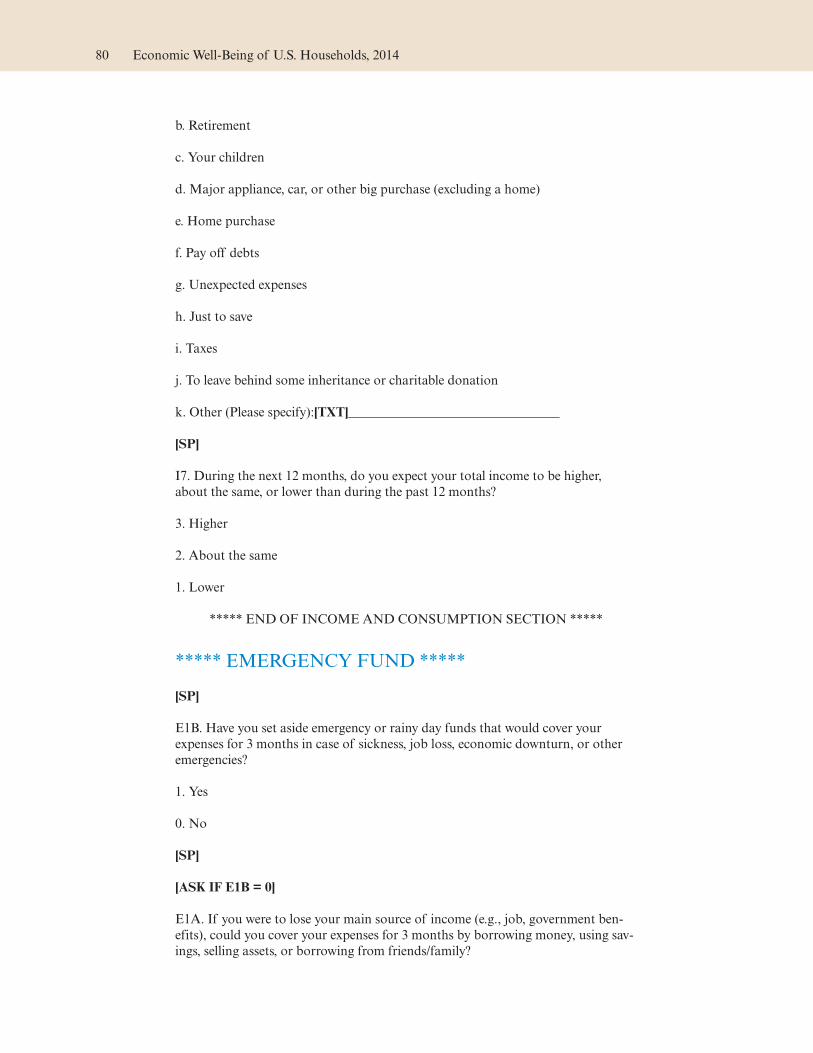
b. Retirement
c. Your children
d. Major appliance, car, or other big purchase (excluding a home)
e. Home purchase
f. Pay off debts
g. Unexpected expenses
h. Just to save
i. Taxes
j. To leave behind some inheritance or charitable donation
k. Other (Please specify):[TXT]________________________________
[SP]
I7. During the next 12 months, do you expect your total income to be higher,
about the same, or lower than during the past 12 months?
3. Higher
2. About the same
1. Lower
***** END OF INCOME AND CONSUMPTION SECTION *****
***** EMERGENCY FUND *****
[SP]
E1B. Have you set aside emergency or rainy day funds that would cover your
expenses for 3 months in case of sickness, job loss, economic downturn, or other
emergencies?
1. Yes
0. No
[SP]
[ASK IF E1B = 0]
E1A. If you were to lose your main source of income (e.g., job, government ben-
efits), could you cover your expenses for 3 months by borrowing money, using sav-
ings, selling assets, or borrowing from friends/family?
80 Economic Well-Being of U.S. Households, 2014

1. Yes
0. No
[MP; Suppress default instructions]
E3A. Suppose that you have an emergency expense that costs $400. Based on your
current financial situation, how would you pay for this expense? If you would use
more than one method to cover this expense, please select all that apply.
PROGRAMMING NOTE: CODE SELECTED ITEMS AS 1 AND NON-
SELECTED ITEMS AS 0.
a. Put it on my credit card and pay it off in full at the next statement
b. Put it on my credit card and pay it off over time
c. With the money currently in my checking/savings account or with cash
d. Using money from a bank loan or line of credit
e. By borrowing from a friend or family member
f. Using a payday loan, deposit advance, or overdraft
g. By selling something
h. I wouldn’t be able to pay for the expense right now
i. Other (Please specify):[TXT]___________________________
[SP]
[IF (E3A=b, d, e, f, g, or h) and (a or c) not selected for E3A]
E3B. Based on your current financial situation, what is the largest emergency
expense that you could pay right now using cash or money in your checking/
savings account?
1. Under $100
2. $100 to $199
3. $200 to $299
4. $300 to $399
5. Over $400
***** END OF EMERGENCY FUND SECTION *****
May 2015 81


Appendix 3: Consumer Responses toSurvey Questionnaire
Not all questions were asked to all respondents. Question numbers are not always sequential in order to preserve
continuity with the question numbers from the 2013 survey. Questions are listed below in the order in which
they were presented to respondents.
Question D1. Which one of the following BEST describesyour living arrangement?
Percent, except as noted
Response Rate
Refused 0.1
Living alone or only with your immediate family (i.e.,spouse/partner and/or dependent children) 80.1
Living with your adult children 2.4
Living with your (or your spouse’s/partner’s) parents 9.7
Living with your (or your spouse’s/partner’s) extended family(e.g., siblings, cousins) 3.0
Living with roommate(s) 4.7
Number of respondents 5,896
Question D2. We are interested in your present job status.Which one of the following BEST describes your currentemployment situation?
Percent, except as noted
Response Rate
Refused 0.2
Employed now 55.3
Temporarily laid off 0.4
Not employed, but looking for a job 5.3
Not employed and not looking for a job 1.8
Homemaker 6.7
Student 4.5
Disabled and not working 6.6
Retired 19.3
Number of respondents 2,149
Question D3. Thinking of your main job, do you:
Percent, except as noted
Response Rate
Refused 0.1
Work full time for someone else 75.4
Work part time for someone else 15.7
Work for yourself (self-employed) 7.8
Work in a partnership (e.g., partner in law firm, medicalpractice) 0.4
Work as a consultant/contractor 0.6
Number of respondents 2,149
Question D4A. Besides being a student, do you also havea paid job?
Percent, except as noted
Response Rate
Refused 0.4
Yes, I work full time 2.6
Yes, I work part time 46.8
No 50.2
Number of respondents 194
83
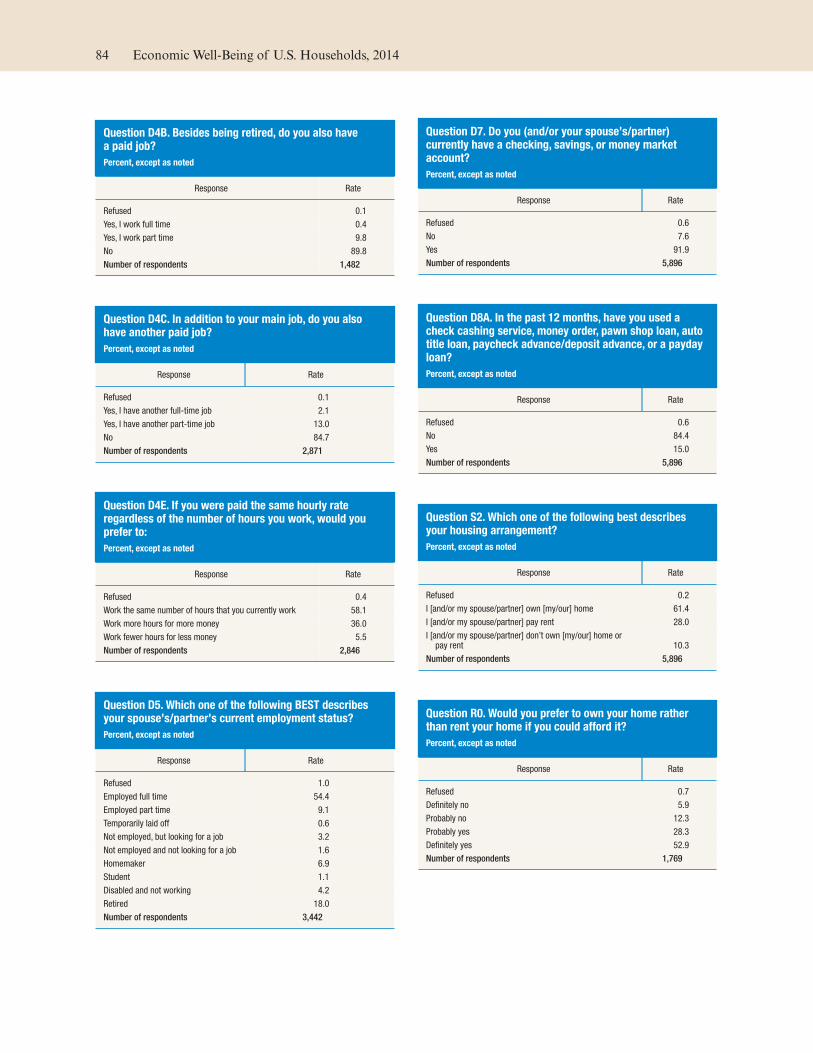
Question D4B. Besides being retired, do you also havea paid job?
Percent, except as noted
Response Rate
Refused 0.1
Yes, I work full time 0.4
Yes, I work part time 9.8
No 89.8
Number of respondents 1,482
Question D4C. In addition to your main job, do you alsohave another paid job?
Percent, except as noted
Response Rate
Refused 0.1
Yes, I have another full-time job 2.1
Yes, I have another part-time job 13.0
No 84.7
Number of respondents 2,871
Question D4E. If you were paid the same hourly rateregardless of the number of hours you work, would youprefer to:
Percent, except as noted
Response Rate
Refused 0.4
Work the same number of hours that you currently work 58.1
Work more hours for more money 36.0
Work fewer hours for less money 5.5
Number of respondents 2,846
Question D5. Which one of the following BEST describesyour spouse’s/partner’s current employment status?
Percent, except as noted
Response Rate
Refused 1.0
Employed full time 54.4
Employed part time 9.1
Temporarily laid off 0.6
Not employed, but looking for a job 3.2
Not employed and not looking for a job 1.6
Homemaker 6.9
Student 1.1
Disabled and not working 4.2
Retired 18.0
Number of respondents 3,442
Question D7. Do you (and/or your spouse’s/partner)currently have a checking, savings, or money marketaccount?
Percent, except as noted
Response Rate
Refused 0.6
No 7.6
Yes 91.9
Number of respondents 5,896
Question D8A. In the past 12 months, have you used acheck cashing service, money order, pawn shop loan, autotitle loan, paycheck advance/deposit advance, or a paydayloan?
Percent, except as noted
Response Rate
Refused 0.6
No 84.4
Yes 15.0
Number of respondents 5,896
Question S2. Which one of the following best describesyour housing arrangement?
Percent, except as noted
Response Rate
Refused 0.2
I [and/or my spouse/partner] own [my/our] home 61.4
I [and/or my spouse/partner] pay rent 28.0
I [and/or my spouse/partner] don’t own [my/our] home orpay rent 10.3
Number of respondents 5,896
Question R0. Would you prefer to own your home ratherthan rent your home if you could afford it?
Percent, except as noted
Response Rate
Refused 0.7
Definitely no 5.9
Probably no 12.3
Probably yes 28.3
Definitely yes 52.9
Number of respondents 1,769
84 Economic Well-Being of U.S. Households, 2014

Question R1. Please select all the reasons below for whyyou rent your home rather than own your home.
Percent, except as noted
Response Rate
Refused 0.9
It’s cheaper to rent than own a home 26.6
It’s more convenient to rent (for example, you can move easily) 24.7
I plan on moving in the near future 22.3
I can’t qualify for a mortgage to buy a home 30.9
I can’t afford the down payment to buy a home 50.2
I simply prefer to rent 11.7
I’m currently looking to buy a home 9.4
Other 9.2
Number of respondents 1,769
Question R7. Do you expect to purchase a home in the nextthree years?
Percent, except as noted
Response Rate
Refused 0.3
Definitely no 24.9
Probably no 27.7
Probably yes 17.7
Definitely yes 9.2
Don’t know 20.2
Number of respondents 2,250
Question H0. Please select all the reasons below for whyyou own your home rather than rent.
Percent, except as noted
Response Rate
Refused 0.5
It’s cheaper to own than rent a home 41.5
Certainty about monthly payments 20.2
Building equity with payments 43.7
Don’t like to move 22.7
Less rules/able to customize house 42.7
Simply prefer to own 72.2
Other 6.3
Number of respondents 3,638
Question H1. Compared to 12 months ago, do you think thevalue of your home today is higher, lower, or stayed thesame?
Percent, except as noted
Response Rate
Refused 0.4
Lower value 13.4
Value has stayed the same 37.2
Higher value 42.9
Don’t know 6.1
Number of respondents 3,402
Question H4. In the next 12 months, how much do you thinkthat home prices in your neighborhood will change?
Percent, except as noted
Response Rate
Refused 0.5
Go down by more than 5 percent 2.2
Go down by less than 5 percent 3.6
Stay about the same 41.4
Go up by less than 5 percent 24.2
Go up by more than 5 percent 14.7
Don’t know 13.3
Number of respondents 3,638
Question H5. Thinking about the past 12 months, which oneof the following categories best describes your situationconcerning selling your current home?
Percent, except as noted
Response Rate
Refused 0.7
I wanted to sell, so I put it on the market but could not sell it 1.2
I wanted to sell, but did not put it on the market 7.8
I did not want to sell 89.0
My home is currently on the market 1.3
Number of respondents 3,638
May 2015 85

Question H7. Please select all the sources below that youused to make the down-payment (if any) when youpurchased your current home:
Percent, except as noted
Response Rate
Refused 0.8
Proceeds from sale of previous home 29.3
Personal savings 52.6
Loan or gift from family/friends 15.2
Second mortgage 2.5
Financial assistance from a government program or nonprofitorganization 4.4
Did not make a down payment [EXCLUSIVE] 19.8
Number of respondents 1,263
Question M0. Do you (and/or your spouse/partner/significant other) currently have a mortgage on your home?
Percent, except as noted
Response Rate
Refused 0.5
No 38.0
Yes 61.5
Number of respondents 3,638
Question M2. In the past 12 months, have or yourspouse/partner missed two or more payments on yourmortgage?
Percent, except as noted
Response Rate
Refused 0.1
No 96.6
Yes 3.2
Number of respondents 2,016
Question M3. Compared to the current value of your home,is the total amount of money you owe:
Percent, except as noted
Response Rate
Refused 0.1
A lot less 40.3
A little less 29.5
About the same (as the current value of your home) 10.0
A little more 7.9
A lot more 6.5
Don’t know 5.6
Number of respondents 2,016
Question L1. Please select all the reasons below that you(and your immediate family) currently live with your adultchildren, your or your spouse’s/partner’s parents, your oryour spouse’s/partner’s extended family, or roommates.
Percent, except as noted
Response Rate
Refused 6.2
To save money 53.1
To care for sick/disabled/elderly family member or friend 12.4
To receive assistance with child care 2.3
Companionship/prefer living with others 22.7
To provide financial assistance to those living with me 18.2
Other 20.7
Number of respondents 1,055
Question A0. In the last 12 months, have you (and/or yourspouse/partner/significant other) applied for any credit?
Percent, except as noted
Response Rate
Refused 0.9
No 62.6
Yes 36.5
Number of respondents 5,896
Question A0A. Please select all of the types of credit belowthat you (and/or your spouse/partner/significant other)have applied for in the past 12 months.
Percent, except as noted
Response Rate
Refused 0.3
Mortgage to buy a new home 7.0
Refinance of a home mortgage 7.1
Home equity loan or line of credit 6.2
Credit card 65.3
Car/auto loan 26.2
Student loan 12.9
Personal loan from friends or family 6.0
Other 7.8
Number of respondents 2,015
86 Economic Well-Being of U.S. Households, 2014
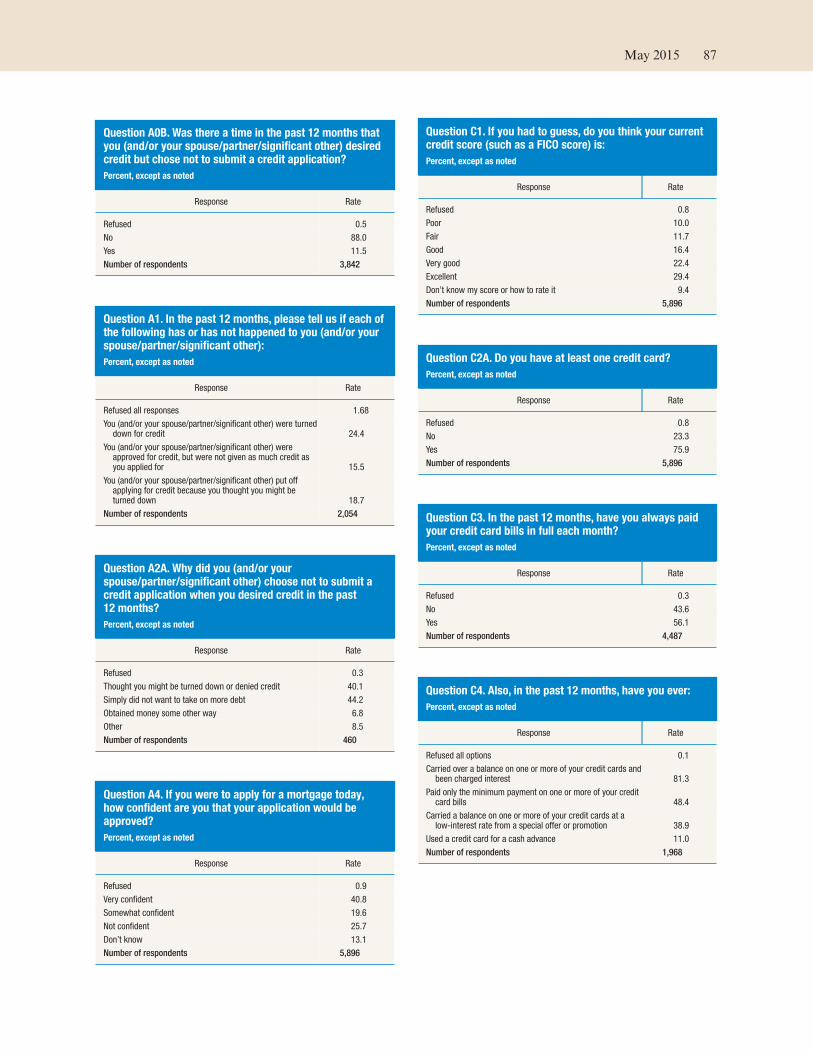
Question A0B. Was there a time in the past 12 months thatyou (and/or your spouse/partner/significant other) desiredcredit but chose not to submit a credit application?
Percent, except as noted
Response Rate
Refused 0.5
No 88.0
Yes 11.5
Number of respondents 3,842
Question A1. In the past 12 months, please tell us if each ofthe following has or has not happened to you (and/or yourspouse/partner/significant other):
Percent, except as noted
Response Rate
Refused all responses 1.68
You (and/or your spouse/partner/significant other) were turneddown for credit 24.4
You (and/or your spouse/partner/significant other) wereapproved for credit, but were not given as much credit asyou applied for 15.5
You (and/or your spouse/partner/significant other) put offapplying for credit because you thought you might beturned down 18.7
Number of respondents 2,054
Question A2A. Why did you (and/or yourspouse/partner/significant other) choose not to submit acredit application when you desired credit in the past12 months?
Percent, except as noted
Response Rate
Refused 0.3
Thought you might be turned down or denied credit 40.1
Simply did not want to take on more debt 44.2
Obtained money some other way 6.8
Other 8.5
Number of respondents 460
Question A4. If you were to apply for a mortgage today,how confident are you that your application would beapproved?
Percent, except as noted
Response Rate
Refused 0.9
Very confident 40.8
Somewhat confident 19.6
Not confident 25.7
Don’t know 13.1
Number of respondents 5,896
Question C1. If you had to guess, do you think your currentcredit score (such as a FICO score) is:
Percent, except as noted
Response Rate
Refused 0.8
Poor 10.0
Fair 11.7
Good 16.4
Very good 22.4
Excellent 29.4
Don’t know my score or how to rate it 9.4
Number of respondents 5,896
Question C2A. Do you have at least one credit card?
Percent, except as noted
Response Rate
Refused 0.8
No 23.3
Yes 75.9
Number of respondents 5,896
Question C3. In the past 12 months, have you always paidyour credit card bills in full each month?
Percent, except as noted
Response Rate
Refused 0.3
No 43.6
Yes 56.1
Number of respondents 4,487
Question C4. Also, in the past 12 months, have you ever:
Percent, except as noted
Response Rate
Refused all options 0.1
Carried over a balance on one or more of your credit cards andbeen charged interest 81.3
Paid only the minimum payment on one or more of your creditcard bills 48.4
Carried a balance on one or more of your credit cards at alow-interest rate from a special offer or promotion 38.9
Used a credit card for a cash advance 11.0
Number of respondents 1,968
May 2015 87
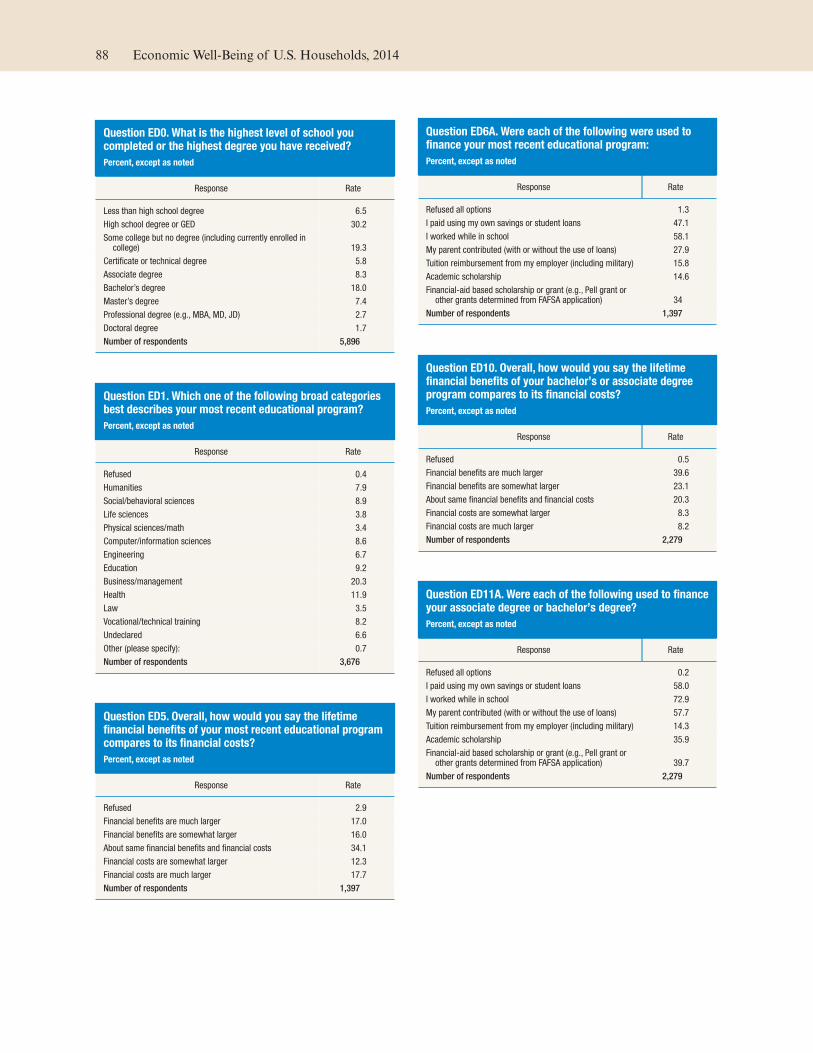
Question ED0. What is the highest level of school youcompleted or the highest degree you have received?
Percent, except as noted
Response Rate
Less than high school degree 6.5
High school degree or GED 30.2
Some college but no degree (including currently enrolled incollege) 19.3
Certificate or technical degree 5.8
Associate degree 8.3
Bachelor’s degree 18.0
Master’s degree 7.4
Professional degree (e.g., MBA, MD, JD) 2.7
Doctoral degree 1.7
Number of respondents 5,896
Question ED1. Which one of the following broad categoriesbest describes your most recent educational program?
Percent, except as noted
Response Rate
Refused 0.4
Humanities 7.9
Social/behavioral sciences 8.9
Life sciences 3.8
Physical sciences/math 3.4
Computer/information sciences 8.6
Engineering 6.7
Education 9.2
Business/management 20.3
Health 11.9
Law 3.5
Vocational/technical training 8.2
Undeclared 6.6
Other (please specify): 0.7
Number of respondents 3,676
Question ED5. Overall, how would you say the lifetimefinancial benefits of your most recent educational programcompares to its financial costs?
Percent, except as noted
Response Rate
Refused 2.9
Financial benefits are much larger 17.0
Financial benefits are somewhat larger 16.0
About same financial benefits and financial costs 34.1
Financial costs are somewhat larger 12.3
Financial costs are much larger 17.7
Number of respondents 1,397
Question ED6A. Were each of the following were used tofinance your most recent educational program:
Percent, except as noted
Response Rate
Refused all options 1.3
I paid using my own savings or student loans 47.1
I worked while in school 58.1
My parent contributed (with or without the use of loans) 27.9
Tuition reimbursement from my employer (including military) 15.8
Academic scholarship 14.6
Financial-aid based scholarship or grant (e.g., Pell grant orother grants determined from FAFSA application) 34
Number of respondents 1,397
Question ED10. Overall, how would you say the lifetimefinancial benefits of your bachelor’s or associate degreeprogram compares to its financial costs?
Percent, except as noted
Response Rate
Refused 0.5
Financial benefits are much larger 39.6
Financial benefits are somewhat larger 23.1
About same financial benefits and financial costs 20.3
Financial costs are somewhat larger 8.3
Financial costs are much larger 8.2
Number of respondents 2,279
Question ED11A. Were each of the following used to financeyour associate degree or bachelor’s degree?
Percent, except as noted
Response Rate
Refused all options 0.2
I paid using my own savings or student loans 58.0
I worked while in school 72.9
My parent contributed (with or without the use of loans) 57.7
Tuition reimbursement from my employer (including military) 14.3
Academic scholarship 35.9
Financial-aid based scholarship or grant (e.g., Pell grant orother grants determined from FAFSA application) 39.7
Number of respondents 2,279
88 Economic Well-Being of U.S. Households, 2014

Question ED12. Now please think about the highest degreethat you received (master’s, professional, or doctoraldegree). Overall, how would you say the lifetime financialbenefits of the program from which you received yourhighest degree compares to its financial costs?
Percent, except as noted
Response Rate
Refused 0.1
Financial benefits are much larger 47.4
Financial benefits are somewhat larger 28.0
About same financial benefits and financial costs 10.9
Financial costs are somewhat larger 7.2
Financial costs are much larger 6.3
Number of respondents 689
Question ED13. Which of the following are reasons why youdid not attend college?
Percent, except as noted
Response Rate
Refused 0.7
Too expensive 30.7
Family responsibilities 25.8
Wanted to work 30.4
Simply was not interested in college 38.1
Was not admitted 1.1
Did not think benefits of attending college were worth the cost 12.3
Other 10.9
Number of respondents 1,828
Question ED14. Which of the following are reasons why youdid not complete your college degree?
Percent, except as noted
Response Rate
Refused 0.6
Still enrolled in college 25.1
Too expensive 18.3
Family responsibilities 28.1
Wanted to work 20.2
Simply not interested in continuing in college 18.9
Did not think the benefits of continuing college were worththe cost 12.5
Low grades 5.5
Other 13.4
Number of respondents 1,059
Question ED15. What is the highest level of education thatyour mother completed?
Percent, except as noted
Response Rate
Refused 1.1
Less than high school degree 19.3
High school degree or GED 36.1
Some college but no degree 9.5
Certificate or technical degree 4.7
Associate degree 5.4
Bachelor’s degree 10.7
Graduate degree 5.9
Don’t know 7.4
Number of respondents 5,896
Question ED16. What is the highest level of education thatyour father completed?
Percent, except as noted
Response Rate
Refused 1.0
Less than high school degree 21.1
High school degree or GED 29.6
Some college but no degree 9.0
Certificate or technical degree 4.8
Associate degree 3.4
Bachelor’s degree 10.9
Graduate degree 8.0
Don’t know 12.3
Number of respondents 5,896
Question S7. Do you currently owe any money used to payfor your own education, your spouse’s education, or yourchild’s or grandchild’s education?
Percent, except as noted
Response Rate
Refused 0.5
Your own education 15.4
Spouse’s/partner’s education 5.8
Do not have spouse/partner 39.8
Child’s or grandchild’s education 6.3
Do not have children/grandchildren 29.3
Number of respondents 5,896
May 2015 89

Question T0_1. Is the money you owe for your owneducation a student loan, a home equity loan, a credit carddebt, or some other type of loan?
Percent, except as noted
Response Rate
Refused 0.8
Student loan 92.4
Home equity loan 3.7
Credit card 16.3
Other loan 10.6
Number of respondents 833
Question T0_2. Is the money you owe for yourspouse’s/partner’s education a student loan, a home equityloan, a credit card debt, or some other type of loan?
Percent, except as noted
Response Rate
Refused 0.6
Student loan 91.6
Home equity loan 2.7
Credit card 12.4
Other loan 7.5
Number of respondents 296
Question T0_3. Is the money you owe for yourchild’s/grandchild’s education a student loan, a homeequity loan, a credit card debt, or some other type of loan?
Percent, except as noted
Response Rate
Refused 2.5
Student loan 74.0
Home equity loan 7.5
Credit card 10.1
Other loan 11.8
Number of respondents 352
Question T1_C1. Thinking specifically about the studentloans that you took out to pay for education, please tell usa little more about those loans. For your own education, arethe loans federal (e.g., Perkins or Stafford Loan) loans,private loans, or a mix of both?
Percent, except as noted
Response Rate
Refused 8.1
Federal loan 49.7
Private loan 4.3
Mix of both 28.3
Don’t know 9.5
Number of respondents 769
Question T1_C2. Thinking specifically about the studentloans that you took out to pay for education, please tell usa little more about those loans. For your spouse’s/partner’seducation, are the loans federal (e.g., Perkins or StaffordLoan) loans, private loans, or a mix of both?
Percent, except as noted
Response Rate
Refused 10.9
Federal loan 42.5
Private loan 4.5
Mix of both 25.0
Don’t know 17.1
Number of respondents 270
Question T1_C3. Thinking specifically about the studentloans that you took out to pay for education, please tell usa little more about those loans. For yourchild’s/grandchild’s education, are the loans federal (e.g.,Perkins or Stafford Loan) loans, private loans, or a mix ofboth?
Percent, except as noted
Response Rate
Refused 10.9
Federal loan 43.5
Private loan 10.5
Mix of both 20.9
Don’t know 14.1
Number of respondents 264
Question T1_D1. Thinking specifically about the studentloans that you took out to pay for education, please tell usa little more about those loans. For your own education, isone or more loans in deferment, forbearance, or beingforgiven so you do not need to make payments right now?
Percent, except as noted
Response Rate
Refused 9.9
No 51.2
Yes 38.9
Number of respondents 769
90 Economic Well-Being of U.S. Households, 2014

Question T1_D2. Thinking specifically about the studentloans that you took out to pay for education, please tell usa little more about those loans. For your spouse’s/partner’seducation, is one or more loans in deferment, forbearance,or being forgiven so you do not need to make paymentsright now?
Percent, except as noted
Response Rate
Refused 13.1
No 64.5
Yes 22.4
Number of respondents 270
Question T1_D3. Thinking specifically about the studentloans that you took out to pay for education, please tell usa little more about those loans. For yourchild’s/grandchild’s education, is one or more loans indeferment, forbearance, or being forgiven so you do notneed to make payments right now?
Percent, except as noted
Response Rate
Refused 12.6
No 55.1
Yes 32.3
Number of respondents 264
Question T1_E1. Thinking specifically about the studentloans that you took out to pay for education, please tell usa little more about those loans. For your own education, areyou behind on payments or in collections for one or more ofthese loans?
Percent, except as noted
Response Rate
Refused 10.0
No 75.9
Yes 14.1
Number of respondents 769
Question T1_E2. Thinking specifically about the studentloans that you took out to pay for education, please tell usa little more about those loans. For your spouse’s/partner’seducation, are you behind on payments or in collections forone or more of these loans?
Percent, except as noted
Response Rate
Refused 12.2
No 78.2
Yes 9.6
Number of respondents 270
Question T1_E3. Thinking specifically about the studentloans that you took out to pay for education, please tell usa little more about those loans. For yourchild’s/grandchild’s education, are you behind onpayments or in collections for one or more of these loans?
Percent, except as noted
Response Rate
Refused 14.9
No 77.7
Yes 7.4
Number of respondents 264
Question T2. Did you borrow money or take out any loansto pay for your own education that you have since repaid?
Percent, except as noted
Response Rate
Refused 1.2
No 85.6
Yes 13.3
Number of respondents 5,063
Question T5. Did you complete the most recent educationalprogram for which you borrowed money?
Percent, except as noted
Response Rate
Refused 0.5
No 19.8
Yes 65.4
Still enrolled in the program 14.3
Number of respondents 1,525
Question T7. Still thinking about your most recenteducational program for which you borrowed money, whattype of degree or credential did you borrow money for?
Percent, except as noted
Response Rate
Refused 2.8
Certificate or technical training 11.9
Associate degree 23.4
Bachelor’s degree 44.2
Master’s degree 10.5
Professional degree (e.g., MBA, MD, JD) 1.5
Doctoral degree 1.8
Other (please specify): 3.8
Number of respondents 514
May 2015 91

Question E1. During the past 12 months, was there a timewhen you needed any of the following, but didn’t get itbecause you couldn’t afford it?
Percent, except as noted
Response Rate
Refused all options 1.2
Prescription medicine (including taking less medication thanprescribed) 13.2
To see a doctor 15.1
Mental health care or counseling 6.3
Dental care (including skipping check-ups or routine cleaning) 24.6
To see a specialist (such as an OB/GYN, dermatologist,orthopedic surgeon, etc.) 10.9
Follow-up care (e.g., skipping physical therapy sessionsrecommended by a doctor) 8.2
Number of respondents 5,896
Question E2. During the past 12 months, have you had anyunexpected major medical expenses that you had to payout of pocket (that were not completely paid for byinsurance)?
Percent, except as noted
Response Rate
Refused 1.1
No 74.8
Yes 24.0
Number of respondents 5,896
Question E4. Are you CURRENTLY covered by any of thefollowing types of health insurance or health coverageplans?
Percent, except as noted
Response Rate
Refused all options 1.2
Insurance through a current or former employer or union (ofyourself or a family member) 56.1
Insurance purchased directly from an insurance company (byyourself or a family member) 11.5
Medicare, for people 65 or older, or people with certaindisabilities 21.7
Medicaid, Medical Assistance, or any kind ofgovernment-assistance plan for those with low incomes ordisability 12.7
TRICARE or other military health care 3.4
VA (including those who have ever used or enrolled for VAhealth care) 4.0
Indian Health Service 1.6
Insurance purchased through a health insurance exchange 3.1
Any other type of health insurance or health coverage plan 5.5
Number of respondents 5,896
Question B2. Which one of the following best describeshow well you are managing financially these days?
Percent, except as noted
Response Rate
Refused 1.1
Finding it difficult to get by 10.3
Just getting by 24.1
Doing okay 39.8
Living comfortably 24.7
Number of respondents 5,896
Question B3. Compared to 12 months ago, would you saythat you (and your family living with you) are better off, thesame, or worse off financially?
Percent, except as noted
Response Rate
Refused 1.2
Much worse off 4.6
Somewhat worse off 16.6
About the same 48.8
Somewhat better off 21.8
Much better off 7.0
Number of respondents 5,896
Question B4. Compared to five years ago (since 2009),would you say that you (and your family living with you)are better off, the same, or worse off financially?
Percent, except as noted
Response Rate
Refused 1.4
Much worse off 8.8
Somewhat worse off 18.8
About the same 30.9
Somewhat better off 26.7
Much better off 13.5
Number of respondents 5,896
92 Economic Well-Being of U.S. Households, 2014

Question B5. Consider other people your age who hadsimilar financial situations to you five years ago (in 2009).When compared to these people, would you say that yourcurrent financial situation is now:
Percent, except as noted
Response Rate
Refused 2.1
A lot worse than their current situation 5.9
A little worse than their current situation 14.2
About the same as their current situation 43.7
A little better than their current situation 24.0
A lot better than their current situation 10.0
Number of respondents 5,896
Question B6. Think of your parents when they were yourage. Would you say you (and your family living with you)are better, the same, or worse off financially than theywere?
Percent, except as noted
Response Rate
Refused 1.6
Much worse off 7.8
Somewhat worse off 15.6
About the same 22.6
Somewhat better off 28.6
Much better off 23.8
Number of respondents 5,896
Question B7. Think about the next generation of your family(e.g., your children, nieces, nephews, etc.). When they areyour age, do you think that they will be better off, the same,or worse off financially than you are today?
Percent, except as noted
Response Rate
Refused 1.8
Much worse off 8.0
Somewhat worse off 20.1
About the same 26.3
Somewhat better off 29.3
Much better off 14.5
Number of respondents 5,896
Question K0. How much thought have you given to thefinancial planning for your retirement?
Percent, except as noted
Response Rate
Refused 1.2
None at all 17.1
A little 22.4
Some 24.8
A fair amount 21.4
A lot 13.1
Number of respondents 4,414
May 2015 93

Question K1. Which one of the following best describesyour plan for retirement?
Percent, except as noted
Response Rate
Refused 1.9
I do not plan to retire 12.1
Work fewer hours as I get close to retirement 8.8
Retire from my current career, but then find a differentfull-time job 2.4
Retire from my current career, but then find a differentpart-time job 11.7
Retire from my current career, but then work for myself 7.5
Work full time until I retire, then stop working altogether 20.3
Keep working as long as possible 25.1
Other (please specify): 10.3
Number of respondents 4,414
Question K2. Do you currently have each of the followingtypes of retirement savings or pension?
Percent, except as noted
Response Rate
Refused all options 1.7
401(k), 403(b), thrift, or other defined contribution pensionplan through an employer or former employer (i.e., aretirement plan through work, where you contributea percent of your salary to invest for retirement) 46.5
Defined benefit pension through an employer or formeremployer (i.e., a pension that will pay you a fixed amounteach year during retirement based on a formula, yourearnings, and years of service) 21.8
Individual Retirement Account (IRA) or Roth IRA 28.9
Savings outside a retirement account (e.g., a brokerageaccount, savings account, or stock holdings) 37.1
Ownership of real estate or land that you plan to sell or rent togenerate income in retirement 15.2
Ownership of my business 6.5
Other retirement savings 11.2
Number of respondents 4,414
Question K2A. Thinking about your current savings forretirement, do you think that your retirement savings is ontrack to allow you to retire with a comfortable standard ofliving by your planned retirement age of [K1B response]?
Percent, except as noted
Response Rate
Refused 0.6
Definitely no 14.1
Probably no 20.8
Probably yes 43.7
Definitely yes 13
Don’t know 7.9
Number of respondents 1,536
Question K2B. You indicated that you do not think that yourretirement savings is on track. Which one of the followingbest describes your alternate savings plan or plan forretirement?
Percent, except as noted
Response Rate
Refused 0.6
Continue working full time past your planned retirement age 17.4
Continue working part time past your planned retirement age 24.7
Retire at your planned retirement age but spend less inretirement 12.8
Retire at your planned retirement age but spend less whileworking to save more for retirement 14.0
I have no alternate plan 25.5
Other 5.0
Number of respondents 593
Question K2C. If you determine that your retirementsavings is no longer on track, how you would adjust yoursavings plan or plans for retirement?
Percent, except as noted
Response Rate
Refused 0.4
Continue working full time past your planned retirement age 34.4
Continue working part time past your planned retirement age 26.5
Retire at your planned retirement age but spend less inretirement 13.6
Retire at your planned retirement age but spend less whileworking to save more for retirement 17.3
Would not adjust savings or retirement plan 5.2
Other 2.5
Number of respondents 937
Question K14. You stated that you do not participate in a401(k), 403(b), thrift, or other defined contribution planfrom work. Please select all the reasons below for why youdo not currently invest in this type of retirement plan.
Percent, except as noted
Response Rate
Refused 3.9
Employer does not offer a plan 41.5
Employer offers a plan but does not match contributions 6.2
Unable to afford contributions to a retirement plan 28.7
Plan to invest through the retirement plan but have not signedup yet 9.5
Unsure of best way to invest money contributed to theretirement plan 14.6
Prefer to save for retirement in other ways 12.3
Prefer to spend the money rather than save 4.1
Other 9.2
Number of respondents 1,143
94 Economic Well-Being of U.S. Households, 2014

Question K18. How confident are you in your ability to makethe right investment decisions when managing andinvesting the money in your retirement accounts (includingIRA, 401(k), 403(b), thrift, or other retirement accountswhere you choose the investments for yourself)?
Percent, except as noted
Response Rate
Refused 0.8
Very confident 11.6
Mostly confident 36.4
Slightly confident 34.0
Not confident 17.3
Number of respondents 2,566
Question K3. Which of the following do you expect will be asource of funds for you (and your spouse/partner) inretirement?
Percent, except as noted
Response Available Don’t know
Refused all options 1.6
Social Security 64.6 21.2
I will continue working 45.1 27.1
Spouse/partner will continue working 25.8 32.8
Defined benefit pension from work (i.e., pensionbased on a formula, your earnings, and yearsof service) 32.3 23.4
401(k), 403(b), thrift, or other defined contributionpension plan from work 54.0 18.1
Individual Retirement Account (IRA) 37.0 24.0
Savings outside a retirement account (e.g., abrokerage account, savings account) 46.4 20.7
Income from real estate or the sale of real estate 19.6 26.6
Income from a business or the sale of a business 6.9 24.6
Rely on children, grandchildren, or other family 4.9 22.3
Rely on inheritance 8.0 22.4
Other retirement savings 14.8 26.9
Number of respondents 3,838
Question K5A. In the past 12 months, have you borrowedmoney from or cashed out (permanently withdrawn) moneyfrom any of your retirement savings accounts?
Percent, except as noted
Response Rate
Refused 1.8
No 88.2
Yes, borrowed money 4.1
Yes, cashed out 4.8
Yes, both 1.2
Number of respondents 4,414
Question K9. Thinking about your transition to retirement,please tell us if you did any of the following:
Percent, except as noted
Response Rate
Refused all options 0.2
Worked fewer hours as I got close to retirement 16.9
Retired from my previous career, but then found a differentfull-time job 5.9
Retired from my previous career, but then found a differentpart-time job 17.3
Retired from my previous career, but then started working asself-employed 9.0
Worked full time until I retired, then stopped workingaltogether 51.1
Worked until health problems prevented me from continuingto work 20.0
Number of respondents 1,482
Question K10. Which of the following are sources of fundsfor you (and your spouse/partner) in retirement?
Percent, except as noted
Response Rate
Refused all options 0.2
Social Security 89.4
I have a job 7.6
My spouse/partner has a job 16.5
Defined benefit pension from work (i.e., pension based on aformula, your earnings, and years of service) 62.4
401(k), 403(b), thrift, or other defined contribution pensionplan from work 32.2
Individual Retirement Account (IRA) 44.8
Savings outside a retirement account (e.g., a brokerageaccount, savings account) 50.1
Income from real estate or the sale of real estate 11.9
Income from a business or the sale of a business 2.4
Relying on children, grandchildren, or other family 3.8
Other retirement savings 21.4
Number of respondents 1,482
Question X1. Over the past year, have you or your familyliving with you experienced any financial hardship such asa job loss, drop in income, health emergency, divorce, orloss of your home?
Percent, except as noted
Response Rate
Refused 1.2
No 74.6
Yes 24.1
Number of respondents 5,896
May 2015 95
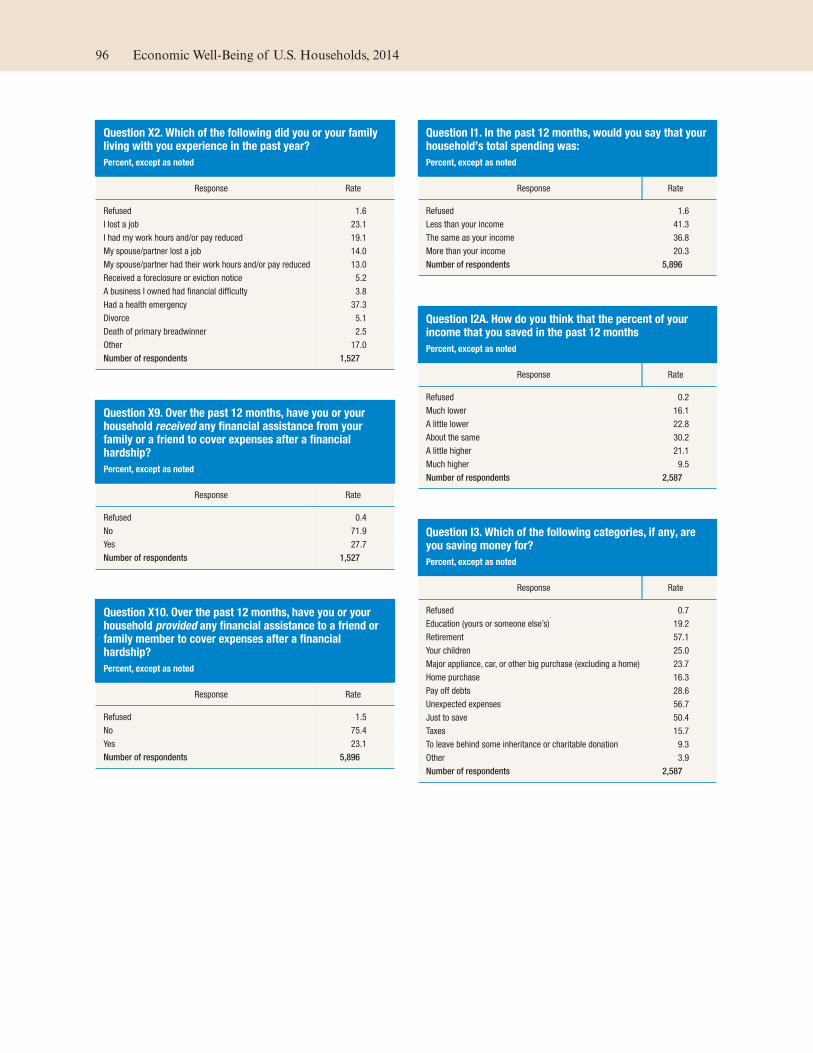
Question X2. Which of the following did you or your familyliving with you experience in the past year?
Percent, except as noted
Response Rate
Refused 1.6
I lost a job 23.1
I had my work hours and/or pay reduced 19.1
My spouse/partner lost a job 14.0
My spouse/partner had their work hours and/or pay reduced 13.0
Received a foreclosure or eviction notice 5.2
A business I owned had financial difficulty 3.8
Had a health emergency 37.3
Divorce 5.1
Death of primary breadwinner 2.5
Other 17.0
Number of respondents 1,527
Question X9. Over the past 12 months, have you or yourhousehold received any financial assistance from yourfamily or a friend to cover expenses after a financialhardship?
Percent, except as noted
Response Rate
Refused 0.4
No 71.9
Yes 27.7
Number of respondents 1,527
Question X10. Over the past 12 months, have you or yourhousehold provided any financial assistance to a friend orfamily member to cover expenses after a financialhardship?
Percent, except as noted
Response Rate
Refused 1.5
No 75.4
Yes 23.1
Number of respondents 5,896
Question I1. In the past 12 months, would you say that yourhousehold’s total spending was:
Percent, except as noted
Response Rate
Refused 1.6
Less than your income 41.3
The same as your income 36.8
More than your income 20.3
Number of respondents 5,896
Question I2A. How do you think that the percent of yourincome that you saved in the past 12 months
Percent, except as noted
Response Rate
Refused 0.2
Much lower 16.1
A little lower 22.8
About the same 30.2
A little higher 21.1
Much higher 9.5
Number of respondents 2,587
Question I3. Which of the following categories, if any, areyou saving money for?
Percent, except as noted
Response Rate
Refused 0.7
Education (yours or someone else’s) 19.2
Retirement 57.1
Your children 25.0
Major appliance, car, or other big purchase (excluding a home) 23.7
Home purchase 16.3
Pay off debts 28.6
Unexpected expenses 56.7
Just to save 50.4
Taxes 15.7
To leave behind some inheritance or charitable donation 9.3
Other 3.9
Number of respondents 2,587
96 Economic Well-Being of U.S. Households, 2014

Question I7. During the next 12 months, do you expect yourtotal income to be higher, about the same, or lower thanduring the past 12 months?
Percent, except as noted
Response Rate
Refused 1.6
Lower 9.1
About the same 60.2
Higher 29.1
Number of respondents 5,896
Question E1B. Have you set aside emergency or rainy dayfunds that would cover your expenses for 3 months in caseof sickness, job loss, economic downturn, or otheremergencies?
Percent, except as noted
Response Rate
Refused 2.0
No 53.5
Yes 44.5
Number of respondents 5,896
Question E1A. If you were to lose your main source ofincome (e.g., job, government benefits), could you coveryour expenses for 3 months by borrowing money, usingsavings, selling assets, or borrowing from friends/family?
Percent, except as noted
Response Rate
Refused 1.3
No 59.4
Yes 39.3
Number of respondents 3,166
Question E3A. Suppose that you have an emergencyexpense that costs $400. Based on your current financialsituation, how would you pay for this expense? If youwould use more than one method to cover this expense,please select all that apply.
Percent, except as noted
Response Rate
Refused 1.7
Put it on my credit card and pay it off in full at the nextstatement 28.6
Put it on my credit card and pay it off over time 17.9
With the money currently in my checking/savings account orwith cash 47.6
Using money from a bank loan or line of credit 4.1
By borrowing from a friend or family member 12.6
Using a payday loan, deposit advance, or overdraft 2.5
By selling something 9.9
I wouldn’t be able to pay for the expense right now 14.3
Other 2.1
Number of respondents 5,896
Question E3B. Based on your current financial situation,what is the largest emergency expense that you could payright now using cash or money in your checking/savingsaccount?
Percent, except as noted
Response Rate
Refused 1.7
Under $100 38.9
$100 to $199 15.7
$200 to $299 13.1
$300 to $399 8.7
Over $400 21.9
Number of respondents 2,707
May 2015 97
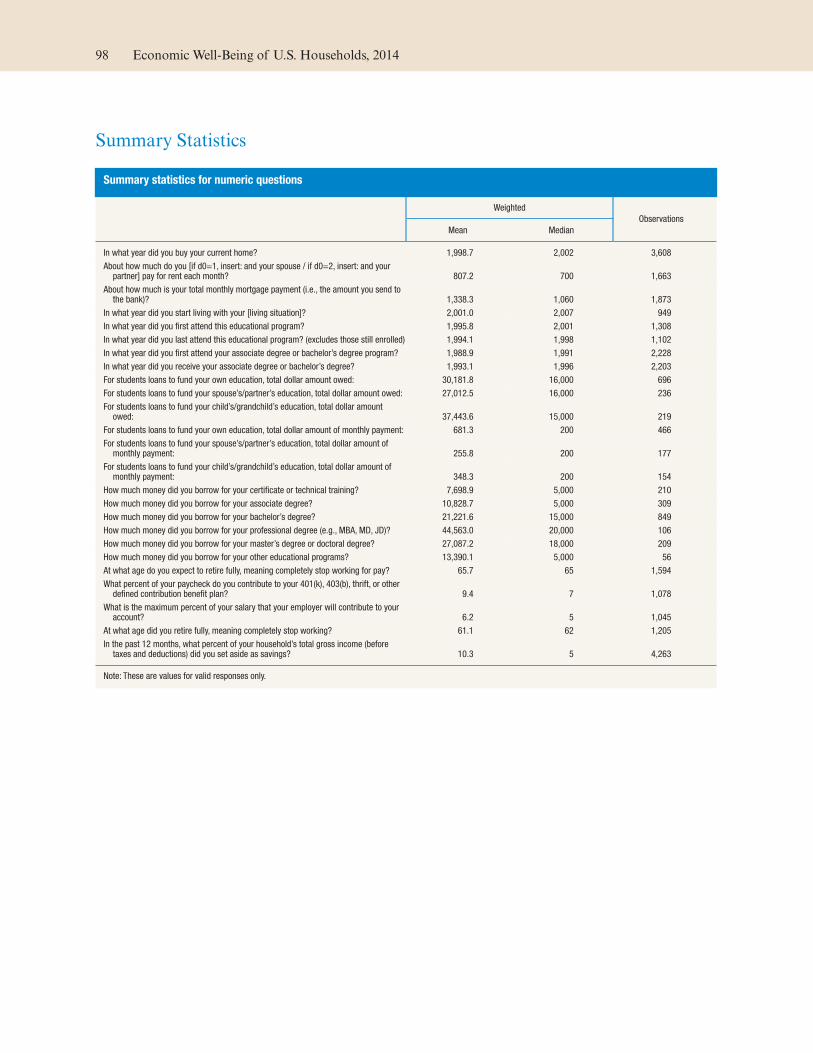
Summary Statistics
Summary statistics for numeric questions
Weighted
Observations
Mean Median
In what year did you buy your current home? 1,998.7 2,002 3,608
About how much do you [if d0=1, insert: and your spouse / if d0=2, insert: and yourpartner] pay for rent each month? 807.2 700 1,663
About how much is your total monthly mortgage payment (i.e., the amount you send tothe bank)? 1,338.3 1,060 1,873
In what year did you start living with your [living situation]? 2,001.0 2,007 949
In what year did you first attend this educational program? 1,995.8 2,001 1,308
In what year did you last attend this educational program? (excludes those still enrolled) 1,994.1 1,998 1,102
In what year did you first attend your associate degree or bachelor’s degree program? 1,988.9 1,991 2,228
In what year did you receive your associate degree or bachelor’s degree? 1,993.1 1,996 2,203
For students loans to fund your own education, total dollar amount owed: 30,181.8 16,000 696
For students loans to fund your spouse’s/partner’s education, total dollar amount owed: 27,012.5 16,000 236
For students loans to fund your child’s/grandchild’s education, total dollar amountowed: 37,443.6 15,000 219
For students loans to fund your own education, total dollar amount of monthly payment: 681.3 200 466
For students loans to fund your spouse’s/partner’s education, total dollar amount ofmonthly payment: 255.8 200 177
For students loans to fund your child’s/grandchild’s education, total dollar amount ofmonthly payment: 348.3 200 154
How much money did you borrow for your certificate or technical training? 7,698.9 5,000 210
How much money did you borrow for your associate degree? 10,828.7 5,000 309
How much money did you borrow for your bachelor’s degree? 21,221.6 15,000 849
How much money did you borrow for your professional degree (e.g., MBA, MD, JD)? 44,563.0 20,000 106
How much money did you borrow for your master’s degree or doctoral degree? 27,087.2 18,000 209
How much money did you borrow for your other educational programs? 13,390.1 5,000 56
At what age do you expect to retire fully, meaning completely stop working for pay? 65.7 65 1,594
What percent of your paycheck do you contribute to your 401(k), 403(b), thrift, or otherdefined contribution benefit plan? 9.4 7 1,078
What is the maximum percent of your salary that your employer will contribute to youraccount? 6.2 5 1,045
At what age did you retire fully, meaning completely stop working? 61.1 62 1,205
In the past 12 months, what percent of your household’s total gross income (beforetaxes and deductions) did you set aside as savings? 10.3 5 4,263
Note: These are values for valid responses only.
98 Economic Well-Being of U.S. Households, 2014

Summary statistics for demographics
Weighted Unweighted
Observations
Mean Standard deviation Mean Standard deviation
Age 46.9756 17.3009 50.6654 17.3996 5,896
Male 0.4821 0.4997 0.4800 0.4996 5,896
Female 0.5179 0.4997 0.5200 0.4996 5,896
18–29 0.2126 0.4092 0.1610 0.3675 5,896
30–44 0.2537 0.4352 0.2137 0.4100 5,896
45–60 0.2870 0.4524 0.2960 0.4565 5,896
Ages over 60 0.2467 0.4311 0.3294 0.4700 5,896
Less than high school 0.1233 0.3288 0.1041 0.3055 5,896
High school degree 0.2963 0.4567 0.3019 0.4591 5,896
Some college 0.2874 0.4526 0.2878 0.4528 5,896
Bachelor’s degree or higher 0.2930 0.4552 0.3061 0.4609 5,896
White, non-Hispanic 0.6577 0.4745 0.7330 0.4424 5,896
Black, non-Hispanic 0.1151 0.3192 0.1046 0.3061 5,896
Other, non-Hispanic 0.0636 0.2441 0.0321 0.1762 5,896
Hispanic 0.1508 0.3579 0.0975 0.2967 5,896
2 or more races, non-Hispanic 0.0128 0.1125 0.0327 0.1780 5,896
Less than $40,000 0.3152 0.4646 0.5061 0.5000 5,896
$40,000–$100,000 0.4076 0.4914 0.3016 0.4590 5,896
Greater than $100,000 0.2773 0.4477 0.1923 0.3942 5,896
Married 0.5208 0.4996 0.5114 0.4999 5,896
Not married 0.4792 0.4996 0.4886 0.4999 5,896
Northeast 0.1822 0.3861 0.1815 0.3854 5,896
Midwest 0.2137 0.4100 0.2456 0.4305 5,896
South 0.3708 0.4831 0.3531 0.4780 5,896
West 0.2332 0.4229 0.2198 0.4142 5,896
Employed 0.5657 0.4957 0.5058 0.5000 5,896
Unemployed, in labor force 0.0878 0.2830 0.0782 0.2685 5,896
Not in labor force 0.3465 0.4759 0.4160 0.4929 5,896
May 2015 99

0515
www.federalreserve.gov
@FederalReserve Flickr.com/FederalReserve YouTube.com/FedReserveBoard