Embed Size (px)
Citation preview
DAILY REPORT
04th
JAN. 2016
YOUR MINTVISORY Call us at +91-731-6642300
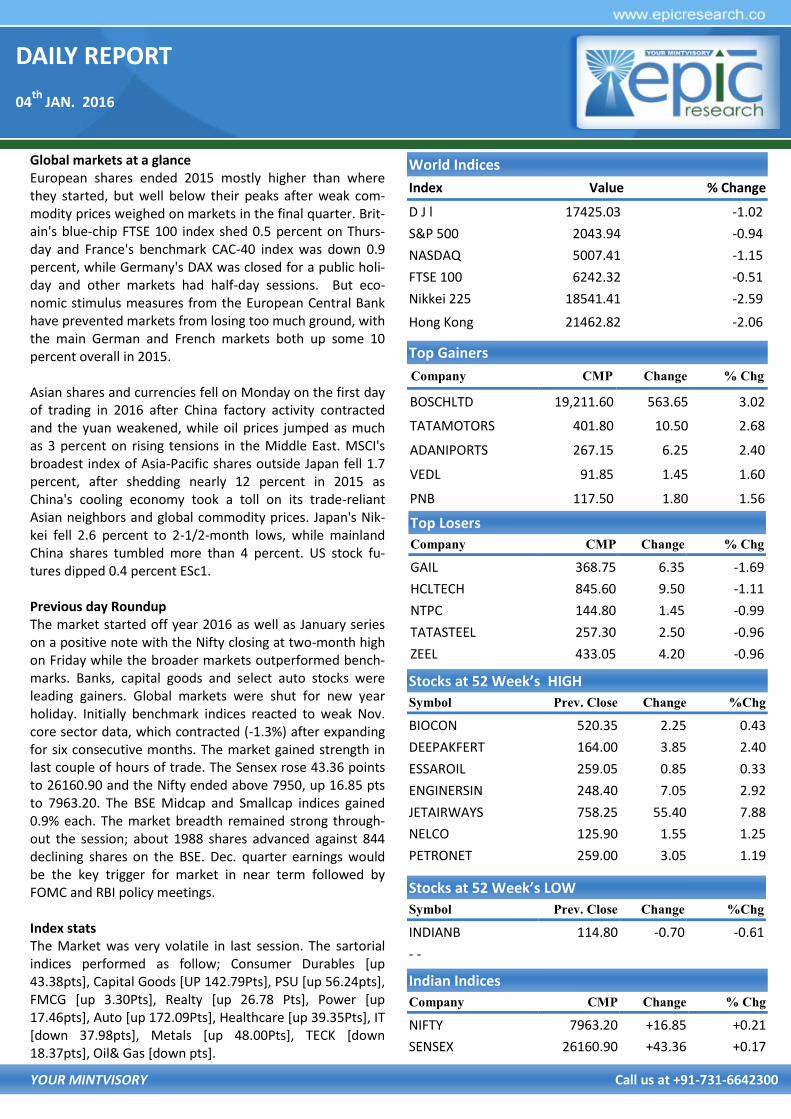
Global markets at a glance European shares ended 2015 mostly higher than where they started, but well below their peaks after weak com-modity prices weighed on markets in the final quarter. Brit-ain's blue-chip FTSE 100 index shed 0.5 percent on Thurs-day and France's benchmark CAC-40 index was down 0.9 percent, while Germany's DAX was closed for a public holi-day and other markets had half-day sessions. But eco-nomic stimulus measures from the European Central Bank have prevented markets from losing too much ground, with the main German and French markets both up some 10 percent overall in 2015. Asian shares and currencies fell on Monday on the first day of trading in 2016 after China factory activity contracted and the yuan weakened, while oil prices jumped as much as 3 percent on rising tensions in the Middle East. MSCI's broadest index of Asia-Pacific shares outside Japan fell 1.7 percent, after shedding nearly 12 percent in 2015 as China's cooling economy took a toll on its trade-reliant Asian neighbors and global commodity prices. Japan's Nik-kei fell 2.6 percent to 2-1/2-month lows, while mainland China shares tumbled more than 4 percent. US stock fu-tures dipped 0.4 percent ESc1. Previous day Roundup The market started off year 2016 as well as January series on a positive note with the Nifty closing at two-month high on Friday while the broader markets outperformed bench-marks. Banks, capital goods and select auto stocks were leading gainers. Global markets were shut for new year holiday. Initially benchmark indices reacted to weak Nov. core sector data, which contracted (-1.3%) after expanding for six consecutive months. The market gained strength in last couple of hours of trade. The Sensex rose 43.36 points to 26160.90 and the Nifty ended above 7950, up 16.85 pts to 7963.20. The BSE Midcap and Smallcap indices gained 0.9% each. The market breadth remained strong through-out the session; about 1988 shares advanced against 844 declining shares on the BSE. Dec. quarter earnings would be the key trigger for market in near term followed by FOMC and RBI policy meetings. Index stats The Market was very volatile in last session. The sartorial indices performed as follow; Consumer Durables [up 43.38pts], Capital Goods [UP 142.79Pts], PSU [up 56.24pts], FMCG [up 3.30Pts], Realty [up 26.78 Pts], Power [up 17.46pts], Auto [up 172.09Pts], Healthcare [up 39.35Pts], IT [down 37.98pts], Metals [up 48.00Pts], TECK [down 18.37pts], Oil& Gas [down pts].
World Indices
Index Value % Change
D J l 17425.03 -1.02
S&P 500 2043.94 -0.94
NASDAQ 5007.41 -1.15
FTSE 100 6242.32 -0.51
Nikkei 225 18541.41 -2.59
Hong Kong 21462.82 -2.06
Top Gainers
Company CMP Change % Chg
BOSCHLTD 19,211.60 563.65 3.02
TATAMOTORS 401.80 10.50 2.68
ADANIPORTS 267.15 6.25 2.40
VEDL 91.85 1.45 1.60
PNB 117.50 1.80 1.56
Top Losers
Company CMP Change % Chg
GAIL 368.75 6.35 -1.69
HCLTECH 845.60 9.50 -1.11
NTPC 144.80 1.45 -0.99
TATASTEEL 257.30 2.50 -0.96
ZEEL 433.05 4.20 -0.96
Stocks at 52 Week’s HIGH
Symbol Prev. Close Change %Chg
BIOCON 520.35 2.25 0.43
DEEPAKFERT 164.00 3.85 2.40
ESSAROIL 259.05 0.85 0.33
ENGINERSIN 248.40 7.05 2.92
JETAIRWAYS 758.25 55.40 7.88
NELCO 125.90 1.55 1.25
PETRONET 259.00 3.05 1.19
Indian Indices
Company CMP Change % Chg
NIFTY 7963.20 +16.85 +0.21
SENSEX 26160.90 +43.36 +0.17
Stocks at 52 Week’s LOW
Symbol Prev. Close Change %Chg
INDIANB 114.80 -0.70 -0.61
- -

DAILY REPORT
04th
JAN. 2016
YOUR MINTVISORY Call us at +91-731-6642300
STOCK RECOMMENDATION [CASH] 3. VIMTA LAB
Last whole week VIMTALABS faced selling pressure but it traded in narrow range and it create support at 102 while in last session it closed with 1% gain at 103.65 so we ad-vise to sell it below 102 for target of 100 97 with sl of 104 MACRO NEWS
Maruti Dec sales beat estimates, rise 8.5%; M&M disap-
points
FPIs' net inflow drops to $7.4 bn in debt markets in 2015
Caixin PMI falls to 48.2 in December, below expectations
Weak China PMI drags Asian mkts; Shanghai down 3%
Coal India: December Coal Production At 52.07 mt Vs Target Of 51.08 mt
IRB bags largest project in road sector costing 10,050cr
from Ministry of Road Transport on annuity basis
December Auto Sales: Hero MotoCorp Total 2-wheeler Sales Down 5% At 5 Lakh Units Vs 5.26 Lakh Units (YoY). TVS Motor: Total Sales Up 4% At 2.02 Lakh Units Vs 1.94 Lakh Units (YoY). Exports Down 0.6% At 32,771 Units Vs 32,969 Units (YoY). 2-wheeler Sales Up 5.2% At 1.94 Lakh Units Vs 1.84 Lakh Units (YoY). 3-wheeler Sales Down 20% At 8,020 Units Vs 10,007 Units (YoY)
Steel Ministry: `5,000 Cr JV Between ArcelorMittal & SAIL Likely To Be Finalised This Year
Adani Enterprises incorporates a Step Down Subsidiary:
Kilaj Solar (Mah) Pvt Limited
OMCs - Govt Hikes Excise Duty On Petrol By `0.37/Litre & On Diesel By `2/Litre
STOCK RECOMMENDATIONS [FUTURE] 1. JINDAL STEEL [FUTURE]
JINDALSTEL FUTURE faced near 200DMA resistance at 98 & finished at 94.55 with loss of 2.17% & before last trading session 94.50 so we advise to sell it below 94 for target of 93 91 with stop loss of 95.10. 2. BEML [FUTURE] BEML FUTURE is still consolidating around multi year highs it
made new 52 week high of 1327 at last trading session but given closed below 1310 since it is too volatile and the vol-ume participation is rising so we can see vertical rise above resistance of 1327 for that buy it above 1330 with stop loss of 1309 for target of 1350 1380 .

DAILY REPORT
04th
JAN. 2016
YOUR MINTVISORY Call us at +91-731-6642300
FUTURE & OPTION
MOST ACTIVE CALL OPTION
Symbol Op-
tion
Type
Strike
Price
LTP Traded
Volume
(Contracts)
Open
Interest
NIFTY CE 8,000 105.70 1,13,386 33,71,475
NIFTY CE 8,200 35.35 82,338 47,06,175
BANKNIFTY CE 17,500 149.00 24,289 3,60,390
RELINFRA CE 560 48.00 2,418 5,20,000
SBIN CE 230 5.85 2,392 34,06,000
JETAIRWAYS CE 800 20.00 1,978 3,02,400
TATAMOTORS CE 400 15.20 1,539 10,23,000
RELCAP CE 460 23.40 1,515 4,36,500
MOST ACTIVE PUT OPTION
Symbol Op-
tion
Type
Strike
Price
LTP Traded
Volume
(Contracts)
Open
Interest
NIFTY PE 7,900 80.00 85,624 29,13,075
NIFTY PE 7,800 52.60 53,668 31,30,125
BANKNIFTY PE 16,500 115.00 21,079 2,64,570
RELINFRA PE 560 15.00 1,433 7,18,900
SBIN PE 220 2.85 699 10,56,000
JETAIRWAYS PE 740 23.50 623 1,14,300
RELCAP PE 440 10.70 618 3,16,500
TATASTEEL PE 250 6.00 544 7,62,000
FII DERIVATIVES STATISTICS
BUY OPEN INTEREST AT THE END OF THE DAY SELL
No. of
Contracts Amount in
Crores No. of
Contracts Amount in
Crores No. of
Contracts Amount in
Crores NET AMOUNT
INDEX FUTURES 8197 467.28 9517 541.81 249867 14641.29 -74.52
INDEX OPTIONS 69340 4020.08 59142 3453.75 617233 36719.62 566.33
STOCK FUTURES 29210 1556.15 33070 1775.05 978828 49484.03 -218.89
STOCK OPTIONS 16372 905.29 14926 832.05 12847 668.55 73.24
TOTAL
STOCKS IN NEWS
TCS restarts talks to buy Perot from Dell
IDBI Bank raises Rs 900 Cr Via Issue Of Basel III Compli-ant Tier 2 Bonds On Private Placement Basis
Kotak Mahindra Bank Acquires Approx 10% Stake In IiAS
SBI to buy 4 premium Air India flats for `90 cr NIFTY FUTURE
Nifty in last trading session traded in very narrow range but in second half it given some up move with recovery in banking & realty share it hit high of 7994 where 7995 is 100DMA & in Dec series Nifty given reversal from 8005 for that if it cross 8010 then near 8030 we may huge sell-ing pressure so we advise to sell it around 8030-8050 with stop loss of 8130 for target of 7960 7860.
INDICES R2 R1 PIVOT S1 S2
BANK NIFTY 17,221.00 17,130.00 16,977.00 16,886.00 16,733.00
NIFTY 8051.00 7,987.00 7,948.00 7,923.00 7,884.00

DAILY REPORT
04th
JAN. 2016
YOUR MINTVISORY Call us at +91-731-6642300
RECOMMENDATIONS
GOLD
TRADING STRATEGY:
BUY GOLD FEB ABOVE 25000 TGTS 25080,25180 SL BE-
LOW 24900
SELL GOLD FEB BELOW 24800 TGTS 24720,24620 SL
ABOVE 24890
SILVER
TRADING STRATEGY:
BUY SILVER MAR ABOVE 33400 TGTS 33700,34000 SL BE-
LOW 33100
SELL SILVER MAR BELOW 33100 TGTS 32900,32600 SL
ABOVE 33400
COMMODITY ROUNDUP
With crude prices at 11-year lows, the world’s big-gest oiland gas producers are facing their longest period
ofinvestment cuts in decades, but are expected to borrow more to preserve the dividends demanded by investors. At around $37 a barrel, crude prices are well below the $60
firms such as Total, Statoil and BP need to balance their books, a level that has already been sharply reduced over the past 18 months. International oil companies are once again being forced to cut spending, sell assets, shed jobs and delay projects as the oil slump shows no sign of recov-ery.
Copper prices in December 2015 settled at $ 4808 per tonne, down 25% from last year. The prices were $ 6701 per tonne during same time last year. MCX Copper traded at Rs
316.22 per kg on 1 Jan 2016, up 0.22%. Last year prices saw declines of 23% when prices crumbled to Rs 306 per kg
from levels of Rs 397 at the start of 2015. Analysts don't expect much respite for copper in 2016, with the oversupply expected to continue and the macroeconomic picture still
uncertain. Among other factors, commodity prices have been hit by a stronger dollar, and few economists expect the greenback to weaken in any meaningful way.
According to preliminary ICSG data, the refined copper mar-ket for September 2015 showed an apparent production deficit of around 25000 metric tonnes. When making sea-sonal adjustments for world refined production and usage, September showed a production surplus of 30000 tonnes.
The refined copper balance for the first nine months of 2015, including revisions to data previously presented, indi-cates a production surplus of around 35000 tonnes. This compares with a production deficit of around 450000 ton-nes for the same period of 2014.
Base metals are likely to remain under tremendous pressure in 2016 due to dwindling global demand, following a slow-
down in the offtake from China, the world’s largest con-sumer. The impact of production cut, however, may help rebound in their prices in the second half after a subdued price trend in the first half of 2016. The year 2015 was very painful for base metals quarter with their prices came crash-ing. Led by nickel, base metals reported up to 42 per cent decline in their prices in 2015. So, the networth of traders
declined proportionately, resulting into panic in base met-als’ segment.
DAILY REPORT
04th
JAN. 2016
YOUR MINTVISORY Call us at +91-731-6642300
NCDEX
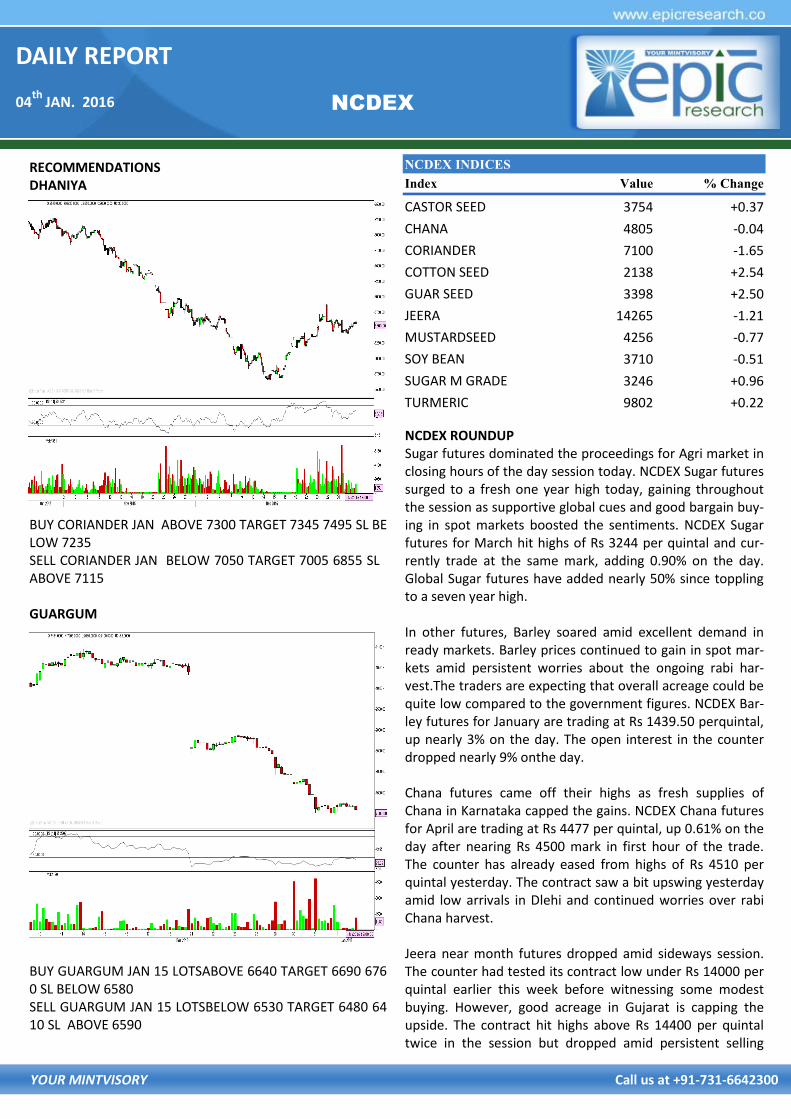
NCDEX ROUNDUP Sugar futures dominated the proceedings for Agri market in closing hours of the day session today. NCDEX Sugar futures surged to a fresh one year high today, gaining throughout the session as supportive global cues and good bargain buy-ing in spot markets boosted the sentiments. NCDEX Sugar futures for March hit highs of Rs 3244 per quintal and cur-rently trade at the same mark, adding 0.90% on the day. Global Sugar futures have added nearly 50% since toppling to a seven year high. In other futures, Barley soared amid excellent demand in ready markets. Barley prices continued to gain in spot mar-kets amid persistent worries about the ongoing rabi har-vest.The traders are expecting that overall acreage could be quite low compared to the government figures. NCDEX Bar-ley futures for January are trading at Rs 1439.50 perquintal, up nearly 3% on the day. The open interest in the counter dropped nearly 9% onthe day. Chana futures came off their highs as fresh supplies of Chana in Karnataka capped the gains. NCDEX Chana futures for April are trading at Rs 4477 per quintal, up 0.61% on the day after nearing Rs 4500 mark in first hour of the trade. The counter has already eased from highs of Rs 4510 per quintal yesterday. The contract saw a bit upswing yesterday amid low arrivals in Dlehi and continued worries over rabi Chana harvest. Jeera near month futures dropped amid sideways session. The counter had tested its contract low under Rs 14000 per quintal earlier this week before witnessing some modest buying. However, good acreage in Gujarat is capping the upside. The contract hit highs above Rs 14400 per quintal twice in the session but dropped amid persistent selling
NCDEX INDICES
Index Value % Change
CASTOR SEED 3754 +0.37
CHANA 4805 -0.04
CORIANDER 7100 -1.65
COTTON SEED 2138 +2.54
GUAR SEED 3398 +2.50
JEERA 14265 -1.21
MUSTARDSEED 4256 -0.77
SOY BEAN 3710 -0.51
SUGAR M GRADE 3246 +0.96
TURMERIC 9802 +0.22
RECOMMENDATIONS DHANIYA
BUY CORIANDER JAN ABOVE 7300 TARGET 7345 7495 SL BELOW 7235 SELL CORIANDER JAN BELOW 7050 TARGET 7005 6855 SL ABOVE 7115 GUARGUM
BUY GUARGUM JAN 15 LOTSABOVE 6640 TARGET 6690 6760 SL BELOW 6580 SELL GUARGUM JAN 15 LOTSBELOW 6530 TARGET 6480 6410 SL ABOVE 6590

DAILY REPORT
04th
JAN. 2016
YOUR MINTVISORY Call us at +91-731-6642300
RBI Reference Rate
Currency Rate Currency Rate
Rupee- $ 66.1780 Yen-100 55.0100
Euro 71.8627 GBP 98.6059
CURRENCY
USD/INR
BUY USDINR JAN ABOVE 66.49 TARGET 66.62 66.77 SL BELO
W 66.29
SELL USDINR JAN BELOW 66.33 TARGET 66.2 66.05 SL ABOVE
66.53
EUR/INR
BUY EURINR JAN ABOVE 72.6 TARGET 72.75 72.95 SL BELOW
72.4
SELL EURINR JAN BELOW 72.05 TARGET 71.9 71.7 SL ABOVE
72.25
CURRENCY MARKET UPDATES:
The Indian rupee opened lower by 11 paise at
66.25 per dollar on Monday versus 66.14 Friday.
The rupee is expected to trade on weaker note
today on bleak fundamental data on fiscal bal-
ance released recently. Weak equities may keep
pressure on the rupee today. We see the range
for the USD-INR pair between 65.93-66.35/dollar.
Yen traded near the highest in more than two
months as investor appetite waned for risky as-
sets. The dollar index held firm near 99 mark.
Dollar to Indian Rupee exchange rate forecast for
December 2015. The forecast for the beginning
of December 66.45. The rate at the end 67.44.
Maximum rate 68.79, while minimum 66.09. The
expected average of USD/INR exchange rate
66.95 for December 2015. USD to INR forecast for
January 2016. The forecast for the beginning of
January 67.44. The rate at the end 67.92. Maxi-
mum rate 69.28, while minimum 66.56. The fore-
casted average of Dollar exchange rate 67.68 for
January 2016.
Dollar to Indian Rupee exchange rate forecast for
February 2016. The forecast for the beginning of
February 67.92. The rate at the end 67.42. Maxi-
mum rate 68.77, while minimum 66.07. The ex-
pected average of USD/INR exchange rate 67.67
for February 2016. USD to INR forecast for March
2016. The forecast for the beginning of March
67.42. The rate at the end 68.2. Maximum rate
69.5

DAILY REPORT
04th
JAN. 2016
YOUR MINTVISORY Call us at +91-731-6642300
Date Commodity/ Currency
Pairs Contract Strategy Entry Level Target Stop Loss Remark
01/01/16 NCDEX DHANIYA JAN. BUY 7335 7380-7530 7270 NO PROFIT NO LOSS
01/01/16 NCDEX DHANIYA JAN. SELL 7010 6965-6815 7075 NOT EXECUTED
01/01/16 NCDEX GUARGUM JAN. BUY 6500 6550-6620 6440 NOT EXECUTED
01/01/16 NCDEX GUARGUM JAN. SELL 6400 6350-6280 6460 NOT EXECUTED
01/01/16 MCX GOLD FEB. BUY 25000 25080-25180 24900 NO PROFIT NO LOSS
01/01/16 MCX GOLD FEB. SELL 24800 24720-24620 24890 NOT EXECUTED
01/01/16 MCX SILVER MAR. BUY 33600 33800-34100 33300 NOT EXECUTED
01/01/16 MCX SILVER MAR. SELL 33300 33450-33150 33600 NOT EXECUTED
Date Scrip
CASH/
FUTURE/
OPTION
Strategy Entry Level Target Stop Loss Remark
01/01/16 NIFTY FUTURE BUY 7940 7990-8100 7890
01/01/16 KSCL FUTURE BUY 345-350 365-380 325 NOT EXECUTED
01/01/16 INDIA CEMENT FUTURE BUY 93-95 99-102 91 NOT EXECUTED
01/01/16 MCX CASH BUY 930-932 950 910 CALL OPEN
29/12/15 FUTURE BUY

DAILY REPORT
04th
JAN. 2016
YOUR MINTVISORY Call us at +91-731-6642300
NEXT WEEK'S U.S. ECONOMIC REPORTS
ECONOMIC CALENDAR
The information and views in this report, our website & all the service we provide are believed to be reliable, but we do not accept any
responsibility (or liability) for errors of fact or opinion. Users have the right to choose the product/s that suits them the most. Sincere ef-
forts have been made to present the right investment perspective. The information contained herein is based on analysis and up on sources
that we consider reliable. This material is for personal information and based upon it & takes no responsibility. The information given
herein should be treated as only factor, while making investment decision. The report does not provide individually tailor-made invest-
ment advice. Epic research recommends that investors independently evaluate particular investments and strategies, and encourages in-
vestors to seek the advice of a financial adviser. Epic research shall not be responsible for any transaction conducted based on the infor-
mation given in this report, which is in violation of rules and regulations of NSE and BSE. The share price projections shown are not nec-
essarily indicative of future price performance. The information herein, together with all estimates and forecasts, can change without no-
tice. Analyst or any person related to epic research might be holding positions in the stocks recommended. It is understood that anyone
who is browsing through the site has done so at his free will and does not read any views expressed as a recommendation for which either
the site or its owners or anyone can be held responsible for . Any surfing and reading of the information is the acceptance of this dis-
claimer. All Rights Reserved. Investment in equity & bullion market has its own risks. We, however, do not vouch for the accuracy or the
completeness thereof. We are not responsible for any loss incurred whatsoever for any financial profits or loss which may arise from the
recommendations above epic research does not purport to be an invitation or an offer to buy or sell any financial instrument. Our Clients
(Paid or Unpaid), any third party or anyone else have no rights to forward or share our calls or SMS or Report or Any Information Pro-
vided by us to/with anyone which is received directly or indirectly by them. If found so then Serious Legal Actions can be taken.
Disclaimer
TIME REPORT PERIOD ACTUAL CONSENSUS
FORECAST PREVIOUS
MONDAY, DEC. 28
NONE SCHEDULED
TUESDAY, DEC. 29
8:30 AM ADVANCE TRADE IN GOODS NOV. -$62.1 BLN -$58.4 BLN
9 AM CASE-SHILLER HOME PRICES OCT. -- 0.6%
10 AM CONSUMER CONFIDENCE DEC. 94.0 90.4
WEDNESDAY, DEC. 30
10 AM PENDING HOME SALES NOV. 0.7% 0.2%
THURSDAY, DEC. 31
8:30 AM WEEKLY JOBLESS CLAIMS DEC. 19 N/A N/A
FRIDAY, JAN. 01
NEW YEAR'S DAY
NONE SCHEDULED