Embed Size (px)
Citation preview
Abhirup Lahiri
Swati Singh
Sreekanth KN
FINALYZECase Submission
Equity Research Report

Indian Institute of Foreign Trade | Delhi
Report Contents
This slide explains the topics we have covered in the equity research report and what we have done in each type of analysis
CompanyAnalysis
Macroeconomic Analysis
SectorAnalysis
Valuations
FinancialAnalysis
MarketAnalysis
Exhibits
Report Contents
Macroeconomic Analysis:This section covers various macroeconomic factors that affects Indian market as a whole. In the scope of this report, six parameters have been taken,for example GDP growth rate, exports IIP among others.
Sector Analysis:This section includes the current scenario of the cement industry. For this analysis, few important facts and figures followed by the analysis of thecement industry and future prospects are given.
Company Analysis:The history of the company, followed by the key people in the company are given. Plant location strategy of ACC has been scrutinized followed byanalysis of the position of ACC in the market.
Valuations:For valuation purpose, we have used two methods, namely DCF valuation and valuation by comparable to attain an acceptable level of accuracy. The enterprise value is taken as the average of the result of these two valuations.
Financial Analysis:This section includes the key highlights of Q4CY15 report of ACC. This is followed by three crucial analyses i.e. Key Ratio Analysis, Quarterly Analysis and analysis done on the shareholding pattern. At the end, key takeaways of the financial analysis done are given.
Market AnalysisThis section includes the trends and analysis of the 1-year moving average of ACC’s stock in the SENSEX. It also includes the expectations of the major demand driving sectors – real estate and infrastructure from the Union Budget 2016 and its possible impact on the cement industry.

Indian Institute of Foreign Trade | Delhi
MACROECONOMIC ANALYSIS
Indian GDP growth
Sectoral Returns
Wholesale Inflation
Core Sector O/p
Exports
IIP
The Indian growth story seems to bepicking up some steam, parliamentarydeadlock and structural malaisenotwithstanding. However, the economyneeds some buttressing from thegovernment. Recently, Moody’s predictedan expected GDP growth of 7.5% in 2016.
The Sensex has returned a disappointing-3.94% over the last quarter. This maybebecause of the twin effect of Grexitaftermath and Chinese currencydevaluation. Industry wise, infrastructureindustry gave a 4.3% growth in the lastquarter but with cement at negative PAT
6.65.1
6.9 7.3 7.5
GDP growth rate (last five years)
9.8-71.7
21-13
13.928.1
Sectoral comparison of PAT YoY change (2014-15)
4.56.7 7.7
3.15.6
0
5
10
Core industry growth % (cement)
Of the eight core industries whichcomprise 38% of the IIP, Cementproduction has a weight of 2.41%. Thecumulative index during April-Dec 2015increased by 2.2% over the previousyear. The demand seems to be pickingup since 2013-14.
-6
-4
-2
0
WPI (%)
The WPI stood at -0.9% in Januarycompared to -0.73% in December. Thiscomes at the back of cheaper vegetableprices. Inflation in manufacturing hasmore or less remained constant over thelast 5 months. WPI has been persistentlyin the deflationary zone.
The IIP contracted by 1.3% in Decemberdue to a decline in manufacturing. Ithad contracted 3.4% in November due toshutdown during Diwali. Weak exportsmight lead to further contraction in thecoming quarters, but low input costsmight provide some relief.
4.24%6.26%
3.73%
9.87%
-3.43%
-1.34%
-5.00%
0.00%
5.00%
10.00%
15.00%
Jun Jul Aug Sep Oct Nov Dec
IIP Data, 2015
-13.06-10.27
-20.43-24.76
-17.53
-24.41
-14.75-13.6
-30
-20
-10
0
Jun Jul Aug Sep Oct NovDec Jan
Exports (YoY change in %)Exports fell consecutively for 14months, because of weak globaldemand and fall in shipment ofpetroleum products and engineeringgoods. However, this did not affect thetrade deficit much as India benefitedfrom cheap imports.
Sources: 1. www.ibef.org, 2. www.tradingeconomics.com, 3. www.economictimes.com
CompanyAnalysis
Macroeconomic Analysis
SectorAnalysis
Valuations
FinancialAnalysis
MarketAnalysis
Exhibits
Report Contents
Indian Institute of Foreign Trade | Delhi
SECTOR ANALYSIS
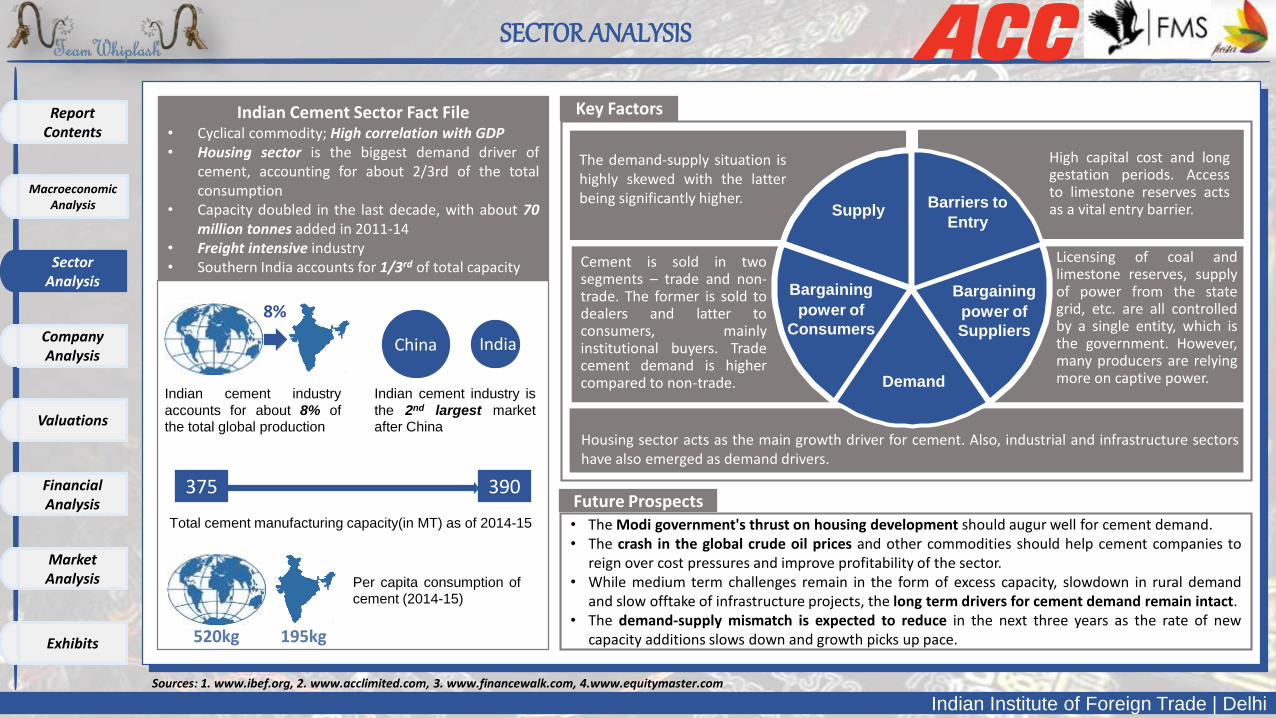
Indian cement industry
accounts for about 8% ofthe total global production
IndiaChina
Indian cement industry is
the 2nd largest marketafter China
375 390
Total cement manufacturing capacity(in MT) as of 2014-15
8%
Per capita consumption ofcement (2014-15)
520kg 195kg
Indian Cement Sector Fact File• Cyclical commodity; High correlation with GDP• Housing sector is the biggest demand driver of
cement, accounting for about 2/3rd of the totalconsumption
• Capacity doubled in the last decade, with about 70million tonnes added in 2011-14
• Freight intensive industry• Southern India accounts for 1/3rd of total capacity
Future Prospects• The Modi government's thrust on housing development should augur well for cement demand.• The crash in the global crude oil prices and other commodities should help cement companies to
reign over cost pressures and improve profitability of the sector.• While medium term challenges remain in the form of excess capacity, slowdown in rural demand
and slow offtake of infrastructure projects, the long term drivers for cement demand remain intact.• The demand-supply mismatch is expected to reduce in the next three years as the rate of new
capacity additions slows down and growth picks up pace.
Key Factors
High capital cost and longgestation periods. Accessto limestone reserves actsas a vital entry barrier.
The demand-supply situation ishighly skewed with the latterbeing significantly higher. Barriers to
EntrySupply
Housing sector acts as the main growth driver for cement. Also, industrial and infrastructure sectorshave also emerged as demand drivers.
Demand
Bargaining
power of
Suppliers
Licensing of coal andlimestone reserves, supplyof power from the stategrid, etc. are all controlledby a single entity, which isthe government. However,many producers are relyingmore on captive power.
Cement is sold in twosegments – trade and non-trade. The former is sold todealers and latter toconsumers, mainlyinstitutional buyers. Tradecement demand is highercompared to non-trade.
Bargaining
power of
Consumers
Sources: 1. www.ibef.org, 2. www.acclimited.com, 3. www.financewalk.com, 4.www.equitymaster.com
CompanyAnalysis
Macroeconomic Analysis
SectorAnalysis
Valuations
FinancialAnalysis
MarketAnalysis
Exhibits
Report Contents
Indian Institute of Foreign Trade | Delhi
Company analysis
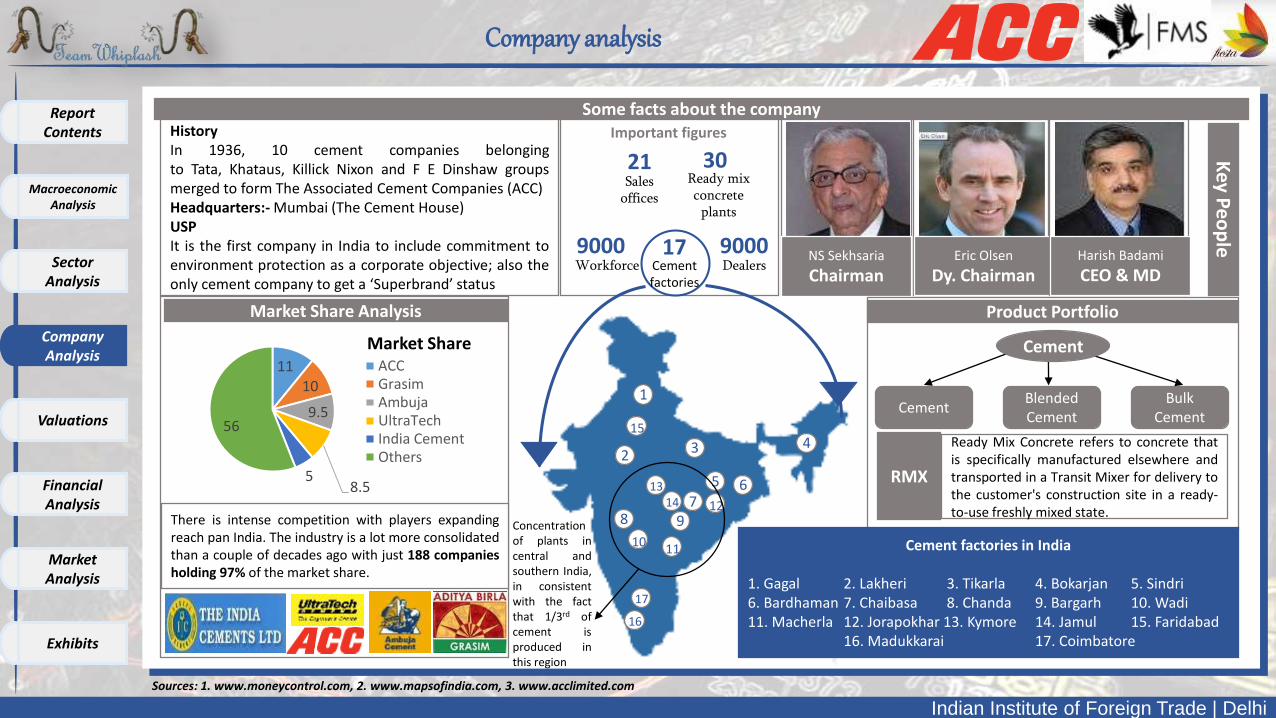
HistoryIn 1936, 10 cement companies belongingto Tata, Khataus, Killick Nixon and F E Dinshaw groupsmerged to form The Associated Cement Companies (ACC)Headquarters:- Mumbai (The Cement House)USPIt is the first company in India to include commitment toenvironment protection as a corporate objective; also theonly cement company to get a ‘Superbrand’ status
Some facts about the company
17Cement factories
Ready mix concrete
plants
30Sales
offices
21
Workforce9000 9000
Dealers
Important figures
NS Sekhsaria
ChairmanEric Olsen
Dy. ChairmanHarish Badami
CEO & MD
Key P
eo
ple
Cement factories in India
1. Gagal 2. Lakheri 3. Tikarla 4. Bokarjan 5. Sindri6. Bardhaman 7. Chaibasa 8. Chanda 9. Bargarh 10. Wadi11. Macherla 12. Jorapokhar 13. Kymore 14. Jamul 15. Faridabad
16. Madukkarai 17. Coimbatore
6
8 9
17
1011
16
7
5
1
2 3 4
1314
15
12
Product Portfolio
CementBulk
CementBlendedCement
Cement
RMX
Ready Mix Concrete refers to concrete thatis specifically manufactured elsewhere andtransported in a Transit Mixer for delivery tothe customer's construction site in a ready-to-use freshly mixed state.
Market Share Analysis
1110
9.5
8.55
56
ACCGrasimAmbujaUltraTechIndia CementOthers
There is intense competition with players expandingreach pan India. The industry is a lot more consolidatedthan a couple of decades ago with just 188 companiesholding 97% of the market share.
Market Share
Sources: 1. www.moneycontrol.com, 2. www.mapsofindia.com, 3. www.acclimited.com
CompanyAnalysis
Macroeconomic Analysis
SectorAnalysis
Valuations
FinancialAnalysis
MarketAnalysis
Exhibits
Report Contents
Concentrationof plants incentral andsouthern India,in consistentwith the factthat 1/3rd ofcement isproduced inthis region
Indian Institute of Foreign Trade | Delhi
All data
valuations
DCF Valuation
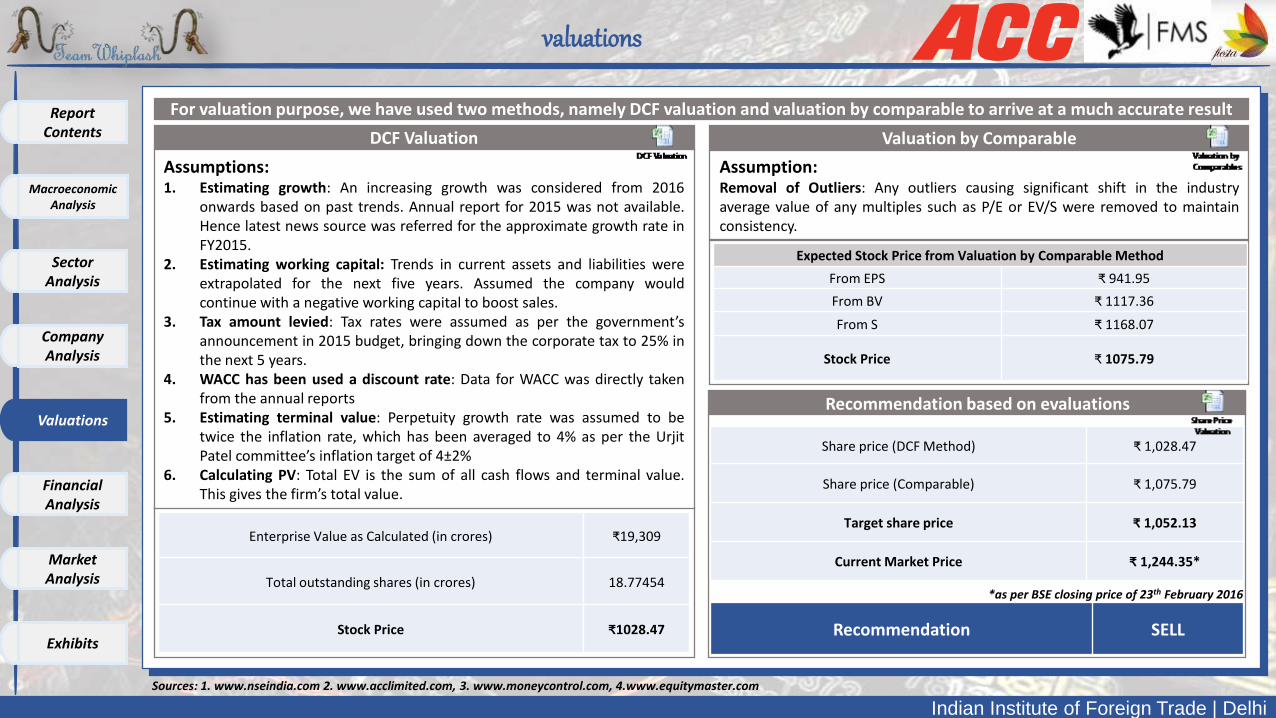
For valuation purpose, we have used two methods, namely DCF valuation and valuation by comparable to arrive at a much accurate result
Assumptions:1. Estimating growth: An increasing growth was considered from 2016
onwards based on past trends. Annual report for 2015 was not available.Hence latest news source was referred for the approximate growth rate inFY2015.
2. Estimating working capital: Trends in current assets and liabilities wereextrapolated for the next five years. Assumed the company wouldcontinue with a negative working capital to boost sales.
3. Tax amount levied: Tax rates were assumed as per the government’sannouncement in 2015 budget, bringing down the corporate tax to 25% inthe next 5 years.
4. WACC has been used a discount rate: Data for WACC was directly takenfrom the annual reports
5. Estimating terminal value: Perpetuity growth rate was assumed to betwice the inflation rate, which has been averaged to 4% as per the UrjitPatel committee’s inflation target of 4±2%
6. Calculating PV: Total EV is the sum of all cash flows and terminal value.This gives the firm’s total value.
Valuation by Comparable
Assumption:Removal of Outliers: Any outliers causing significant shift in the industryaverage value of any multiples such as P/E or EV/S were removed to maintainconsistency.
Expected Stock Price from Valuation by Comparable Method
From EPS ₹ 941.95
From BV ₹ 1117.36
From S ₹ 1168.07
Stock Price ₹ 1075.79
Enterprise Value as Calculated (in crores) ₹19,309
Total outstanding shares (in crores) 18.77454
Stock Price ₹1028.47
Share price (DCF Method) ₹ 1,028.47
Share price (Comparable) ₹ 1,075.79
Target share price ₹ 1,052.13
Current Market Price ₹ 1,244.35*
Recommendation SELL
Recommendation based on evaluations
Sources: 1. www.nseindia.com 2. www.acclimited.com, 3. www.moneycontrol.com, 4.www.equitymaster.com
*as per BSE closing price of 23th February 2016
CompanyAnalysis
Macroeconomic Analysis
SectorAnalysis
Valuations
FinancialAnalysis
MarketAnalysis
Exhibits
Report Contents
Indian Institute of Foreign Trade | Delhi
Financial ANALYSIS
Takeaways from Q4 of 2015
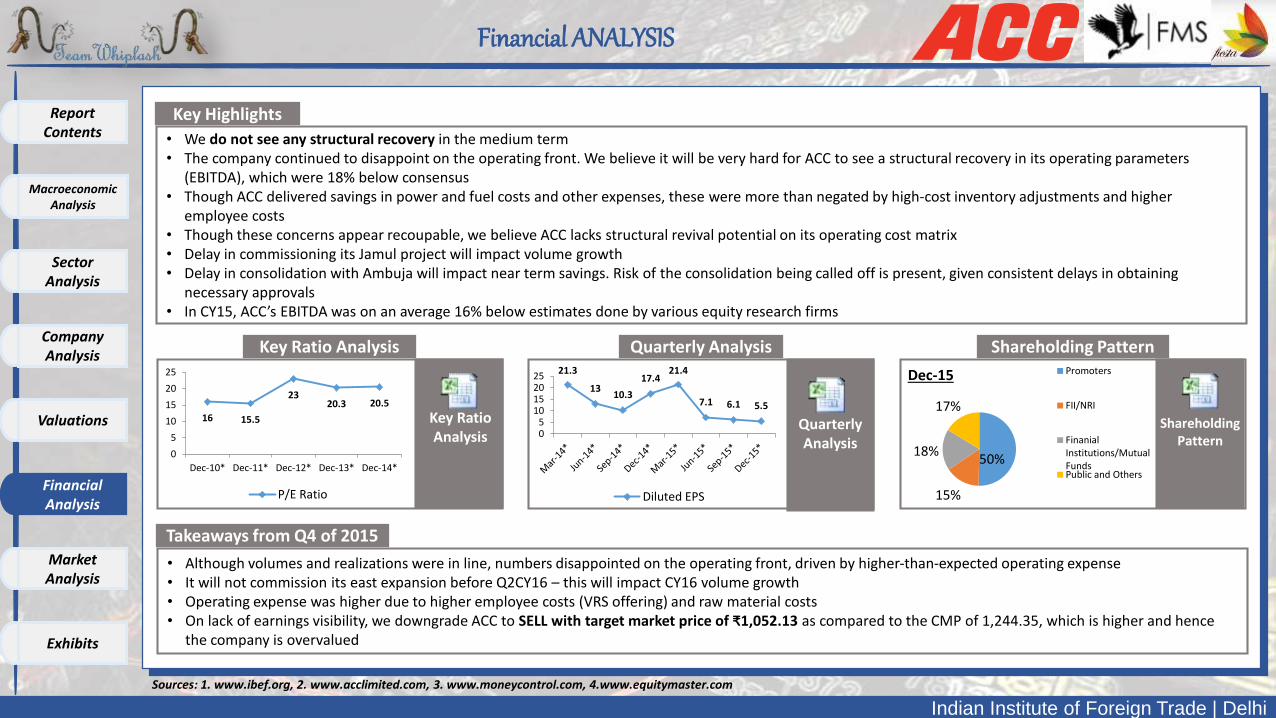
• Although volumes and realizations were in line, numbers disappointed on the operating front, driven by higher‐than‐expected operating expense• It will not commission its east expansion before Q2CY16 – this will impact CY16 volume growth• Operating expense was higher due to higher employee costs (VRS offering) and raw material costs• On lack of earnings visibility, we downgrade ACC to SELL with target market price of ₹1,052.13 as compared to the CMP of 1,244.35, which is higher and hence
the company is overvalued
Key Highlights
• We do not see any structural recovery in the medium term• The company continued to disappoint on the operating front. We believe it will be very hard for ACC to see a structural recovery in its operating parameters
(EBITDA), which were 18% below consensus• Though ACC delivered savings in power and fuel costs and other expenses, these were more than negated by high‐cost inventory adjustments and higher
employee costs• Though these concerns appear recoupable, we believe ACC lacks structural revival potential on its operating cost matrix• Delay in commissioning its Jamul project will impact volume growth• Delay in consolidation with Ambuja will impact near term savings. Risk of the consolidation being called off is present, given consistent delays in obtaining
necessary approvals• In CY15, ACC’s EBITDA was on an average 16% below estimates done by various equity research firms
Key Ratio Analysis Quarterly Analysis Shareholding Pattern
Sources: 1. www.ibef.org, 2. www.acclimited.com, 3. www.moneycontrol.com, 4.www.equitymaster.com
CompanyAnalysis
Macroeconomic Analysis
SectorAnalysis
Valuations
FinancialAnalysis
MarketAnalysis
Exhibits
Report Contents
50%
15%
18%
17%
Dec-15 Promoters
FII/NRI
FinanialInstitutions/MutualFundsPublic and Others
21.3
1310.3
17.421.4
7.1 6.1 5.5
05
10152025
Diluted EPS
16 15.5
2320.3 20.5
0
5
10
15
20
25
Dec-10* Dec-11* Dec-12* Dec-13* Dec-14*
P/E Ratio
Key RatioAnalysis
QuarterlyAnalysis
ShareholdingPattern
Indian Institute of Foreign Trade | Delhi
Market ANALYSIS
Sources: 1. www.ibef.org, 2. www.acclimited.com, 3. www.moneycontrol.com, 4.www.equitymaster.com
CompanyAnalysis
Macroeconomic Analysis
SectorAnalysis
Valuations
FinancialAnalysis
MarketAnalysis
Exhibits
Report Contents
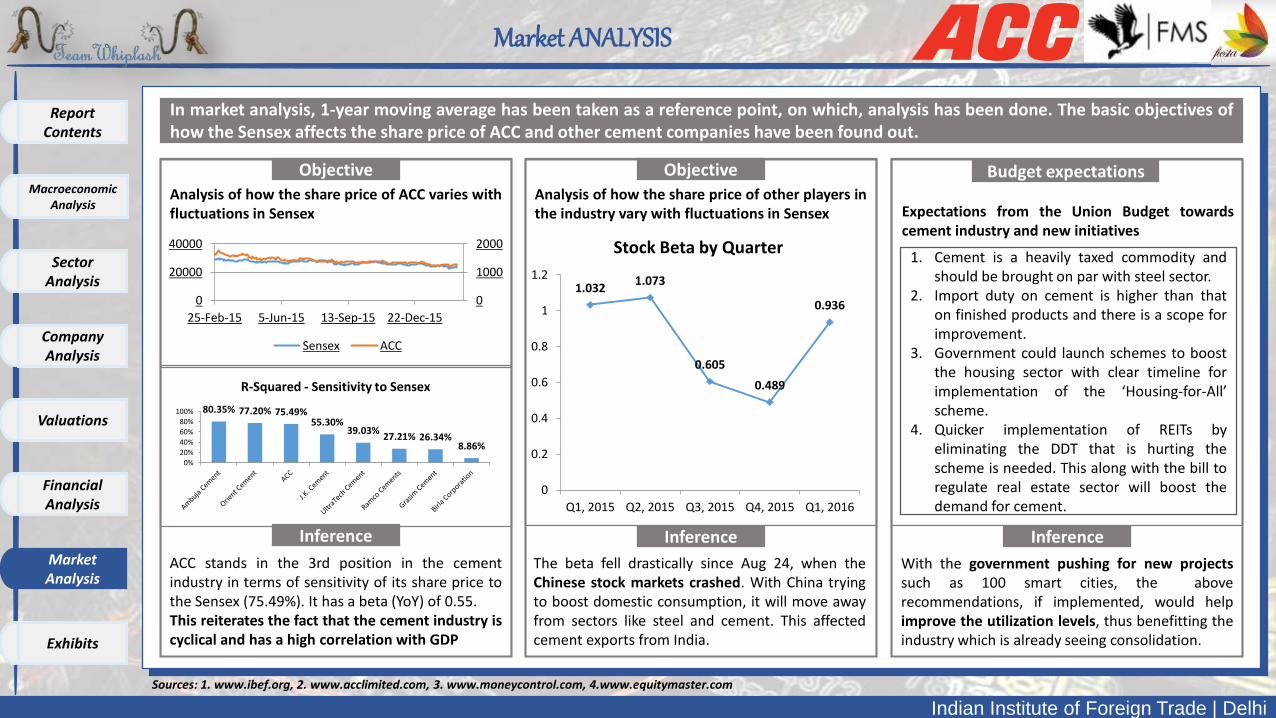
In market analysis, 1-year moving average has been taken as a reference point, on which, analysis has been done. The basic objectives ofhow the Sensex affects the share price of ACC and other cement companies have been found out.
Objective
Analysis of how the share price of ACC varies withfluctuations in Sensex
0
1000
2000
0
20000
40000
25-Feb-15 5-Jun-15 13-Sep-15 22-Dec-15
Sensex ACC
ACC stands in the 3rd position in the cementindustry in terms of sensitivity of its share price tothe Sensex (75.49%). It has a beta (YoY) of 0.55.This reiterates the fact that the cement industry iscyclical and has a high correlation with GDP
Objective
Inference
Analysis of how the share price of other players inthe industry vary with fluctuations in Sensex
The beta fell drastically since Aug 24, when theChinese stock markets crashed. With China tryingto boost domestic consumption, it will move awayfrom sectors like steel and cement. This affectedcement exports from India.
Budget expectations
Inference
Expectations from the Union Budget towardscement industry and new initiatives
1.0321.073
0.605
0.489
0.936
0
0.2
0.4
0.6
0.8
1
1.2
Q1, 2015 Q2, 2015 Q3, 2015 Q4, 2015 Q1, 2016
Stock Beta by Quarter
Inference
80.35% 77.20% 75.49%55.30%
39.03%27.21% 26.34%
8.86%
0%
20%
40%
60%
80%
100%
R-Squared - Sensitivity to Sensex
1. Cement is a heavily taxed commodity andshould be brought on par with steel sector.
2. Import duty on cement is higher than thaton finished products and there is a scope forimprovement.
3. Government could launch schemes to boostthe housing sector with clear timeline forimplementation of the ‘Housing-for-All’scheme.
4. Quicker implementation of REITs byeliminating the DDT that is hurting thescheme is needed. This along with the bill toregulate real estate sector will boost thedemand for cement.
With the government pushing for new projectssuch as 100 smart cities, the aboverecommendations, if implemented, would helpimprove the utilization levels, thus benefitting theindustry which is already seeing consolidation.
Indian Institute of Foreign Trade | Delhi
Exhibits (1/3)
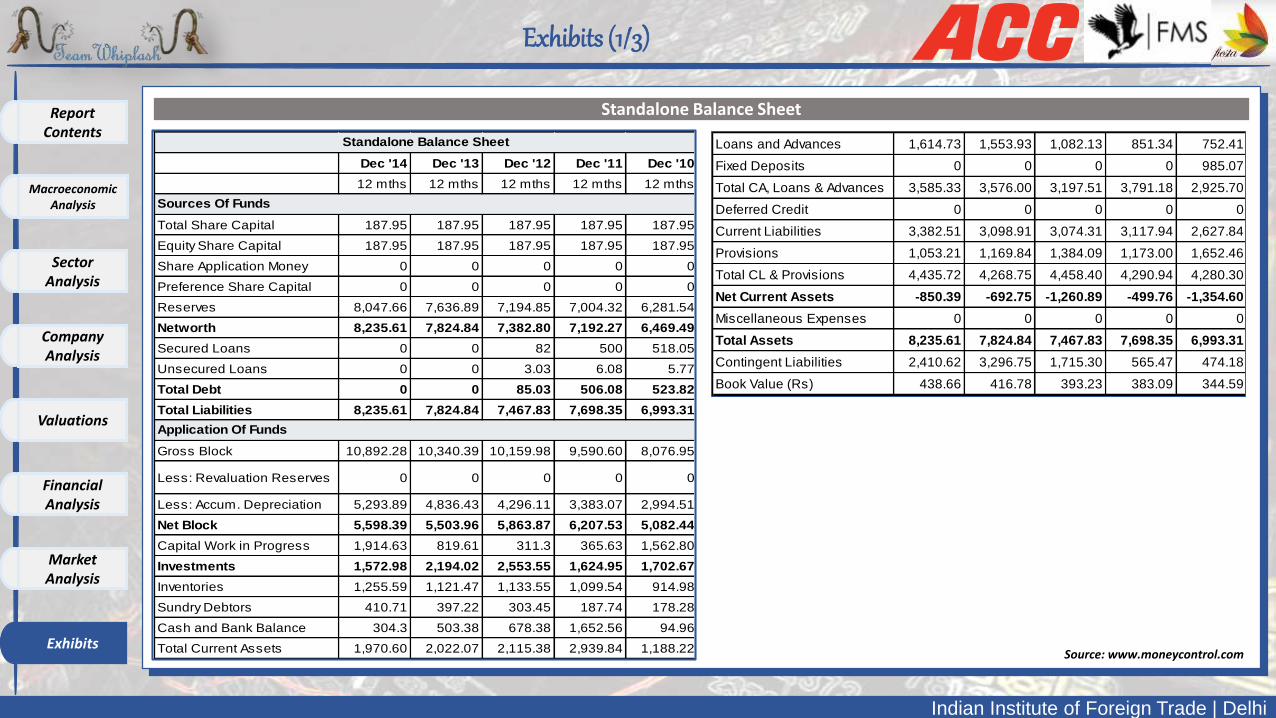
Dec '14 Dec '13 Dec '12 Dec '11 Dec '10
12 mths 12 mths 12 mths 12 mths 12 mths
Total Share Capital 187.95 187.95 187.95 187.95 187.95
Equity Share Capital 187.95 187.95 187.95 187.95 187.95
Share Application Money 0 0 0 0 0
Preference Share Capital 0 0 0 0 0
Reserves 8,047.66 7,636.89 7,194.85 7,004.32 6,281.54
Networth 8,235.61 7,824.84 7,382.80 7,192.27 6,469.49
Secured Loans 0 0 82 500 518.05
Unsecured Loans 0 0 3.03 6.08 5.77
Total Debt 0 0 85.03 506.08 523.82
Total Liabilities 8,235.61 7,824.84 7,467.83 7,698.35 6,993.31
Gross Block 10,892.28 10,340.39 10,159.98 9,590.60 8,076.95
Less: Revaluation Reserves 0 0 0 0 0
Less: Accum. Depreciation 5,293.89 4,836.43 4,296.11 3,383.07 2,994.51
Net Block 5,598.39 5,503.96 5,863.87 6,207.53 5,082.44
Capital Work in Progress 1,914.63 819.61 311.3 365.63 1,562.80
Investments 1,572.98 2,194.02 2,553.55 1,624.95 1,702.67
Inventories 1,255.59 1,121.47 1,133.55 1,099.54 914.98
Sundry Debtors 410.71 397.22 303.45 187.74 178.28
Cash and Bank Balance 304.3 503.38 678.38 1,652.56 94.96
Total Current Assets 1,970.60 2,022.07 2,115.38 2,939.84 1,188.22
Standalone Balance Sheet
Sources Of Funds
Application Of Funds
Loans and Advances 1,614.73 1,553.93 1,082.13 851.34 752.41
Fixed Deposits 0 0 0 0 985.07
Total CA, Loans & Advances 3,585.33 3,576.00 3,197.51 3,791.18 2,925.70
Deferred Credit 0 0 0 0 0
Current Liabilities 3,382.51 3,098.91 3,074.31 3,117.94 2,627.84
Provisions 1,053.21 1,169.84 1,384.09 1,173.00 1,652.46
Total CL & Provisions 4,435.72 4,268.75 4,458.40 4,290.94 4,280.30
Net Current Assets -850.39 -692.75 -1,260.89 -499.76 -1,354.60
Miscellaneous Expenses 0 0 0 0 0
Total Assets 8,235.61 7,824.84 7,467.83 7,698.35 6,993.31
Contingent Liabilities 2,410.62 3,296.75 1,715.30 565.47 474.18
Book Value (Rs) 438.66 416.78 393.23 383.09 344.59
Source: www.moneycontrol.com
Standalone Balance Sheet
CompanyAnalysis
Macroeconomic Analysis
SectorAnalysis
Valuations
FinancialAnalysis
MarketAnalysis
Exhibits
Report Contents
Indian Institute of Foreign Trade | Delhi
Exhibits (2/3)
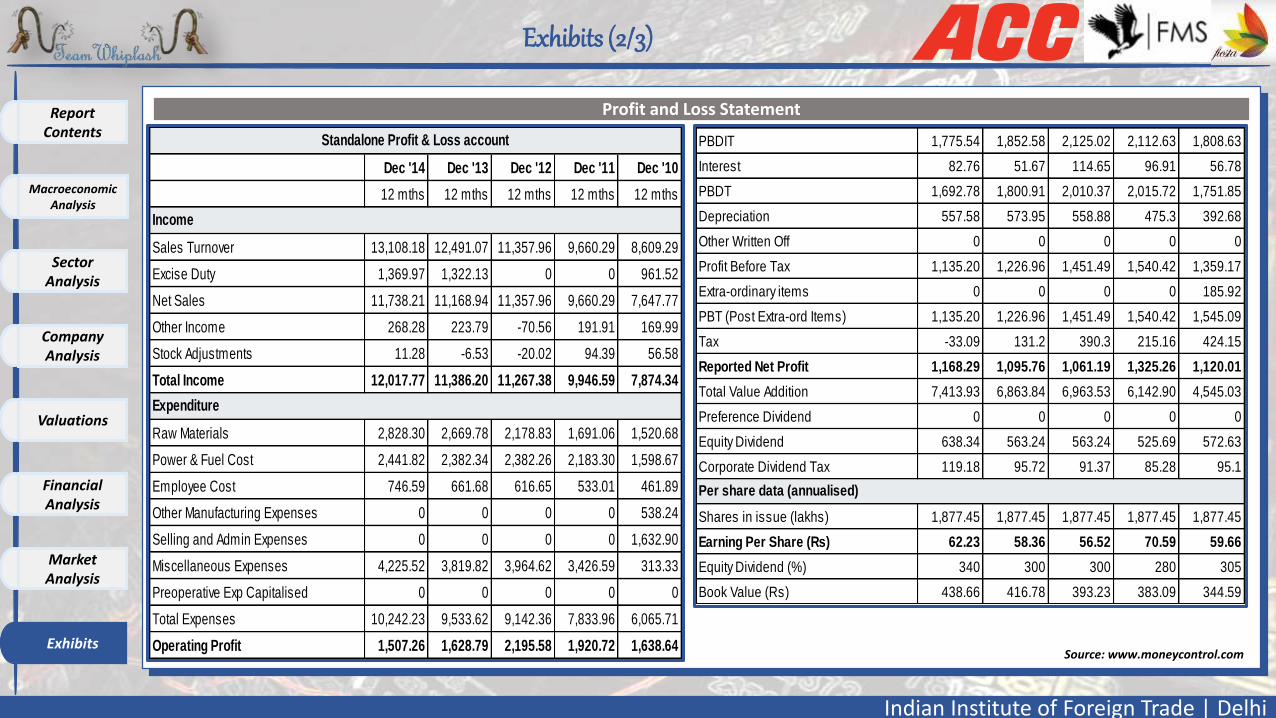
Dec '14 Dec '13 Dec '12 Dec '11 Dec '10
12 mths 12 mths 12 mths 12 mths 12 mths
Sales Turnover 13,108.18 12,491.07 11,357.96 9,660.29 8,609.29
Excise Duty 1,369.97 1,322.13 0 0 961.52
Net Sales 11,738.21 11,168.94 11,357.96 9,660.29 7,647.77
Other Income 268.28 223.79 -70.56 191.91 169.99
Stock Adjustments 11.28 -6.53 -20.02 94.39 56.58
Total Income 12,017.77 11,386.20 11,267.38 9,946.59 7,874.34
Raw Materials 2,828.30 2,669.78 2,178.83 1,691.06 1,520.68
Power & Fuel Cost 2,441.82 2,382.34 2,382.26 2,183.30 1,598.67
Employee Cost 746.59 661.68 616.65 533.01 461.89
Other Manufacturing Expenses 0 0 0 0 538.24
Selling and Admin Expenses 0 0 0 0 1,632.90
Miscellaneous Expenses 4,225.52 3,819.82 3,964.62 3,426.59 313.33
Preoperative Exp Capitalised 0 0 0 0 0
Total Expenses 10,242.23 9,533.62 9,142.36 7,833.96 6,065.71
Operating Profit 1,507.26 1,628.79 2,195.58 1,920.72 1,638.64
Standalone Profit & Loss account
Income
Expenditure
PBDIT 1,775.54 1,852.58 2,125.02 2,112.63 1,808.63
Interest 82.76 51.67 114.65 96.91 56.78
PBDT 1,692.78 1,800.91 2,010.37 2,015.72 1,751.85
Depreciation 557.58 573.95 558.88 475.3 392.68
Other Written Off 0 0 0 0 0
Profit Before Tax 1,135.20 1,226.96 1,451.49 1,540.42 1,359.17
Extra-ordinary items 0 0 0 0 185.92
PBT (Post Extra-ord Items) 1,135.20 1,226.96 1,451.49 1,540.42 1,545.09
Tax -33.09 131.2 390.3 215.16 424.15
Reported Net Profit 1,168.29 1,095.76 1,061.19 1,325.26 1,120.01
Total Value Addition 7,413.93 6,863.84 6,963.53 6,142.90 4,545.03
Preference Dividend 0 0 0 0 0
Equity Dividend 638.34 563.24 563.24 525.69 572.63
Corporate Dividend Tax 119.18 95.72 91.37 85.28 95.1
Shares in issue (lakhs) 1,877.45 1,877.45 1,877.45 1,877.45 1,877.45
Earning Per Share (Rs) 62.23 58.36 56.52 70.59 59.66
Equity Dividend (%) 340 300 300 280 305
Book Value (Rs) 438.66 416.78 393.23 383.09 344.59
Per share data (annualised)
Source: www.moneycontrol.com
Profit and Loss Statement
CompanyAnalysis
Macroeconomic Analysis
SectorAnalysis
Valuations
FinancialAnalysis
MarketAnalysis
Exhibits
Report Contents
Indian Institute of Foreign Trade | Delhi
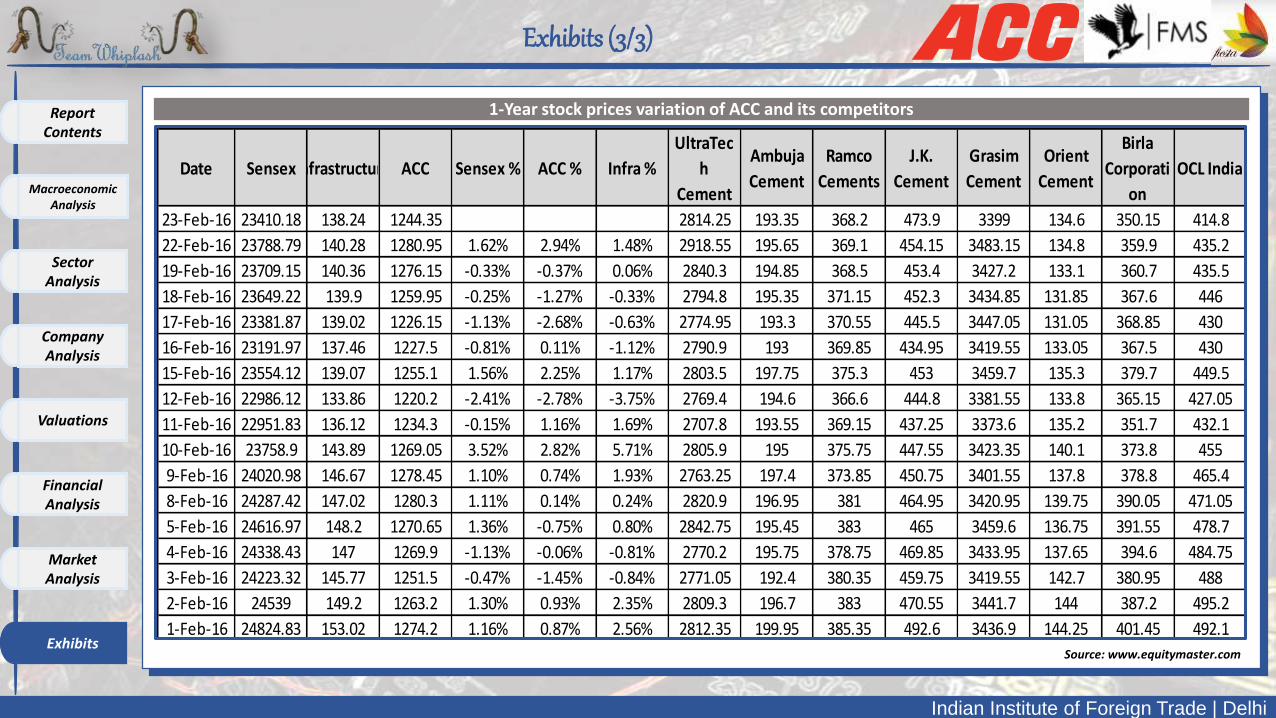
Exhibits (3/3)
Date SensexInfrastructure ACC Sensex % ACC % Infra %
UltraTec
h
Cement
Ambuja
Cement
Ramco
Cements
J.K.
Cement
Grasim
Cement
Orient
Cement
Birla
Corporati
on
OCL India
23-Feb-16 23410.18 138.24 1244.35 2814.25 193.35 368.2 473.9 3399 134.6 350.15 414.8
22-Feb-16 23788.79 140.28 1280.95 1.62% 2.94% 1.48% 2918.55 195.65 369.1 454.15 3483.15 134.8 359.9 435.2
19-Feb-16 23709.15 140.36 1276.15 -0.33% -0.37% 0.06% 2840.3 194.85 368.5 453.4 3427.2 133.1 360.7 435.5
18-Feb-16 23649.22 139.9 1259.95 -0.25% -1.27% -0.33% 2794.8 195.35 371.15 452.3 3434.85 131.85 367.6 446
17-Feb-16 23381.87 139.02 1226.15 -1.13% -2.68% -0.63% 2774.95 193.3 370.55 445.5 3447.05 131.05 368.85 430
16-Feb-16 23191.97 137.46 1227.5 -0.81% 0.11% -1.12% 2790.9 193 369.85 434.95 3419.55 133.05 367.5 430
15-Feb-16 23554.12 139.07 1255.1 1.56% 2.25% 1.17% 2803.5 197.75 375.3 453 3459.7 135.3 379.7 449.5
12-Feb-16 22986.12 133.86 1220.2 -2.41% -2.78% -3.75% 2769.4 194.6 366.6 444.8 3381.55 133.8 365.15 427.05
11-Feb-16 22951.83 136.12 1234.3 -0.15% 1.16% 1.69% 2707.8 193.55 369.15 437.25 3373.6 135.2 351.7 432.1
10-Feb-16 23758.9 143.89 1269.05 3.52% 2.82% 5.71% 2805.9 195 375.75 447.55 3423.35 140.1 373.8 455
9-Feb-16 24020.98 146.67 1278.45 1.10% 0.74% 1.93% 2763.25 197.4 373.85 450.75 3401.55 137.8 378.8 465.4
8-Feb-16 24287.42 147.02 1280.3 1.11% 0.14% 0.24% 2820.9 196.95 381 464.95 3420.95 139.75 390.05 471.05
5-Feb-16 24616.97 148.2 1270.65 1.36% -0.75% 0.80% 2842.75 195.45 383 465 3459.6 136.75 391.55 478.7
4-Feb-16 24338.43 147 1269.9 -1.13% -0.06% -0.81% 2770.2 195.75 378.75 469.85 3433.95 137.65 394.6 484.75
3-Feb-16 24223.32 145.77 1251.5 -0.47% -1.45% -0.84% 2771.05 192.4 380.35 459.75 3419.55 142.7 380.95 488
2-Feb-16 24539 149.2 1263.2 1.30% 0.93% 2.35% 2809.3 196.7 383 470.55 3441.7 144 387.2 495.2
1-Feb-16 24824.83 153.02 1274.2 1.16% 0.87% 2.56% 2812.35 199.95 385.35 492.6 3436.9 144.25 401.45 492.1
1-Year stock prices variation of ACC and its competitors
Source: www.equitymaster.com
CompanyAnalysis
Macroeconomic Analysis
SectorAnalysis
Valuations
FinancialAnalysis
MarketAnalysis
Exhibits
Report Contents

Thank you