Embed Size (px)
Citation preview
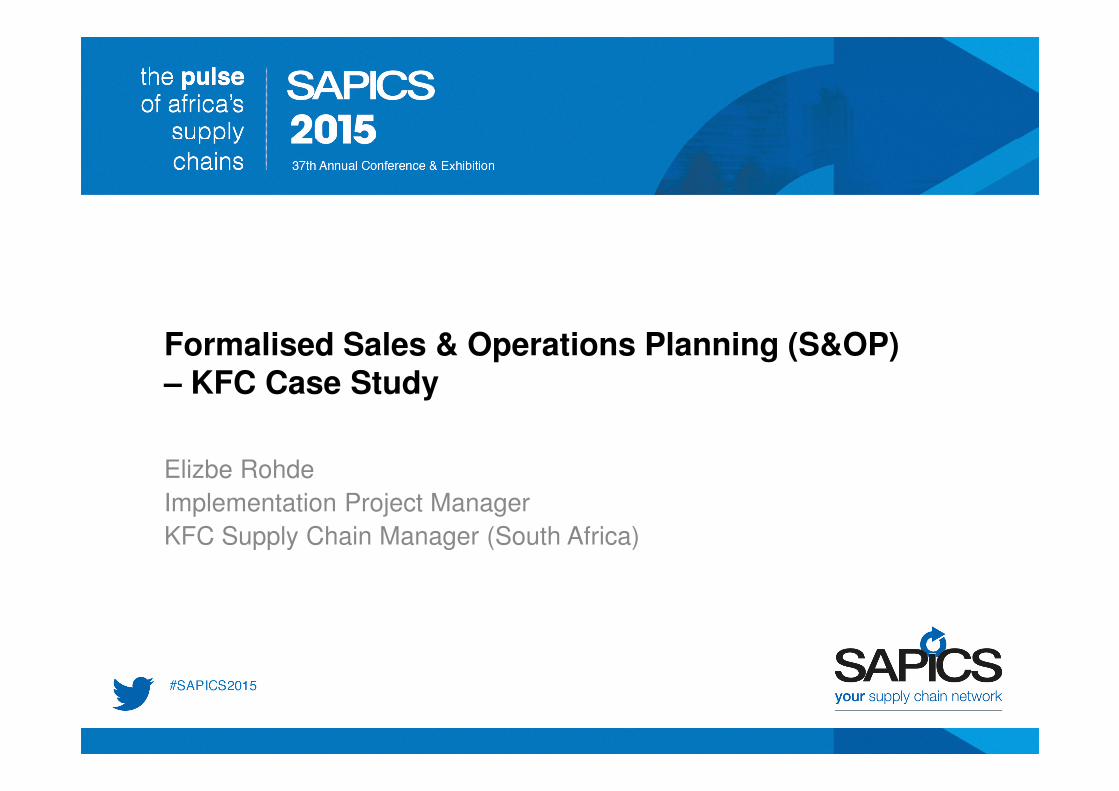
Formalised Sales & Operations Planning (S&OP)– KFC Case Study
Elizbe Rohde
Implementation Project Manager
KFC Supply Chain Manager (South Africa)
Agenda
• About KFC
• Complexity in QSR
• The Project
• Lessons Learnt
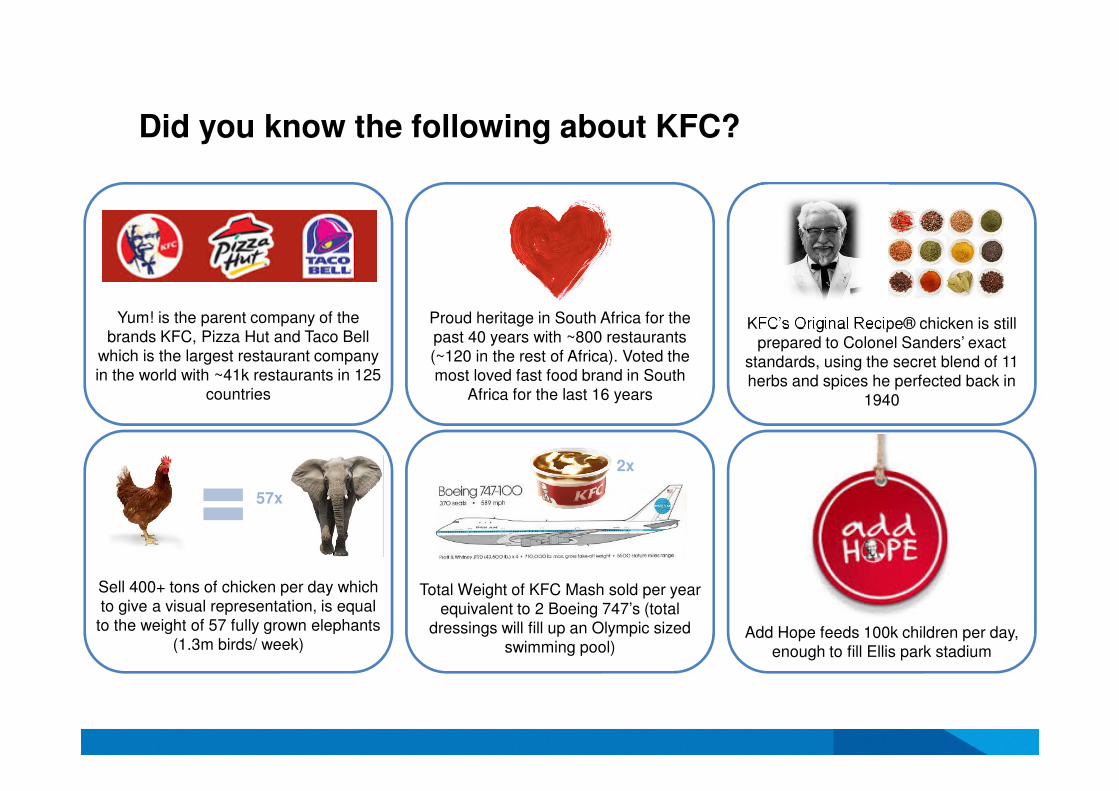
Did you know the following about KFC?
Sell 400+ tons of chicken per day which to give a visual representation, is equal
to the weight of 57 fully grown elephants (1.3m birds/ week)
57x
Total Weight of KFC Mash sold per year equivalent to 2 Boeing 747’s (total
dressings will fill up an Olympic sized swimming pool)
2x
Add Hope feeds 100k children per day, enough to fill Ellis park stadium
Yum! is the parent company of the brands KFC, Pizza Hut and Taco Bell
which is the largest restaurant company in the world with ~41k restaurants in 125
countries
KFC’s Original Recipe® chicken is still prepared to Colonel Sanders’ exact
standards, using the secret blend of 11 herbs and spices he perfected back in
1940
Proud heritage in South Africa for the past 40 years with ~800 restaurants (~120 in the rest of Africa). Voted the most loved fast food brand in South
Africa for the last 16 years
Agenda
• About KFC
• Complexity in QSR
• The Project
• Lessons Learnt
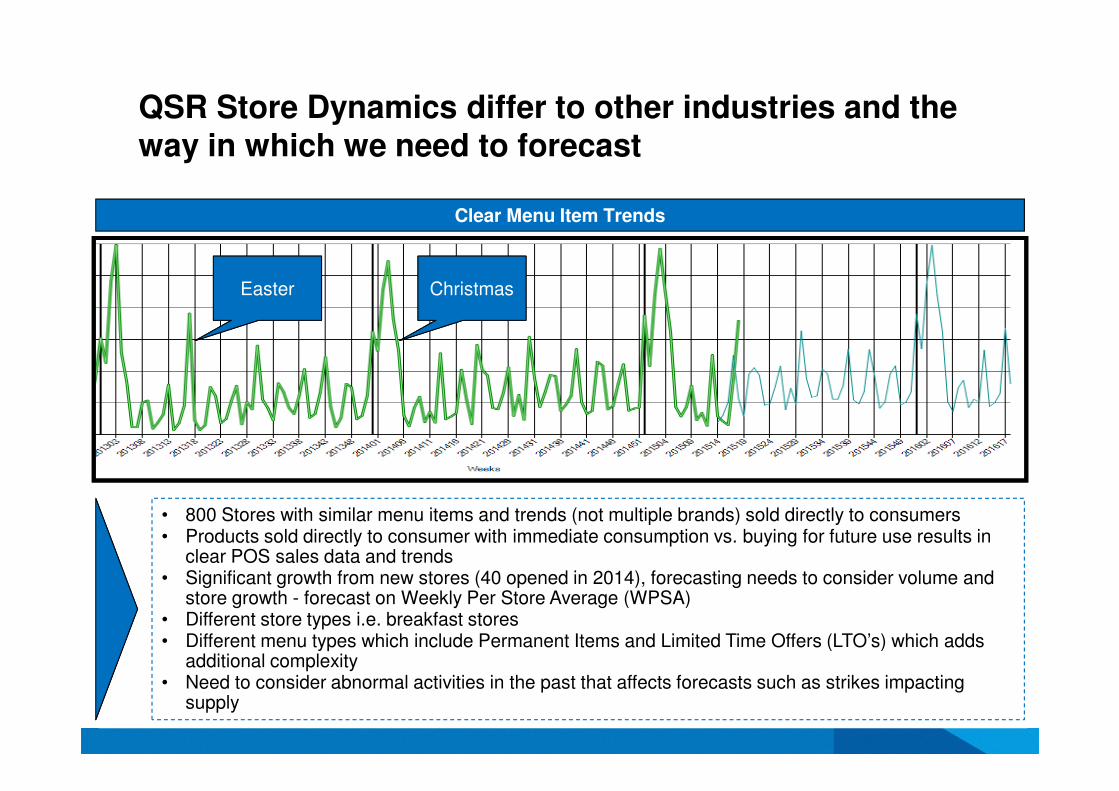
QSR Store Dynamics differ to other industries and the way in which we need to forecast
Clear Menu Item Trends
• 800 Stores with similar menu items and trends (not multiple brands) sold directly to consumers• Products sold directly to consumer with immediate consumption vs. buying for future use results in
clear POS sales data and trends• Significant growth from new stores (40 opened in 2014), forecasting needs to consider volume and
store growth - forecast on Weekly Per Store Average (WPSA)• Different store types i.e. breakfast stores• Different menu types which include Permanent Items and Limited Time Offers (LTO’s) which adds
additional complexity• Need to consider abnormal activities in the past that affects forecasts such as strikes impacting
supply
Easter Christmas
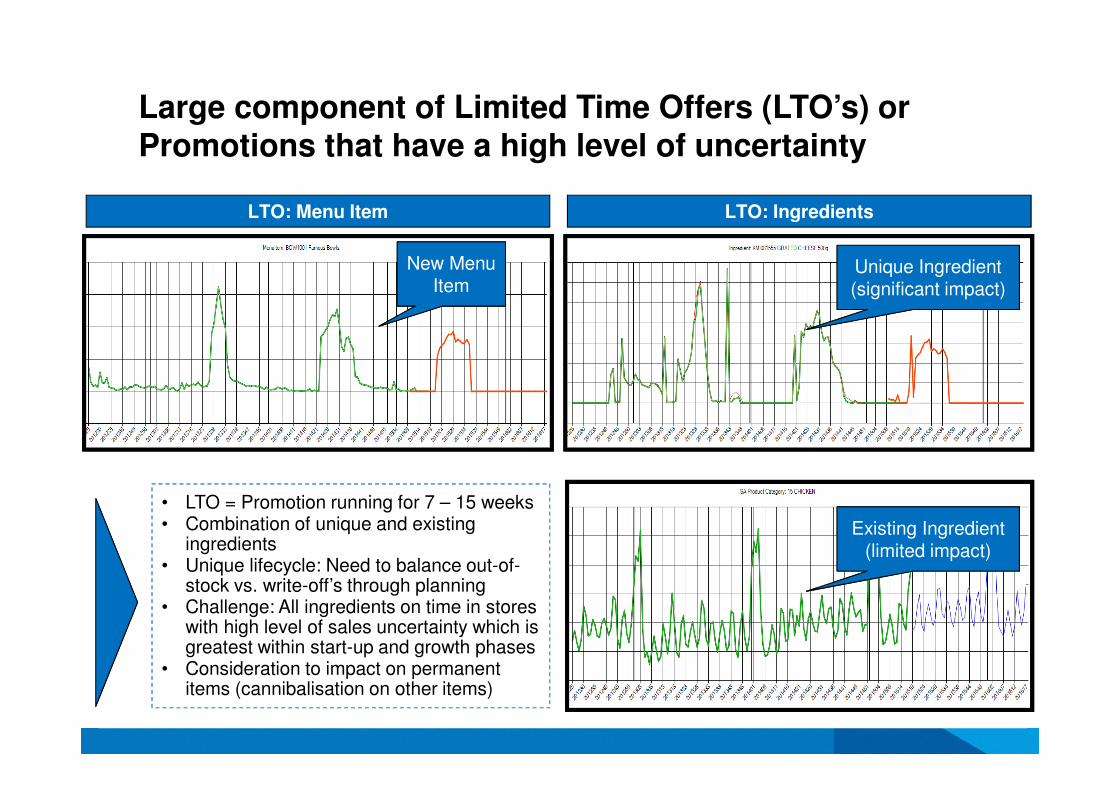
Large component of Limited Time Offers (LTO’s) or Promotions that have a high level of uncertainty
• LTO = Promotion running for 7 – 15 weeks• Combination of unique and existing
ingredients• Unique lifecycle: Need to balance out-of-
stock vs. write-off’s through planning• Challenge: All ingredients on time in stores
with high level of sales uncertainty which is greatest within start-up and growth phases
• Consideration to impact on permanent items (cannibalisation on other items)
LTO: Menu Item LTO: Ingredients
New Menu Item
Unique Ingredient (significant impact)
Existing Ingredient (limited impact)
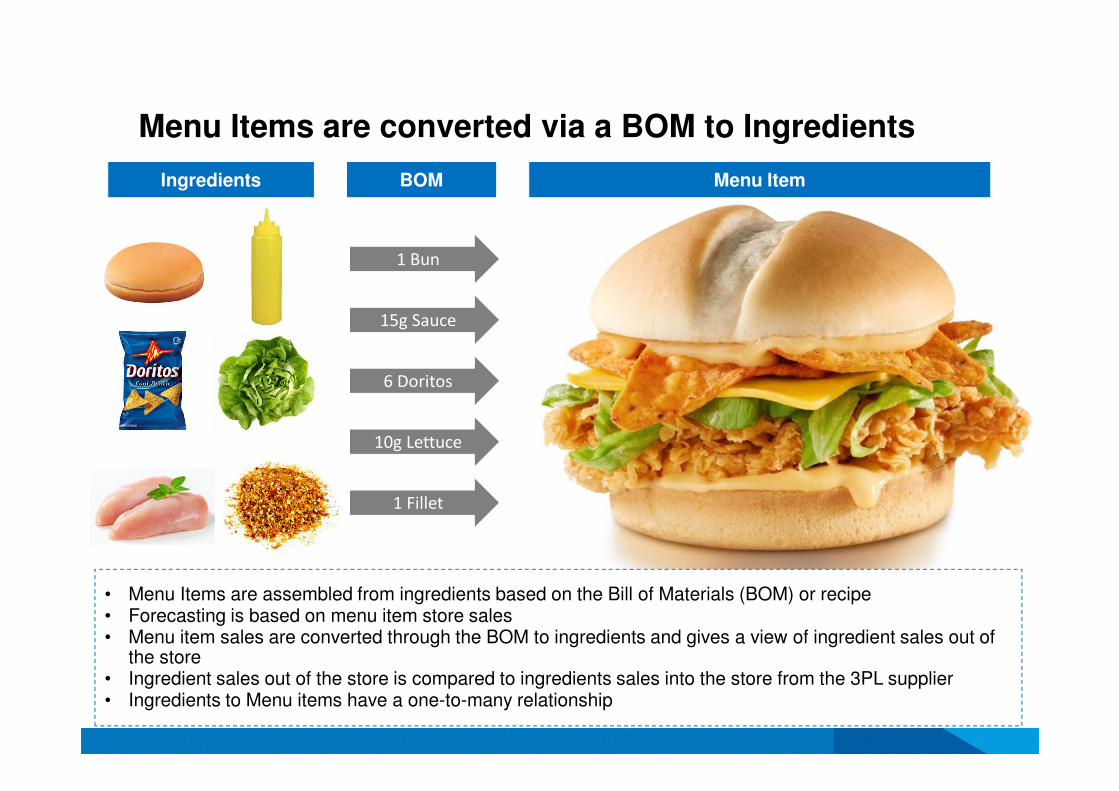
Menu Items are converted via a BOM to Ingredients
1 Bun
15g Sauce
6 Doritos
10g Lettuce
1 Fillet
BOM Menu ItemIngredients
• Menu Items are assembled from ingredients based on the Bill of Materials (BOM) or recipe • Forecasting is based on menu item store sales• Menu item sales are converted through the BOM to ingredients and gives a view of ingredient sales out of
the store• Ingredient sales out of the store is compared to ingredients sales into the store from the 3PL supplier• Ingredients to Menu items have a one-to-many relationship
Agenda
• About KFC
• Complexity in QSR
• The Project
• Lessons Learnt
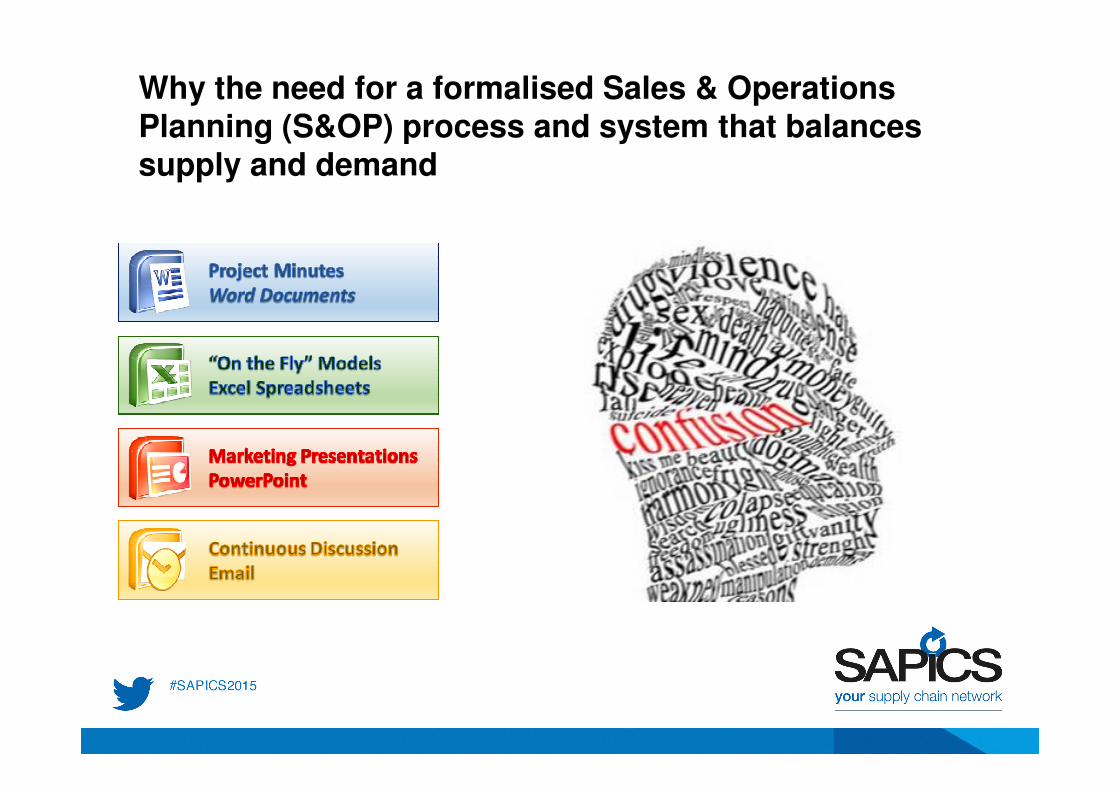
Why the need for a formalised Sales & Operations Planning (S&OP) process and system that balances supply and demand
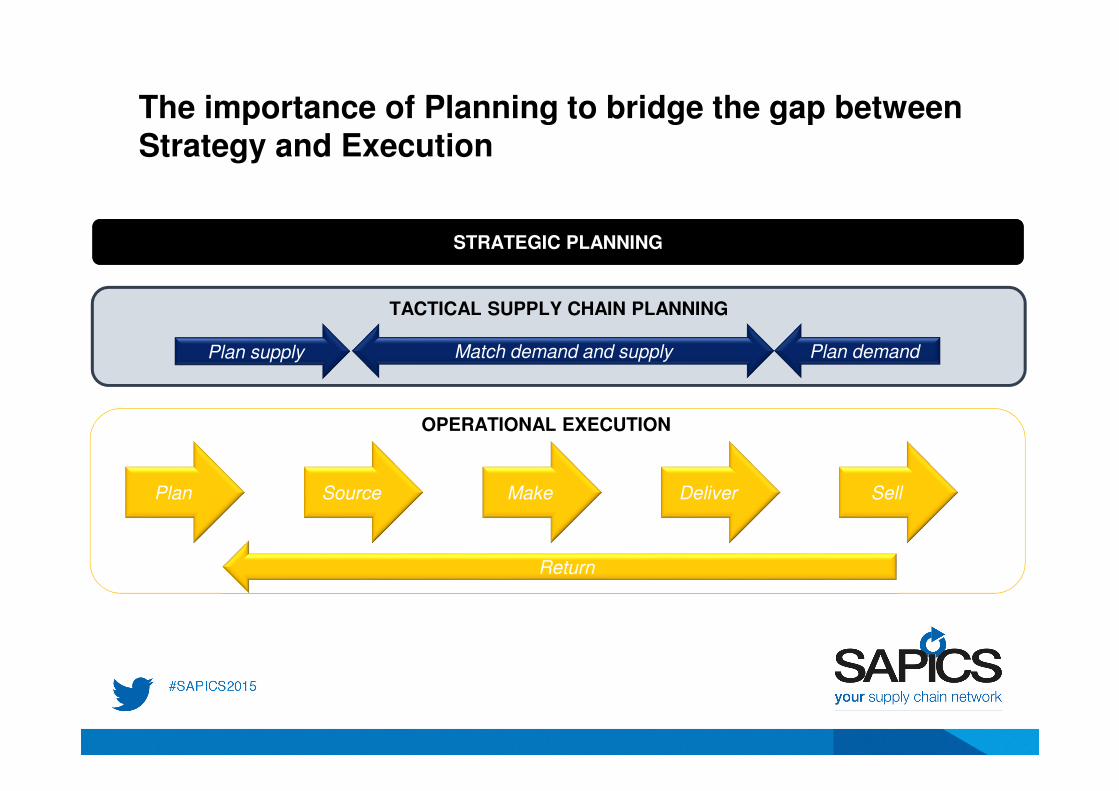
The importance of Planning to bridge the gap between Strategy and Execution
TACTICAL SUPPLY CHAIN PLANNING
Plan supply Match demand and supply Plan demand
Return
OPERATIONAL EXECUTION
STRATEGIC PLANNINGSTRATEGIC PLANNING
Plan Source Make Deliver Sell
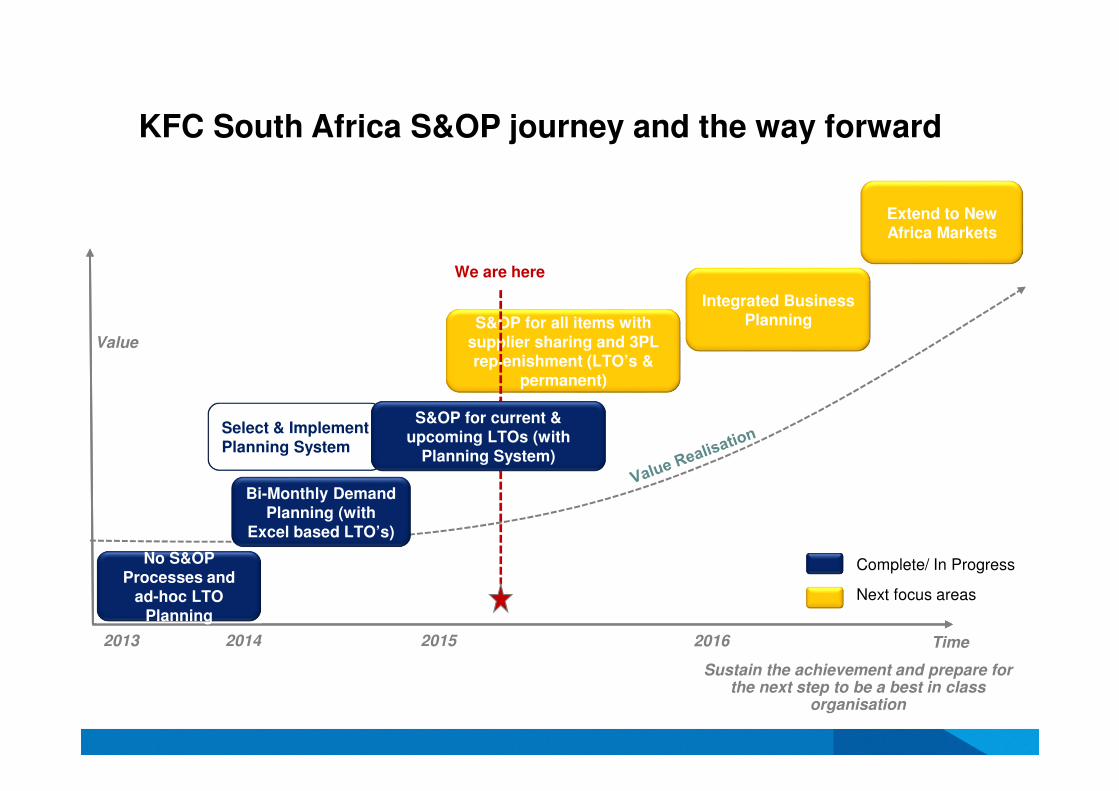
KFC South Africa S&OP journey and the way forward
20142013
Sustain the achievement and prepare for the next step to be a best in class
organisation
Complete/ In Progress
Next focus areas
No S&OP Processes and
ad-hoc LTO Planning
Bi-Monthly DemandPlanning (with
Excel based LTO’s)
2015 2016 Time
Value
S&OP for all items with supplier sharing and 3PL replenishment (LTO’s &
permanent)
Integrated Business Planning
Extend to New Africa Markets
We are here
Select & Implement Planning System
S&OP for current & upcoming LTOs (with
Planning System)
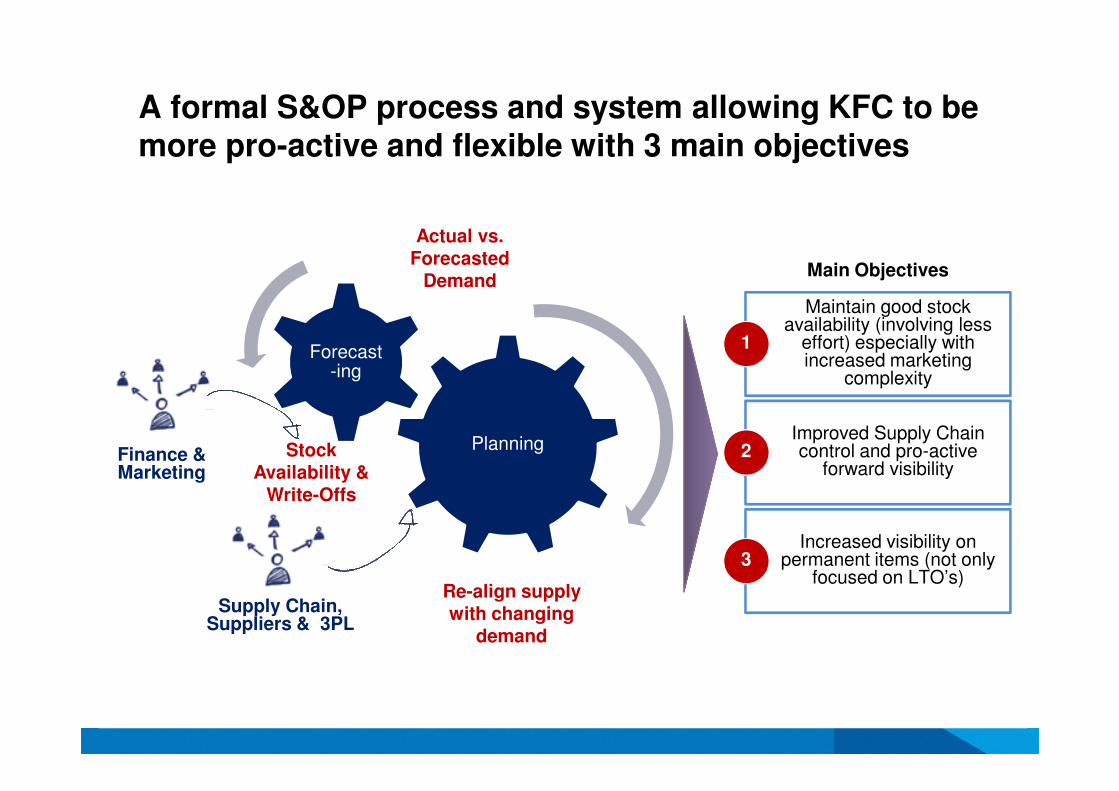
A formal S&OP process and system allowing KFC to be more pro-active and flexible with 3 main objectives
Planning
Forecast-ing
Finance & Marketing
Maintain good stock availability (involving less
effort) especially with increased marketing
complexity
Improved Supply Chain control and pro-active
forward visibility
Increased visibility on permanent items (not only
focused on LTO’s)
1
2
3
Main Objectives
Supply Chain, Suppliers & 3PL
Re-align supply with changing
demand
Stock Availability &
Write-Offs
Actual vs. Forecasted
Demand
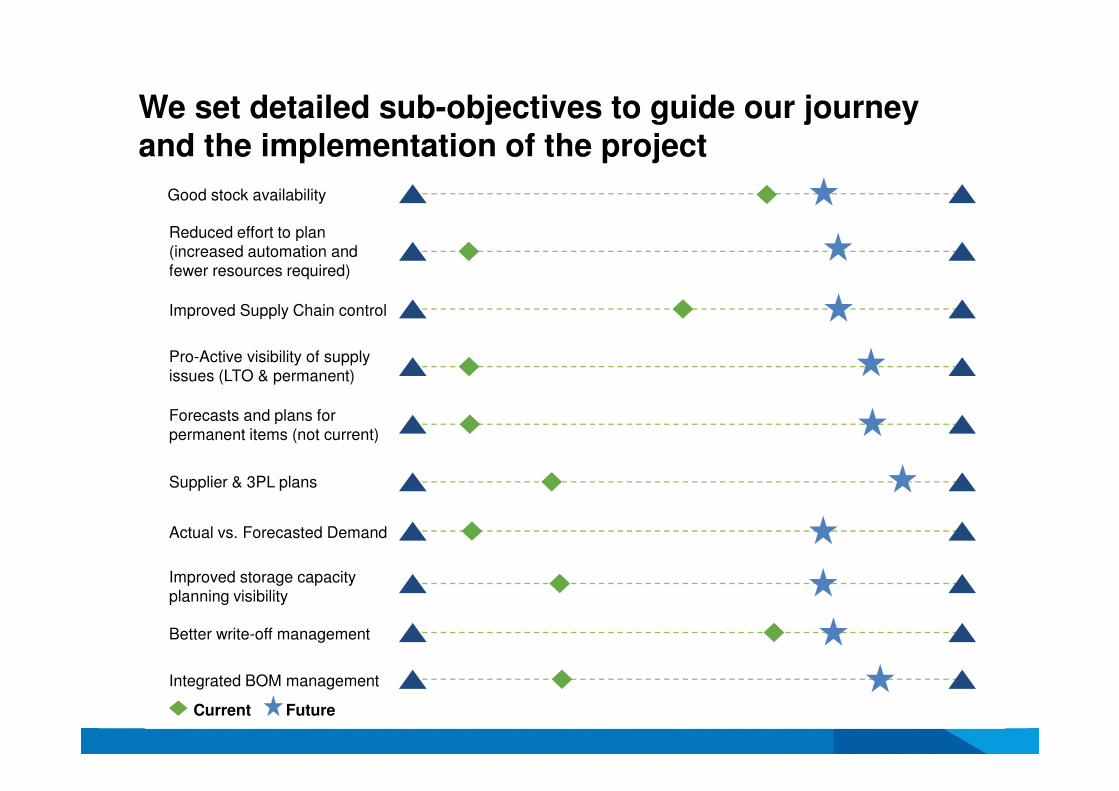
We set detailed sub-objectives to guide our journey and the implementation of the project
Good stock availability
Reduced effort to plan (increased automation and fewer resources required)
Improved Supply Chain control
Pro-Active visibility of supply issues (LTO & permanent)
Supplier & 3PL plans
Forecasts and plans for permanent items (not current)
Actual vs. Forecasted Demand
Improved storage capacity planning visibility
Better write-off management
Integrated BOM management
Current Future
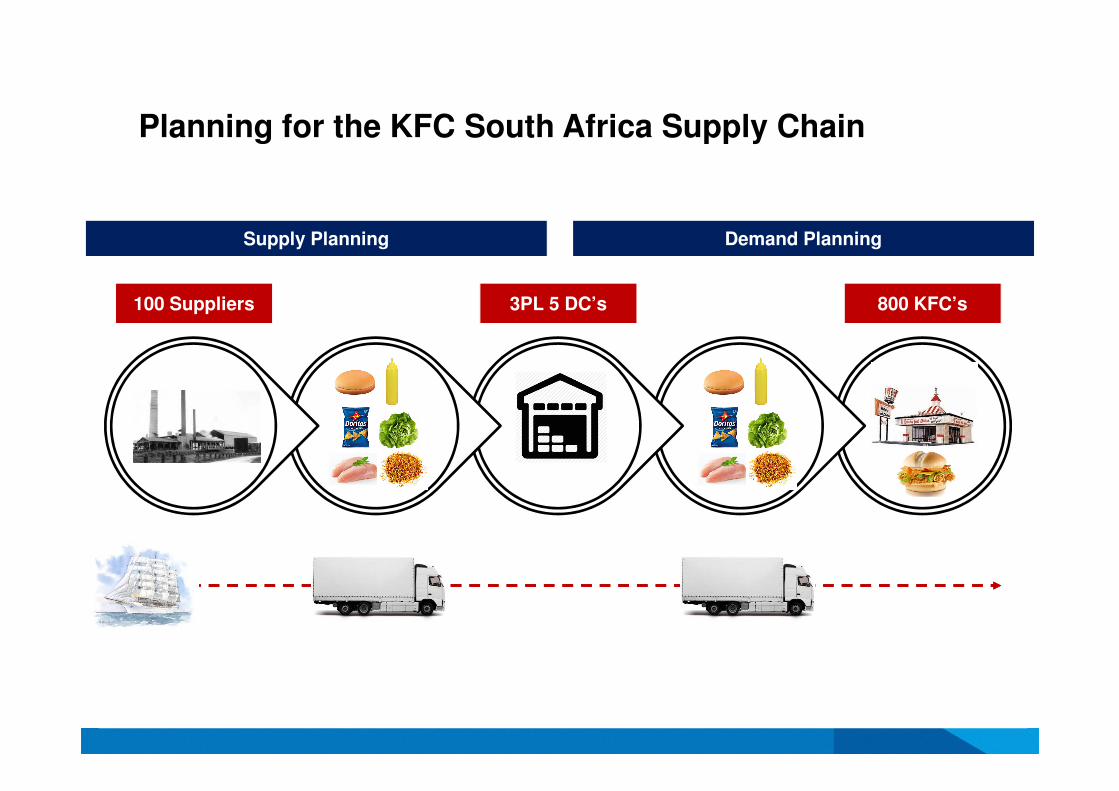
Planning for the KFC South Africa Supply Chain
3PL 5 DC’s 800 KFC’s100 Suppliers
Supply Planning Demand Planning
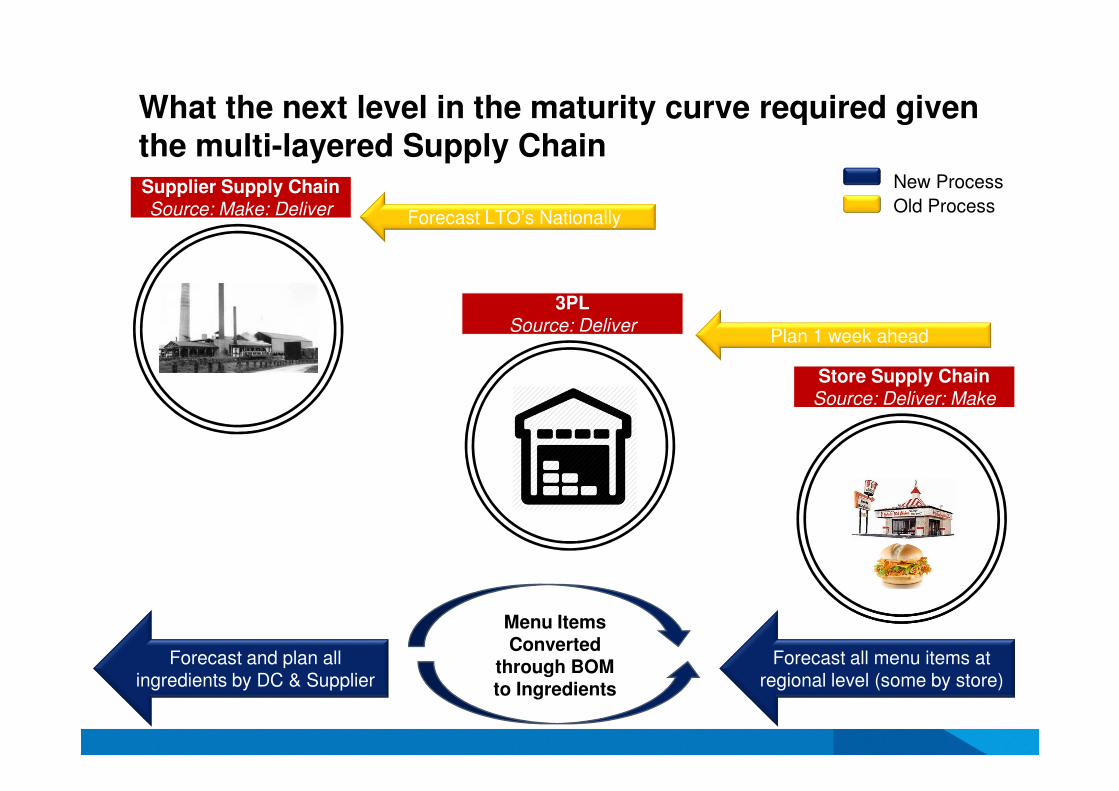
What the next level in the maturity curve required given the multi-layered Supply Chain
Store Supply ChainSource: Deliver: MakeStore Supply Chain
Source: Deliver: Make
3PLSource: Deliver
3PLSource: Deliver
Supplier Supply ChainSource: Make: Deliver
Supplier Supply ChainSource: Make: Deliver
Plan 1 week ahead
Forecast LTO’s Nationally
New Process
Old Process
Forecast all menu items at regional level (some by store)
Forecast and plan all ingredients by DC & Supplier
Menu ItemsConverted
through BOM to Ingredients
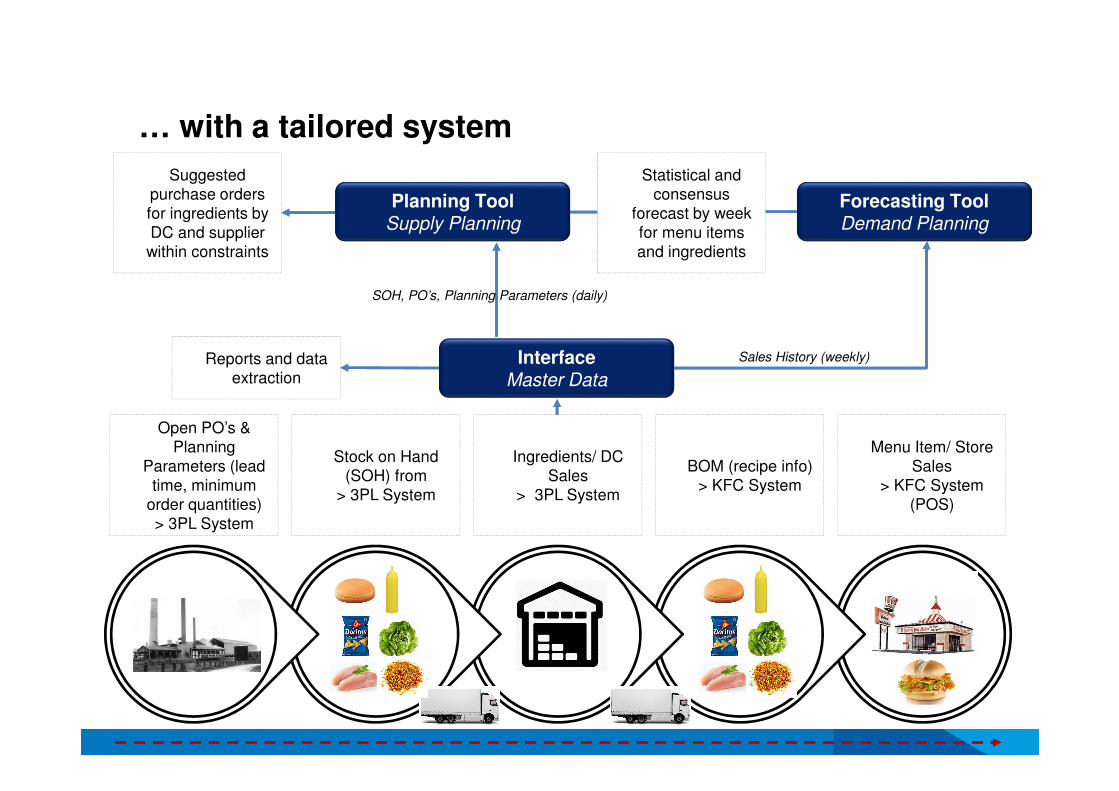
… with a tailored system
InterfaceMaster Data
Forecasting ToolDemand Planning
Open PO’s & Planning
Parameters (lead time, minimum
order quantities)> 3PL System
Stock on Hand (SOH) from
> 3PL System
Ingredients/ DC Sales
> 3PL System
BOM (recipe info) > KFC System
Menu Item/ Store Sales
> KFC System (POS)
Reports and data extraction
Statistical and consensus
forecast by week for menu items and ingredients
Suggested purchase orders for ingredients by DC and supplier within constraints
Sales History (weekly)
SOH, PO’s, Planning Parameters (daily)
Planning ToolSupply Planning
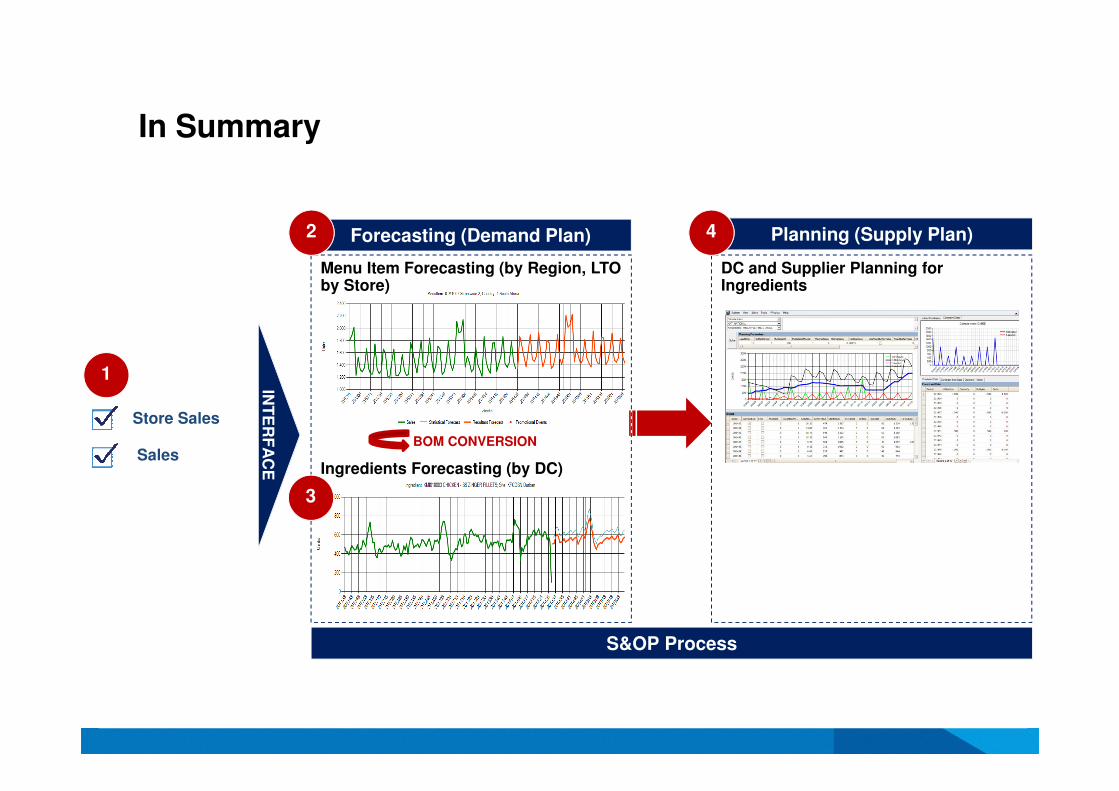
In Summary
Planning (Supply Plan)Forecasting (Demand Plan)
Store Sales
Sales
INT
ER
FA
CE
Menu Item Forecasting (by Region, LTO by Store)
Ingredients Forecasting (by DC)
DC and Supplier Planning for Ingredients
BOM CONVERSION
S&OP Process
1
2
3
4
Agenda
• About KFC
• Complexity in QSR
• The Project
• Lessons Learnt
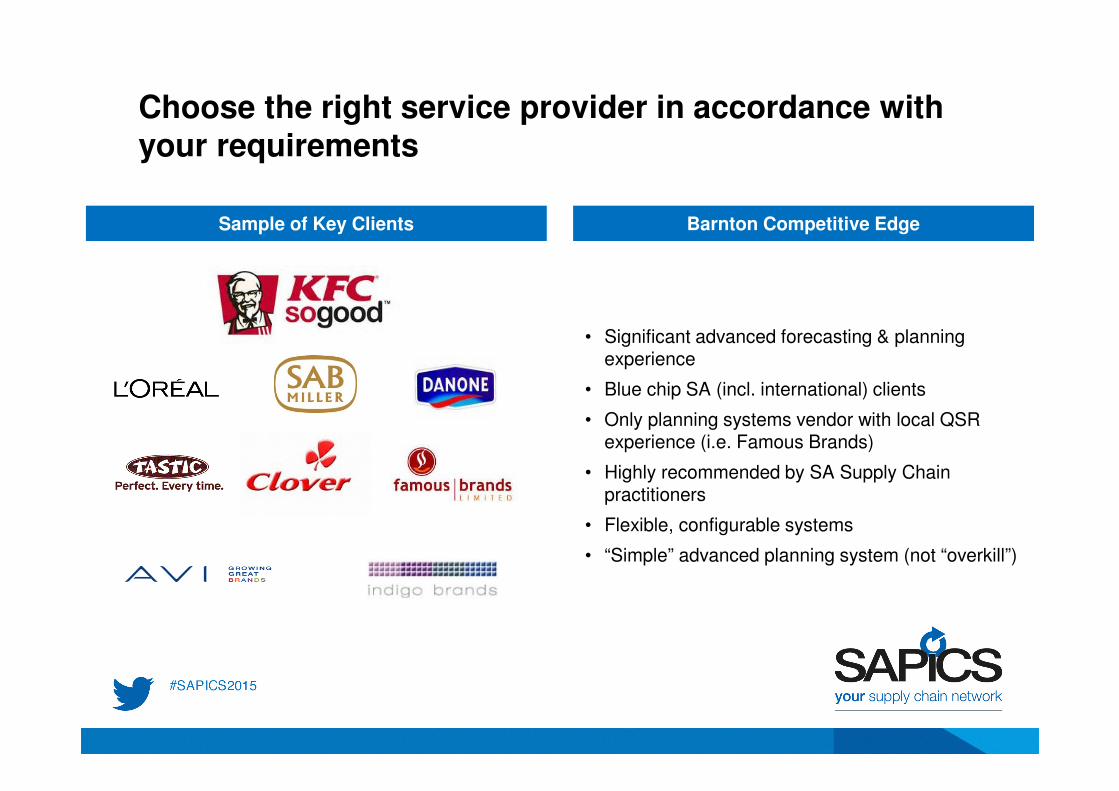
Choose the right service provider in accordance with your requirements
Sample of Key Clients Barnton Competitive Edge
• Significant advanced forecasting & planning experience
• Blue chip SA (incl. international) clients
• Only planning systems vendor with local QSR experience (i.e. Famous Brands)
• Highly recommended by SA Supply Chain practitioners
• Flexible, configurable systems
• “Simple” advanced planning system (not “overkill”)
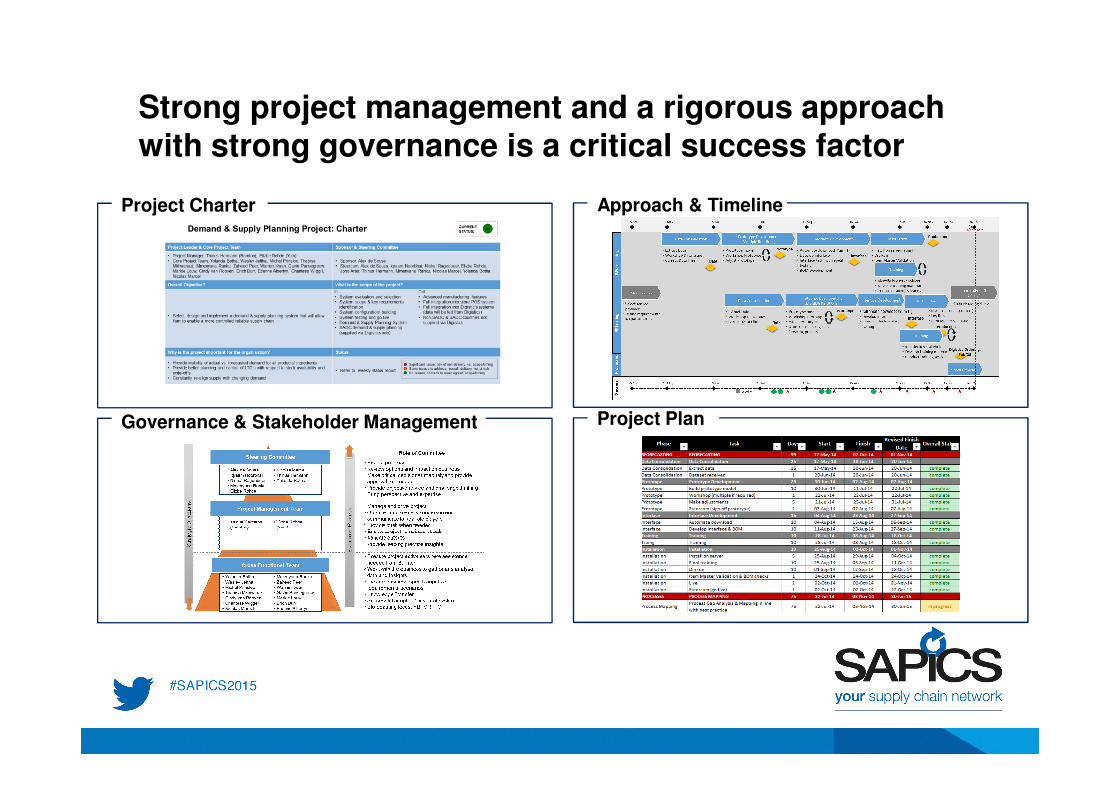
Strong project management and a rigorous approach with strong governance is a critical success factor
20
Project Charter
Governance & Stakeholder Management
Approach & Timeline
Project Plan
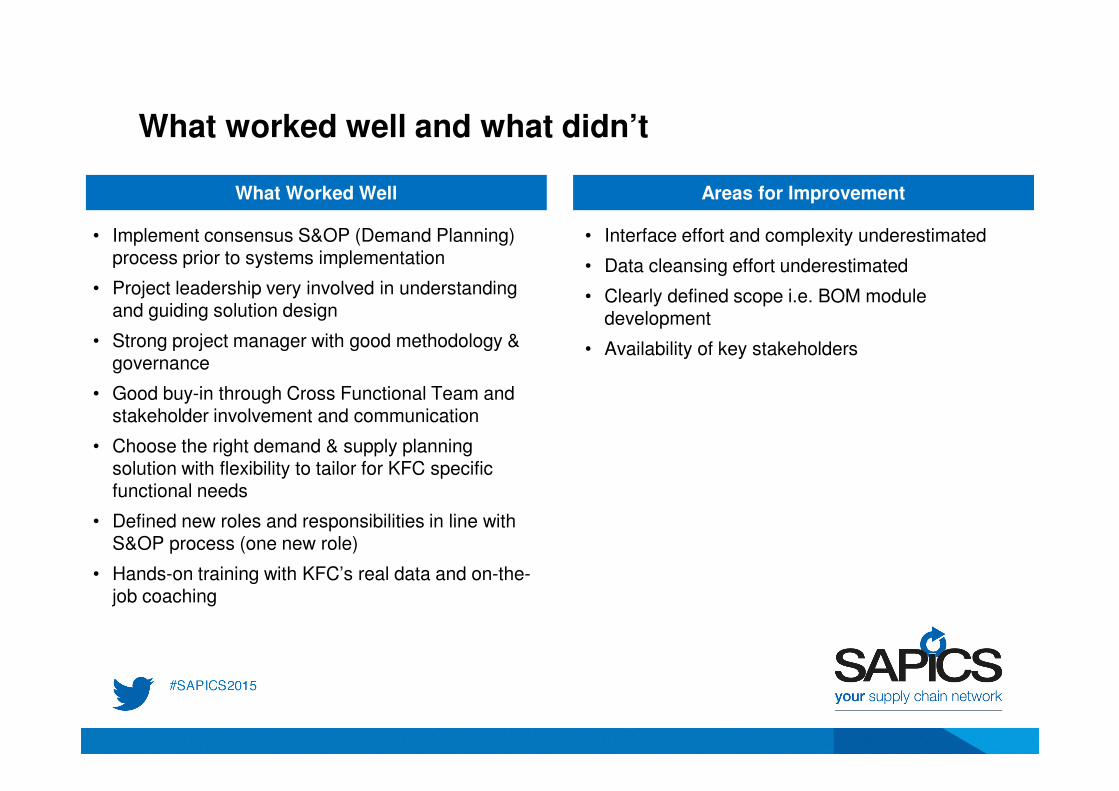
What worked well and what didn’t
What Worked Well Areas for Improvement
• Interface effort and complexity underestimated
• Data cleansing effort underestimated
• Clearly defined scope i.e. BOM module development
• Availability of key stakeholders
• Implement consensus S&OP (Demand Planning) process prior to systems implementation
• Project leadership very involved in understanding and guiding solution design
• Strong project manager with good methodology & governance
• Good buy-in through Cross Functional Team and stakeholder involvement and communication
• Choose the right demand & supply planning solution with flexibility to tailor for KFC specific functional needs
• Defined new roles and responsibilities in line with S&OP process (one new role)
• Hands-on training with KFC’s real data and on-the-job coaching
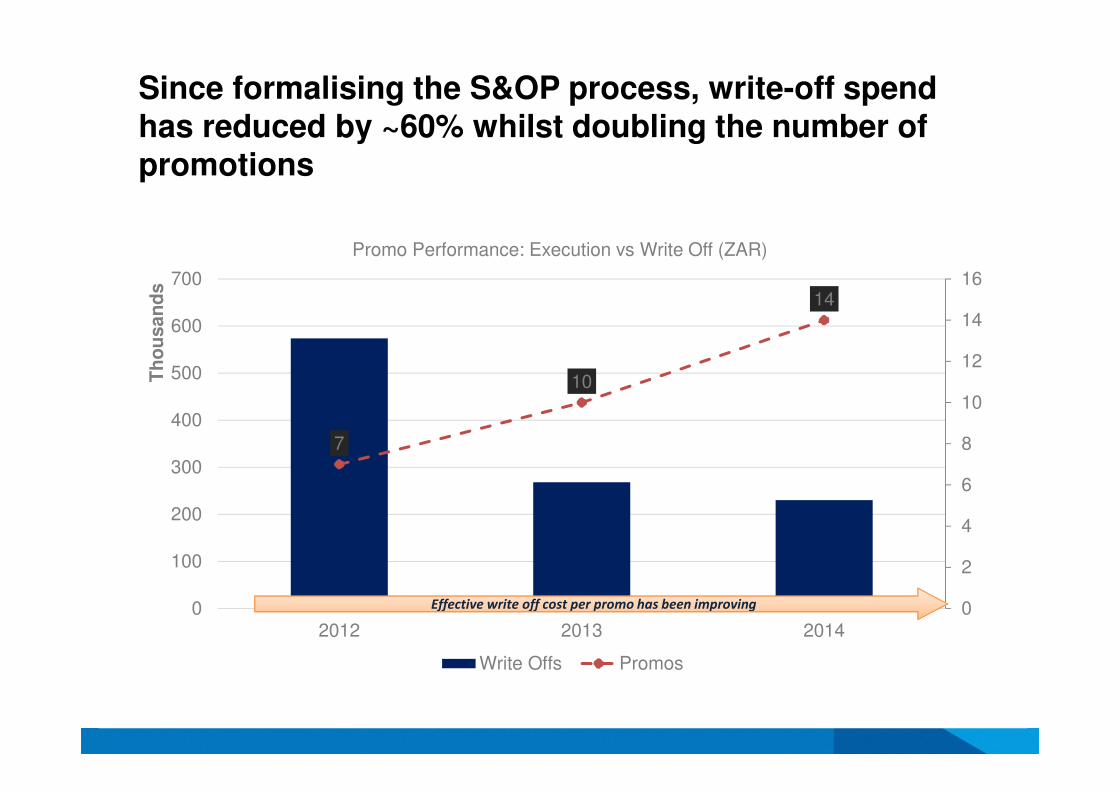
Since formalising the S&OP process, write-off spend has reduced by ~60% whilst doubling the number of promotions
7
10
14
0
2
4
6
8
10
12
14
16
0
100
200
300
400
500
600
700
2012 2013 2014
Th
ou
san
ds
Promo Performance: Execution vs Write Off (ZAR)
Write Offs Promos
Effective write off cost per promo has been improving
0
2 000
4 000
6 000
8 000
10 000
12 000
14 000
16 000
2013 2014
Out of Stock Occurance at Order Line Level
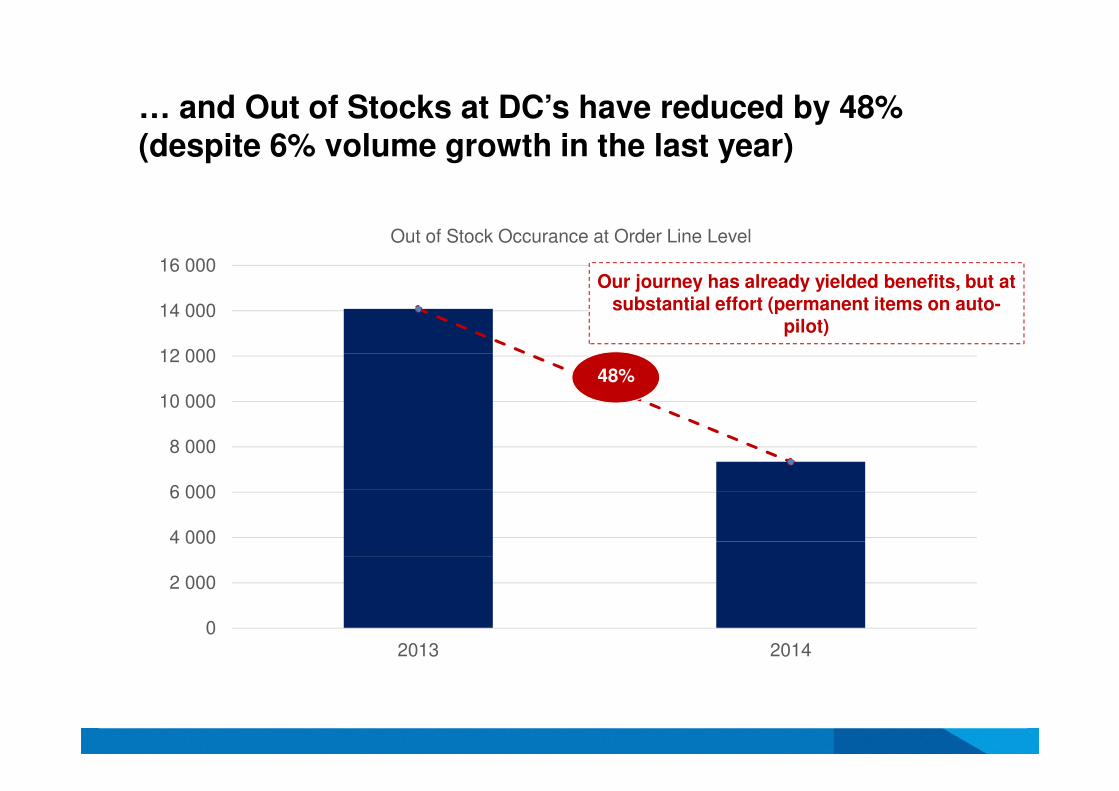
… and Out of Stocks at DC’s have reduced by 48% (despite 6% volume growth in the last year)
48%
Our journey has already yielded benefits, but at substantial effort (permanent items on auto-
pilot)
Q&A and Contact Details for more information
For more information please
contact:
Thinus HermannImplementation PartnerBarnton ConsultingMobile: +27 (0) 79 502 7515Email: [email protected]
Elizbe RohdeImplementation Project ManagerKFC Supply Chain Manager (South Africa)Landline: +27 (0) 11 790 9149Mobile: +27 (0) 82 416 7029Email: [email protected]