Embed Size (px)
Citation preview

FUELING THE
FUTURE: SUSTAINABLE AND
RENEWABLE ENERGY
OPPORTUNITIES AND SOLUTIONS
Sharon Fortune BowdenCertified Architect
Abner Tsadick
Principal Pricing Analyst
PANELISTS
Sarath Kamalakkannan
Delivery Manager
Moderator
Dr. Claire A. Nelson
Founder and CIO
The Futures Forum
Our Topic
• Energy Efficiency and the use of alternative energy solutions is a hot topic in our nation. Policy makers, educators, and STEM professionals are working in many areas to evaluate energy alternatives and develop innovative ways to be more efficient about how we fuel the future. What are new trends in this industry? What is our collective responsibility? How do policy and politics impact renewable energy?

Agenda
• Impact of Sustainable and Renewable Energy
• Recent Developments and sources of energy
available
• Impact of policy and law on renewable energy
• Global perspectives on Energy Efficiency

Sustainable Energy Trends
Upward trend in renewable energy generated in Scotland
*China above*US above

Recent Developments: New and Emerging Technologies
Wave Power: Usage?
Luz Solar ElectricGenerating Station: Usage?
Large Scale Fuel Cell: Usage?

• Daily patterns are expected– Demand is lowest overnight, increases through the morning, and peaks in afternoon or evening
– Features: morning ramp, evening peak.
– Generators increase output or begin generating to match demand during ramp. Steeper ramps are more challenging
– Note that small demand fluctuations are smoothed out over a large population/geographic area
Sustainable Energy: Typical Daily Electrical load patterns in the Southwest Power Pool
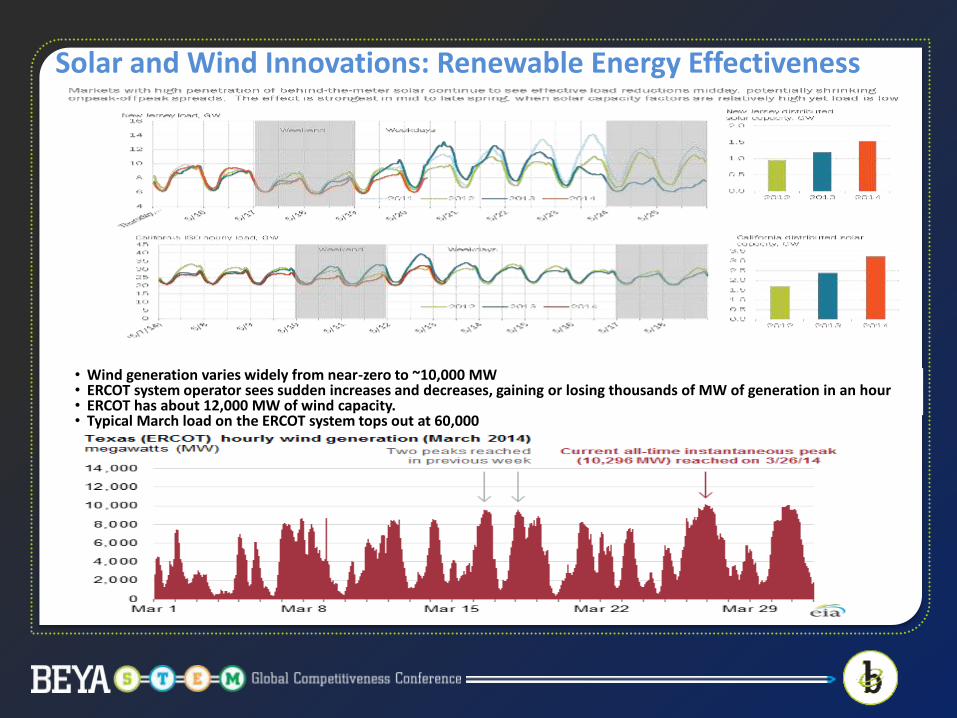
Solar and Wind Innovations: Renewable Energy Effectiveness
• Wind generation varies widely from near-zero to ~10,000 MW• ERCOT system operator sees sudden increases and decreases, gaining or losing thousands of MW of generation in an hour• ERCOT has about 12,000 MW of wind capacity.• Typical March load on the ERCOT system tops out at 60,000

Issues with Solar generation
5 Critical External Factors Influencing System Performance
• Irradiance : the amount of sunlight falling on a given surface
• Temperature: the warmer solar cells get, the less efficient they are
• Soiling
• Shading
• Snow: performance degradation may range from a minimum of 8% performance degradation (for early spring and late fall months) to a maximum of 30% (for mid-winter months) for systems in regions that experience significant snowfall.

Issues with Solar generation: Very short term variability
• Cloud cover dramatically reduces output on very fast timescales
• But on an hourly and seasonal basis, solar output is fairly predictable: PV generates during daytime, peaking around noon, and weakening in winter months vs summer months
• EIA puts hourly solar generation + solar capacity growth in California in context of all generation sources:

Harnessing Wave Energy
• https://www.youtube.com/watch?v=GA_UgVm9bvU

Polices to Promote Renewable Energy
Most common policies:
1.Feed-in law [producers guaranteed sale to electric network].
- By 2007, at least 37 countries and 9 states/provinces, more than half enacted since 2002.
2. Renewable portfolio standards (RPS)/ renewable obligations or quota [a % of generation sold or capacity installed is provided by renewable energy
- United States, Canada, India, Australia, China, Italy, Japan, Poland, Sweden, and the United Kingdom.
- U. S., five states enacted new RPS policies during 2006/2007 (Illinois, New Hampshire, North Carolina, Oregon, and Washington State), total US = 25 + D.C (four states have policy goals).
- 9 U.S. states revised existing RPS targets, including California, which accelerated to 2010 an existing target of 20 % by 2017.
Policies to Promote Renewable Energy

Other Forms of Policy Support
Capital investment subsidies or rebates,
Tax incentives and credits,
Sales tax and value-added tax exemptions,
Energy production payments or tax credits,
Public investment or financing.
Mandates for incorporating solar hot water into new construction.
Germany:
All new residential buildings (2009), 14 % of household heating and hot water energy from renewables
Existing German buildings be retrofitted to meet 10 % of their heating energy from renewables.
Allocation of $490 million in 2008 for capital grants to homeowners.
Cape Town, South Africa,
- Draft 2007 bylaw undergoing review: solar hot water in new houses for middle- and high-income groups.
Other Forms of Policy Support

Renewable Portfolio Standard Policies
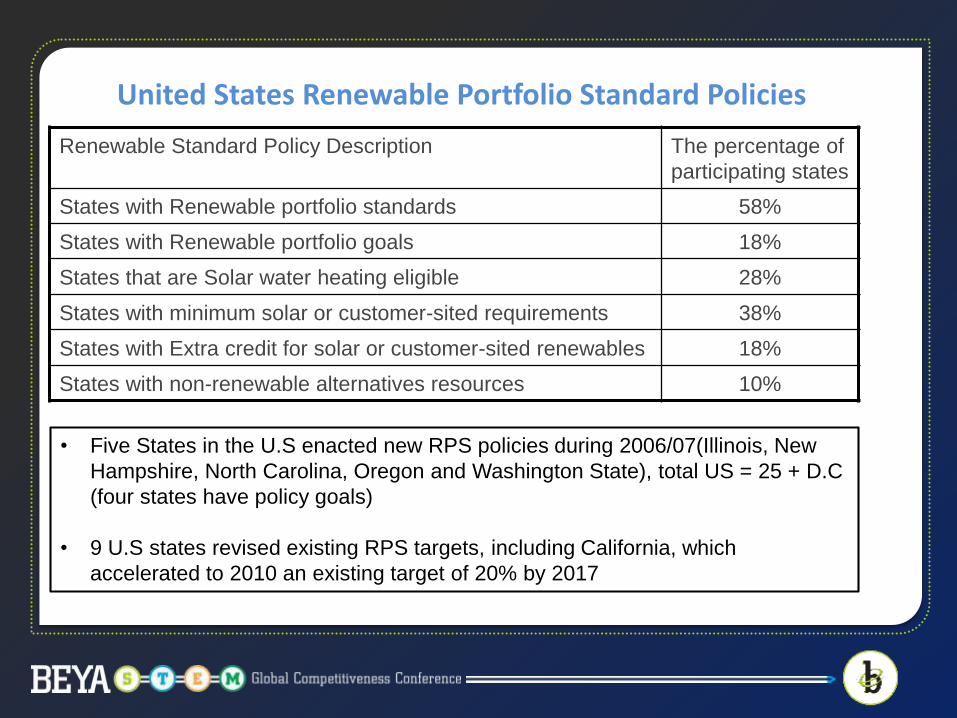
United States Renewable Portfolio Standard Policies
Renewable Standard Policy Description The percentage of
participating states
States with Renewable portfolio standards 58%
States with Renewable portfolio goals 18%
States that are Solar water heating eligible 28%
States with minimum solar or customer-sited requirements 38%
States with Extra credit for solar or customer-sited renewables 18%
States with non-renewable alternatives resources 10%
• Five States in the U.S enacted new RPS policies during 2006/07(Illinois, New
Hampshire, North Carolina, Oregon and Washington State), total US = 25 + D.C
(four states have policy goals)
• 9 U.S states revised existing RPS targets, including California, which
accelerated to 2010 an existing target of 20% by 2017
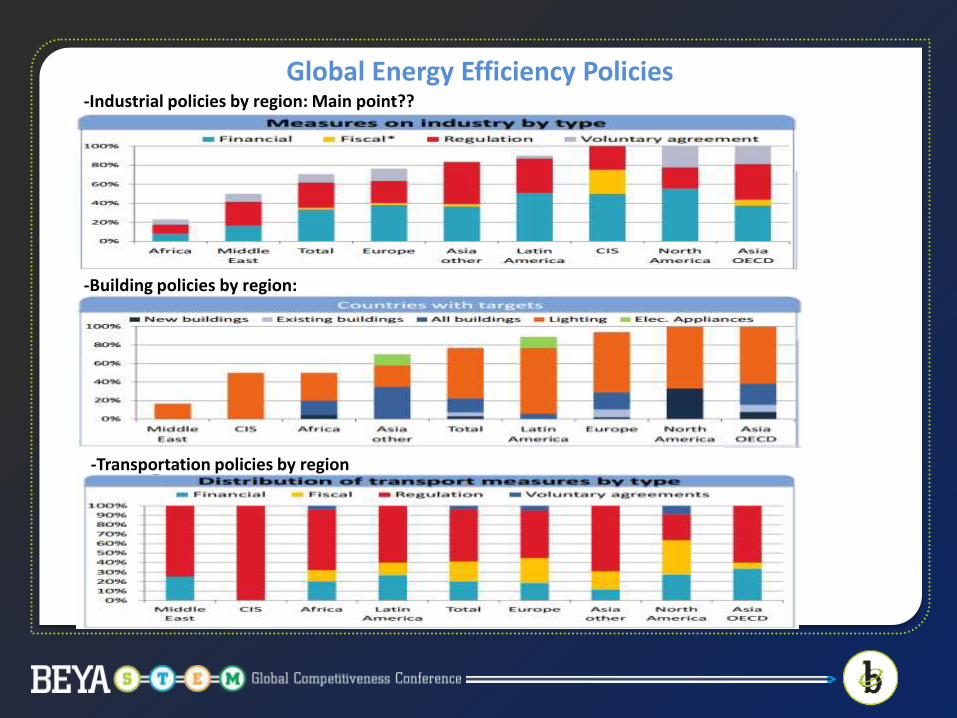
-Industrial policies by region: Main point??
Global Energy Efficiency Policies
-Building policies by region:
-Transportation policies by region

Germany’s Reaction to Fukushima

Germany’s Reaction to Fukushima, cont.

Germany’s Reaction to Fukushima, cont.
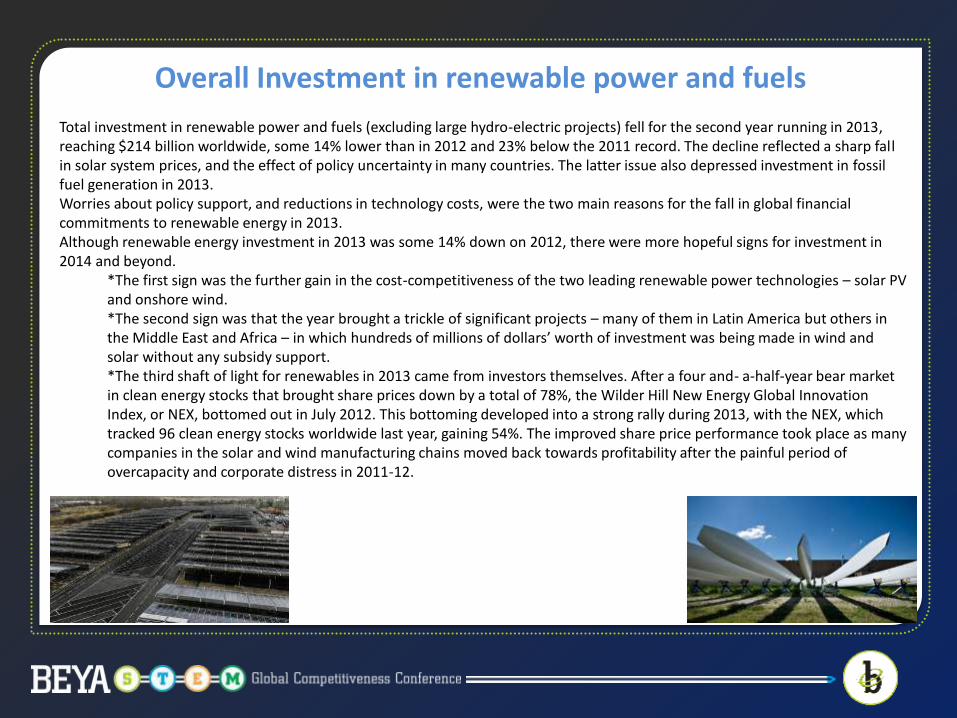
Overall Investment in renewable power and fuels
Total investment in renewable power and fuels (excluding large hydro-electric projects) fell for the second year running in 2013, reaching $214 billion worldwide, some 14% lower than in 2012 and 23% below the 2011 record. The decline reflected a sharp fall in solar system prices, and the effect of policy uncertainty in many countries. The latter issue also depressed investment in fossil fuel generation in 2013. Worries about policy support, and reductions in technology costs, were the two main reasons for the fall in global financial commitments to renewable energy in 2013.Although renewable energy investment in 2013 was some 14% down on 2012, there were more hopeful signs for investment in 2014 and beyond.
*The first sign was the further gain in the cost-competitiveness of the two leading renewable power technologies – solar PV and onshore wind.*The second sign was that the year brought a trickle of significant projects – many of them in Latin America but others in the Middle East and Africa – in which hundreds of millions of dollars’ worth of investment was being made in wind and solar without any subsidy support.*The third shaft of light for renewables in 2013 came from investors themselves. After a four and- a-half-year bear market in clean energy stocks that brought share prices down by a total of 78%, the Wilder Hill New Energy Global Innovation Index, or NEX, bottomed out in July 2012. This bottoming developed into a strong rally during 2013, with the NEX, which tracked 96 clean energy stocks worldwide last year, gaining 54%. The improved share price performance took place as many companies in the solar and wind manufacturing chains moved back towards profitability after the painful period of overcapacity and corporate distress in 2011-12.

Citations/References• http://www.globalclimateforum.org/fileadmin/ecf-documents/news-events/2008-03_renewables-in-the-
mediterranean/toro__the-environmental-impacts-of-renewable-
energy.ppt+&cd=2&hl=en&ct=clnk&gl=us
• EIA.gov (http://www.eia.gov/todayinenergy/detail.cfm?id=16851)
• NREL.gov
• AWStruepower.com
• AWEA.org
• https://facultystaff.richmond.edu/~sabrash/110/Renewable%2520Energy%2520Sources.ppt+&cd=2&
hl=en&ct=clnk&gl=us
• http://www.dsireusa.org/summarymaps/index.cfm?ee=1&RE=1
• http://www.colby.edu/environ/courses/ES118/LectNotes/Energy1.ppt+&cd=1&hl=en&ct=clnk&gl=us
• https://www.iea.org/media/workshops/2013/semedmenaroundtable/Session4DidierBossebeouf.pdf
• http://www.hit-u.ac.jp/kenkyu/file/23eusi/raetzke.pdf
• http://www.unep.org/pdf/Green_energy_2013-Key_findings.pdf
• Constellation Market Fundamentals (Senior Market Analyst – Marie Rinkoski Spangler)
• http://www.eia.gov/energy_in_brief/images/charts/nonhydro_renewable_electricity_generation_by_so
urce_2013.jpg
• http://www.futuretimeline.net/blog/images/1212.gif
• http://www.scotland.gov.uk/Resource/0046/00466993-745.png