Embed Size (px)
Citation preview
InFo
cus
Seri
es
Global Corrugated Packaging Market Outlook to 2021
2
Contents
Co
nte
nts
Table of Contents
Chapter-1 Executive Summary
Chapter-2 Introduction and methodology
Chapter-3 Major corrugated packaging markets
Chapter-4 End use sectors
Chapter-5 Trade analysis of the corrugated packaging market
Chapter-6 Major trends and developments
Chpater-7 Leading companies in the corrugated packaging market
Appendix-A Trade statistics 2011-2015
Appendix-B Macroeconomic forecasts in selected countries and regions 2013-2021
3
Table of contents
Tab
le o
f co
nte
nts
1.1 An overview of the global corrugated packaging market
1.2 End use sectors dynamics
1.3 Major trend and developments in the industry
1.4 Key conclusions and recommendations
Chapter 1- Executive summary
Chapter 3- Major corrugated packaging markets
3.1 Asia
3.1.1 China
3.1.2 India
3.1.3 Indonesia
3.1.4 Japan
3.1.5 South Korea
3.2 Central and South America
3.2.1 Brazil
3.2.2 Argentina
Chapter 2- Introduction and methodology
2.1 Background and assumptions
2.2 Aims and objectives
2.3 Methodology
4
Table of contents
Tab
le o
f co
nte
nts
3.3 Europe
3.3.1 France
3.3.2 Germany
3.3.3 Italy
3.3.4 Poland
3.3.5 Russia
3.3.6 Turkey
3.3.7 UK
3.4 Middle East and Africa
3.4.1 Saudi Arabia
3.4.2 South Africa
3.5 North America
3.5.1 Canada
3.5.2 Mexico
3.5.3 USA
3.6 Oceania
3.6.1 Australia
Chapter 4- Major end use sectors
4.1 Food
4.1.1 Beverages
4.1.2 Fresh food and produce
4.1.3 Processed food
5
Table of contents
Tab
le o
f co
nte
nts
4.2 Non-food
4.2.1 Automotive
4.2.2 Consumer electronics
4.2.3 Foodservice disposables
4.2.4 Furniture and timber products
4.2.5 Glassware and ceramics
4.2.6 Healthcare
4.2.7 Home care
4.2.8 Industrial chemicals
4.2.9 Personal care
4.2.10 Sports and fitness
4.2.11 Stationery
4.2.12 Textile and footwear
4.2.13 Tobacco 4.2.14 Others
Chapter 5- Global trade analysis of corrugated packaging
6.1 Alternative packaging
6.2 Capacity changes
6.3 Consumer behaviour
Chapter 6- Major trends and developments
6
Table of contents
Tab
le o
f co
nte
nts
6.4 Consumer convenience and weight issues
6.5 Cost structure
6.6 Emerging markets
6.7 Environment and sustainability
6.8 Fragmentation and export market
6.9 Internet retailing
6.10 Microflute
6.11 Premium packaging
6.12 Printing
6.13 Retail and shelf ready packaging
6.14 Retail sector
Appendix A- Trade statistics 2011-2015
Appendix B- Macroeconomic forecasts in selected countries and regions 2013-2021
Chapter 7- Leading companies and competitive landscapes
7
Table of contents
Tab
le o
f co
nte
nts
List of tables
Table 1.1: Global corrugated packaging demand by region 2013- 2021 (million tonnes) Table 1.2: Global corrugated packaging demand by region 2013- 2021 ($ billions) Table 1.3: Corrugated packaging demand segmentations by 3 food sectors 2013-2021 (million tonnes) Table 1.4: Corrugated packaging demand segmentations by 14 non-food sectors 2013-2021(million tonnes) Table 1.5: Corrugated packaging demand segmentations by 3 food sectors 2013-2021 ($ billions) Table 1.6: Corrugated packaging demand segmentations by 14 non-food sectors 2013-2021($ billions) Table 3.1: Chinese corrugated packaging demand 2013-2021 (million tonnes, %) Table 3.2: Chinese corrugated packaging demand 2013-2021 ($ billions, %) Table 3.3: Indian corrugated packaging demand 2013-2021 (million tonnes, %) Table 3.4: Indian corrugated packaging demand 2013-2021 ($ billions, %) Table 3.5: Indonesian corrugated packaging demand 2013-2021 (million tonnes, %) Table 3.6: Indonesian corrugated packaging demand 2013-2021 ($ billions, %) Table 3.7: Japanese corrugated packaging demand 2013-2021 (million tonnes, %) Table 3.8: Japanese corrugated packaging demand 2013-2021 ($ billions, %) Table 3.9: South Korean corrugated packaging demand 2013-2021 (million tonnes, %) Table 3.10: South Korean corrugated packaging demand 2013-2021 ($ billions, %) Table 3.11: Brazilian corrugated packaging demand 2013-2021 (million tonnes, %) Table 3.12: Brazilian corrugated packaging demand 2013-2021 ($ billions, %) Table 3.13: Argentinean corrugated packaging demand 2013-2021 (million tonnes, %) Table 3.14: Argentinean corrugated packaging demand 2013-2021 ($ billions, %) Table 3.15: French corrugated packaging demand 2013-2021 (million tonnes, %) Table 3.16: French corrugated packaging demand 2013-2021 ($ billions, %)
8
Table of contents
Tab
le o
f co
nte
nts
Table 3.17: German corrugated packaging demand 2013-2021 (million tonnes, %) Table 3.18: German corrugated packaging demand 2013-2021 ($ billions, %) Table 3.19: Italian corrugated packaging demand 2013-2021 (million tonnes, %) Table 3.20: Italian corrugated packaging demand 2013-2021 ($ billions, %) Table 3.21: Polish corrugated packaging demand 2013-2021 (million tonnes, %) Table 3.22: Polish corrugated packaging demand 2013-2021 ($ billions, %) Table 3.23: Russian corrugated packaging demand 2013-2021 (million tonnes, %) Table 3.24: Russian corrugated packaging demand 2013-2021 ($ billions, %) Table 3.25: Turkish corrugated packaging demand 2013-2021 (million tonnes, %) Table 3.26: Turkish corrugated packaging demand 2013-2021 ($ billions, %) Table 3.27: UK corrugated packaging demand 2013-2021 (million tonnes, %) Table 3.28: UK corrugated packaging demand 2013-2021 ($ billions, %) Table 3.29: Saudi Arabian corrugated packaging demand 2013-2021 (million tonnes, %) Table 3.30: Saudi Arabian corrugated packaging demand 2013-2021 ($ billions, %) Table 3.31: South African corrugated packaging demand 2013-2021 (million tonnes, %) Table 3.32: South African corrugated packaging demand 2013-2021 ($ billions, %) Table 3.33: Canadian corrugated packaging demand 2013-2021 (million tonnes, %) Table 3.34: Canadian corrugated packaging demand 2013-2021 ($ billions, %) Table 3.35: Mexican corrugated packaging demand 2013-2021 (million tonnes, %) Table 3.36: Mexican corrugated packaging demand 2013-2021 ($ billions, %) Table 3.37: US corrugated packaging demand 2013-2021 (million tonnes, %) Table 3.38: US corrugated packaging demand 2013-2021 ($ billions, %) Table 3.39: Australian corrugated packaging demand 2013-2021 (million tonnes, %) Table 3.40: Australian corrugated packaging demand 2013-2021 ($ billions, %)
9
Table of contents
Tab
le o
f co
nte
nts
Table 4.1: Corrugated packaging demand by beverage sector 2013-2021 (tonnes, % change) Table 4.2: Corrugated packaging demand by beverage sector 2013-2021 ($ billions, % change) Table 4.3: Corrugated packaging demand by fresh food and produce sector 2013-2021 (tonnes, % change) Table 4.4: Corrugated packaging demand by fresh food and produce sector2013-2021 ($ billions, % change) Table 4.5: Corrugated packaging demand by processed food sector 2013-2021 (tonnes, % change) Table 4.6: Corrugated packaging demand by processed food sector 2013-2021 ($ billions, % change) Table 4.7: Corrugated packaging demand by automotive sector 2013-2021 (tonnes, % change) Table 4.8: Corrugated packaging demand by automotive sector 2013-2021 ($ billions, % change) Table 4.9: Corrugated packaging demand by consumer electronics sector 2013-2021 (tonnes, % change) Table 4.10: Corrugated packaging demand by consumer electronics sector 2013-2021 ($ billions, % change) Table 4.11: Corrugated packaging demand by foodservice disposables sector 2013-2021 (tonnes, % change) Table 4.12: Corrugated packaging demand by foodservice disposables sector 2013-2021 ($ billions, % change) Table 4.13: Corrugated packaging demand by furniture and timber products sector 2013-2021 (tonnes, % change) Table 4.14: Corrugated packaging demand by furniture and timber products sector 2013-2021 ($ billions, % change) Table 4.15: Corrugated packaging demand by glassware and ceramics sector 2013-2021 (tonnes, % change) Table 4.16: Corrugated packaging demand by glassware and ceramics sector 2013-2021 ($ billions, % change) Table 4.17: Corrugated packaging demand by healthcare sector 2013-2021 (tonnes, % change) Table 4.18: Corrugated packaging demand by healthcare sector 2013-2021 ($ billions, % change) Table 4.19: Corrugated packaging demand by homecare sector 2013-2021 (tonnes, % change) Table 4.20: Corrugated packaging demand by homecare sector 2013-2021 ($ billions, % change) Table 4.21: Corrugated packaging demand by industrial chemicals sector 2013-2021 (tonnes, % change) Table 4.22: Corrugated packaging demand by industrial chemicals sector 2013-2021 ($ billions, % change) Table 4.23: Corrugated packaging demand by personal care sector 2013-2021 (tonnes, % change) Table 4.24: Corrugated packaging demand by personal care sector 2013-2021 ($ billions, % change) Table 4.25: Corrugated packaging demand by sports and fitness sector 2013-2021 (tonnes, % change)
10
Table of contents
Tab
le o
f co
nte
nts
Table 4.26: Corrugated packaging demand by sports and fitness sector 2013-2021 ($ billions, % change) Table 4.27: Corrugated packaging demand by stationery sector 2013-2021 (tonnes, % change) Table 4.28: Corrugated packaging demand by stationery sector 2013-2021 ($ billions, % change) Table 4.29: Corrugated packaging demand by textile and footwear sector 2013-2021 (tonnes, % change) Table 4.30: Corrugated packaging demand by textile and footwear sector 2013-2021 ($ billions, % change) Table 4.31: Corrugated packaging demand by tobacco sector 2013-2021 (tonnes, % change) Table 4.32: Corrugated packaging demand by tobacco sector 2013-2021 ($ billions, % change) Table 4.33: Corrugated packaging demand by others sector 2013-2021 (tonnes, % change) Table 4.34 Corrugated packaging demand by others sector 2013-2021 ($ billions, % change) Table 5.1: Top ten exporters of corrugated packaging in the world 2011-2015 (tonnes) Table 5.2: Top ten importers of corrugated packaging in the world 2011-2015 (tonnes) Table 5.3: Top ten net exporters of corrugated packaging in the world 2011-2015 (tonnes) Table 5.4: Top ten net importers of corrugated packaging in the world 2011-2015 (tonnes) Table A.1: Net exports of corrugated packaging by 150 countries 2011-2015 (tonnes) Table A.2: Net exports of corrugated packaging by 150 countries 2011-2015 ($ millions) Table B.1: Real GDP growth in selected countries (% growth) Table B.2: Real per capita GDP growth in selected countries (% growth) Table B.3: Population growth in selected countries (% growth)
11
Table of contents
Tab
le o
f co
nte
nts
List of tables
Figure 1.1: Global corrugated packaging demand by region 2013- 2020 (million tonnes) Figure 1.2: Global corrugated packaging demand by region 2013- 2020 ($ billions) Figure 1. 3: Corrugated packaging demand segmentations by 3 food sectors (million tonnes) Figure 1. 4: Corrugated packaging demand segmentations by 14 non-food sectors (million tonnes) Figure 1. 5: Corrugated packaging demand segmentations by 3 food sectors ($ billions) Figure 1. 6: Corrugated packaging demand segmentations by 14 non-food sectors ($ billions) Figure 3.1: Chinese corrugated packaging demand 2013-2021 (million tonnes, %) Figure 3.2: Chinese corrugated packaging demand 2013-2021 ($ billions, %) Figure 3.3: Indian corrugated packaging demand 2013-2021 (million tonnes, %) Figure 3.4: Indian corrugated packaging demand 2013-2021 ($ billions, %) Figure 3.5: Indonesian corrugated packaging demand 2013-2021 (million tonnes, %) Figure 3.6: Indonesian corrugated packaging demand 2013-2021 ($ billions, %) Figure 3.7: Japanese corrugated packaging demand 2013-2021 (million tonnes, %) Figure 3.8: Japanese corrugated packaging demand 2013-2021 ($ billions, %) Figure 3.9: South Korean corrugated packaging demand 2013-2021 (million tonnes, %) Figure 3.10: South Korean corrugated packaging demand 2013-2021 ($ billions, %) Figure 3.11: Brazilian corrugated packaging demand 2013-2021 (million tonnes, %) Figure 3.12: Brazilian corrugated packaging demand 2013-2021 ($ billions, %) Figure 3.13: Argentinean corrugated packaging demand 2013-2021 (million tonnes, %) Figure 3.14: Argentinean corrugated packaging demand 2013-2021 ($ billions, %) Figure 3.15: French corrugated packaging demand 2013-2021 (million tonnes, %)
12
Table of contents
Tab
le o
f co
nte
nts
Figure 3.16: French corrugated packaging demand 2013-2021 ($ billions, %) Figure 3.17: German corrugated packaging demand 2013-2021 (million tonnes, %) Figure 3.18: German corrugated packaging demand 2013-2021 ($ billions, %) Figure 3.19: Italian corrugated packaging demand 2013-2021 (million tonnes, %) Figure 3.20: Italian corrugated packaging demand 2013-2021 ($ billions, %) Figure 3.21: Polish corrugated packaging demand 2013-2021 (million tonnes, %) Figure 3.22: Polish corrugated packaging demand 2013-2021 ($ billions, %) Figure 3.23: Russian corrugated packaging demand 2013-2021 (million tonnes, %) Figure 3.24: Russian corrugated packaging demand 2013-2021 ($ billions, %) Figure 3.25: Turkish corrugated packaging demand 2013-2021 (million tonnes, %) Figure 3.26: Turkish corrugated packaging demand 2013-2021 ($ billions, %) Figure 3.27: UK corrugated packaging demand 2013-2021 (million tonnes, %) Figure 3.28: UK corrugated packaging demand 2013-2021 ($ billions, %) Figure 3.29: Saudi Arabian corrugated packaging demand 2013-2021 (million tonnes, %) Figure 3.30: Saudi Arabian corrugated packaging demand 2013-2021 ($ billions, %) Figure 3.31: South African corrugated packaging demand 2013-2021 (million tonnes, %) Figure 3.32: South African corrugated packaging demand 2013-2021 ($ billions, %) Figure 3.33: Canadian corrugated packaging demand 2013-2021 (million tonnes, %) Figure 3.34: Canadian corrugated packaging demand 2013-2021 ($ billions, %) Figure 3.35: Mexican corrugated packaging demand 2013-2021 (million tonnes, %) Figure 3.36: Mexican corrugated packaging demand 2013-2021 ($ billions, %) Figure 3.37: US corrugated packaging demand 2013-2021 (million tonnes, %) Figure 3.38: US corrugated packaging demand 2013-2021 ($ billions, %) Figure 3.39: Australian corrugated packaging demand 2013-2021 (million tonnes, %) Figure 3.40: Australian corrugated packaging demand 2013-2021 ($ billions, %)

13
Table of contents
Tab
le o
f co
nte
nts
Figure 4.1: Corrugated packaging demand by beverage sector 2013-2021 (tonnes, % change) Figure 4.2: Corrugated packaging demand by beverage sector 2013-2021 ($ billions, % change) Figure 4.3: Corrugated packaging demand by fresh food and produce sector 2013-2021 (tonnes, % change) Figure 4.4: Corrugated packaging demand by fresh food and produce sector2013-2021 ($ billions, % change) Figure 4.5: Corrugated packaging demand by processed food sector 2013-2021 (tonnes, % change) Figure 4.6: Corrugated packaging demand by processed food sector 2013-2021 ($ billions, % change) Figure 4.7: Corrugated packaging demand by automotive sector 2013-2021 (tonnes, % change) Figure 4.8: Corrugated packaging demand by automotive sector 2013-2021 ($ billions, % change) Figure 4.9: Corrugated packaging demand by consumer electronics sector 2013-2021 (tonnes, % change) Figure 4.10: Corrugated packaging demand by consumer electronics sector 2013-2021 ($ billions, % change) Figure 4.11: Corrugated packaging demand by foodservice disposables sector 2013-2021 (tonnes, % change) Figure 4.12: Corrugated packaging demand by foodservice disposables sector 2013-2021 ($ billions, % change) Figure 4.13: Corrugated packaging demand by furniture and timber products sector 2013-2021 (tonnes, % change) Figure 4.14: Corrugated packaging demand by furniture and timber products sector 2013-2021 ($ billions, % change) Figure 4.15: Corrugated packaging demand by glassware and ceramics sector 2013-2021 (tonnes, % change) Figure 4.16: Corrugated packaging demand by glassware and ceramics sector 2013-2021 ($ billions, % change) Figure 4.17: Corrugated packaging demand by healthcare sector 2013-2021 (tonnes, % change) Figure 4.18: Corrugated packaging demand by healthcare sector 2013-2021 ($ billions, % change) Figure 4.19: Corrugated packaging demand by homecare sector 2013-2021 (tonnes, % change) Figure 4.20: Corrugated packaging demand by homecare sector 2013-2021 ($ billions, % change) Figure 4.21: Corrugated packaging demand by industrial chemicals sector 2013-2021 (tonnes, % change) Figure 4.22: Corrugated packaging demand by industrial chemicals sector 2013-2021 ($ billions, % change) Figure 4.23: Corrugated packaging demand by personal care sector 2013-2021 (tonnes, % change) Figure 4.24: Corrugated packaging demand by personal care sector 2013-2021 ($ billions, % change) Figure 4.25: Corrugated packaging demand by sports and fitness sector 2013-2021 (tonnes, % change)
14
Table of contents
Tab
le o
f co
nte
nts
Figure 4.26: Corrugated packaging demand by sports and fitness sector 2013-2021 ($ billions, % change) Figure 4.27: Corrugated packaging demand by stationery sector 2013-2021 (tonnes, % change) Figure 4.28: Corrugated packaging demand by stationery sector 2013-2021 ($ billions, % change) Figure 4.29: Corrugated packaging demand by textile and footwear sector 2013-2021 (tonnes, % change) Figure 4.30: Corrugated packaging demand by textile and footwear sector 2013-2021 ($ billions, % change) Figure 4.31: Corrugated packaging demand by tobacco sector 2013-2021 (tonnes, % change) Figure 4.32: Corrugated packaging demand by tobacco sector 2013-2021 ($ billions, % change) Figure 4.33: Corrugated packaging demand by others sector 2013-2021 (tonnes, % change) Figure 4.34 Corrugated packaging demand by others sector 2013-2021 ($ billions, % change) Figure 5.1: Top ten exporters of corrugated packaging in the world 2011-2015 ('000 tonnes) Figure 5.2: Top ten importers of corrugated packaging in the world 2011-2015 ('000 tonnes) Figure 5.3: Top ten net exporters of corrugated packaging in the world 2011-2015 ('000 tonnes) Figure 5.4: Top ten net importers of corrugated packaging in the world 2011-2015 ('000 tonnes) Figure 5.5: Corrugated packaging imports and exports in the EU28 2011-2015 (‘000 tonnes) Figure 5.6: Corrugated packaging imports within and outside the EU28 2011-2015 (‘000 tonnes) Figure 5.7: Corrugated packaging exports within and outside the EU28 2011-2015 (‘000 tonnes) Figure 5.8: % share of top 5 importers of corrugated packaging in the EU28 2011-2015 (%) Figure 5.9: % share of top 5 exporters of corrugated packaging in the EU28 2011-2015 (%)
15
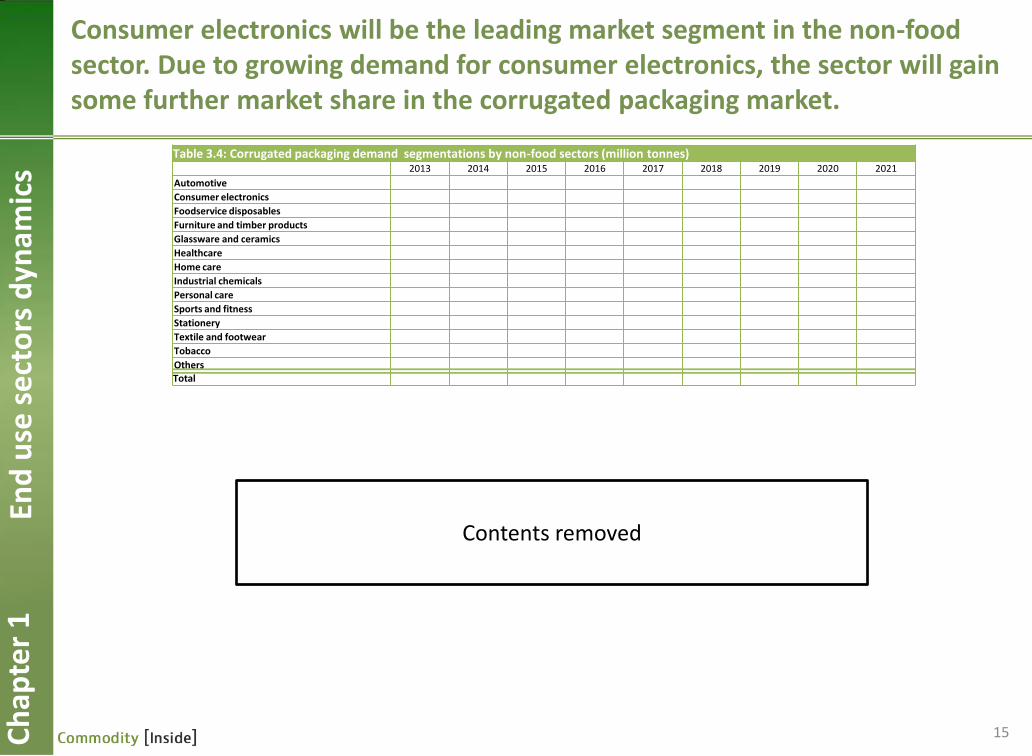
Consumer electronics will be the leading market segment in the non-food sector. Due to growing demand for consumer electronics, the sector will gain some further market share in the corrugated packaging market.
Ch
apte
r 1
En
d u
se s
ect
ors
dyn
amic
s
Table 3.4: Corrugated packaging demand segmentations by non-food sectors (million tonnes) 2013 2014 2015 2016 2017 2018 2019 2020 2021
Automotive
Consumer electronics
Foodservice disposables
Furniture and timber products
Glassware and ceramics
Healthcare
Home care
Industrial chemicals
Personal care
Sports and fitness
Stationery
Textile and footwear
Tobacco
Others
Total
Contents removed
16
Introduction- assumptions
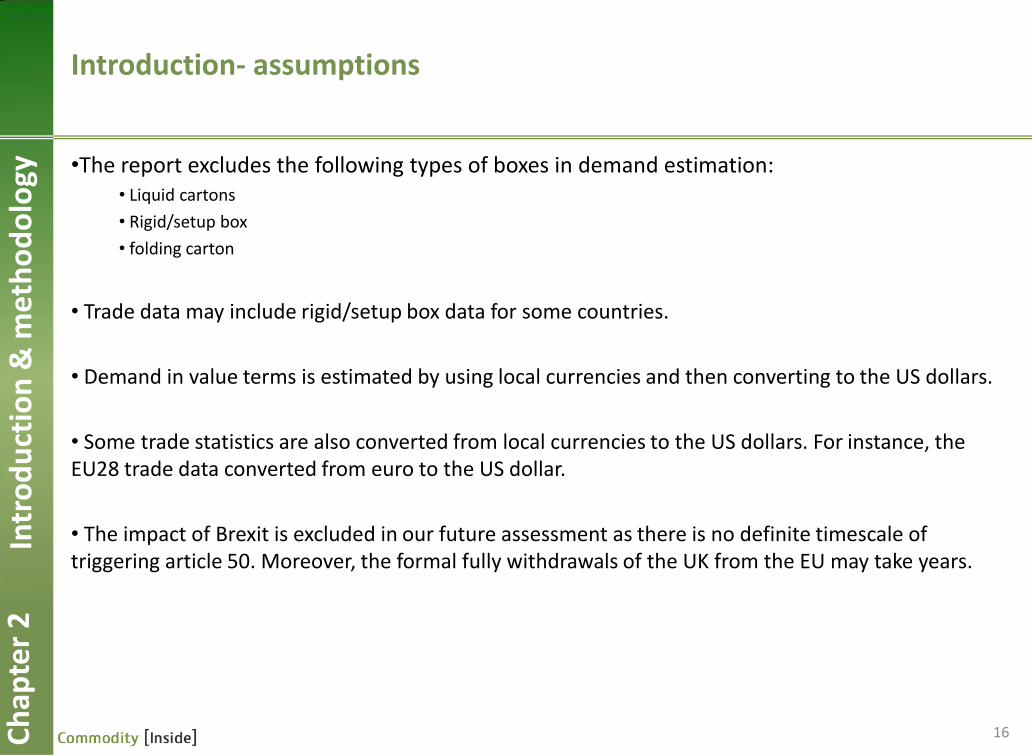
•The report excludes the following types of boxes in demand estimation: • Liquid cartons
• Rigid/setup box
• folding carton
• Trade data may include rigid/setup box data for some countries.
• Demand in value terms is estimated by using local currencies and then converting to the US dollars.
• Some trade statistics are also converted from local currencies to the US dollars. For instance, the EU28 trade data converted from euro to the US dollar.
• The impact of Brexit is excluded in our future assessment as there is no definite timescale of triggering article 50. Moreover, the formal fully withdrawals of the UK from the EU may take years.
Intr
od
uct
ion
& m
eth
od
olo
gy
Ch
apte
r 2
17
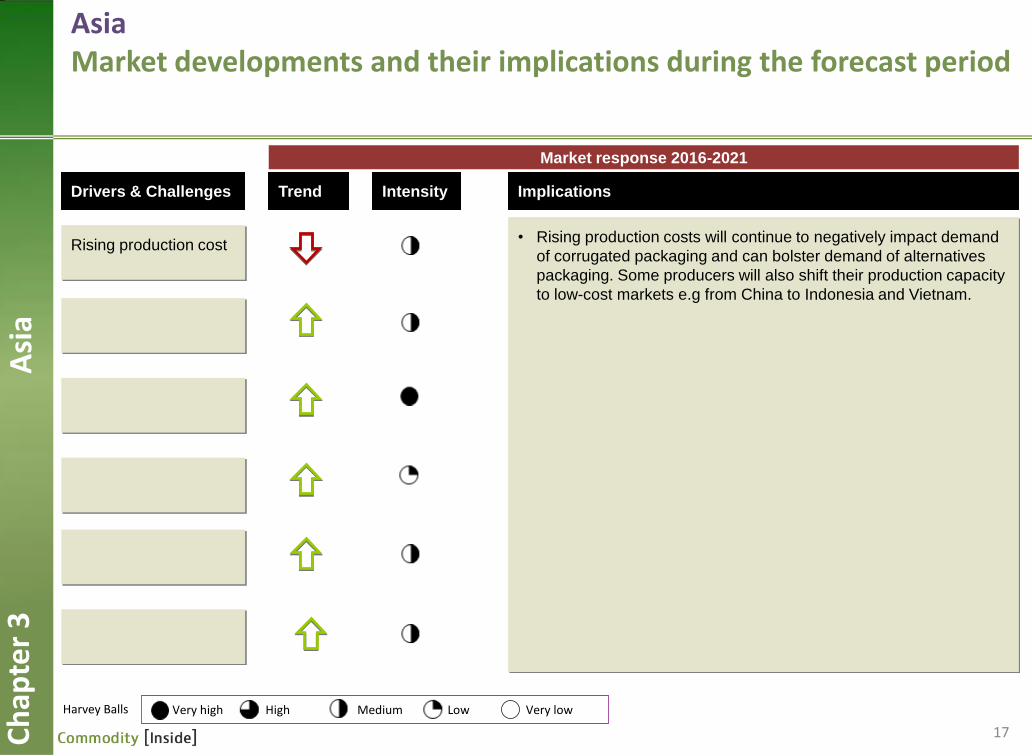
Asia Market developments and their implications during the forecast period
Ch
apte
r 3
Rising production cost • Rising production costs will continue to negatively impact demand
of corrugated packaging and can bolster demand of alternatives
packaging. Some producers will also shift their production capacity
to low-cost markets e.g from China to Indonesia and Vietnam.
Harvey Balls Very high Medium Low Very low High
Asi
a
Drivers & Challenges Intensity Implications Trend
Market response 2016-2021
18
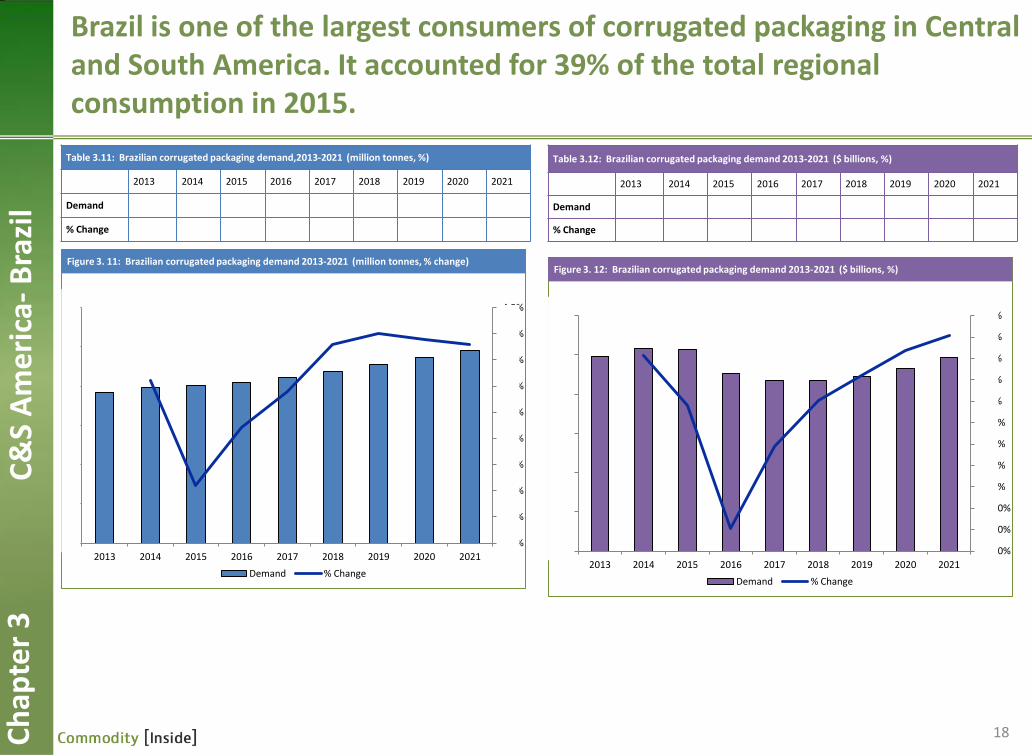
Brazil is one of the largest consumers of corrugated packaging in Central and South America. It accounted for 39% of the total regional consumption in 2015.
Ch
apte
r 3
Table 3.11: Brazilian corrugated packaging demand,2013-2021 (million tonnes, %)
2013 2014 2015 2016 2017 2018 2019 2020 2021
Demand
% Change
0.0%
0.5%
1.0%
1.5%
2.0%
2.5%
3.0%
3.5%
4.0%
4.5%
0
1
2
3
4
5
6
2013 2014 2015 2016 2017 2018 2019 2020 2021
Demand % Change
Figure 3. 11: Brazilian corrugated packaging demand 2013-2021 (million tonnes, % change)
Table 3.12: Brazilian corrugated packaging demand 2013-2021 ($ billions, %)
2013 2014 2015 2016 2017 2018 2019 2020 2021
Demand
% Change
-14.0%
-12.0%
-10.0%
-8.0%
-6.0%
-4.0%
-2.0%
0.0%
2.0%
4.0%
6.0%
8.0%
-
1.0
2.0
3.0
4.0
5.0
6.0
2013 2014 2015 2016 2017 2018 2019 2020 2021
Demand % Change
Figure 3. 12: Brazilian corrugated packaging demand 2013-2021 ($ billions, %)
C&
S A
me
rica
- B
razi
l
19
Die-cut and complex packaging will provide extra growth to corrugated paper packaging demand in Brazil.
• It is the export market which is quite lucrative. Given the current political and economic conditions, the Brazilin real is expected to weaken further which can underpin demand for finished goods to neighbouring countries. The weak currency will also attract foreign investors for acquisitions in the corrugated packaging market.
C&
S A
me
rica
- B
razi
l C
hap
ter
3
Contents removed
20
Sports and fitness market is expected to grow significantly over the forecast period particularly in the developed countries, and with a renewed growth in emerging markets.
Ch
apte
r 4
N
on
-Fo
od
- Sp
ort
s an
d f
itn
ess
• Sports and fitness market is expected to show some strengths in developed markets where people are getting increasingly conscious about their health and wellbeing. Governments and corporate initiatives have also underpinned demand in the market. Online retailing has also boosted demand for fitness equipment as people can see different features and reviews without physically going to see the equipment. Buyers have now the ability to buy through various online platforms such as Amazon and eBay which prove cheaper than buying from a high street shop (or at least its online store).
Contents removed
International Paper (IP) is the world largest producer of containerboard and corrugated packaging.
•
• We expect that falling paper demand will pose a threat to the profitability of IP's corrugated packaging business. Some of the idled paper capacity is likely to be used for making linerboard, which consequently can pressurise corrugated packaging prices and diminish profit margins for IP.
21
Lead
ing
com
pan
ies
Ch
apte
r 9
Contents removed
For further information about this report and additional research, please visit
www.commodityinside.com
or contact us at
www.commodityinside.com