Embed Size (px)
Citation preview
Topics
Ocean Transport
Supply Chain Management

Ocean Transport

State of the Industry
• Too many ships
• Slow growth of global trade
with recession
• Losses (especially Asia-
Europe)

The Times – They Are A Changing
Global Trade / Global Logistics

Top 10 Container Carriers
1996
1. APM-Maersk
2. Evergreen
3. P&O Nedlloyd
4. Sea-Land
5. COSCO
6. Hanjin
7. MSC
8. NYK
9. Mitsui
10. Hyundai
2010
1. APM-Maersk
2. MSC
3. CMA-CGM
4. APL
5. Evergreen
6. Hapag-Lloyd
7. COSCO
8. CSAV
9. CSCL
10. Hanjin
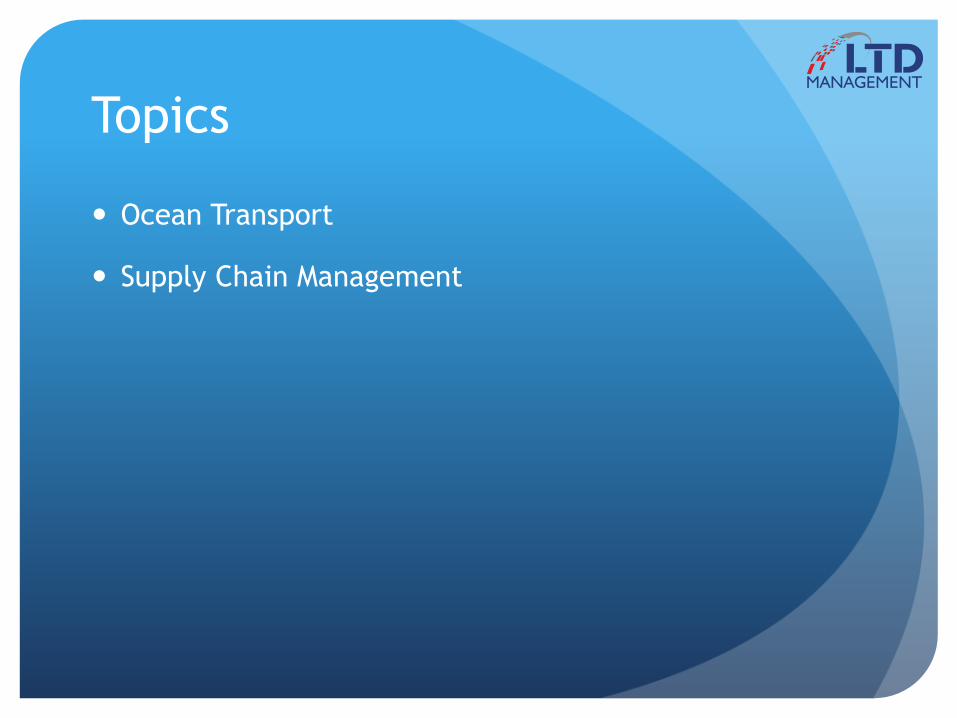
Top 10 Container Ports
1980
1. New York/New Jersey
2. Rotterdam
3. Hong Kong
4. Kaohsiung
5. Singapore
6. Hamburg
7. Oakland
8. Seattle
9. Kobe
10. Antwerp
2011
1. Shanghai
2. Singapore
3. Hong Kong
4. Shenzhen
5. Busan
6. Ningbo
7. Guangzhou
8. Qingdao
9. Dubai
10. Rotterdam

Top 10 North American Ports
2000
1. Long Beach
2. Los Angeles
3. New York/New Jersey
4. Charleston
5. Oakland
6. Seattle
7. Norfolk
8. Houston
9. Savannah
10. Tacoma
2011
1. Los Angeles
2. Long Beach
3. New York/New Jersey
4. Savannah
5. Vancouver
6. Oakland
7. Seattle
8. Virginia
9. Houston
10. Manzanillo

Ocean Transport
Mega Ships

Mega Ships
Mega Ship Aircraft Carrier

Issues They Face• Megas (Triple E) – 18,000+ TEU (vs.
1,000 TEU in 1970’s)
• Lower Operating Costs
• How Will Ships be Filled?
• Which Ports Will Handle Them?
• How Will Ports Handle Them?
• What’s the Investment?
• Bottlenecks!

The P3 Network and More

The P3 Network• Maersk, MSC, CMA-CGM – The 3 Largest
Carriers
• Formed an operating alliance
• FMC, EU, & China reviewed
• Three Issues –
• Market Share
• Big Ships
• Hubs/Ports Used

P3 Market Share• 44% Asia-to-Europe
• 24% in the Trans-Pacific
• 42% in the Trans-Atlantic
Trade

P3 Vessel Size
• Average vessel for Asia-
Europe – increasing from
9,300 TEU to 14,200 by end
of 2015
• Maersk’s Largest Vessels –
surpass MSC and CMA CGM
when all Megas delivered
• Creates a Domino Effect

The G6 Alliance

The G6 Alliance• From New World & Grand Alliances
APL (#4)
Hapag-Lloyd (#6)
NYK
OOCL
Hyundai
Mitsui

COSCO (#7)
Hanjin (#10)
K Line
Yang Ming
Evergreen (#5) – May Join
The CKYH Alliance

Canals
Panama Canal – 2015 or 2016 Expansion
Updates on East Coast ports with bigger ships &
widening
$1.6 Billion Overrun
Construction was slowed during dispute
Suez Canal - Congestion
Pending Chaos!?
Issues
• Supply (of ships/container
space) exceeds demand
• Pricing/Rates – flat and
somewhat low
• Will “Money People” sit still?
• Last time – carriers laid up
significant tonnage
“coincidentally” at same time

Singapore 2009

Shake Out Ahead?
Financial
Much red ink for last 5 years
Hanjin – operating loss $225 Million / net loss
$631 Million for 2013
M&A
CSAV / Hapag-Lloyd (could this new carrier join
the P3?)

The Next Few Years
As big ships are spread around globally
More rate volatility in more trade lanes
Schedule/Service Vagaries
Dropped weekly sailings
Fewer Carriers

Ocean Carriers &
Global Supply Chain Erosion
What Carriers Are Doing
Fewer carriers in business
Alliances, slot exchanges, and vessel sharing –
created and changed
Shipping Routes – added and revised
Sailing Schedules – made and reworked
“Slow Steaming” – ongoing practice

What It All Means
Irregular Performance
Lack of service reliability
Potential changes as to ports to handle ships

Which Means
Increased uncertainty for planning
Undermine inventory yield maximization
More inventories and more capital tied up

Impact
TOTAL GLOBAL INVENTORIES
REQUIRED INVENTORY TO
MEET REQUIRED TO MEET SALES
SAFETY STOCK
ADDITIONAL BUFFER TO
COMPENSATE FOR
UNRELIABILTY

By The Way…• How does all this factor into
your importing and carrier
selection (even if you use a
NVO)?
• Do you form an IGA shippers
association to leverage buying
power for import freight?
• Have you considered how
much is big and big – big
carriers and big shippers?

Questions???

Supply Chain Management

Is This Your Supply Chain?
What do you know about your SC Performance?
Are you doing much “fire-fighting” (reactive vs.
proactive)?
Do you have little/no metrics, beyond complaints,
charge backs or costs?
Yours?
Do you have a monolithic supply chain operation?
Little/no service differentiation beyond customer
order requirements?
Is it defined by costs, tasks, and/or functions?

Is This Your Supply Chain?

Perfect Order
Delivered / Complete / Accurate / On-Time
How well do you do with customer orders?
How well do your suppliers do with your PO’s?

Benefits of Real SCM
Customer Advantage –
IT’S ABOUT THE CUSTOMER!!!
Competitive differentiation
Translates into better revenue and margins

Are You Happy
with the Supply
Chain That YOU
Built?
How Do You View Global Logistics?

SCM - Hot Topics
Time Compression
Omni-Channel / Multi-Channel
Segmentation
Risk Mitigation

Cycle Time Compression

Cycle Time
Cycle Time – time from recognition of need (before PO
is issued) until product delivered to you – and sold,
and paid by customer (funds availability affects
procurement)
Not just length, includes variance
Time – important for business

Cycle Time
Inventory-factor of uncertainty (buffer) – longer
than cycle time, more the uncertainty, more the
inventory
Key factor for responsiveness and agility
In Lean, extra time is waste

Cycle Time Compression
Identify and assess each sub-cycle
Look for gaps, redundancies, and meaningless
items
External and internal (especially)
Streamline practices and operations

SC Omni-Channel / Multi-Channel

What It Is
Selling through multiple channels
For B2C and B2B
Sell 24/7 from anywhere in the world
From any device (e-commerce and m-commerce)

Omni-Channel Examples
Think Amazon and more
Home Depot
Building 3 e-commerce fulfillment centers
100,000 products (vs. 35,000 for stores)

SCM Omni-Channel Issues
Speed and accuracy of order shipment
How to position inventory
Where to position inventory
What inventory to position
Technology – integrated visibility for inventory and
orders in all channels

Multi/Omni-ChannelDirect shipping of gloves “from/for” other party’s ecommerce site
• E-tailer does not have to hold inventory
• Can your suppliers ship to customers elsewhere in the world for you?
Supply Chain Segmentation

What Segmentation Is
Superior best practice
Dividing business into discrete groups (not
based on business units) based on similar
characteristics
Address important company issues
Serve strategic purpose
Key Issues for
Segmenting
• Differing markets
• Product portfolios
• Customer portfolios
• Inventory yields
• Omni-Channel sales

More Issues for
Segmenting
• Global operations
• Channel partners
• Customer attrition
• Suppliers
• Supply chain risk

Why Segment???
Stop one-size-fits-all “service” approach
Reduce internal and external noise that
crates chaos and diverts resources
Design and align operations for different
sectors
Build competitive differentiation

How To Segment
1. Identify segments
2. Profile sectors – and customers in them
3. Determine how customers in each
segment differ for SC services
4. Evaluate supply chain services, including
ones not met, and performance for each
segment
Segment Approaches
Cost – good concept – allocating and
assigning costs - no direct costs
Value – economic – not good to identify
segment characteristics
Need – drivers that segments have for
specific service(s)

What To Do With Results
1. Prioritize segments
2. Be specific
3. Evaluate the quality of service
4. Implement services for each segment
5. Develop metrics for each segment’s
service and measure
• Have Actionable Info

ExampleOrder Size and Annual Volume
Small Orders Direct to Store
Delivery
Large Orders with Demanding
Delivery
Small Orders and No Real Volume
Medium Size Orders with
Special Preparation for Select Products
Order Requirements

Large Order Segment
3rd Cut2nd Cut1st Cut
Large Orders
Rapid Order Preparation &
Delivery
Same Day Delivery
Nationwide
To Warehouses Prepared for Cross Docking
Regular Delivery
Export

Special Preparation Segment
3rd Cut2nd Cut1st Cut
Mid-Size Orders
Time for Picking Two
Products and Making New
SKU
To Warehouses
To Stores to Support Ads
Standard Orders To Warehouses

Direct to Store Segment
3rd Cut2nd Cut1st Cut
Small Orders
Picking and Special
Packaging
Product Placement in
DCs
Outside Packager

Redesigned Supply Chain
Special Handling---Make New
SKUs & Small Orders
New Approach for Positioning Inventory --Location and
In DCs
Geography/ Location--For Demanding Delivery &
Store Direct

Supply Chain Risk Mitigation

What Risk Is
About business opportunity
Concept traction - Fukushima
Insurance focus - assets
Plus contingency planning

Supply Chain Risk
Complexity
Geographic Scope
Offshoring/sourcing
Outsourcing
Low inventory
Lean manufacturing
JIT manufacturing

Supply Chain Risk
Deloitte Global Survey
45% say SC risk program only somewhat
effective or not effective
53% say SC disruptions have become more
costly
48% say frequency of risk disruptions with
negative outcomes have increased

More From Deloitte
Technology, industrial products, diversified
manufacturing most likely to say SC
disruptions have become more costly
Most costly outcome – margin erosion
71% say SC risk is important in strategic
decision-making

More
Top challenges to risk management (RM)
Lack of cross-functional collaboration (32%)
Cost of implementing RM strategies (26%)
SC RM is organized around silos (75%)
Leads to lack of visibility and collaboration
Makes difficult to assess and manage risk on
holistic basis

Threat Sources
• Natural disasters
• Geopolitical
• Pandemics
• Technological
• Terrorists
• Commodity prices

Sources• Labor costs
• Currency
• Ports
• Markets
• Suppliers
• Execution
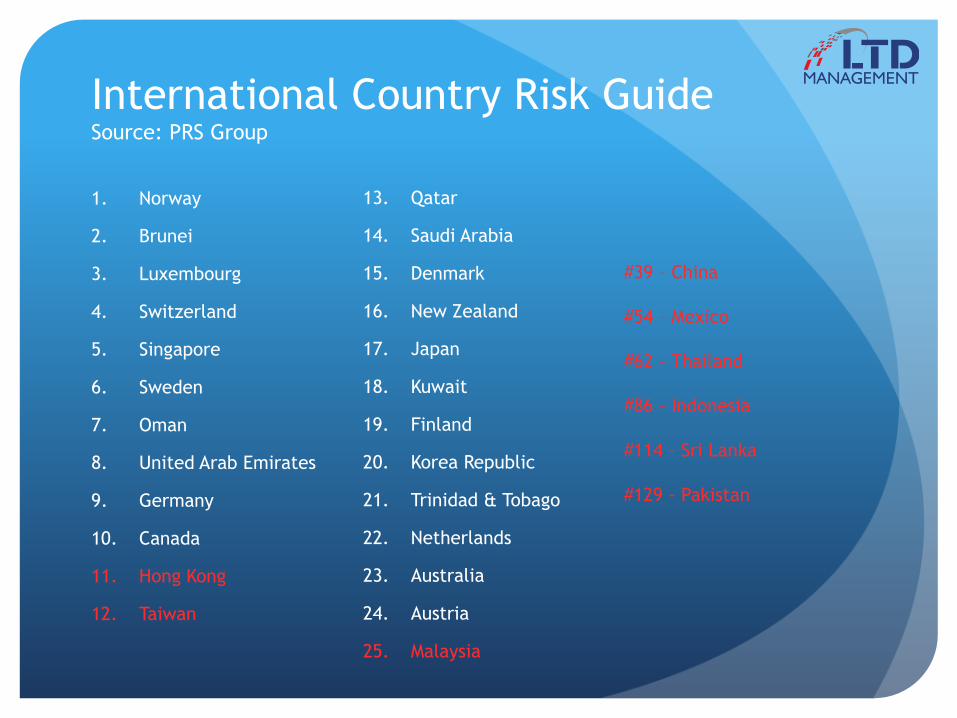
International Country Risk GuideSource: PRS Group
1. Norway
2. Brunei
3. Luxembourg
4. Switzerland
5. Singapore
6. Sweden
7. Oman
8. United Arab Emirates
9. Germany
10. Canada
11. Hong Kong
12. Taiwan
#39 – China
#54 – Mexico
#62 - Thailand
#86 – Indonesia
#114 – Sri Lanka
#129 - Pakistan
13. Qatar
14. Saudi Arabia
15. Denmark
16. New Zealand
17. Japan
18. Kuwait
19. Finland
20. Korea Republic
21. Trinidad & Tobago
22. Netherlands
23. Australia
24. Austria
25. Malaysia

SuppliersTier 1 Suppliers and More
Risk
Measure risk
Financial impact
Time to recover
Identification and mitigation – not just for MNC’s
Cannot mitigate what you do not identify
For IGA?

Where Will Your
Supply Chain
Take You?