Embed Size (px)
Citation preview

GLOBAL PACKAGING:
SIZING DEMAND AND OPPORTUNITIES FOR PET BOTTLES
ROSEMARIE DOWNEY
GLOBAL HEAD OF PACKAGING RESEARCH

© Euromonitor International
2
• Global provider of Strategic Market Intelligence
• 12 Regional offices - 800+ analysts in 80 countries
• Cross-country comparable data and analysis
• Consumer focused industries, countries and
consumers
• 5 - 10 year forecasts with matching trend analysis
• All retail channels covered
• Subscription services, reports and consulting
About Euromonitor International
EUROMONITOR INTERNATIONAL London
Singapore
Shanghai
Dubai
Vilnius
Cape Town
Santiago
Tokyo
Sydney
Chicago
Bangalore
Sao Paulo

PASSPORT PACKAGING
GLOBAL MARKETPLACE FOR PET
2015 VIEW ON OPPORTUNITIES FOR PET

© Euromonitor International
4
Vietnam
Saudi Arabia
Colombia
Packaging Coverage
EUROMONITOR INTERNATIONAL
7 Industries 54 countries
Alcoholic Drinks
Beauty & Personal Care
Dog & Cat Food
Food
Home Care
Hot Drinks
Soft Drinks
3 new researched countries:
Pack sizes
26 closure types
7 multipack types
Returnables
40 pack types
… with detail on

© Euromonitor International
5 EUROMONITOR INTERNATIONAL
Metal Beverage Can Can be drunk from directly
PET Bottle Brick Liquid Carton Square shape
Flexible Aluminium /Plastic
Common in ground coffee
Flexible plastic Tea carton overwrap
and coffee pods
Folding Cartons Common in tea
HDPE Bottle Cloudy look
Aluminium/Plastic Pouches
Mainly for children juice drinks
Thin Wall Containers Especially in Asia
40 Pack Types and the Most Popular for Non-alcoholic Drinks are…
Glass Bottle

© Euromonitor International
6
Key Closure Types for Drinks
EUROMONITOR INTERNATIONAL
-3
0
3
6
9
1
5
25
125
625
PlasticScrew
Closures
Metal Crowns
MetalScrew
Closures
LiquidCarton
Closures
Corks Peel-OffLidding*
BeveragePush-Pull
BeverageFlip-Top
Metal LugClosures
Zip/PressClosures
% C
AG
R (
20
15-2
02
0)
Vo
lum
e in
bil
lio
n u
nit
s
Core Closure Types for Global Retail Beverages (2015-2020)
2015 Volume % CAGR 2015-2020
* Peel-Off Lidding includes Peel-Off Foil, Peel-Off Plastic and Peel-Off Paper

PASSPORT PACKAGING
GLOBAL MARKETPLACE FOR PET
2015 VIEW ON OPPORTUNITIES FOR PET

© Euromonitor International
8
0
1
2
3
4
0
500
1,000
1,500
2,000
Food Drinks Tobacco Beauty &Personal
Care
Tissue &Hygiene
HomeCare
Dog & CatFood
% C
AG
R
Bil
lio
n U
nit
s
Billion Units 2015 % CAGR 2015-2019
Global Retail Packaging by Industry in 2015 and Growth to 2019
Food and Drink: Core to Global Packaging Demand and Growing
8% Food 4.3 units of retail packaging sold in 2015
73% of packaging in food
and drinks alone
37% share of drinks
held by PET
Tr
illi
on
GLOBAL MARKETPLACE FOR PET

© Euromonitor International
9
Clear Importance of Plastics Packaging in Food and Drink
0 200 400 600 800 1000 1200
Flexible Aluminium/Plastic
Metal Food Cans
HDPE Bottles
Flexible Paper
Folding Cartons
Liquid Cartons
Thin Wall Plastic Containers
Metal Beverage Cans
Glass Bottles
PET Bottles
Flexible Plastic
Billion Units
Global Leading Pack Types for Food and Drink in 2015 and Growth 2015-2019
2015 Billion Units
2015-2019 unit volume growth
4.2% CAGR to 2019
4% CAGR to 2019
3.2% CAGR to 2019
3.1% CAGR to 2019
+80 bn
0.8% CAGR to 2019
2.2% CAGR to 2019
GLOBAL MARKETPLACE FOR PET

© Euromonitor International
10
0%
1%
2%
3%
4%
5%
6%
7%
8%
9%
10%
40%
45%
50%
55%
60%
2004 2005 2006 2007 2008 2009 2010 2011 2012 2013 2014
% a
nn
ua
l g
row
th
% P
ET
Bo
ttle
in
So
ft D
rin
ks
PET Bottles vs. Total Packaging Growth in Soft Drinks
PET % Total Packaging Growth % PET Bottle Growth
Global Evolution and Impact of PET in Soft Drinks Remains Strong
GLOBAL MARKETPLACE FOR PET
#1 55% of all soft
drinks sold in 2014 through retail were
in PET bottles
4.3% growth for PET bottles in 2015
175 growth for PET
bottles since 2004
Bil
lio
n

© Euromonitor International
11
Emerging Markets are Recipients of 56% of PET Demand
GLOBAL MARKETPLACE FOR PET
0
2
4
6
8
10
12
14
0
50
100
150
200
250
300
2004 2005 2006 2007 2008 2009 2010 2011 2012 2013 2014
% G
row
th
Bil
lio
n u
nit
s
Global Demand for PET Bottles in Developed vs. Emerging Markets: 2004-2014
Developed Emerging % Growth Developed % Growth Emerging
43%

© Euromonitor International
12
-5 5 15 25 35 45
Russia
Thailand
Japan
Mexico
Vietnam
Brazil
Indonesia
India
USA
China
2015-2019 billion units growth
Top 10 Countries for PET Bottle Volume Growth 2015-2019, % CAGR
+ 39 billion units
Where to Go for Best PET Volume Growth
% CAGR 2015-19
+ 39 billion units
11%
6%
2%
7%
Billion Units
GLOBAL MARKETPLACE FOR PET

PASSPORT PACKAGING
GLOBAL MARKETPLACE FOR PET
2015 VIEW ON OPPORTUNITIES FOR PET

© Euromonitor International
14
2015 Key Drivers Shaping PET Performance and Potential
2015 VIEW ON OPPORTUNITIES FOR PET
Emerging Markets for Biggest Volume Gains
Polarisation in Pack Sizing: Rightsizing
Premium and Value-add Opportunities
Consumer Health and Wellness Preferences
Innovation to Support Brand Presence

© Euromonitor International
15
PET Position in Key Categories Shows Ample Opportunity for Growth
2015 VIEW ON OPPORTUNITIES FOR PET
-1
0
1
2
3
4
5
6
-50
0
50
100
150
200
250
300
% C
AG
R 2
015
-20
19
Bil
lio
n u
nit
s
PET Bottle Penetration in Key Categories 2015 and Prospects 2015-2019
Billion units 2015 2015 Other Pack Types % CAGR 2015-2019
PET strength in bottled water versus other pack types and good
for onward growth
PET holds opportunities in Tea, Oils and Dairy
© Euromonitor International
16
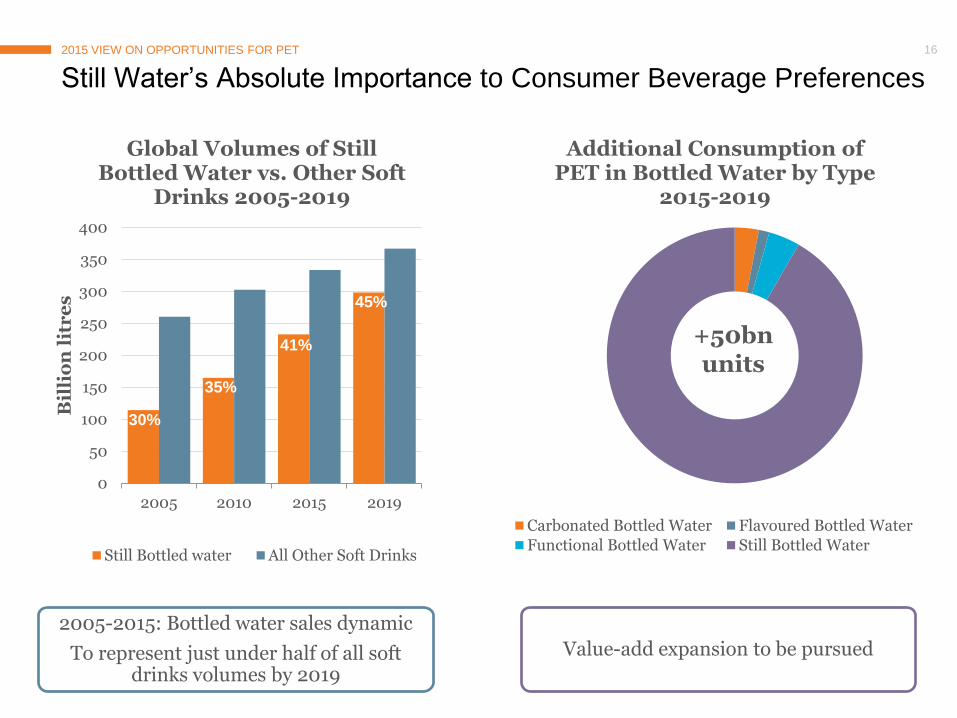
2005-2015: Bottled water sales dynamic
To represent just under half of all soft drinks volumes by 2019
0
50
100
150
200
250
300
350
400
2005 2010 2015 2019
Bil
lio
n l
itr
es
Global Volumes of Still Bottled Water vs. Other Soft
Drinks 2005-2019
Still Bottled water All Other Soft Drinks
Still Water’s Absolute Importance to Consumer Beverage Preferences
2015 VIEW ON OPPORTUNITIES FOR PET
Value-add expansion to be pursued
Additional Consumption of PET in Bottled Water by Type
2015-2019
Carbonated Bottled Water Flavoured Bottled Water
Functional Bottled Water Still Bottled Water
+50bn units
30%
45%
35%
41%

© Euromonitor International
17
Canada: Fastest growth country for sparkling water 2014-15 – 1 litre
Australia: Mount Franklin re-design, Summer 2015
US: Bullet design caffeinated water – 500ml
China: Heritage of source and design from Nongfu Spring
Desire for Added Benefits via Carbonation, Quality and Weight
Spain: Showing recovery – 1.2 litre
2015 VIEW ON OPPORTUNITIES FOR PET

© Euromonitor International
18
Healthy Option for on The Go…
…and Family Value Too
0
2
4
6
8
10
12
0
1
2
3
4
5
6
% g
ro
wth
20
14-1
5
Ad
dit
ion
al
co
ns
um
pti
on
(b
illi
on
un
its
)
Global Bottled Water: PET Pack Size Performance
2014-2015
PET bottle growth, billion units % growth 2014-15
Polarisation in Pack Sizing Increasingly Apparent in Still Water
2015 VIEW ON OPPORTUNITIES FOR PET

© Euromonitor International
19
-2
0
2
4
6
8
10
-100
0
100
200
300
400
500
600
% g
ro
wth
20
14-2
015
Mil
lio
n u
nit
s g
ro
wth
Global Carbonates: PET Pack Size Performance
2014-2015
2014-15 PET bottle growth (mn units) % growth 2014-15
Reduce Sweetness and Size
In Carbonates, Control over Sugar Intake Sees Shift to Smaller Sizes
2015 VIEW ON OPPORTUNITIES FOR PET
Variation in Smaller Sizes
1. Fits lifestyle 2. Affordable 3. Procures value and volume gains
Canada
591ml->500ml
China
300ml
Various
500ml

© Euromonitor International
20
0
20
40
60
80
100
120
Glass Bottles Metal Beverage Cans PET Bottles
Carbonates Packaging by Core Pack Type 2010-2019
Bil
lio
n U
nit
s
Flavour and Feel Factors, Room for Big Value for Money Lines Too
2015 VIEW ON OPPORTUNITIES FOR PET
Natural Flavour
Visual Impact
Value for Money

© Euromonitor International
21
PET Bottle Growth in Ready-to-Drink Tea by Region
Asia Pacific Latin America North America
Eastern Europe Western Europe Australasia
Middle East/Africa
Innovation in Natural Tea Flavours Hits Premium Health Note
2015 VIEW ON OPPORTUNITIES FOR PET
+ 8 billion bottles
2015-2019
Gerolsteiner
Germany
750ml
April 2015
Pepsi-Lipton Tea Netherlands
500ml
April 2015

© Euromonitor International
22
0
2
4
6
8
10
12
14
16
18
Oils andFats
DrinkingMilk
Products
TableSauces
Yoghurt
Bil
lio
n U
nit
s
Leading Growth Categories for PET in Foods
2010 2015 2019
PET Advances its Position in Edible Oils and Dairy
2015 VIEW ON OPPORTUNITIES FOR PET
31% of 2015 sales of milk in
Asia Pacific
3.3% global growth for PET
bottles in Dairy 2015-19
38% of 2015 PET bottle
demand in Food is for Milk

© Euromonitor International
23
Asia Speciality Drink
Bottled Water (Still, Carbonated, Flavoured, Functional)
Carbonates (Cola and Non-Cola)
Juice (100% juice, Up to 24% juice and Nectar juice)
RTD Coffee
RTD Tea (Still and Carbonates)
Sports and Energy Drinks
Product Definitions for Soft Drinks
APPENDIX

THANK YOU FOR LISTENING Rosemarie Downey
Global Head of Packaging Research
www.euromonitor.com