Embed Size (px)
Citation preview
Heavy Vehicle Overload Control
Challenges
Dr Paul NordengenResearch Group Leader: Network Asset Management SystemsCSIR Built Environment
Transport Forum,University of Johannesburg,
4 June 2015
Contents
Background and problem statement
Overload control challenges
Two more recent solutions
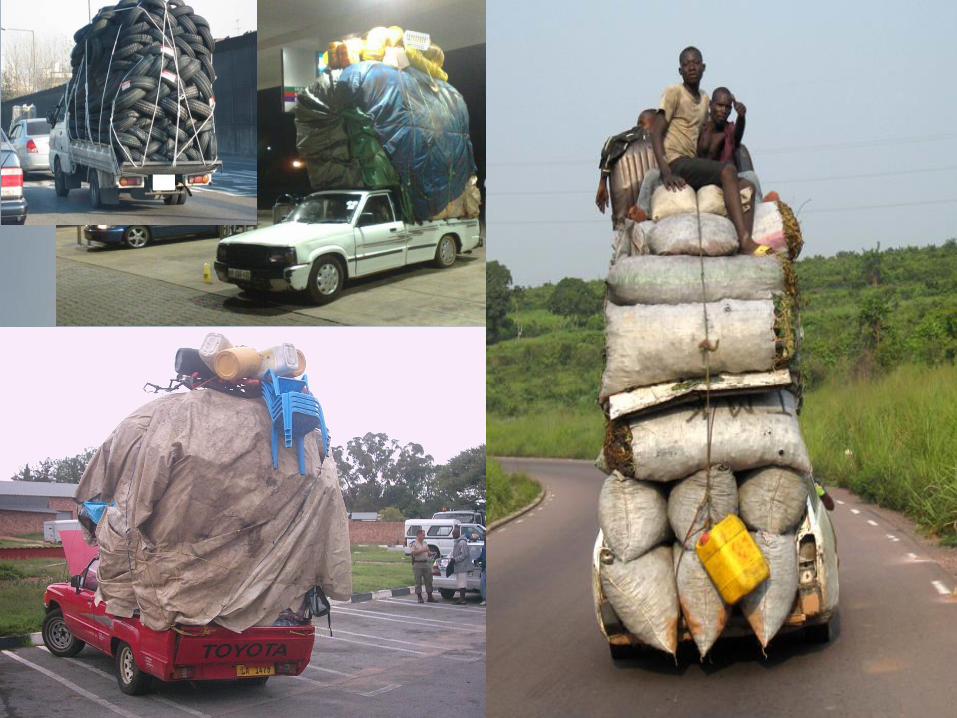
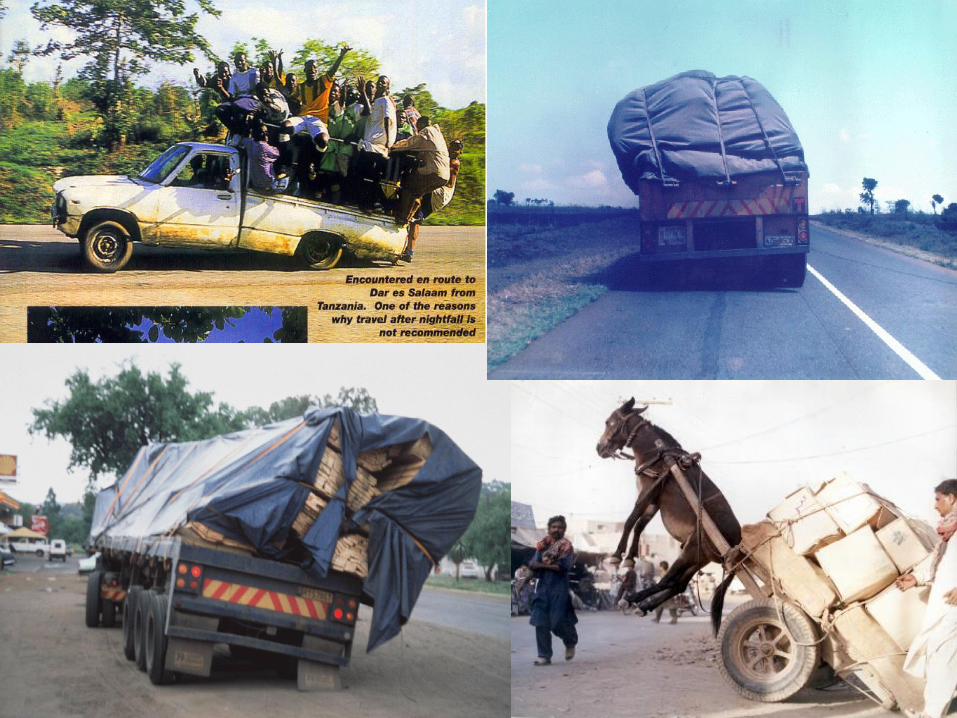
The Culture of Non-compliance Overloading
Speeding
Vehicle maintenance (brakes, tyres,
lights)
Driver hours
Reckless driving
False licenses (vehicles & drivers)
Load securement
Cabotage
Bribery & corruption
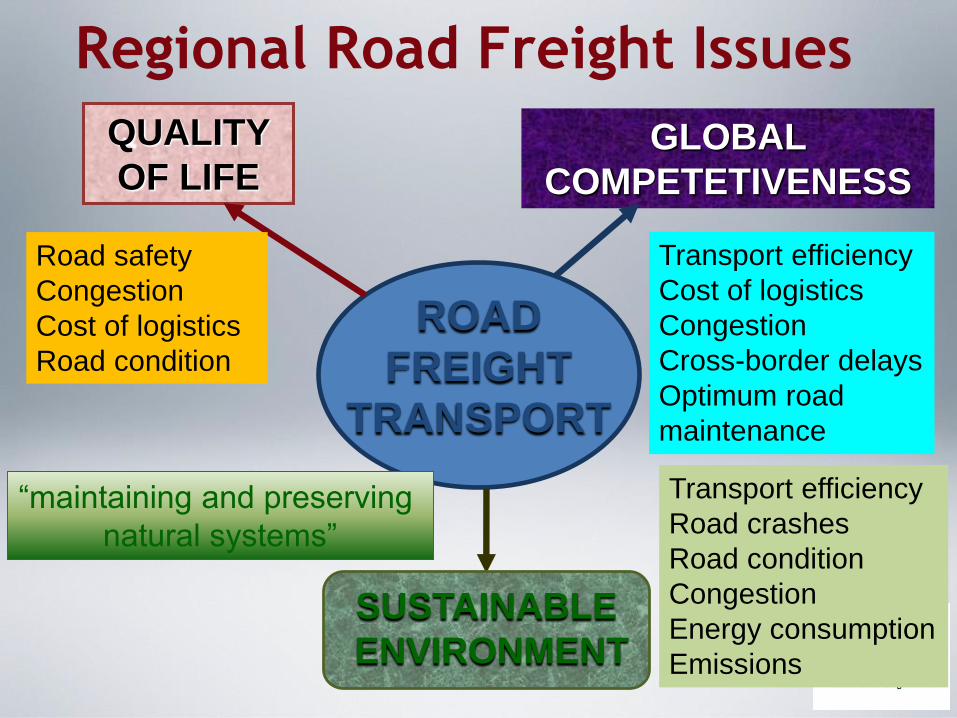
Regional Road Freight Issues
ROAD
FREIGHT
TRANSPORT
GLOBAL
COMPETETIVENESS
QUALITY
OF LIFE
SUSTAINABLE
ENVIRONMENT
Transport efficiency
Cost of logistics
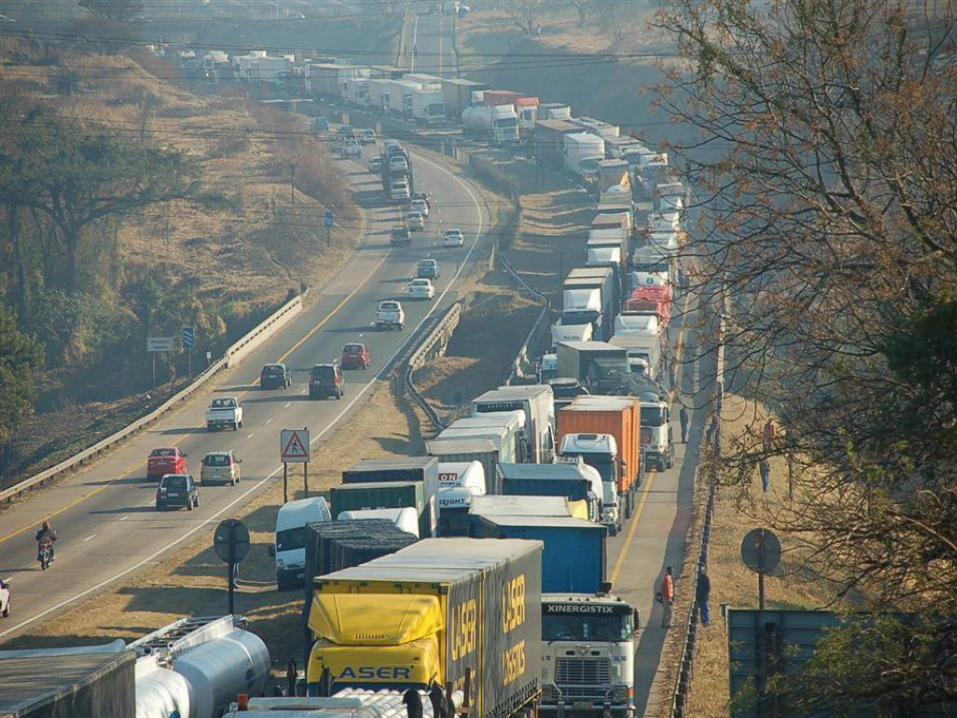
Congestion
Cross-border delays
Optimum road
maintenance
Road safety
Congestion
Cost of logistics
Road condition
Transport efficiency
Road crashes
Road condition
Congestion
Energy consumption
Emissions
“maintaining and preserving
natural systems”
Key Elements in Road
Freight Transport
• Road infrastructure
• Vehicles (design, maintenance
& operation)
• Drivers
Road infrastructure
GOOD ROADS LEAD TO PROSPERITY
motto of the SA Road Federation
Better roads, better world
Slide # 7
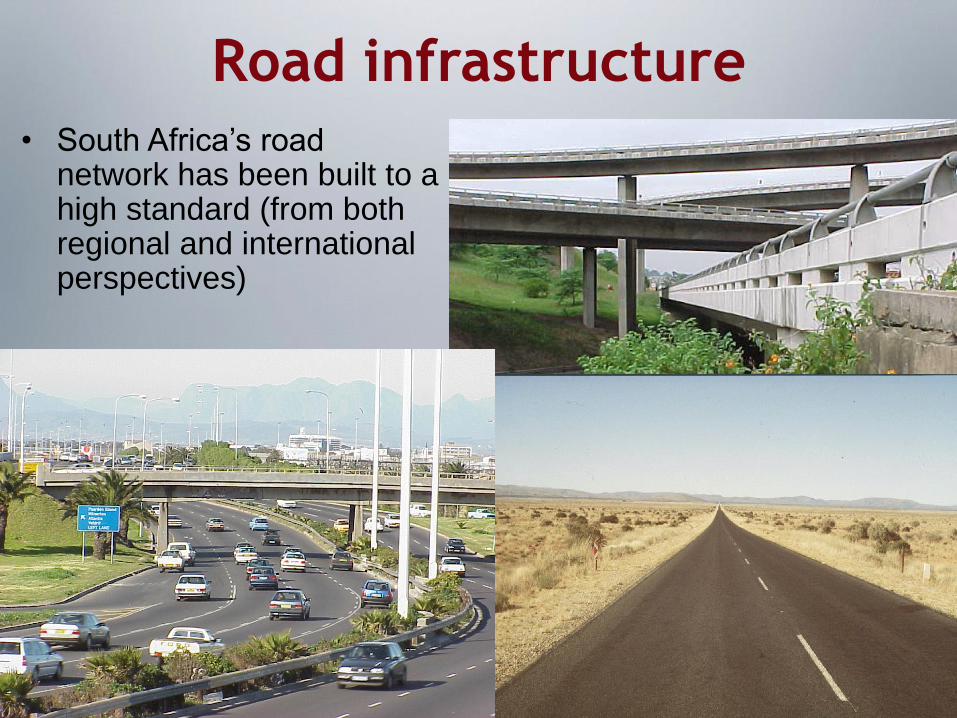
Road infrastructure
• South Africa’s road network has been built to a high standard (from both regional and international perspectives)
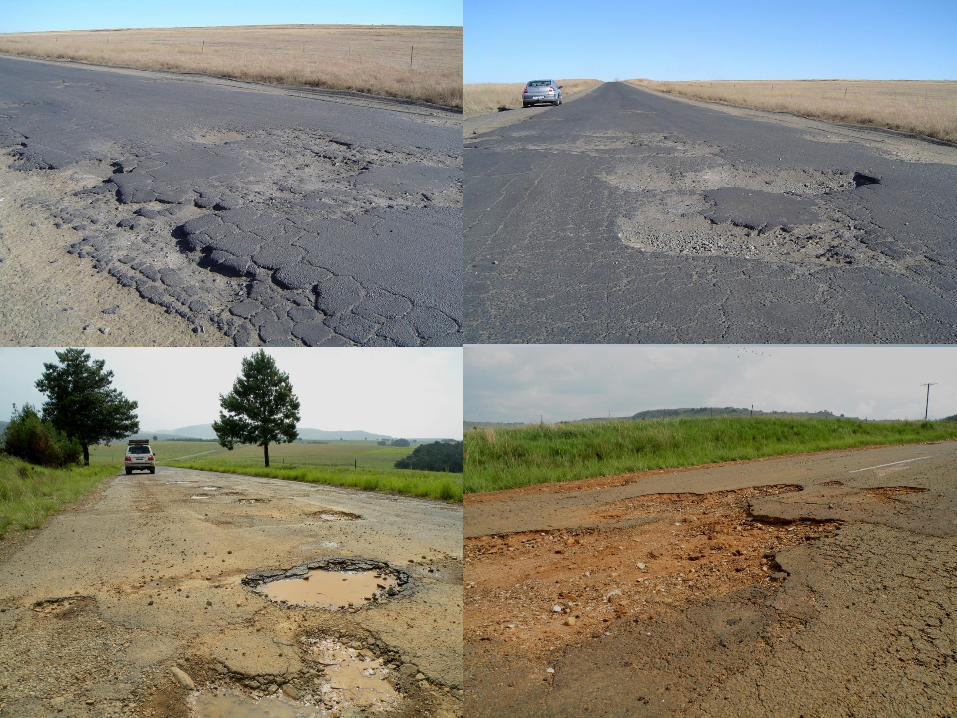
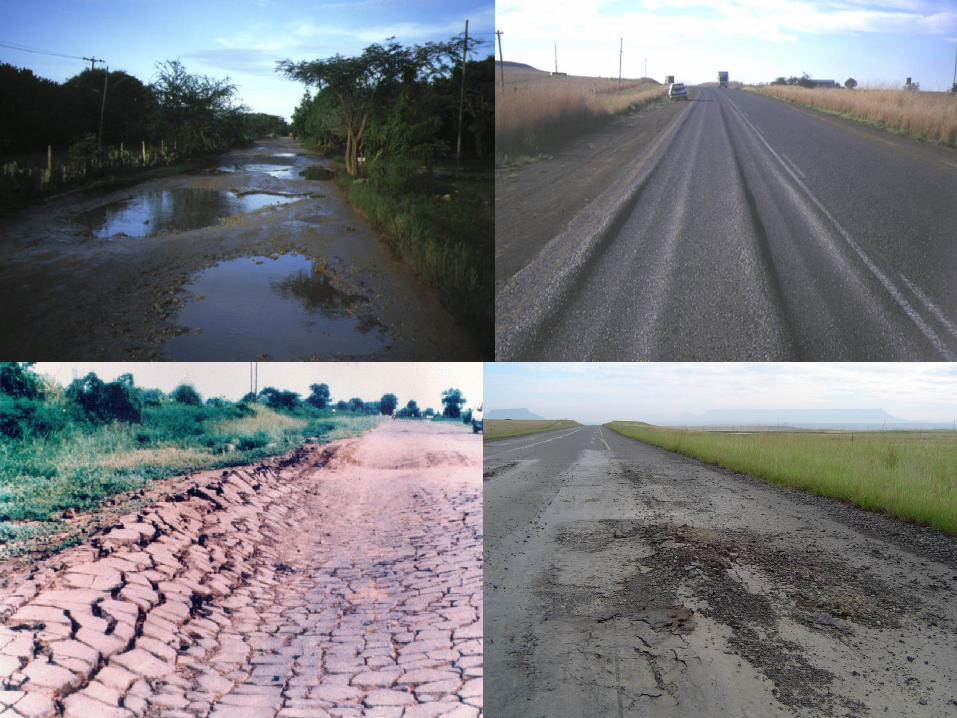
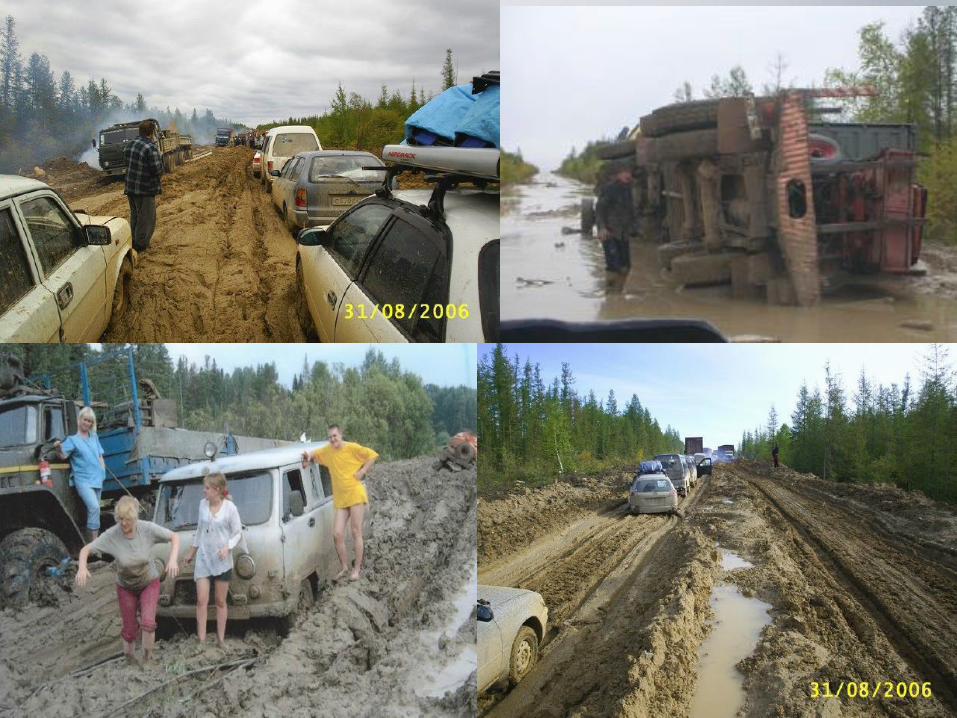

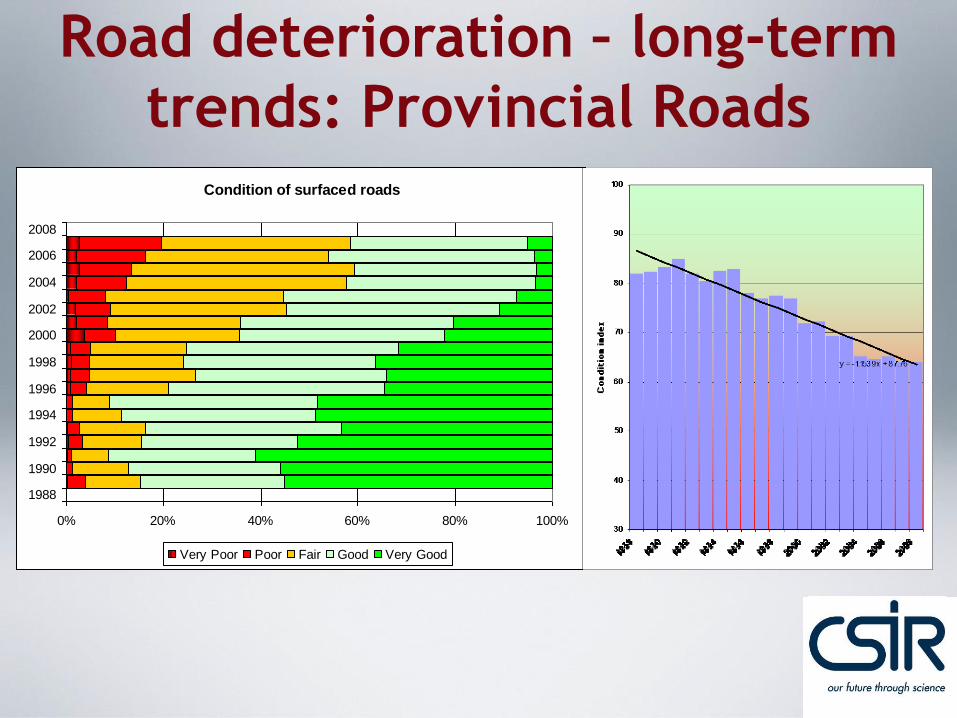
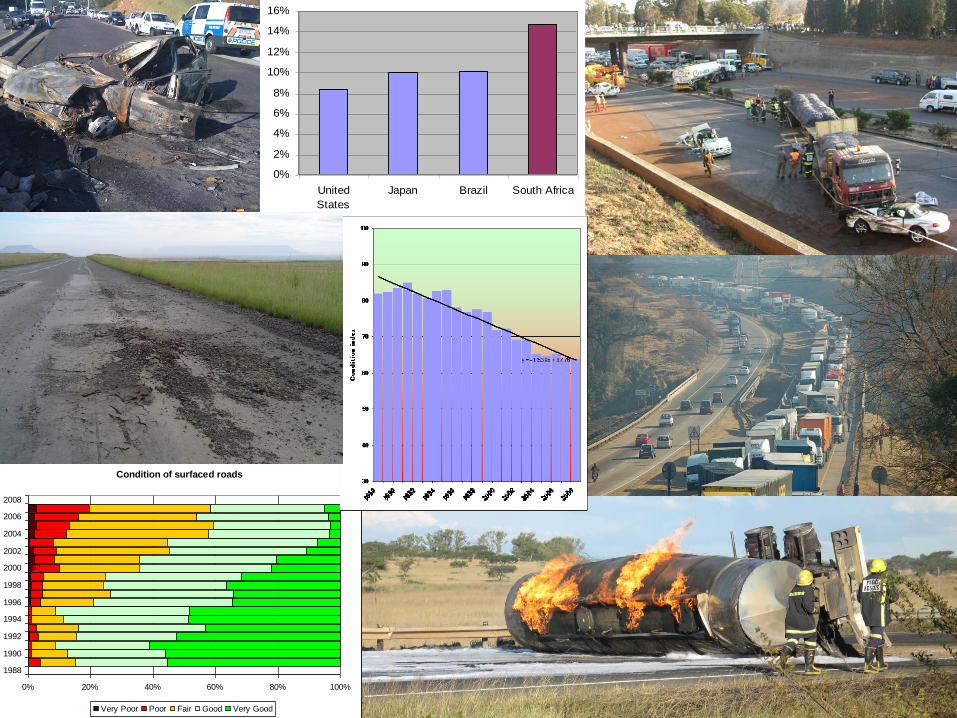
Road deterioration – long-term
trends: Provincial Roads Condition of surfaced roads
0% 20% 40% 60% 80% 100%
1988
1990
1992
1994
1996
1998
2000
2002
2004
2006
2008
Very Poor Poor Fair Good Very Good
Slide # 15
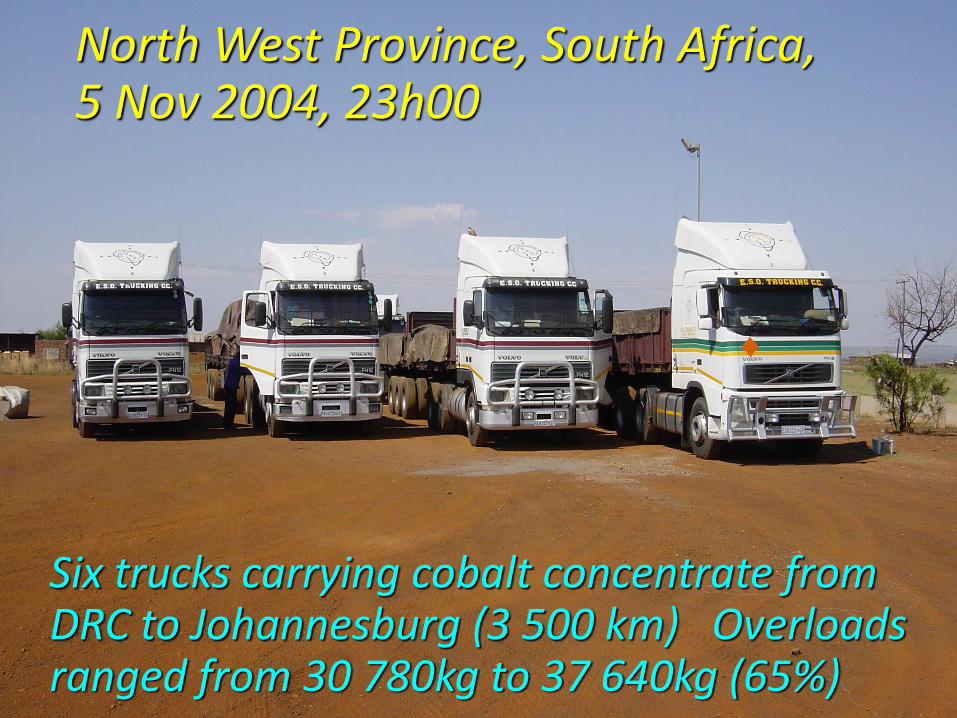
North West Province, South Africa, 5 Nov 2004, 23h00
Six trucks carrying cobalt concentrate from DRC to Johannesburg (3 500 km) Overloads ranged from 30 780kg to 37 640kg (65%)
Slide # 18
0
2
4
6
8
10
12
2001 2002 2003 2004 2005 2006
Year
Fa
tal
cra
sh
ra
te
Aust
Can
France
Denmark
USA
South Africa
Switzerland
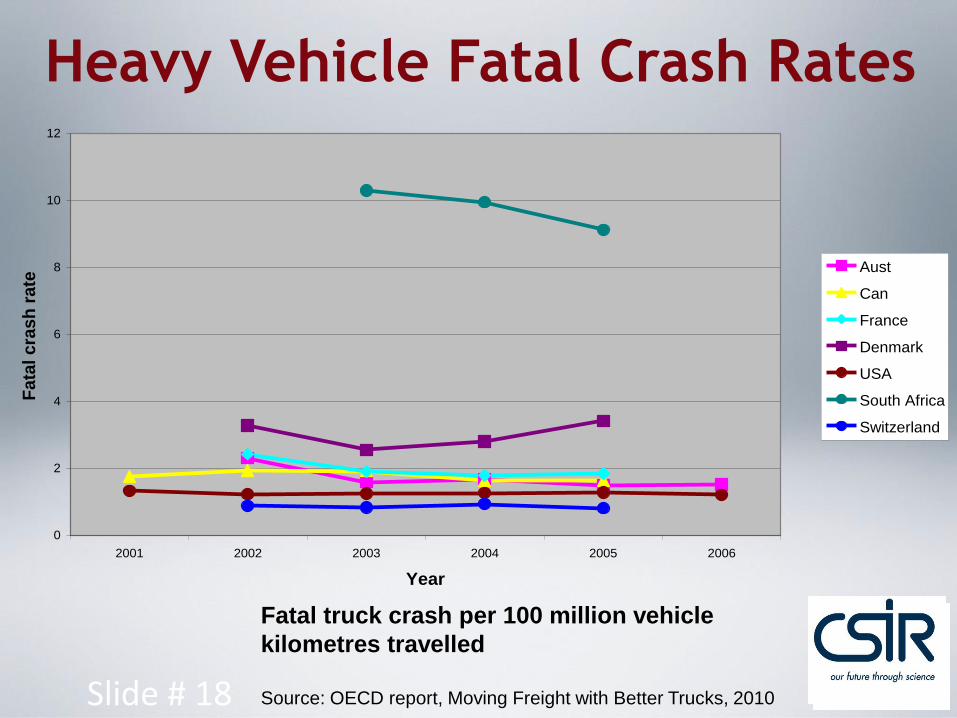
Fatal truck crash per 100 million vehicle
kilometres travelled
Source: OECD report, Moving Freight with Better Trucks, 2010
Heavy Vehicle Fatal Crash Rates
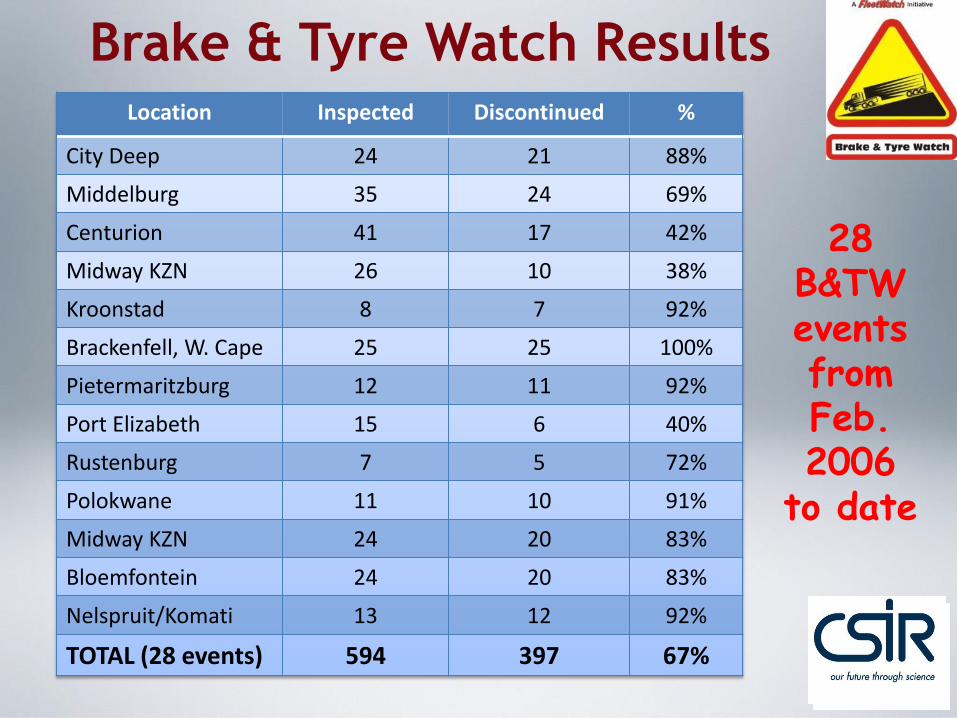
Brake & Tyre Watch ResultsLocation Inspected Discontinued %
City Deep 24 21 88%
Middelburg 35 24 69%
Centurion 41 17 42%
Midway KZN 26 10 38%
Kroonstad 8 7 92%
Brackenfell, W. Cape 25 25 100%
Pietermaritzburg 12 11 92%
Port Elizabeth 15 6 40%
Rustenburg 7 5 72%
Polokwane 11 10 91%
Midway KZN 24 20 83%
Bloemfontein 24 20 83%
Nelspruit/Komati 13 12 92%
TOTAL (28 events) 594 397 67%
28 B&TW events from Feb. 2006
to date
Slide # 22
Slide # 23
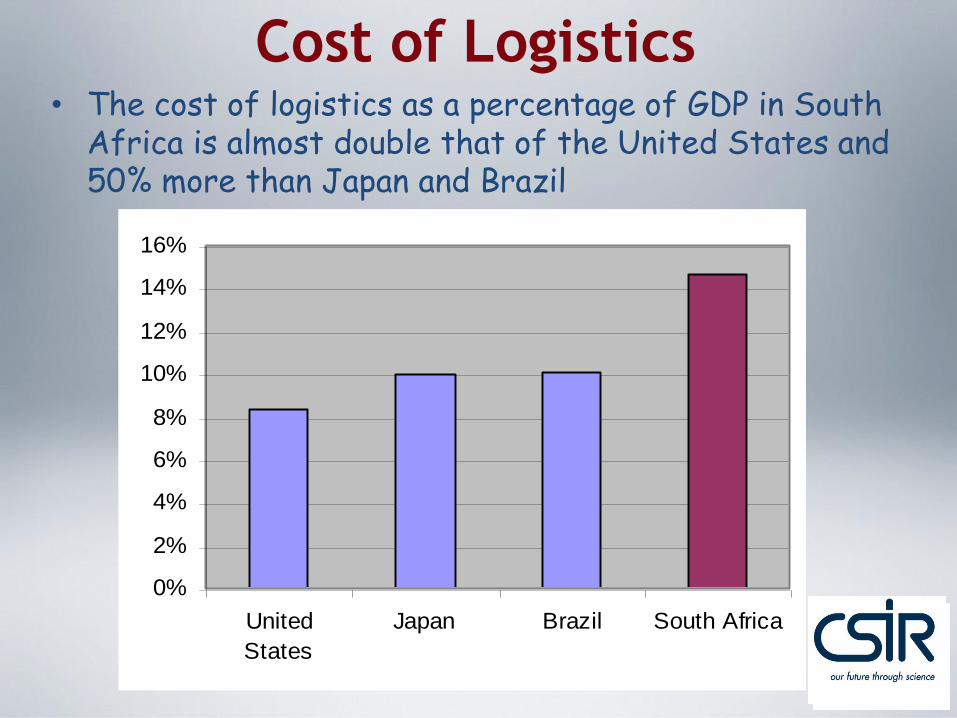
Cost of Logistics• The cost of logistics as a percentage of GDP in South
Africa is almost double that of the United States and 50% more than Japan and Brazil
0%
2%
4%
6%
8%
10%
12%
14%
16%
United
States
Japan Brazil South Africa
Slide # 25
0%
2%
4%
6%
8%
10%
12%
14%
16%
United
States
Japan Brazil South Africa
Condition of surfaced roads
0% 20% 40% 60% 80% 100%
1988
1990
1992
1994
1996
1998
2000
2002
2004
2006
2008
Very Poor Poor Fair Good Very Good
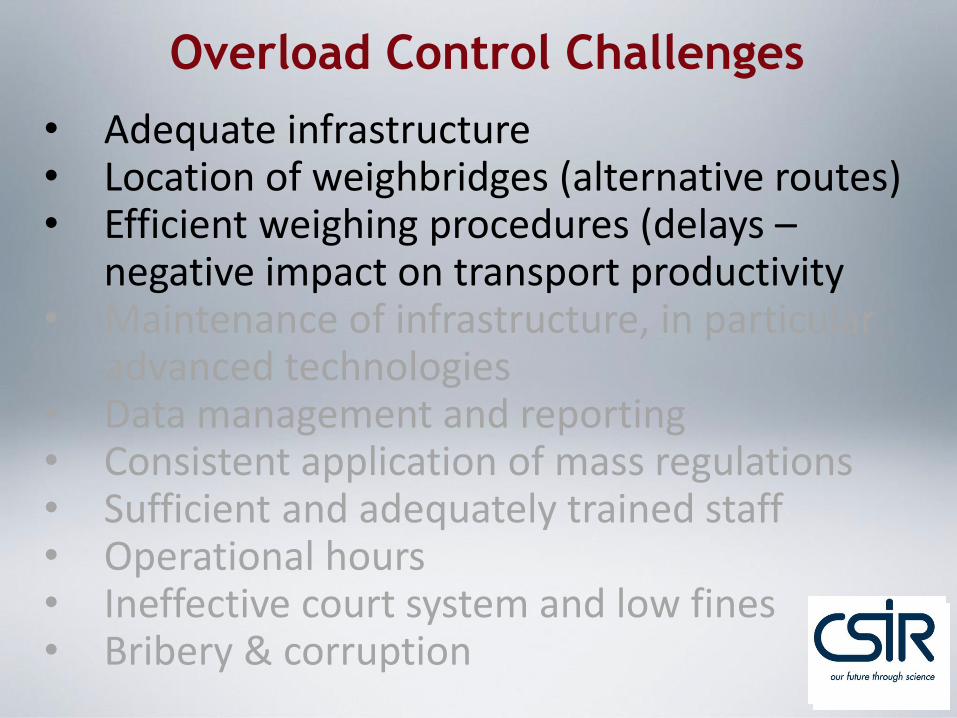
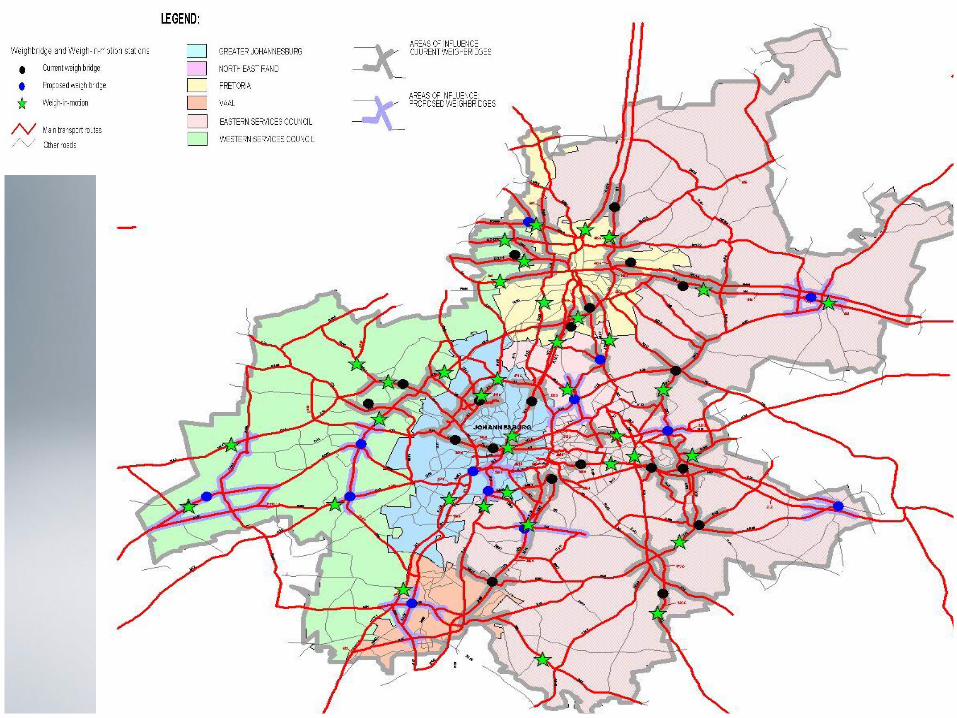
Overload Control Challenges
• Adequate infrastructure• Location of weighbridges (alternative routes)• Efficient weighing procedures (delays –
negative impact on transport productivity• Maintenance of infrastructure, in particular
advanced technologies• Data management and reporting• Consistent application of mass regulations• Sufficient and adequately trained staff• Operational hours• Ineffective court system and low fines• Bribery & corruption
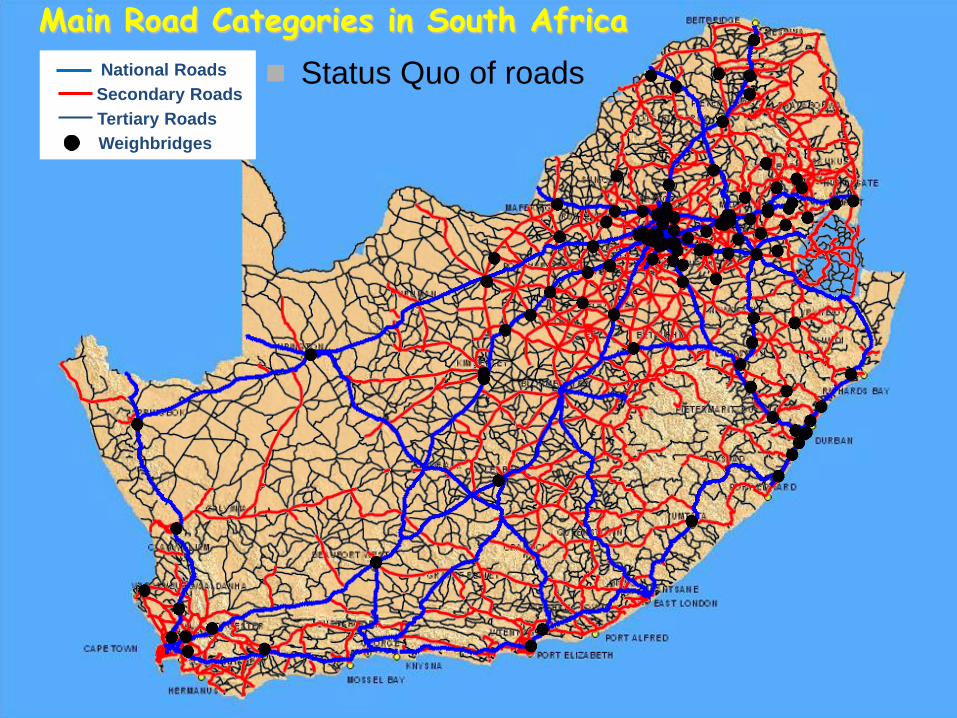
National Roads
Secondary Roads
Tertiary Roads
Main Road Categories in South Africa
Status Quo of roads
Weighbridges
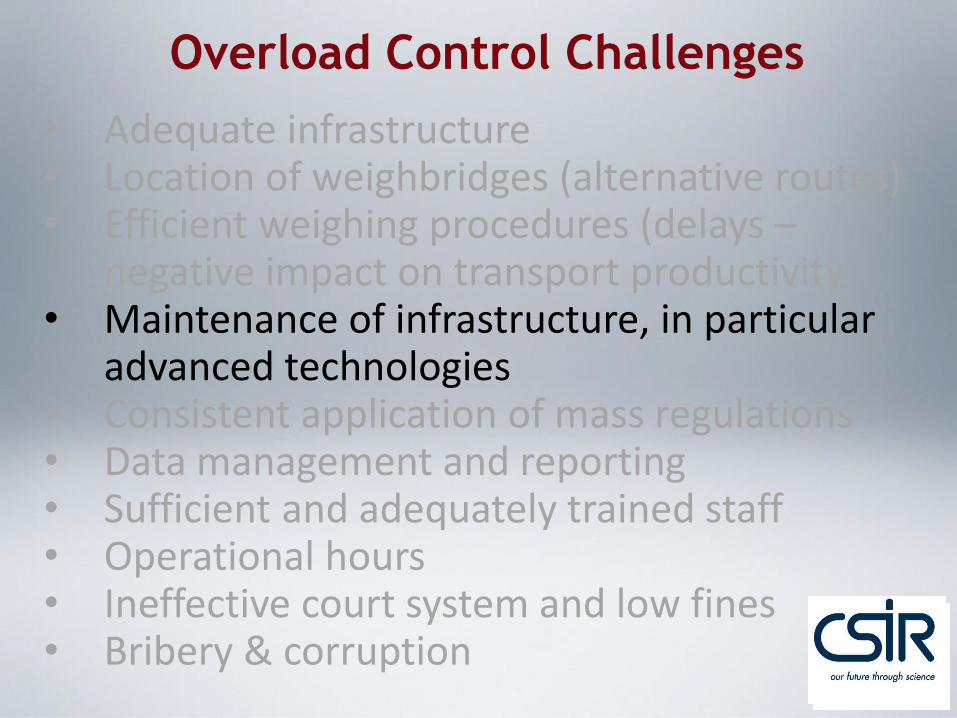
Overload Control Challenges
• Adequate infrastructure• Location of weighbridges (alternative routes)• Efficient weighing procedures (delays –
negative impact on transport productivity• Maintenance of infrastructure, in particular
advanced technologies• Consistent application of mass regulations• Data management and reporting• Sufficient and adequately trained staff• Operational hours• Ineffective court system and low fines• Bribery & corruption
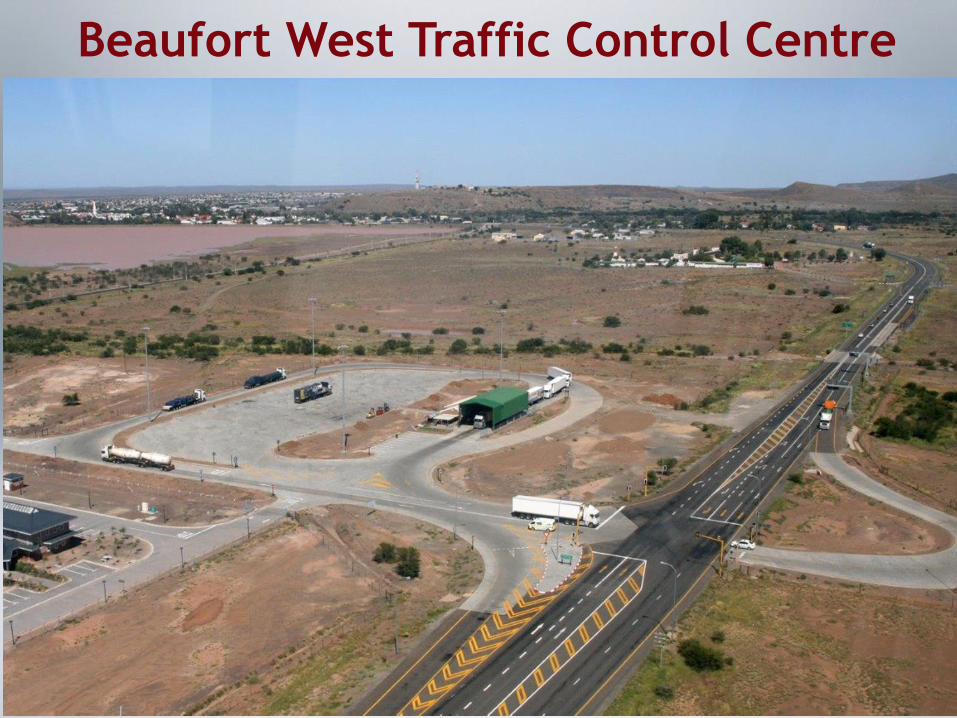
Beaufort West Traffic Control Centre
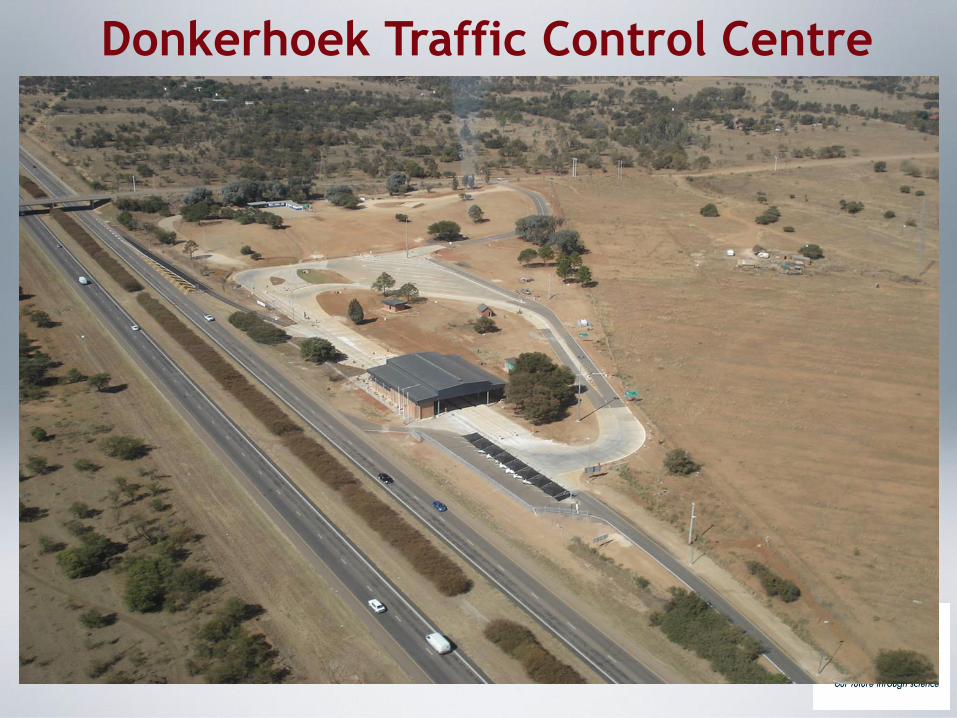
Donkerhoek Traffic Control Centre
Overload Control Challenges
• Adequate infrastructure• Location of weighbridges (alternative routes)• Efficient weighing procedures (delays –
negative impact on transport productivity• Maintenance of infrastructure, in particular
advanced technologies• Consistent application of mass regulations• Data management and reporting • Sufficient and adequately trained staff• Operational hours• Ineffective court system and low fines• Bribery & corruption

Permissible Maximum Mass on a
Steering Axle
• Reg. 240(b)(i) (“Road capacity” limit)7 700 kg
• Reg. 239(1)(a)(ii) (Vehicle Manufacturer’s Rating)6 800 kg
• Reg. 238(1) (Tyre Manufacturer’s Rating)7 200 kg
• Permissible Maximum Mass = 6 800 kg
Overload Control Challenges
• Adequate infrastructure• Location of weighbridges (alternative routes)• Efficient weighing procedures (delays –
negative impact on transport productivity• Maintenance of infrastructure, in particular
advanced technologies• Consistent application of mass regulations• Data management and reporting• Sufficient and adequately trained staff• Operational hours• Ineffective court system and low fines• Bribery & corruption
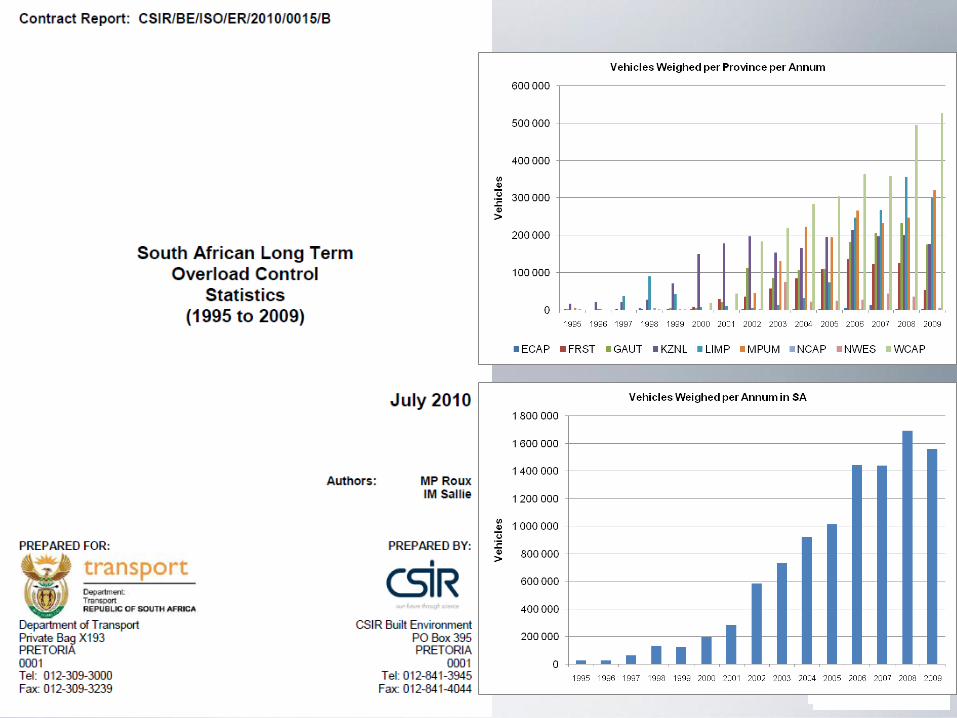
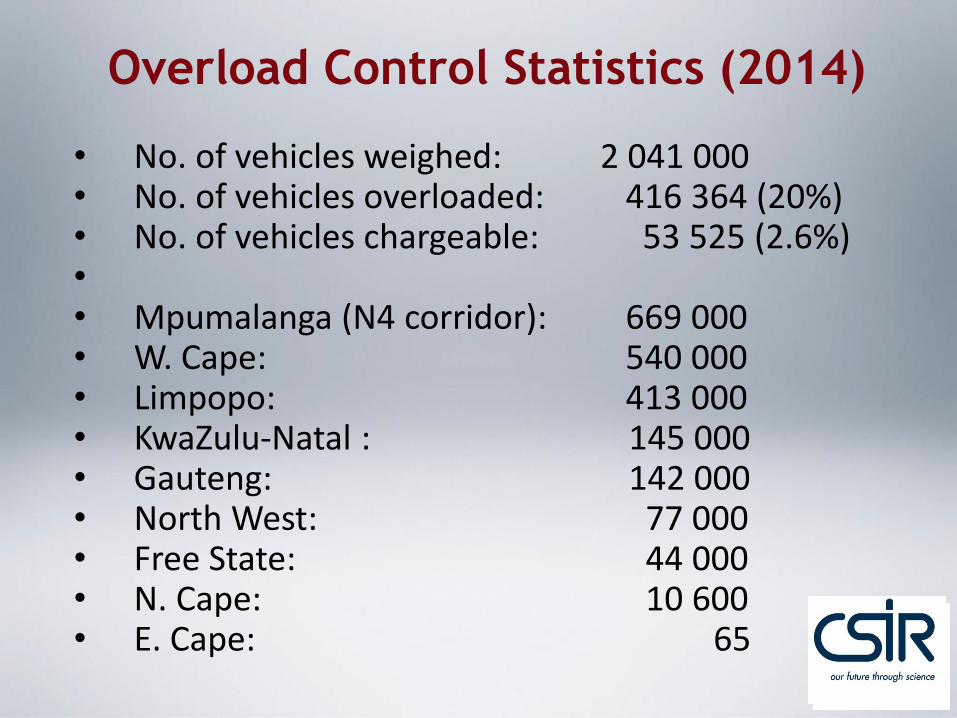
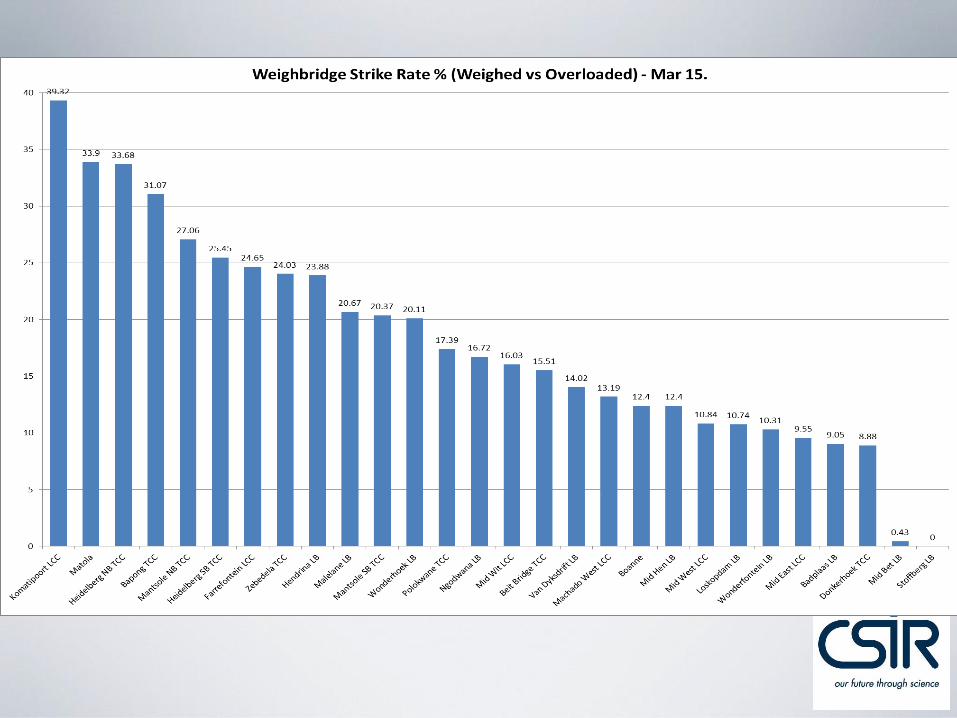
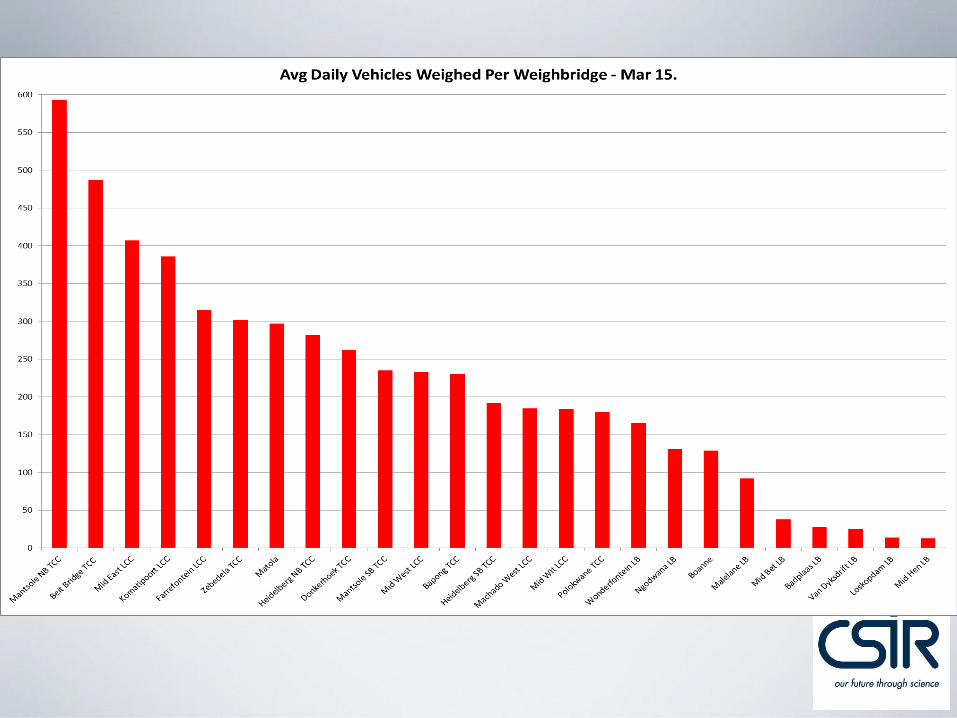
Overload Control Statistics (2014)
• No. of vehicles weighed: 2 041 000• No. of vehicles overloaded: 416 364 (20%)• No. of vehicles chargeable: 53 525 (2.6%)•• Mpumalanga (N4 corridor): 669 000• W. Cape: 540 000• Limpopo: 413 000• KwaZulu-Natal : 145 000• Gauteng: 142 000• North West: 77 000• Free State: 44 000• N. Cape: 10 600• E. Cape: 65
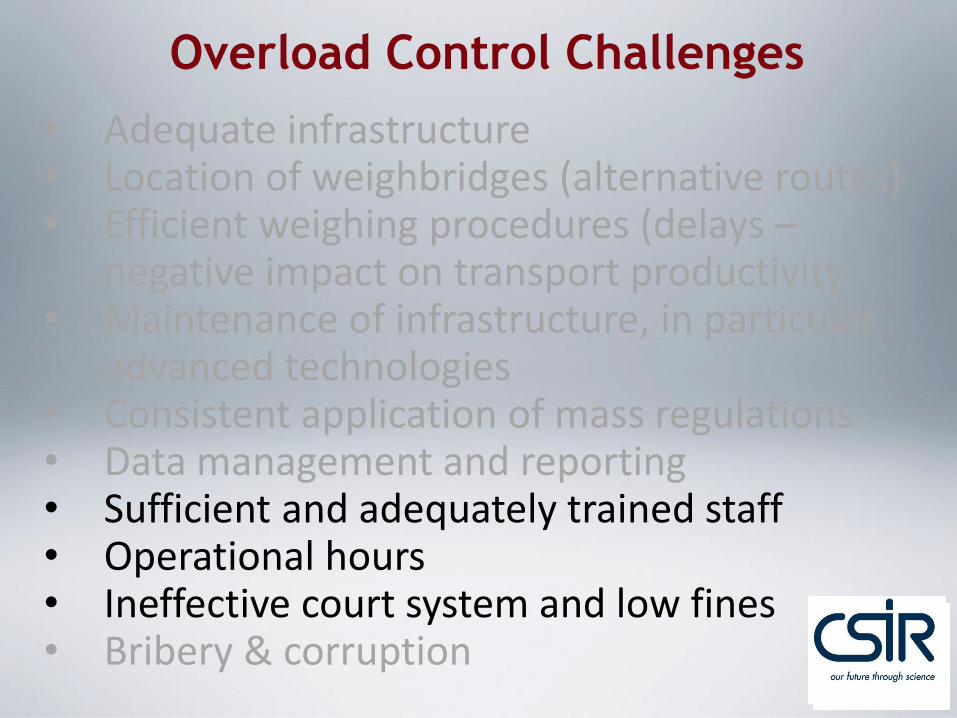
Overload Control Challenges
• Adequate infrastructure• Location of weighbridges (alternative routes)• Efficient weighing procedures (delays –
negative impact on transport productivity• Maintenance of infrastructure, in particular
advanced technologies• Consistent application of mass regulations• Data management and reporting• Sufficient and adequately trained staff• Operational hours• Ineffective court system and low fines• Bribery & corruption
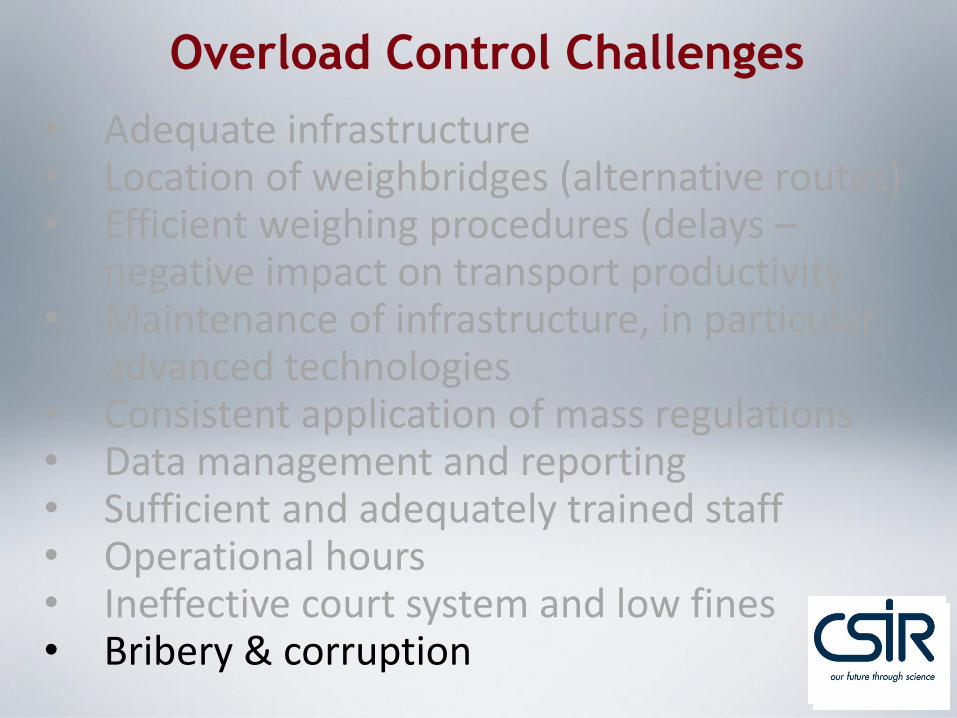
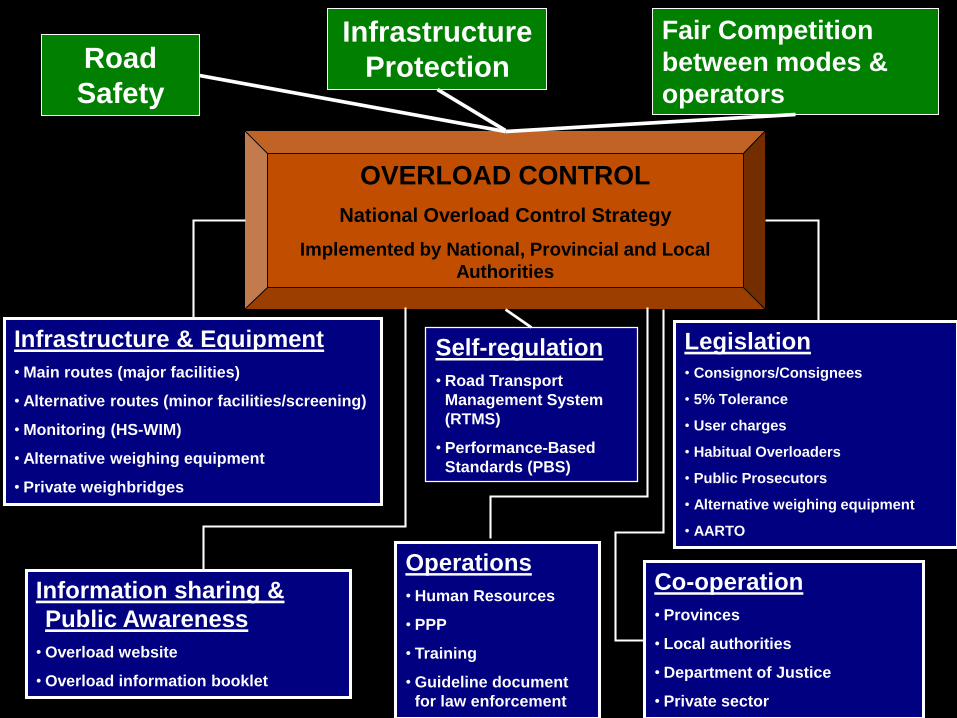
Slide # 44
Road
Safety
Fair Competition
between modes &
operators
Infrastructure
Protection
OVERLOAD CONTROL
National Overload Control Strategy
Implemented by National, Provincial and Local
Authorities
Infrastructure & Equipment
• Main routes (major facilities)
• Alternative routes (minor facilities/screening)
• Monitoring (HS-WIM)
• Alternative weighing equipment
• Private weighbridges
Information sharing &
Public Awareness
• Overload website
• Overload information booklet
Operations
• Human Resources
• PPP
• Training
• Guideline document
for law enforcement
Self-regulation
• Road Transport
Management System
(RTMS)
• Performance-Based
Standards (PBS)
Legislation
• Consignors/Consignees
• 5% Tolerance
• User charges
• Habitual Overloaders
• Public Prosecutors
• Alternative weighing equipment
• AARTO
Co-operation
• Provinces
• Local authorities
• Department of Justice
• Private sector
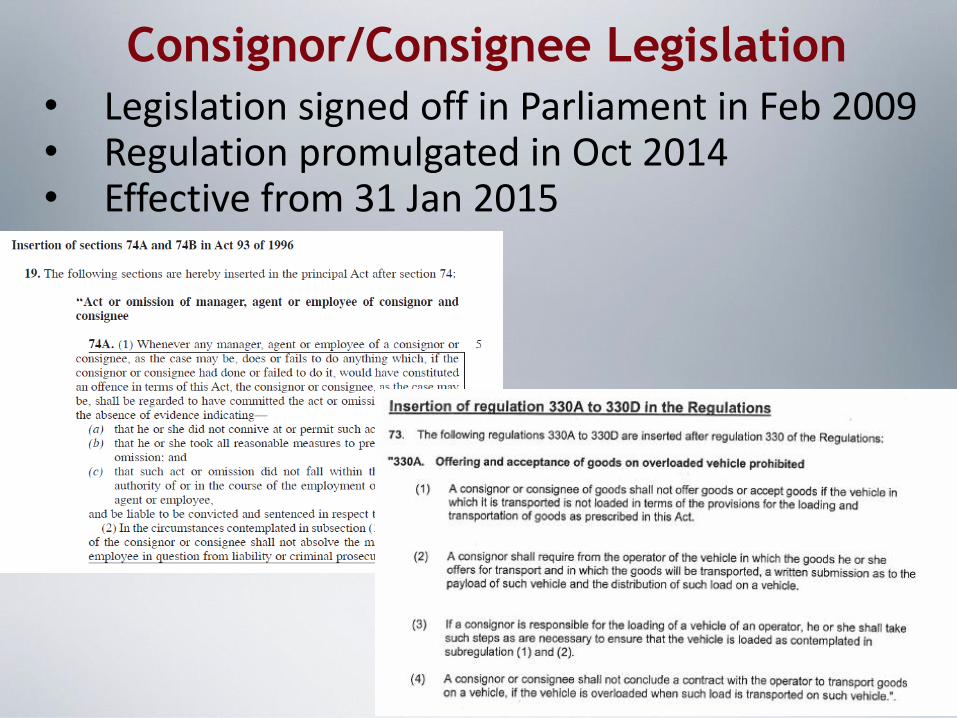
Consignor/Consignee Legislation
• Legislation signed off in Parliament in Feb 2009 • Regulation promulgated in Oct 2014• Effective from 31 Jan 2015
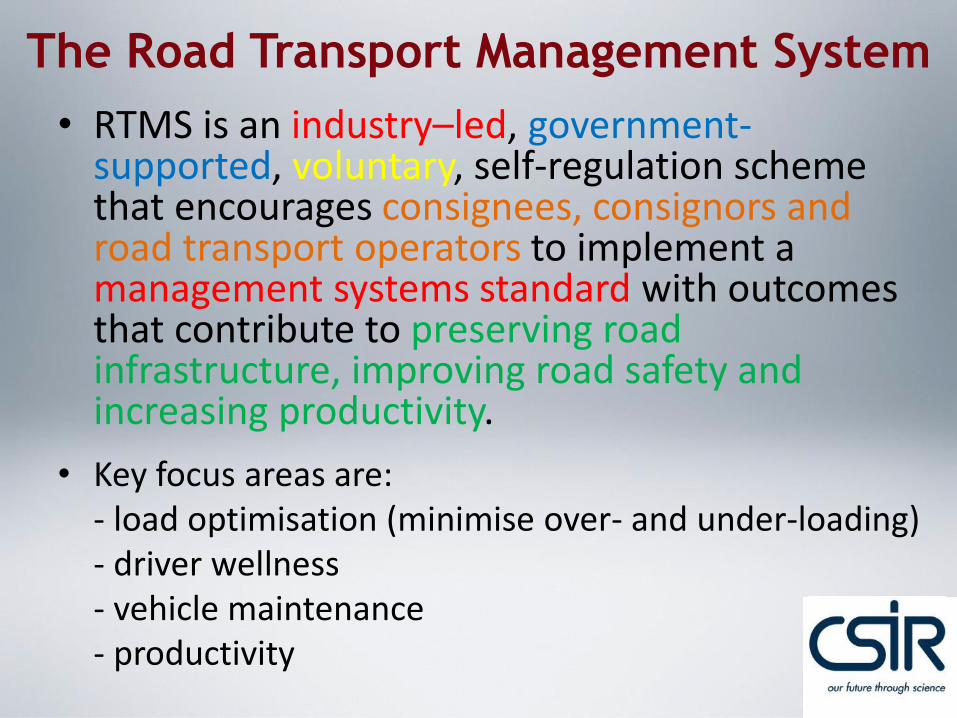
The Road Transport Management System
• RTMS is an industry–led, government-supported, voluntary, self-regulation scheme that encourages consignees, consignors and road transport operators to implement a management systems standard with outcomes that contribute to preserving road infrastructure, improving road safety and increasing productivity.
• Key focus areas are:- load optimisation (minimise over- and under-loading)- driver wellness- vehicle maintenance- productivity
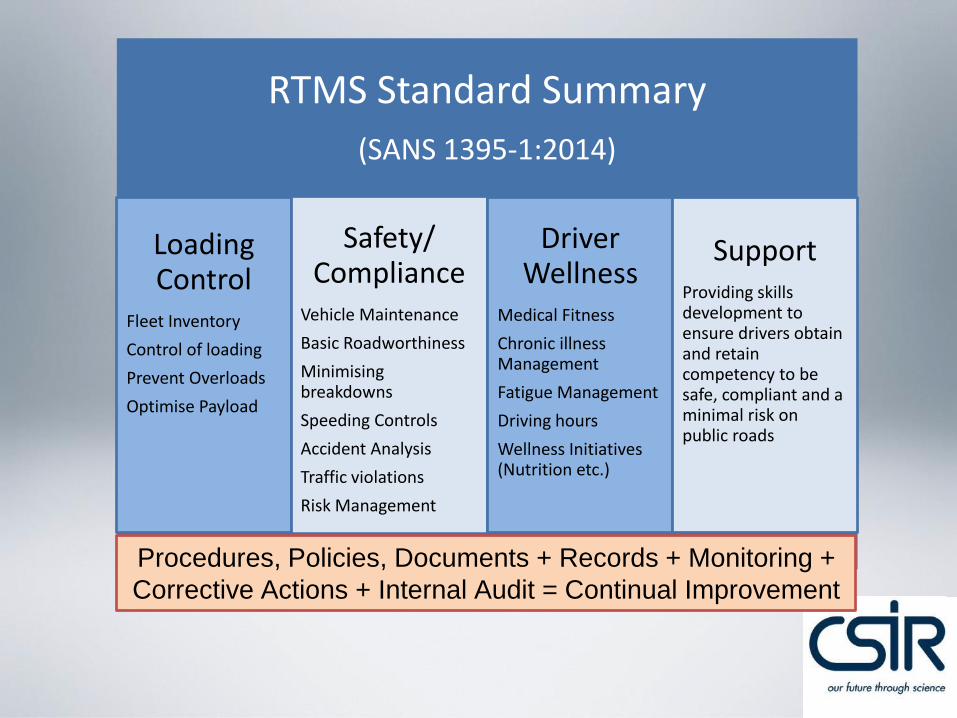
RTMS Standard Summary
(SANS 1395-1:2014)
Loading Control
Fleet Inventory
Control of loading
Prevent Overloads
Optimise Payload
Safety/ Compliance
Vehicle Maintenance
Basic Roadworthiness
Minimising breakdowns
Speeding Controls
Accident Analysis
Traffic violations
Risk Management
Driver Wellness
Medical Fitness
Chronic illness Management
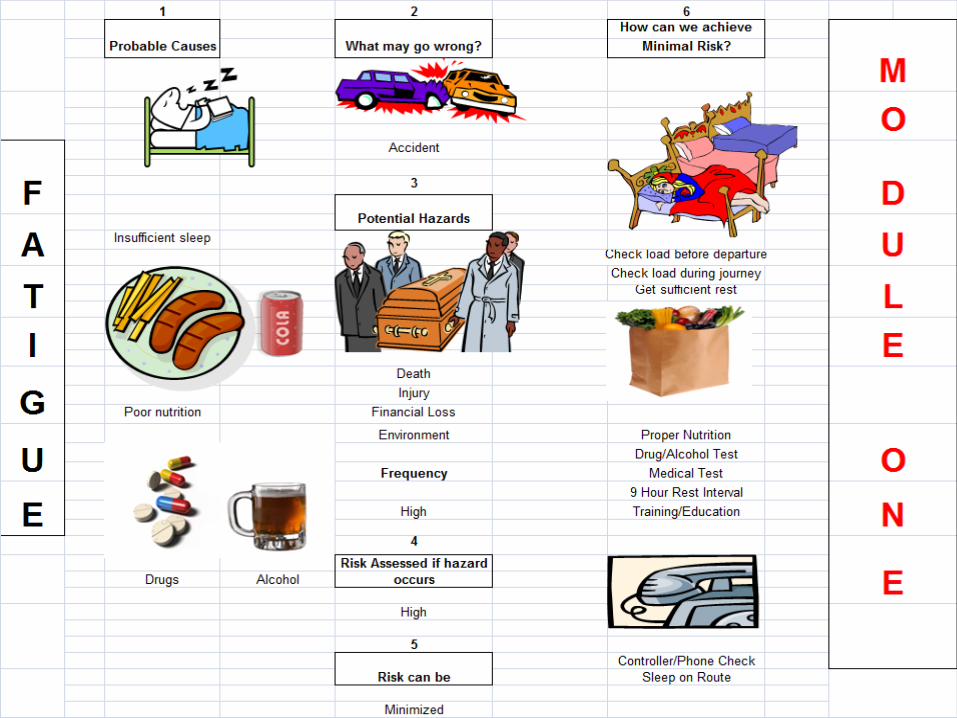
Fatigue Management
Driving hours
Wellness Initiatives (Nutrition etc.)
SupportProviding skills development to ensure drivers obtain and retain competency to be safe, compliant and a minimal risk on public roads
Procedures, Policies, Documents + Records + Monitoring +
Corrective Actions + Internal Audit = Continual Improvement
Vehicle & Load Safety
52

Management of Driver Wellness
53
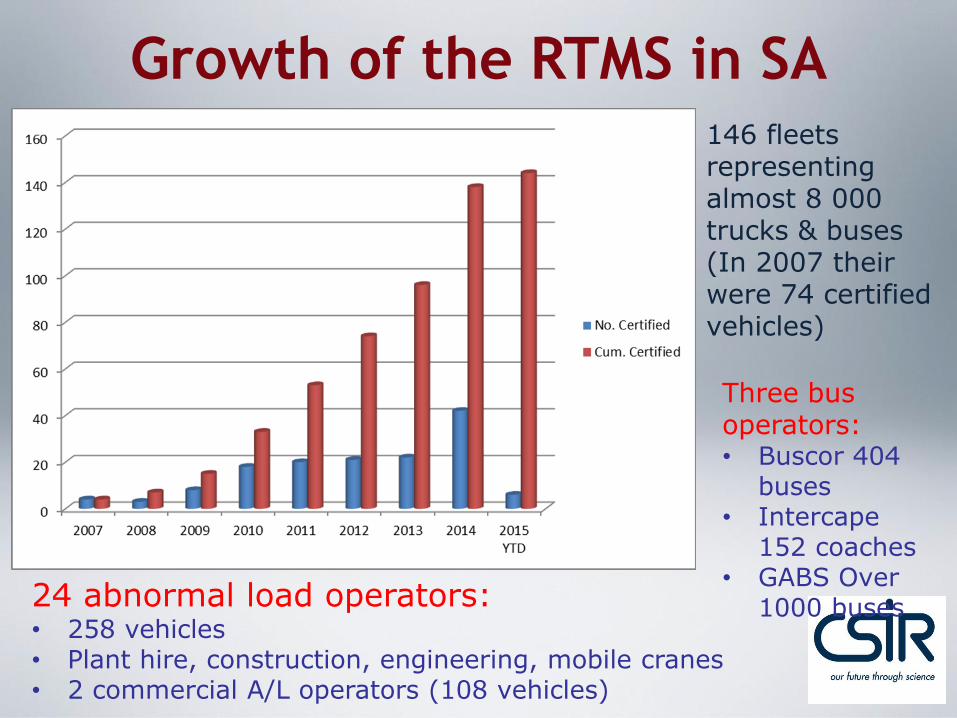
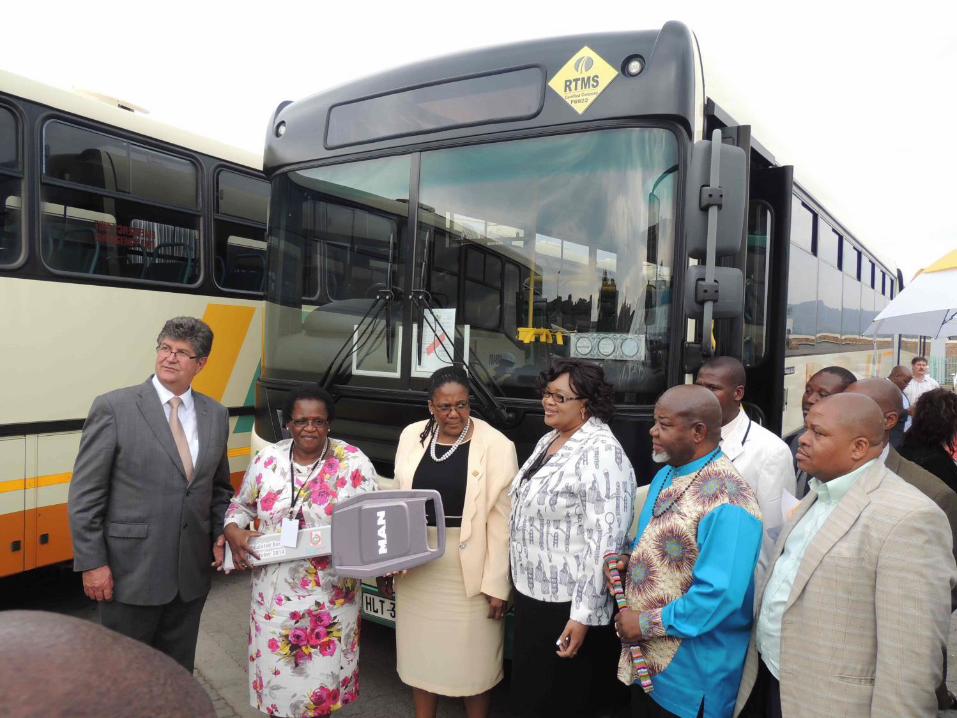
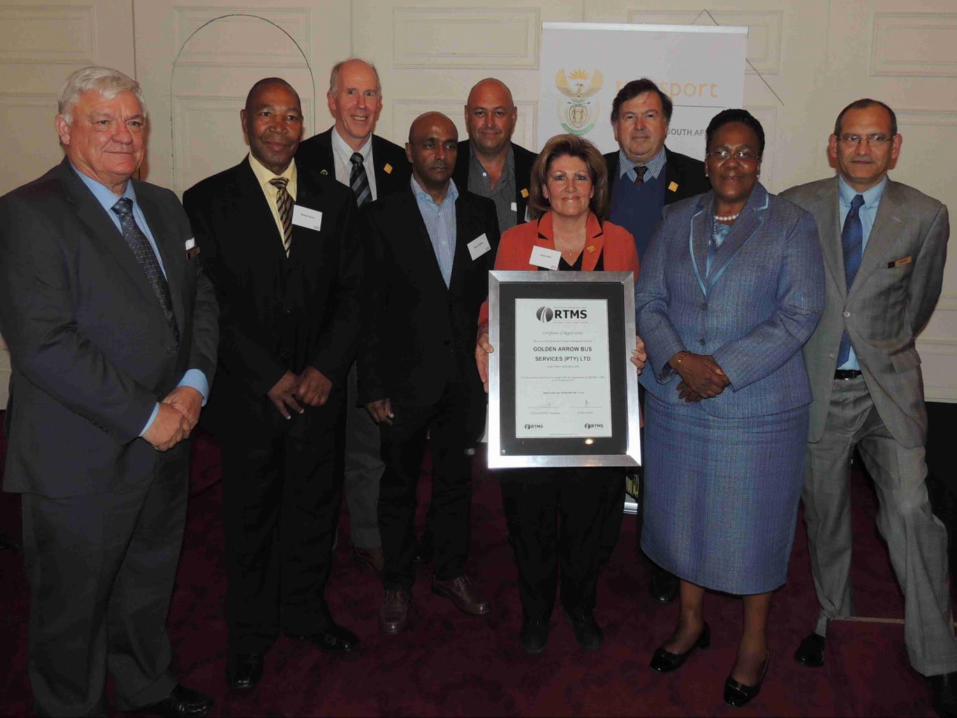
Growth of the RTMS in SA146 fleets representing almost 8 000 trucks & buses (In 2007 their were 74 certified vehicles)
24 abnormal load operators:• 258 vehicles• Plant hire, construction, engineering, mobile cranes• 2 commercial A/L operators (108 vehicles)
Three bus operators:• Buscor 404
buses • Intercape
152 coaches• GABS Over
1000 buses
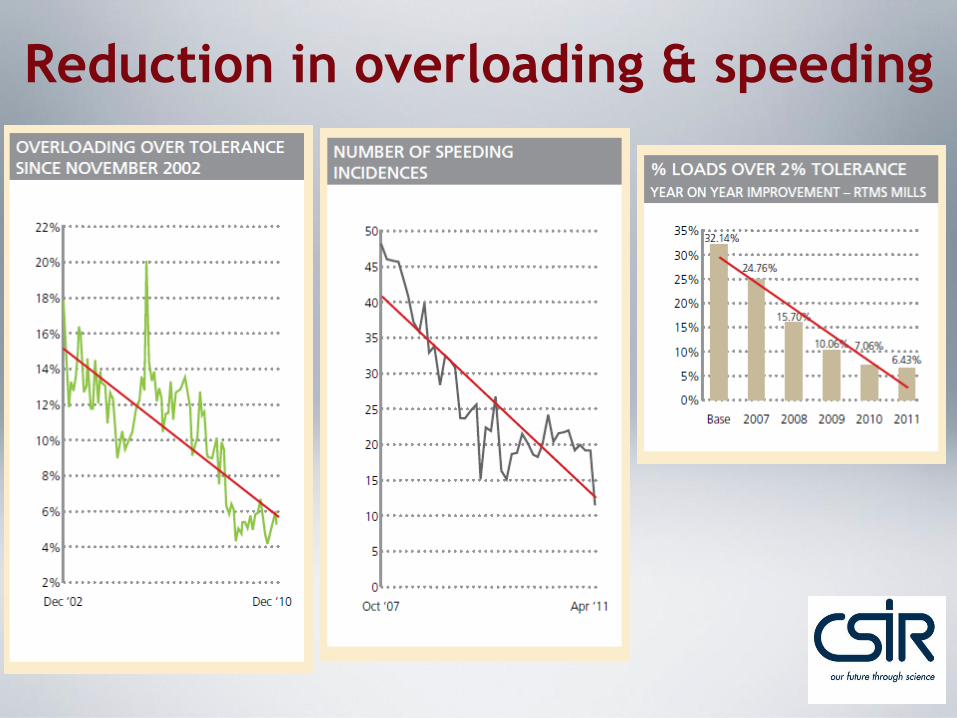
Reduction in overloading & speeding
0
2
4
6
8
10
12
14
0
2000
4000
6000
8000
10000
12000
14000
16000
18000
20000
22000
24000
26000
28000
30000
11
-07
02
-08
05
-08
08
-08
11
-08
02
-09
05
-09
08
-09
11
-09
02
-10
05
-10
08
-10
11
-10
02
-11
05
-11
08
-11
11
-11
02
-12
05
-12
08
-12
11
-12
02
-13
05
-13
08
-13
11
-13
02
-14
05
-14
08
-14
11
-14
02
-15
Percen
tageV
ehic
le V
olu
mes
Month Ending
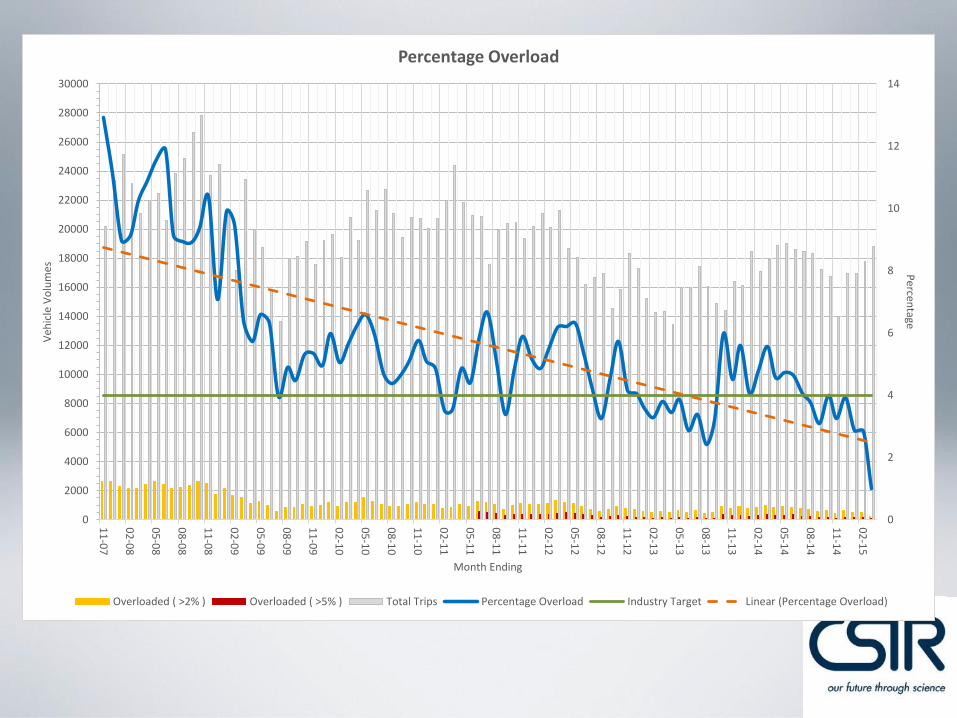
Percentage Overload
Overloaded ( >2% ) Overloaded ( >5% ) Total Trips Percentage Overload Industry Target Linear (Percentage Overload)
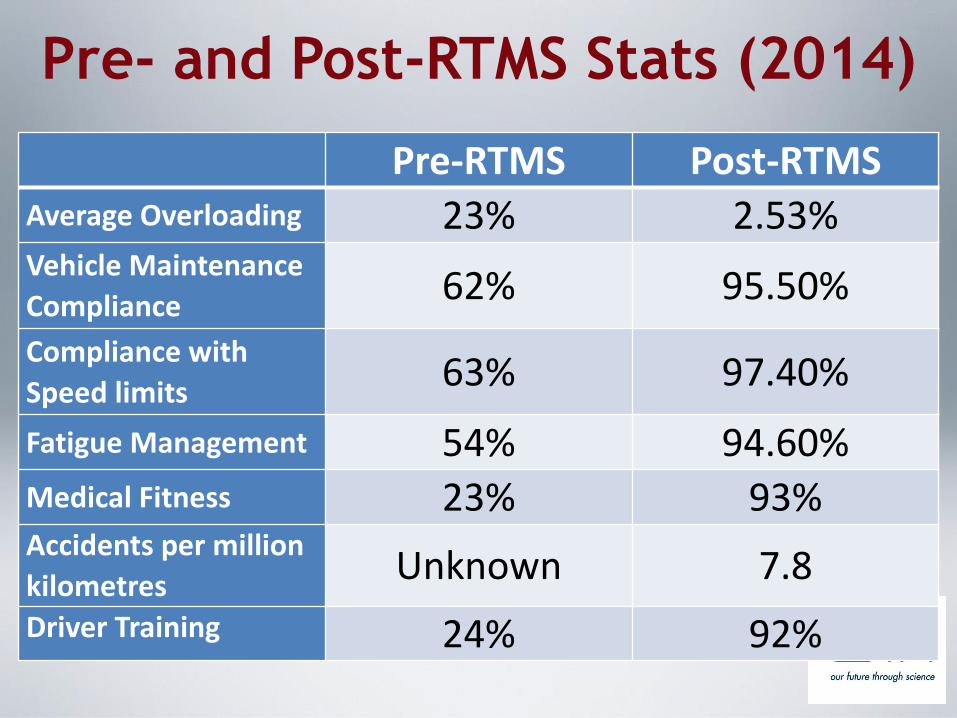
Pre-RTMS Post-RTMSAverage Overloading 23% 2.53%Vehicle Maintenance
Compliance62% 95.50%
Compliance with
Speed limits63% 97.40%
Fatigue Management 54% 94.60%Medical Fitness 23% 93%Accidents per million
kilometresUnknown 7.8
Driver Training 24% 92%
Pre- and Post-RTMS Stats (2014)
Nordengen et al.
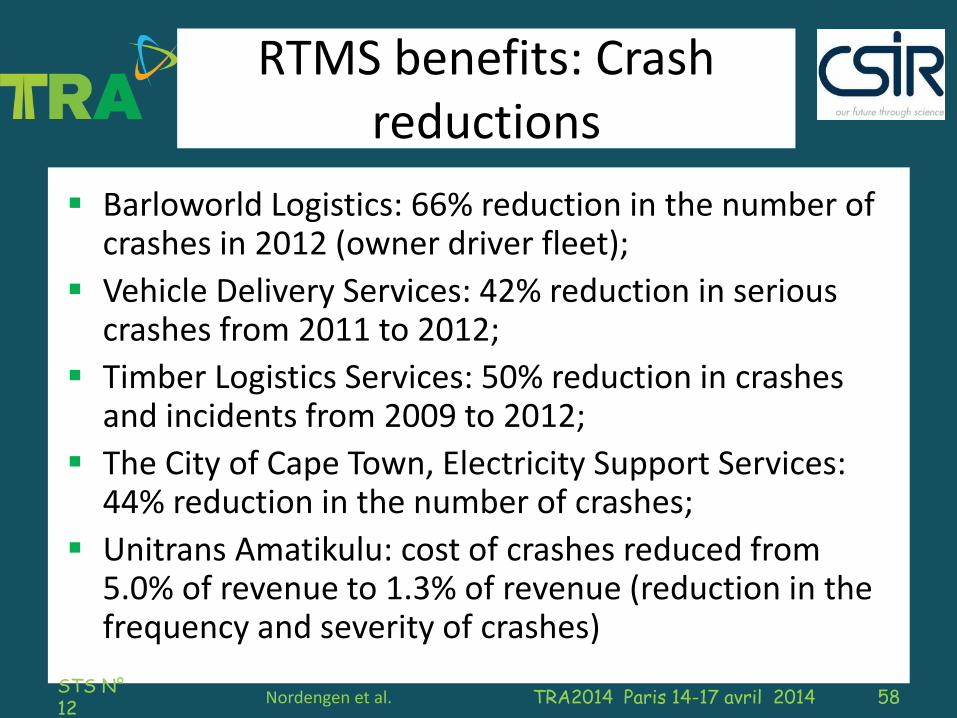
RTMS benefits: Crash reductions
Barloworld Logistics: 66% reduction in the number of crashes in 2012 (owner driver fleet);
Vehicle Delivery Services: 42% reduction in serious crashes from 2011 to 2012;
Timber Logistics Services: 50% reduction in crashes and incidents from 2009 to 2012;
The City of Cape Town, Electricity Support Services: 44% reduction in the number of crashes;
Unitrans Amatikulu: cost of crashes reduced from 5.0% of revenue to 1.3% of revenue (reduction in the frequency and severity of crashes)
STS N°12
58TRA2014 Paris 14-17 avril 2014
THANK YOU