Embed Size (px)
Citation preview
THE LATEST ECONOMIC TRENDSHighlights from the 2017 Q4 and Year-End GDP Estimates
January 26, 2018
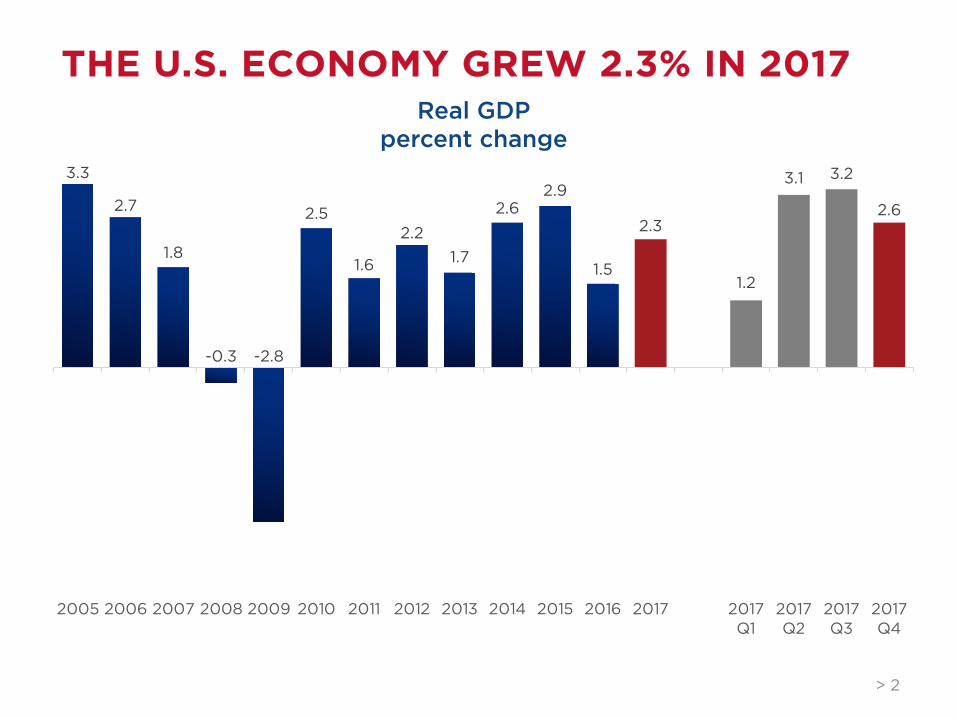
THE U.S. ECONOMY GREW 2.3% IN 2017
> 2
3.3
2.7
1.8
-0.3 -2.8
2.5
1.6
2.21.7
2.62.9
1.5
2.3
1.2
3.1 3.2
2.6
-4
-3
-2
-1
0
1
2
3
4
2005 2006 2007 2008 2009 2010 2011 2012 2013 2014 2015 2016 2017 2017Q1
2017Q2
2017Q3
2017Q4
Real GDP percent change
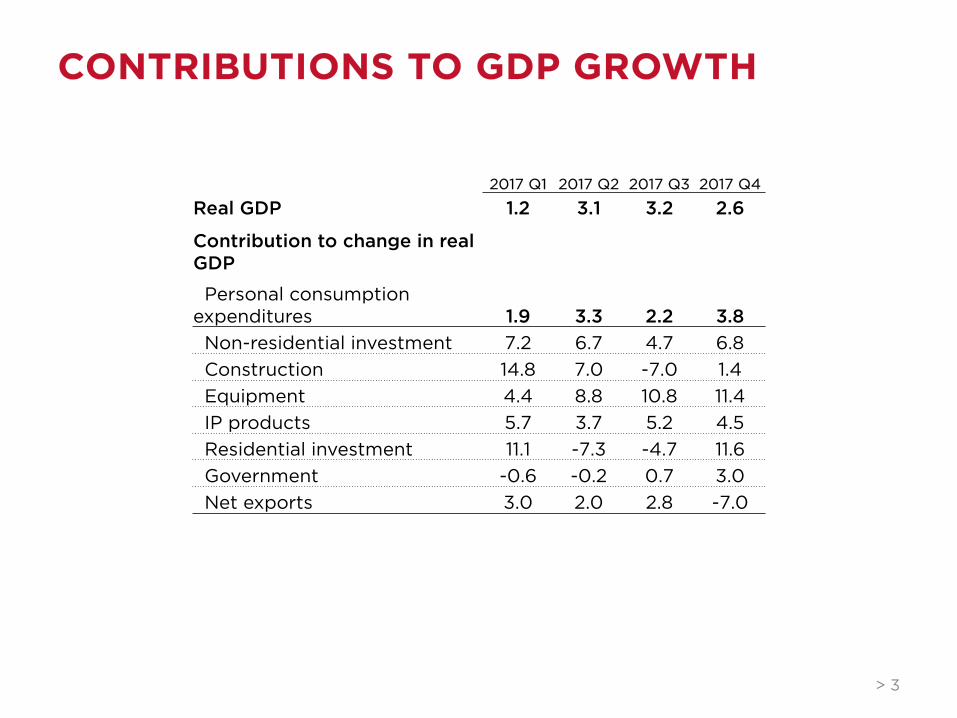
CONTRIBUTIONS TO GDP GROWTH
> 3
2017 Q1 2017 Q2 2017 Q3 2017 Q4
Real GDP 1.2 3.1 3.2 2.6
Contribution to change in real GDP
Personal consumption expenditures 1.9 3.3 2.2 3.8
Non-residential investment 7.2 6.7 4.7 6.8Construction 14.8 7.0 -7.0 1.4Equipment 4.4 8.8 10.8 11.4IP products 5.7 3.7 5.2 4.5Residential investment 11.1 -7.3 -4.7 11.6Government -0.6 -0.2 0.7 3.0Net exports 3.0 2.0 2.8 -7.0
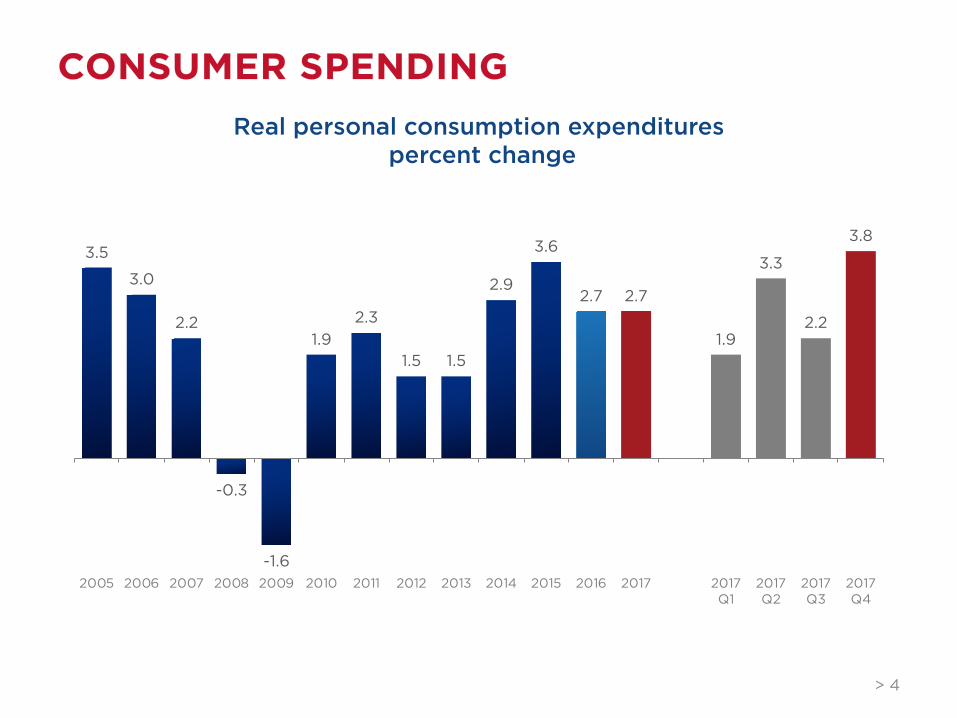
CONSUMER SPENDING
> 4
3.5
3.0
2.2
-0.3
-1.6
1.92.3
1.5 1.5
2.9
3.6
2.7 2.7
1.9
3.3
2.2
3.8
2005 2006 2007 2008 2009 2010 2011 2012 2013 2014 2015 2016 2017 2017Q1
2017Q2
2017Q3
2017Q4
Real personal consumption expenditurespercent change
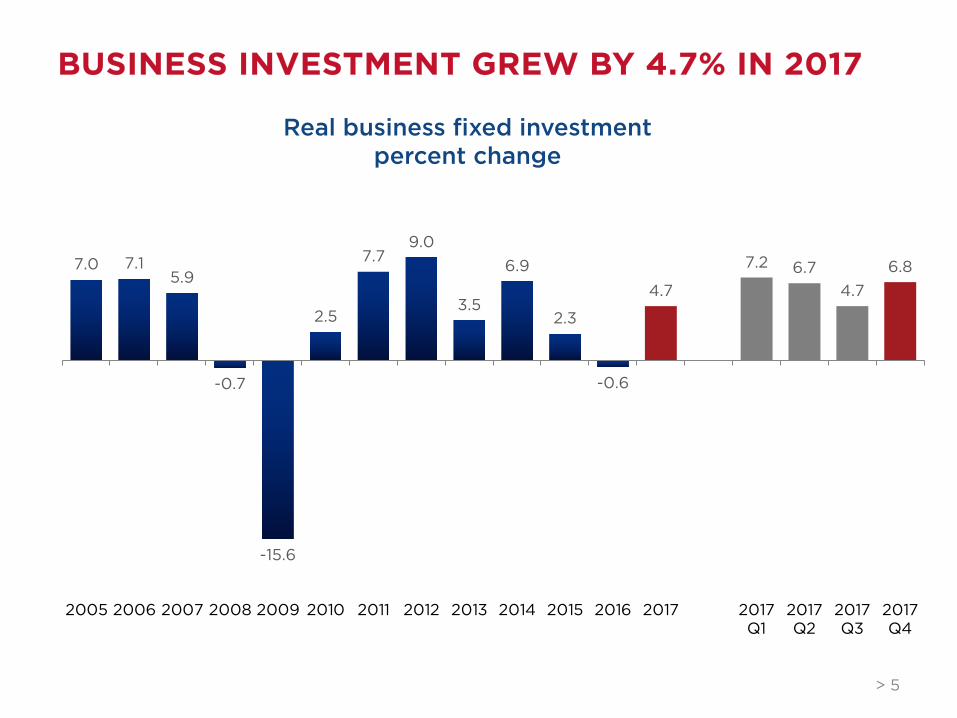
BUSINESS INVESTMENT GREW BY 4.7% IN 2017
> 5
7.0 7.15.9
-0.7
-15.6
2.5
7.79.0
3.5
6.9
2.3
-0.6
4.7
7.2 6.74.7
6.8
-20.0
-15.0
-10.0
-5.0
0.0
5.0
10.0
15.0
2005 2006 2007 2008 2009 2010 2011 2012 2013 2014 2015 2016 2017 2017Q1
2017Q2
2017Q3
2017Q4
Real business fixed investment percent change

NON-RESIDENTIAL INVESTMENT TRENDS
-2.8
> 6
4.4
8.8
10.811.4
2017 Q1 2017 Q2 2017 Q3 2017 Q4
Equipment Percent change
14.8
7.0
1.4
2017 Q1 2017 Q2 2017 Q3 2017 Q4
ConstructionPercent change
5.7
3.7
5.24.5
2017 Q1 2017 Q2 2017 Q3 2017 Q4
IP Products Percent change
-7.0

HOUSING ACTIVITY
> 7
6.6
-7.6
-18.8
-24.0-21.2
-2.5
0.5
13.511.9
3.5
10.2
5.5
1.7
11.1
-7.3-4.7
11.6
2005 2006 2007 2008 2009 2010 2011 2012 2013 2014 2015 2016 2017 2017Q1
2017Q2
2017Q3
2017Q4
Real residential investment Percent Change
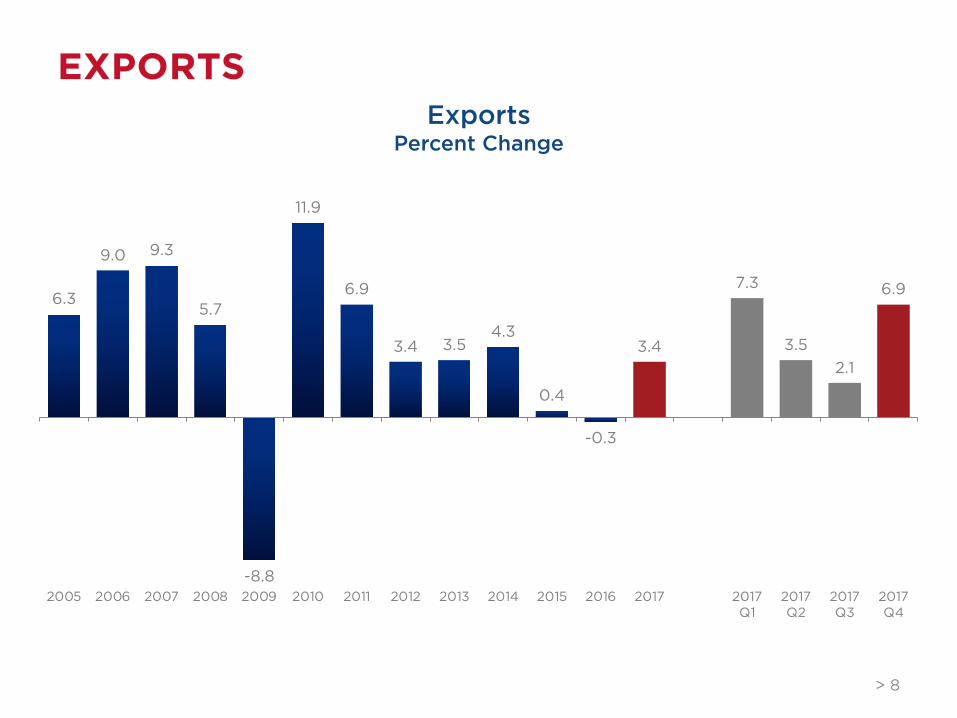
EXPORTS
> 8
6.3
9.0 9.3
5.7
-8.8
11.9
6.9
3.4 3.54.3
0.4
-0.3
3.4
7.3
3.52.1
6.9
2005 2006 2007 2008 2009 2010 2011 2012 2013 2014 2015 2016 2017 2017Q1
2017Q2
2017Q3
2017Q4
Exports Percent Change

INFLATION
> 9
2.2 2.2 2.22.1
1.21.3
1.5
1.9
1.51.6
1.3
1.8
1.5
1.8
0.9
1.3
1.9
2005 2006 2007 2008 2009 2010 2011 2012 2013 2014 2015 2016 2017 2017Q1
2017Q2
2017Q3
2017Q4
Personal Consumption Expenditures Percent Change (excluding food and energy)


![Q4 FY16 Industry Update & Key Performance Highlights [Company Update]](https://img.pdfslide.net/doc/110x75/577c7f491a28abe054a3ead7/q4-fy16-industry-update-key-performance-highlights-company-update.jpg)