Embed Size (px)
Citation preview

Asociația CLUJ IT
Page 1 of 17
Email: [email protected]
Web: clujit.ro
CLUJ IT Cluster - HR Group
HR Needs Assessment Survey Analysis
Document change control
Rev. Issue date Author(s) Revised By Approved By Status Brief description of change
V 0.1 10.01.2014 Catalina Ciubotaru
Alexandra Bayer
Iustinian Sovrea Calin Vaduva Almost Finalized
V 0.2 5.02.2014 Catalina Ciubotaru
Alexandra Bayer
Iustinian Sovrea Calin Vaduva Finalized
Management summary and Press release status: pending
Asociația CLUJ IT
Page 2 of 17
Email: [email protected]
Web: clujit.ro
Table of Contents
1. PREAMBLE ............................................................................................................................... 3
Survey Relevancy ....................................................................................................................................................................... 3
2. SURVEY ANALYSIS .............................................................................................................. 4
Introduction .................................................................................................................................................................................. 4
Companies Data Analysis ...................................................................................................................................................... 4
Companies Evolution* Analysis ......................................................................................................................................... 7
Training Need Assessment Analysis ............................................................................................................................. 11
Private-Academic Partnership ......................................................................................................................................... 13
Expectations from Cluj IT Cluster .................................................................................................................................. 17
Asociația CLUJ IT
Page 3 of 17
Email: [email protected]
Web: clujit.ro
1. Preamble This document is intended to provide an analysis of the HR Needs Assessment survey launched by the Cluj IT
Cluster – HR Committee.
The purpose of this survey is to centralize and analyse human resources needs of IT&C companies in Cluj
area (all companies operating within Cluj-‐Napoca area -‐ including branches).
The survey covers several important aspects, such as
• Resources needs
• Training Needs Assessment
• Academic-‐private partnership (both with University and high schools)
The results, presented only as statistical data are inputs for future Cluster projects in the area of Human
Resources Management. Consider results for October-‐November 2013 (this is the time interval when
companies were asked to respond the survey)
Survey Relevancy Considering the response rate between the companies’ members of Cluj IT Cluster (see below) the question
regarding the survey relevancy was raised.
Reporting the total number of Full Time Employees (FTE) in companies’ members of Cluj IT Cluster that have
answered this survey to the total FTE in all companies’ members, the percent is 76,83%, therefore the
following report can be considered relevant for Cluj IT Cluster, considering Human Resources related issues.
It is not the intention to present this report as relevant for the entire Cluj IT market.
Asociația CLUJ IT
Page 4 of 17
Email: [email protected]
Web: clujit.ro
2. Survey Analysis
Introduction The survey contains 44 questions, which are grouped in six sections.
The 1st milestone targeted the members of the IT Cluster – 18 of them have responded (64% of all
members). The survey is intended to be circulated once a year and the intention is to include other
companies, not part of the Cluster.
The 18 Companies that responded to this survey are:
Altom Consulting, ArtSoft Consult, Arxia, EfectRO, Endava Romania, Evoline, Fortech, Imprezzio Global, ISDC
Romania, Iquest Technologies, Light Soft, NetMatch, Net Brinel, Night Build, Optima Group, PITECH+PLUS,
Recognos Romania, Small Footprint.
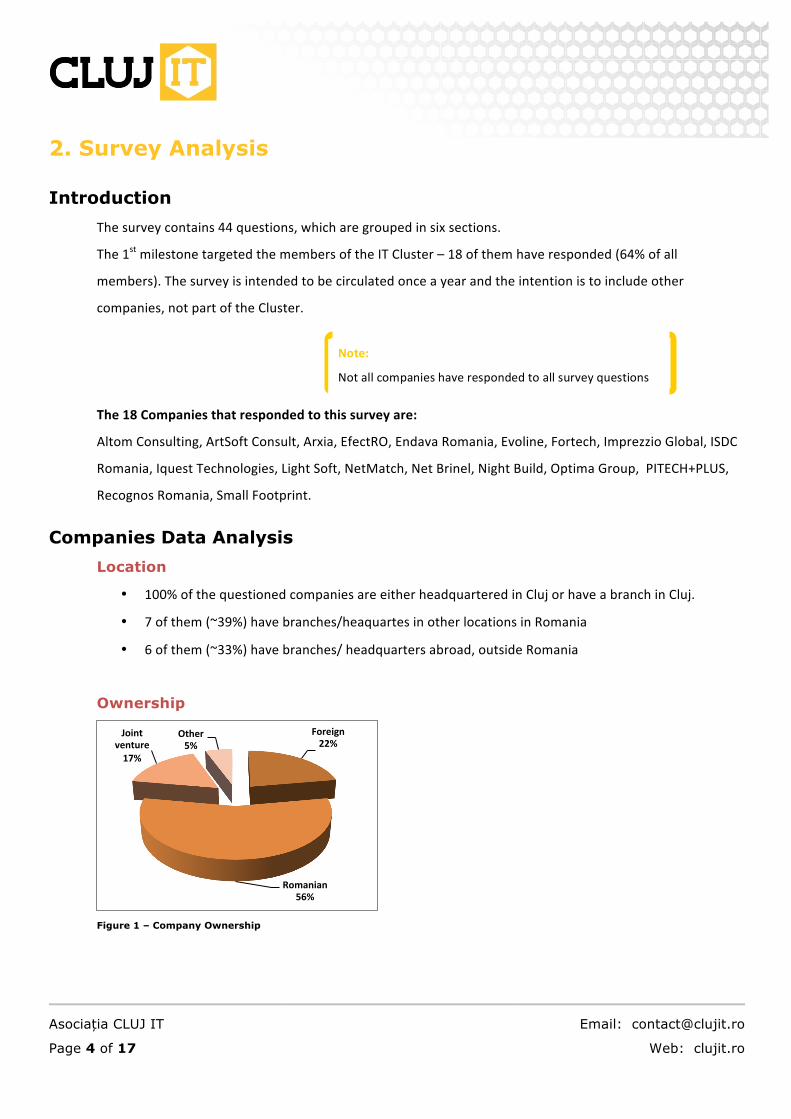
Companies Data Analysis Location
• 100% of the questioned companies are either headquartered in Cluj or have a branch in Cluj.
• 7 of them (~39%) have branches/heaquartes in other locations in Romania
• 6 of them (~33%) have branches/ headquarters abroad, outside Romania
Ownership
Figure 1 – Company Ownership
Foreign 22%
Romanian 56%
Joint venture 17%
Other 5%
Note:
Not all companies have responded to all survey questions
Asociația CLUJ IT
Page 5 of 17
Email: [email protected]
Web: clujit.ro
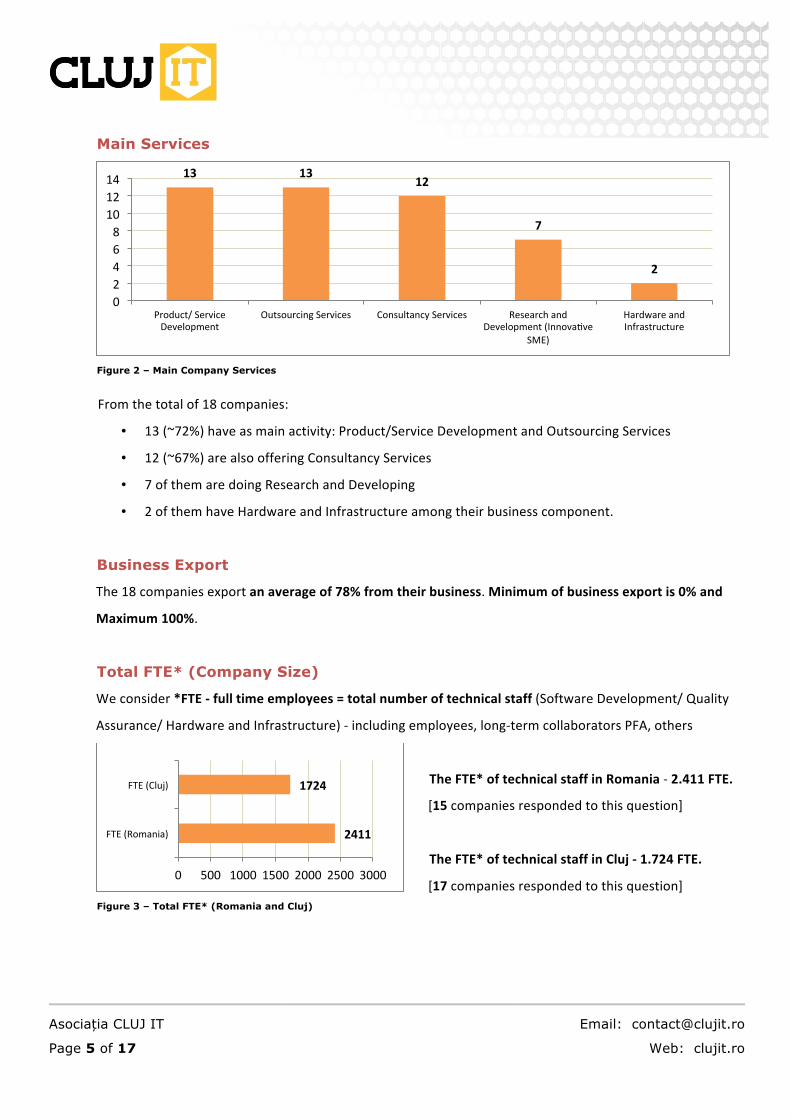
Main Services
Figure 2 – Main Company Services
From the total of 18 companies:
• 13 (~72%) have as main activity: Product/Service Development and Outsourcing Services
• 12 (~67%) are also offering Consultancy Services
• 7 of them are doing Research and Developing
• 2 of them have Hardware and Infrastructure among their business component.
Business Export
The 18 companies export an average of 78% from their business. Minimum of business export is 0% and
Maximum 100%.
Total FTE* (Company Size)
We consider *FTE -‐ full time employees = total number of technical staff (Software Development/ Quality
Assurance/ Hardware and Infrastructure) -‐ including employees, long-‐term collaborators PFA, others
Figure 3 – Total FTE* (Romania and Cluj)
The FTE* of technical staff in Romania -‐ 2.411 FTE.
[15 companies responded to this question]
The FTE* of technical staff in Cluj -‐ 1.724 FTE.
[17 companies responded to this question]
13 13 12
7
2
0 2 4 6 8 10 12 14
Product/ Service Development
Outsourcing Services Consultancy Services Research and Development (Innovajve
SME)
Hardware and Infrastructure
2411
1724
0 500 1000 1500 2000 2500 3000
FTE (Romania)
FTE (Cluj)
Asociația CLUJ IT
Page 6 of 17
Email: [email protected]
Web: clujit.ro
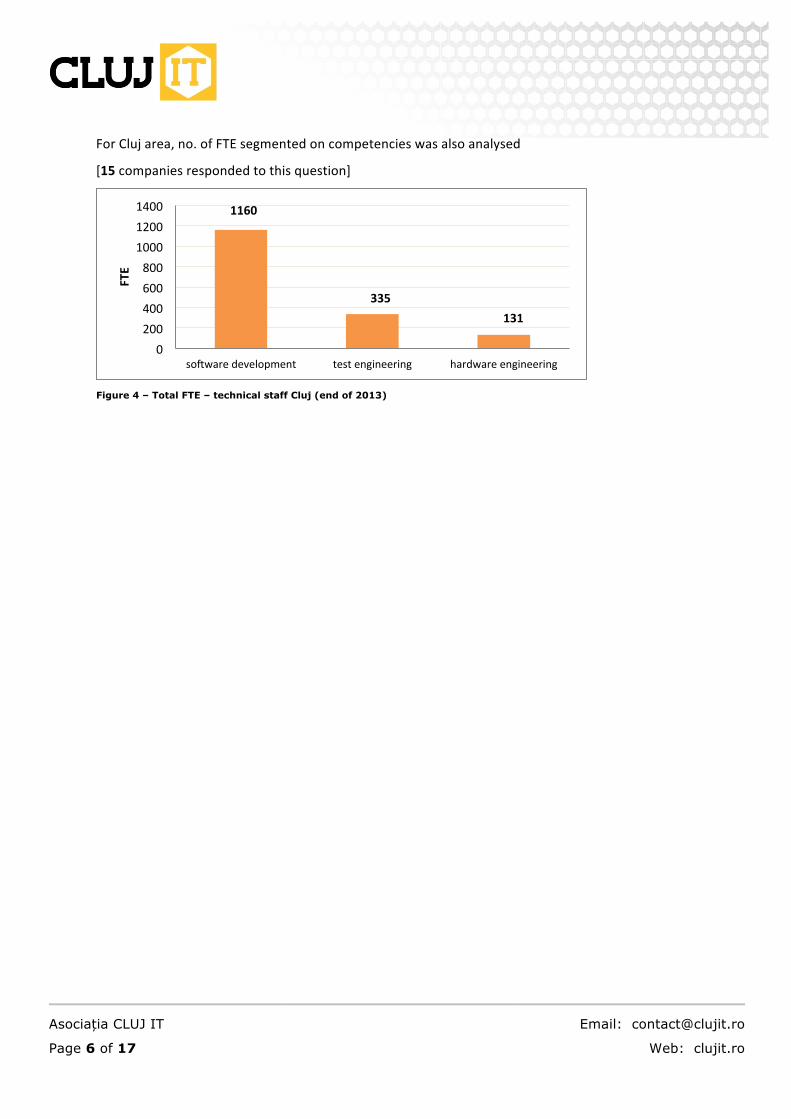
For Cluj area, no. of FTE segmented on competencies was also analysed
[15 companies responded to this question]
Figure 4 – Total FTE – technical staff Cluj (end of 2013)
1160
335 131
0 200 400 600 800 1000 1200 1400
sokware development test engineering hardware engineering
FTE

Asociația CLUJ IT
Page 7 of 17
Email: [email protected]
Web: clujit.ro
Companies Evolution* Analysis Section II of the survey focuses on the company evolution – looking at evolution during the last 5 years
(2008-‐2012) and their forecast in team growth for the next 5 years (2013-‐2017).
*Company evolution is defined as percentage of increase/decrease of FTE* (technical staff).
Evolution 2008-2012
FTE evolution % Cluj Locations 2008 2009 2010 2011 2012 Total FTE (now – Nov. 2013) software development 21% 11% 24% 24% 15% 1160 test engineering 6% 51% 47% 11% 12% 335 hardware engineering 1% 14% 13% 7% 5% 131 [13 companies responded to this question]
Figure 5 – Average % of increase/decrease number of people (FTE*) during the last 5 years
Forecast growth 2013-2017
Companies were asked to evaluate company’s evolutions for the next 5 years. An average of their growth is
presented in the following table and charts, for both Romania and Cluj.
Forecast for Romania
[13 companies responded to this question]
Year Average % FTE* 2013 19% 2.411 2014 19% 2.869 2015 16% 3.328 2016 15% 3.827 2017 14% 4.363
Forecast for Cluj
[16 companies responded to this question]
Year Average % FTE 2013 19% 1.724 2014 16% 2.000 2015 15% 2.300 2016 14% 2.622 2017 14% 2.989
21%
11%
24% 24%
15%
6%
51% 47%
11% 12%
1%
14% 13%
7% 5%
0%
10%
20%
30%
40%
50%
60%
2008 2009 2010 2011 2012
sokware development
test engineering
hardware engineering
Asociația CLUJ IT
Page 8 of 17
Email: [email protected]
Web: clujit.ro
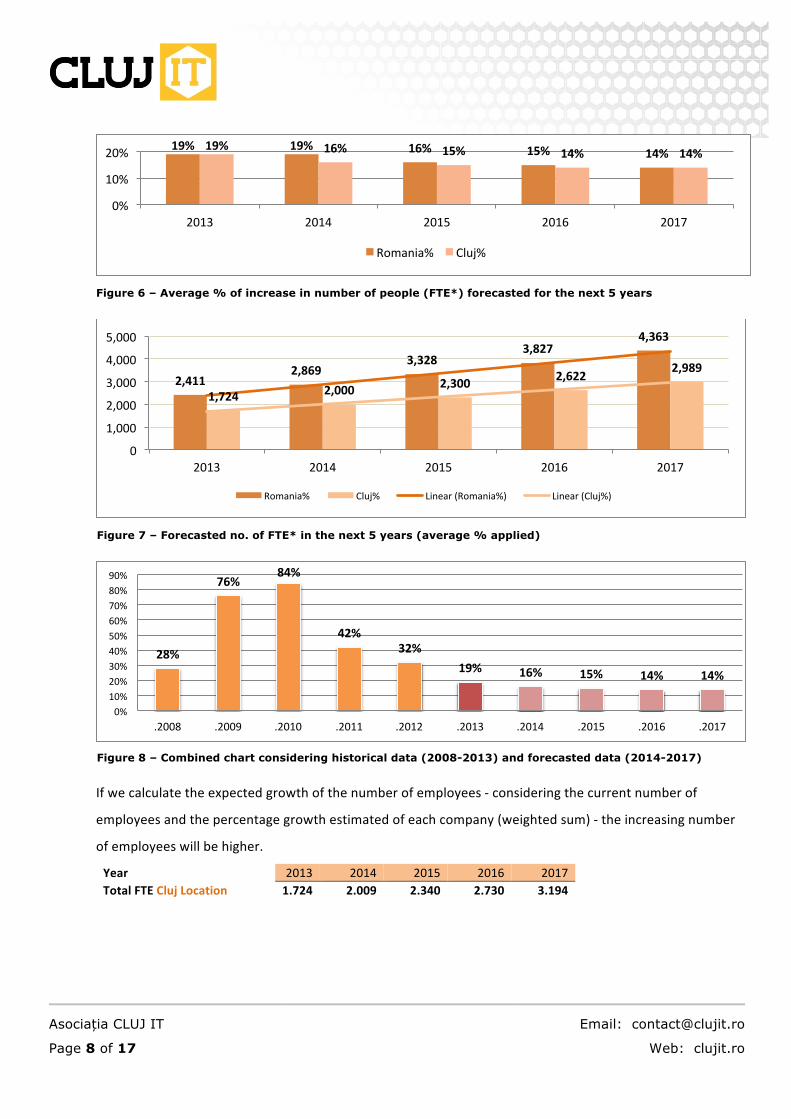
Figure 6 – Average % of increase in number of people (FTE*) forecasted for the next 5 years
Figure 7 – Forecasted no. of FTE* in the next 5 years (average % applied)
Figure 8 – Combined chart considering historical data (2008-2013) and forecasted data (2014-2017)
If we calculate the expected growth of the number of employees -‐ considering the current number of
employees and the percentage growth estimated of each company (weighted sum) -‐ the increasing number
of employees will be higher.
Year 2013 2014 2015 2016 2017 Total FTE Cluj Location 1.724 2.009 2.340 2.730 3.194
19% 19% 16% 15% 14% 19% 16% 15% 14% 14%
0%
10%
20%
2013 2014 2015 2016 2017
Romania% Cluj%
2,411 2,869
3,328 3,827
4,363
1,724 2,000 2,300 2,622 2,989
0
1,000
2,000
3,000
4,000
5,000
2013 2014 2015 2016 2017
Romania% Cluj% Linear (Romania%) Linear (Cluj%)
28%
76% 84%
42% 32%
19% 16% 15% 14% 14%
0% 10% 20% 30% 40% 50% 60% 70% 80% 90%
.2008 .2009 .2010 .2011 .2012 .2013 .2014 .2015 .2016 .2017

Asociația CLUJ IT
Page 9 of 17
Email: [email protected]
Web: clujit.ro
Figure 9 - Forecasted no. of FTE* in the next 5 years – Cluj – Napoca (weighted sum)
Current Job Oppenings
In Nov-‐2013, the companies questioned had a total of 141 job opening in Cluj, 89 for SD, 24 for QA and 28
for Hardware specialists.
Recruitment Information
It was interesting to reflect if Cluj acts as a regional centre that attracts workforce in the IT field. The survey
evaluated if the companies have relocated technical staff in the past 2 years (2012-‐2013).
10 companies answered positive, with a total of 48 persons relocated from outside Cluj Area to Cluj Offices
(represents ~3% of the total no. of FTE*). The maximum number of staff relocated to a single company was
12% of the total no. of FTE*.
Major cities targeted to relocate technical staff are: Bucharest, Sibiu, Oradea, Targu Mures, Piatra Neamt,
Suceava, Brasov, Iasi, Timisoara, Medias and the technical specialties varies from: .NET, Java, Web and
Mobile.
One company mentioned also relocated staff from Brussels and Paris.
12 companies (~67%) have encountered difficulties and challenges in attracting and retaining workforce
during the last years.
Top identified problems are:
1. not enough/ lack of specialized & experienced IT people on the Cluj workforce Market
2. not enough IT Specialists graduate from IT Universities – lack of technical & practical knowledge
(structure thinking) and soft-‐skills (communication, leadership, etc) of IT graduates
3. high salaries increase/ expectations over the last 3 years (salary expectation vs. experience not-‐
balanced report) – considering market needs and diminished offers
4. competitors companies working with PFA contracts – paying from abroad directly to the PFA means
a higher income for developers
1,724 2,009 2,340
2,730 3,194
0
1,000
2,000
3,000
4,000
2013 2014 2015 2,016 2017
FTE

Asociația CLUJ IT
Page 10 of 17
Email: [email protected]
Web: clujit.ro
5. Headhunting, New subsidiaries of foreign companies have been opened in Cluj area in the last few
years
6. Limited programs for continuous learning for IT professionals
Therefore, the next question is related to companies’ interests in relocating/ extending business in other
location outside Cluj. 7 of 18 have answered positively, out of 4 interested in other locations in Romania, and
3 interested in going abroad.

Asociația CLUJ IT
Page 11 of 17
Email: [email protected]
Web: clujit.ro
Training Need Assessment Analysis Companies were asked to provide information regarding their technology focus in the next 2 years.
The results can be seen in the following table. Not all the 18 companies have provided data to this question.
Technology Focus % of companies interested in technology Average procent Java 50% (9 out of 18) 13.80% .Net 66% (12 out of 18) 31.10% C/C++ 33% (6 out of 18) 2.10% PHP/Front-‐end 44% (8 out of 18) 11.20% Mobile 61% (11 out of 18) 5.80% QA (Testing) 61% (11 out of 18) 17.30% Hardware 38% (5 out of 18) 4.70% Medical/eHealth 16% (3 out of 18) 7.60% Other 44% (8 out of 18) 6.40%
If considering the technological focus for the next 2 years correlated with companies estimated growth a
forecast regarding FTE technology focus is presented in the chart below.
Figure 10 - FTE forecast regarding technological area focus for the next 2 years
When questioned regarding the preferred training approach, the companies identified the following:
1. In-‐house training with internal suppliers ~94%
2. On the job training ~89%
3. In-‐house training with external suppliers or external trainings ~61%
Java .Net C/C++ PHP/Front-‐end Mobile QA (Test) Hardware Medical/
eHealth Other
Series1 101 125 6 60 38 125 47 7 49
101
125
6
60
38
125
47
7
49
0
20
40
60
80
100
120
140
FTE
Asociația CLUJ IT
Page 12 of 17
Email: [email protected]
Web: clujit.ro
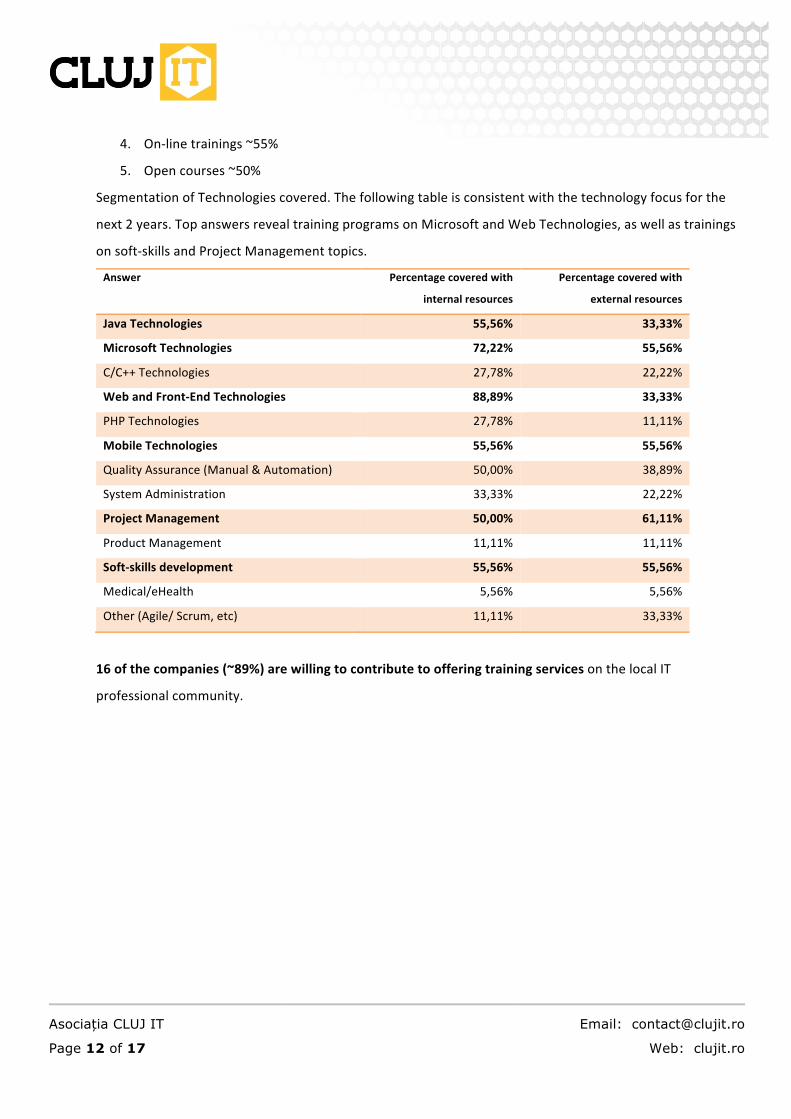
4. On-‐line trainings ~55%
5. Open courses ~50%
Segmentation of Technologies covered. The following table is consistent with the technology focus for the
next 2 years. Top answers reveal training programs on Microsoft and Web Technologies, as well as trainings
on soft-‐skills and Project Management topics.
Answer Percentage covered with
internal resources
Percentage covered with
external resources
Java Technologies 55,56% 33,33%
Microsoft Technologies 72,22% 55,56%
C/C++ Technologies 27,78% 22,22%
Web and Front-‐End Technologies 88,89% 33,33%
PHP Technologies 27,78% 11,11%
Mobile Technologies 55,56% 55,56%
Quality Assurance (Manual & Automation) 50,00% 38,89%
System Administration 33,33% 22,22%
Project Management 50,00% 61,11%
Product Management 11,11% 11,11%
Soft-‐skills development 55,56% 55,56%
Medical/eHealth 5,56% 5,56%
Other (Agile/ Scrum, etc) 11,11% 33,33%
16 of the companies (~89%) are willing to contribute to offering training services on the local IT
professional community.
Asociația CLUJ IT
Page 13 of 17
Email: [email protected]
Web: clujit.ro
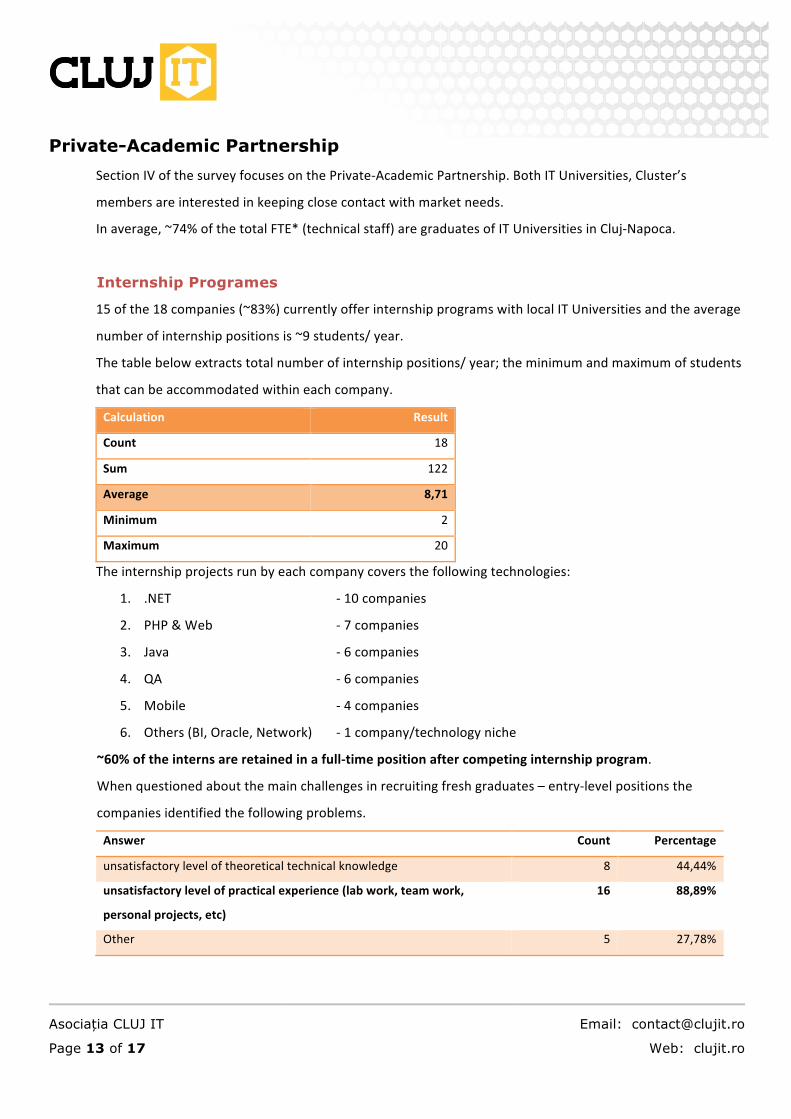
Private-Academic Partnership Section IV of the survey focuses on the Private-‐Academic Partnership. Both IT Universities, Cluster’s
members are interested in keeping close contact with market needs.
In average, ~74% of the total FTE* (technical staff) are graduates of IT Universities in Cluj-‐Napoca.
Internship Programes
15 of the 18 companies (~83%) currently offer internship programs with local IT Universities and the average
number of internship positions is ~9 students/ year.
The table below extracts total number of internship positions/ year; the minimum and maximum of students
that can be accommodated within each company.
Calculation Result
Count 18
Sum 122
Average 8,71
Minimum 2
Maximum 20
The internship projects run by each company covers the following technologies:
1. .NET -‐ 10 companies
2. PHP & Web -‐ 7 companies
3. Java -‐ 6 companies
4. QA -‐ 6 companies
5. Mobile -‐ 4 companies
6. Others (BI, Oracle, Network) -‐ 1 company/technology niche
~60% of the interns are retained in a full-‐time position after competing internship program.
When questioned about the main challenges in recruiting fresh graduates – entry-‐level positions the
companies identified the following problems.
Answer Count Percentage
unsatisfactory level of theoretical technical knowledge 8 44,44%
unsatisfactory level of practical experience (lab work, team work,
personal projects, etc)
16 88,89%
Other 5 27,78%
Asociația CLUJ IT
Page 14 of 17
Email: [email protected]
Web: clujit.ro
Open answers revealed also:
• Lack of business awareness and soft skills, structured thinking
• Sometimes, lack of work ethics and professionalism
• Inadequate self-‐evaluation
• Low level of loyalty
Academic curricula
Companies were questioned about the academic curricula, if it fit the today’s market needs. Several topics
were marked in order to be bettered addressed in order gain the competencies needed by the job market.
Regarding technology focus, companies suggested introducing:
• lab and practical project work on Microsoft Technologies [2 companies/18]
• Data Bases -‐ the knowledge is usually very basic or lacking, no hands on experience [2
companies/18]
• Mobile Technologies [2 companies/18]
• New Web Technologies [3 companies/18]
• Software Testing (suggestion: course equivalent to the one held by Cem Kaner at Florida Institute of
Technology: http://bbst.info) [3 companies/18]
• BI [1 company/18]
• e-‐Health [1 company/18]
• Embedded Programming [1 company/18]
• User oriented development [1 company/18]
• Integrated apps [1 company/18]
Regarding project development, companies suggested introducing:
• Software Development Process -‐ Tools and Methodologies [5 companies/18]
• Agile/ SCRUM Development [4 companies/18]
• Business Analysis and Customer requirements [2 companies/18]
• Project Management [4 companies/18]
Regarding soft skills development, companies suggested introducing:
• Communication – assertive communication [4 companies/18]
• Conflict Management [1 company/18]
• Client Interaction and client orientation [1 company/18]

Asociația CLUJ IT
Page 15 of 17
Email: [email protected]
Web: clujit.ro
• A good course on how you should analyse a problem, how you write a research plan and express
yourself in a formal way [1 company/18]
Collaboration with University trainers
Universities assistants and lecturers can act as a pool of trainers for the local IT market. 4 out of 16
companies have answered positively about a previous collaboration with trainers from the University and 14
out of 16 have answered positively when asked about a potential collaboration.
Figure 11 – Previous Collaborations with trainers
from the local Universities
Figure 12 – Interest in collaboration with trainers
from the local Universities
Technological areas that can be covered:
• .NET Technologies [5 companies/18]
• Java Technologies [4 companies/18]
• Web Development (e.g. JavaScript frameworks: Node JS, Angular JS) [3 companies/18]
• Data bases [2 companies/18]
• Cloud computing [2 companies/18]
• Project Management/ Agile [2 companies/18]
• Automation Testing [1 company/18]
• Sitecore [1 company/18]
• UI/UX [1 company/18]
• C++ [1 company/18]
• Object Oriented Programming [1 company/18]
• Embedded programming [1 company/18]
• Distributed systems programming [1 company/18]
• Windows Administration-‐based services [1 company/18]
Yes (Y) 25%
No (N) 75%
Yes (Y) 78%
No (N) 22%

Asociația CLUJ IT
Page 16 of 17
Email: [email protected]
Web: clujit.ro
Other collaborative projects
When questioned about other type of collaborative projects, the results are the following.
Companies that answered positively and have a closer relationship with the University might share best
practices within the Cluster Group and new collaborative projects can be developed.
[16 companies responded to this question] [18 companies responded to this question]
Figure 13 – Companies offering scholarships
Figure 14 – Companies that run research projects in
collaboration with local IT Universities
Companies mentioned collaboration on Java, Oracle, Microsoft -‐.NET, SharePoint, Medical Image Processing, Data mining, Smart city, Domotics.
[15 companies responded to this question] [16 companies responded to this question]
Figure 15 – Companies that run educational projects
in collaboration with local IT Universities
Figure 16 – Companies that run educational projects
in collaboration with local high-schools
Yes (Y) 19%
No (N) 81%
Yes (Y) 28%
No (N) 72%
Yes (Y) 40%
No (N) 60%
Yes (Y) 12%
No (N) 88%

Asociația CLUJ IT
Page 17 of 17
Email: [email protected]
Web: clujit.ro
Expectations from Cluj IT Cluster Section V addresses companies’ expectation from Cluj IT Cluster. A set of additional question was developed
for companies that are not members of the Cluster in case the survey will be implemented outside Cluster
group.
Regarding the priorities in relationship with the Cluster, the statistics are the following.
Answer Count Percentage
support and assistance for HR projects and initiatives 14 77,78%
support and promoting Cluj IT industry opportunities 16 88,89%
support and assistance in relationship with local and national authorities 10 55,56%
support and assistance for research, development and innovation projects 11 61,11%
Other 2 11,11%
Open responses include:
• entrepreneurship, entrepreneurship, open standards, open source, web accessibility [1 company/18]
• Joint training/conferences on lower prices than one could do alone [1 company/18] Regarding the interest in HR Projects that can be further developed by Cluj IT Cluster, the statistics are the
following.
Answer Count Percentage
projects targeting increasing number of IT specialists on the local market 15 83,33%
support and assistance in collaboration with local IT Universities 13 72,22%
support for training activities 15 83,33%
Other 2 11,11%
Open responses include:
• Increase quality of the resources pool [1 company/18] • Career advising and IT skills improvement in high-‐schools [1 company/18]