Embed Size (px)
Citation preview
www.iasta.com Copyright © Iasta, All Rights Reserved
Using Spend Analysis to Smooth the
M&A Path4 Steps to Consolidate Your Purchasing Power

Copyright © Iasta, All Rights Reserved
Speakers
Copyright © Iasta, All Rights Reserved
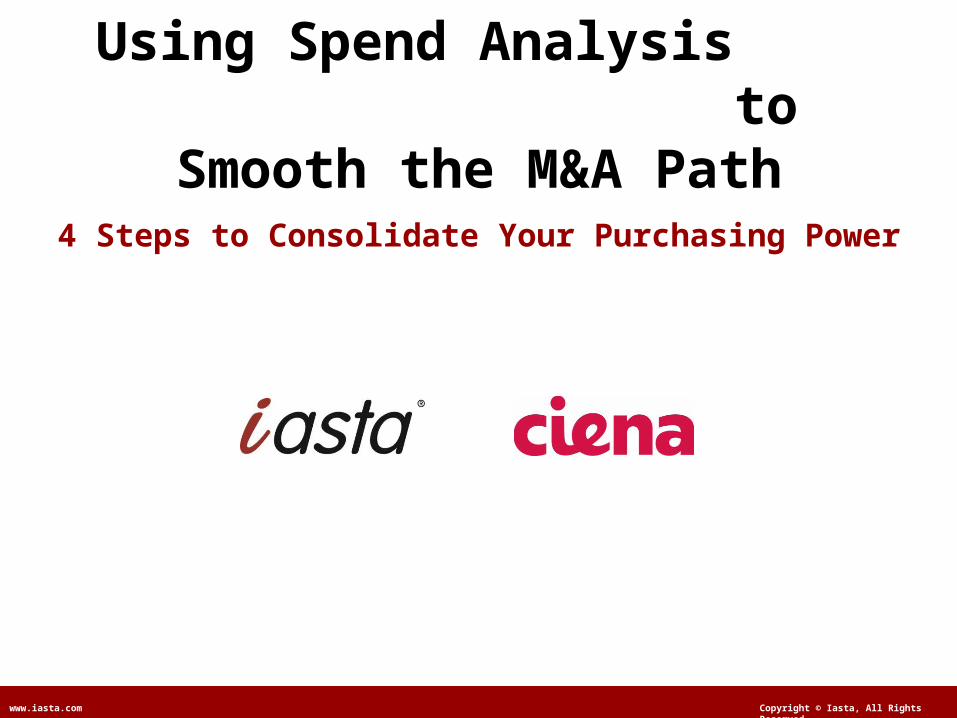
Audience Profile
Has your company been involved in or have plans for a M&A within the next 12 months?
What's the biggest Spend Management challenge you face?
Cons
olid
ation
& m
gnt o
f sup
plier
info
Cont
ract
com
plian
ce/ h
igh m
aver
ick sp
end
Spen
d dat
a ana
lysis/
repo
rting
Man
ual R
FX cr
eation
/ sup
plier
analy
sis
Spen
d visi
bilit
y/ gr
anul
arity
= 71%
© Ciena Confidential and Proprietary
Deploying Spend Analytics in a Post-Merger Environment
Seth BalsamDirector, Global IT Procurement
September 21st, 2011
© Ciena Confidential and Proprietary
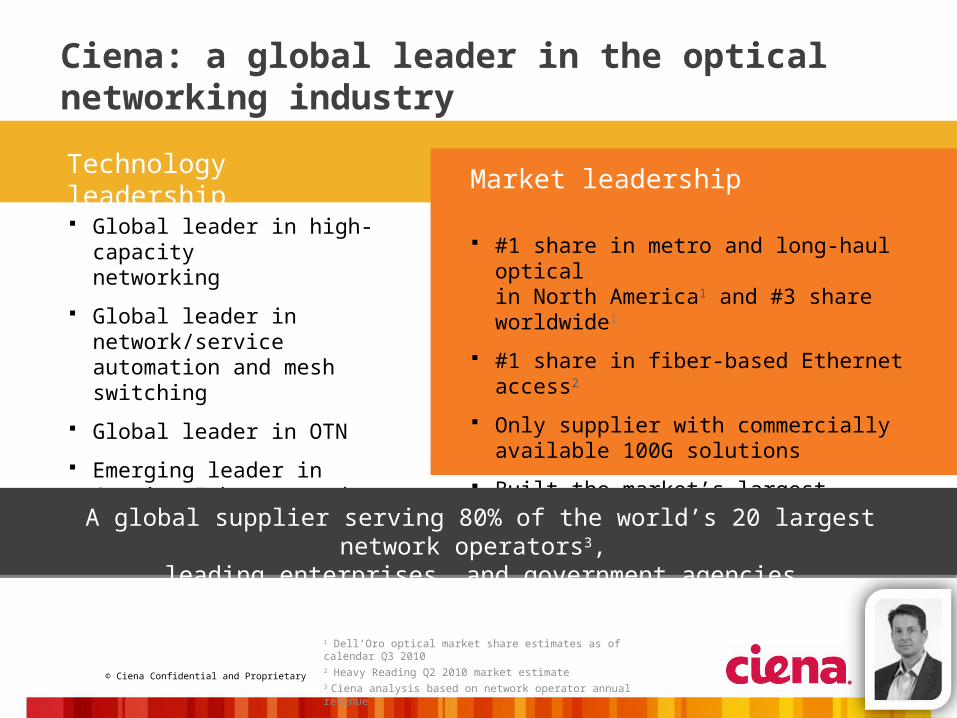
Ciena: a global leader in the optical networking industry
Global leader in high-capacity networking
Global leader in network/service automation and mesh switching
Global leader in OTN
Emerging leader in Carrier Ethernet and converged packet-optical and networking
Technology leadership
#1 share in metro and long-haul optical in North America1 and #3 share worldwide1
#1 share in fiber-based Ethernet access2
Only supplier with commercially available 100G solutions
Built the market’s largest optical mesh networks
Market leadership
A global supplier serving 80% of the world’s 20 largest network operators3, leading enterprises, and government agencies
1 Dell’Oro optical market share estimates as of calendar Q3 20102 Heavy Reading Q2 2010 market estimate3 Ciena analysis based on network operator annual revenue
© Ciena Confidential and Proprietary
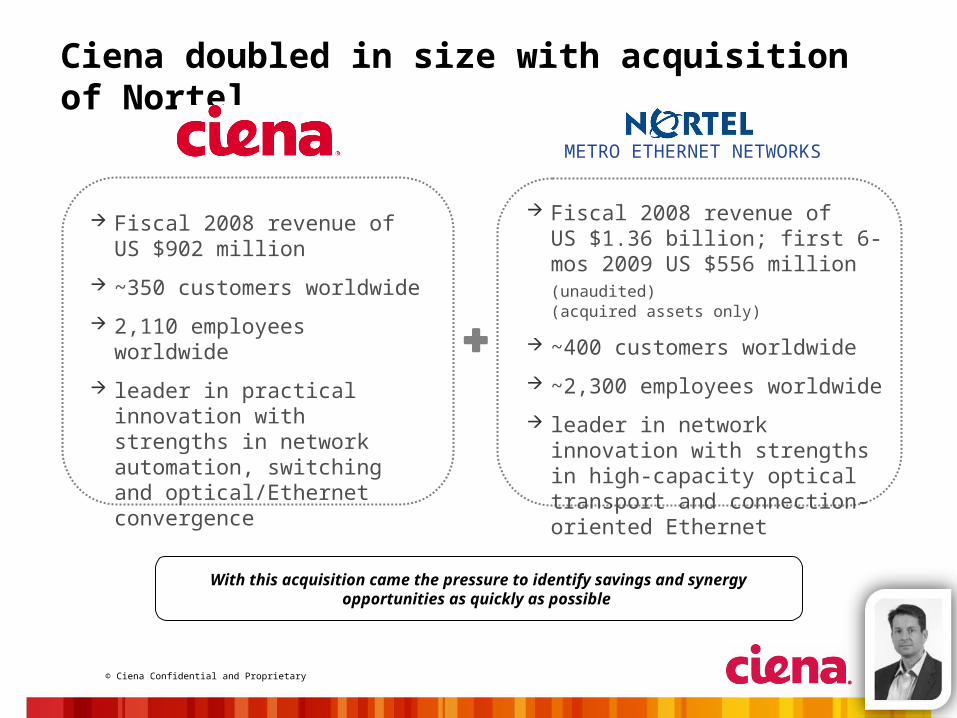
Ciena doubled in size with acquisition of Nortel
With this acquisition came the pressure to identify savings and synergy opportunities as quickly as possible
METRO ETHERNET NETWORKS
Fiscal 2008 revenue of US $902 million
~350 customers worldwide
2,110 employees worldwide
leader in practical innovation with strengths in network automation, switching and optical/Ethernet convergence
Fiscal 2008 revenue of US $1.36 billion; first 6-mos 2009 US $556 million (unaudited) (acquired assets only)
~400 customers worldwide
~2,300 employees worldwide
leader in network innovation with strengths in high-capacity optical transport and connection-oriented Ethernet
© Ciena Confidential and Proprietary
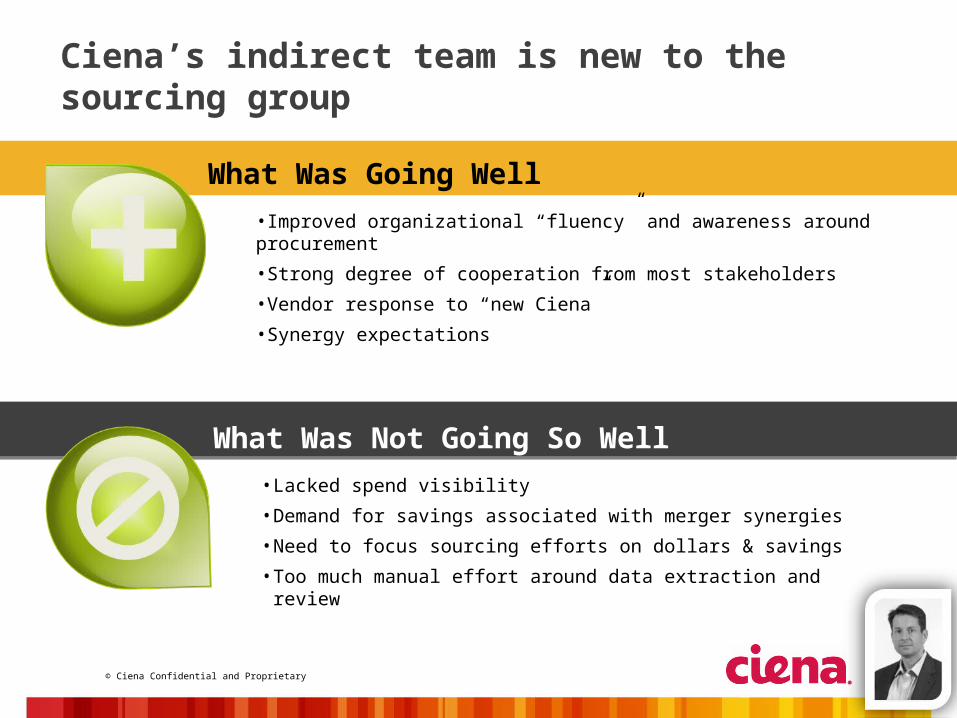
Ciena’s indirect team is new to the sourcing group
What Was Going Well
•Improved organizational “fluency” and awareness around procurement
•Strong degree of cooperation from most stakeholders
•Vendor response to “new Ciena”
•Synergy expectations
What Was Not Going So Well
• Lacked spend visibility
• Demand for savings associated with merger synergies
• Need to focus sourcing efforts on dollars & savings
• Too much manual effort around data extraction and review
© Ciena Confidential and Proprietary
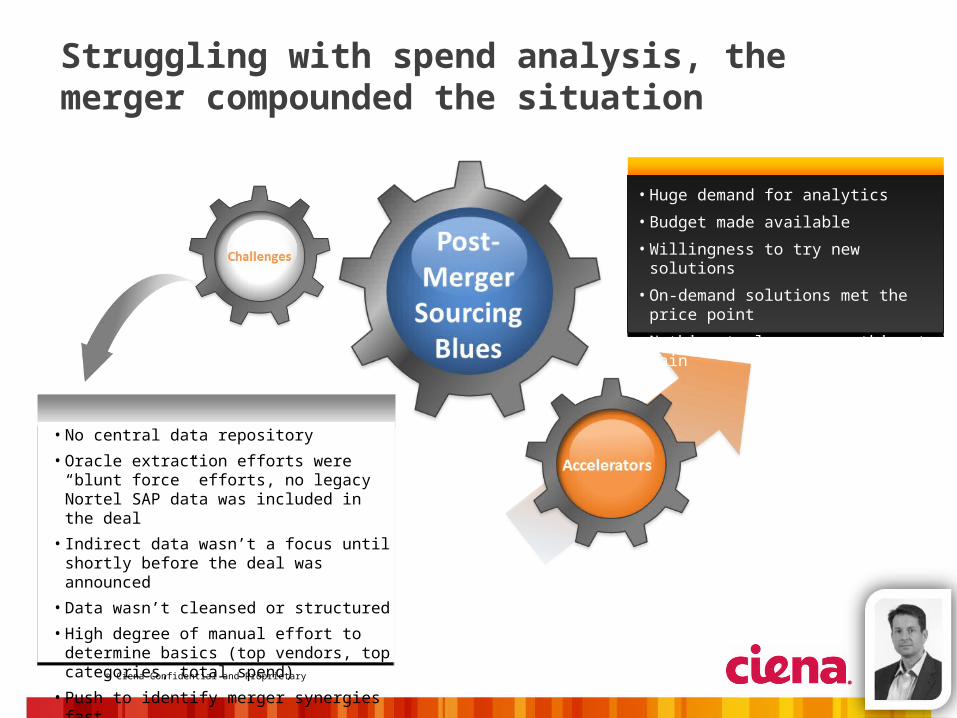
Struggling with spend analysis, the merger compounded the situation
• No central data repository
• Oracle extraction efforts were “blunt force” efforts, no legacy Nortel SAP data was included in the deal
• Indirect data wasn’t a focus until shortly before the deal was announced
• Data wasn’t cleansed or structured
• High degree of manual effort to determine basics (top vendors, top categories, total spend)
• Push to identify merger synergies fast
• Huge demand for analytics
• Budget made available
• Willingness to try new solutions
• On-demand solutions met the price point
• Nothing to lose, everything to gain
© Ciena Confidential and Proprietary
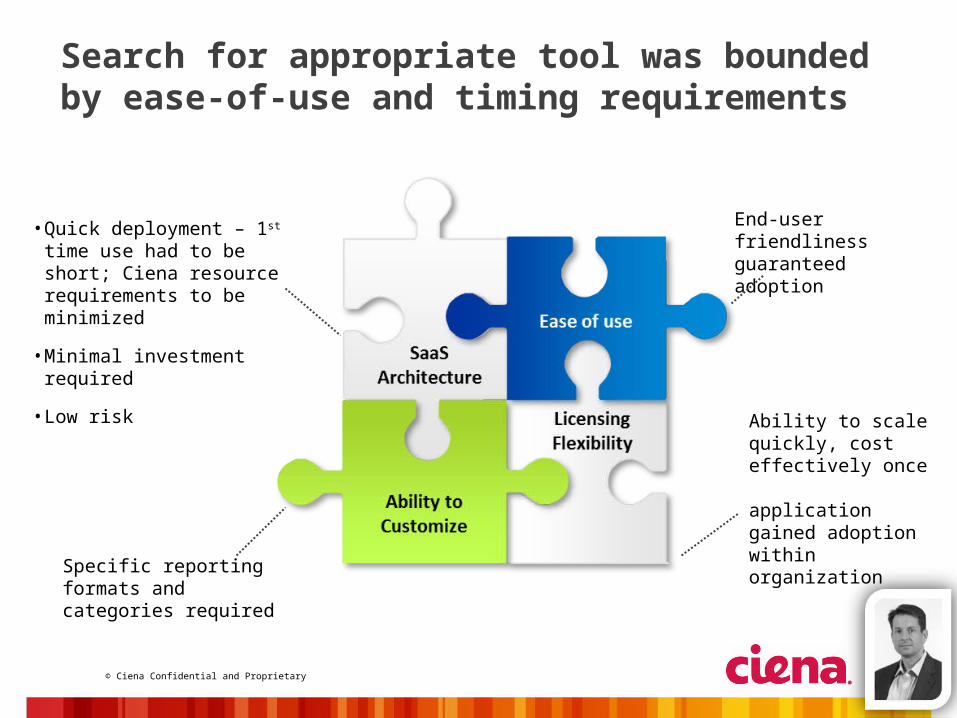
Search for appropriate tool was bounded by ease-of-use and timing requirements
Specific reporting formats and categories required
Ability to scale quickly, cost effectively once application gained adoption within organization
End-user friendliness guaranteed adoption
• Quick deployment – 1st time use had to be short; Ciena resource requirements to be minimized
• Minimal investment required
• Low risk
© Ciena Confidential and Proprietary
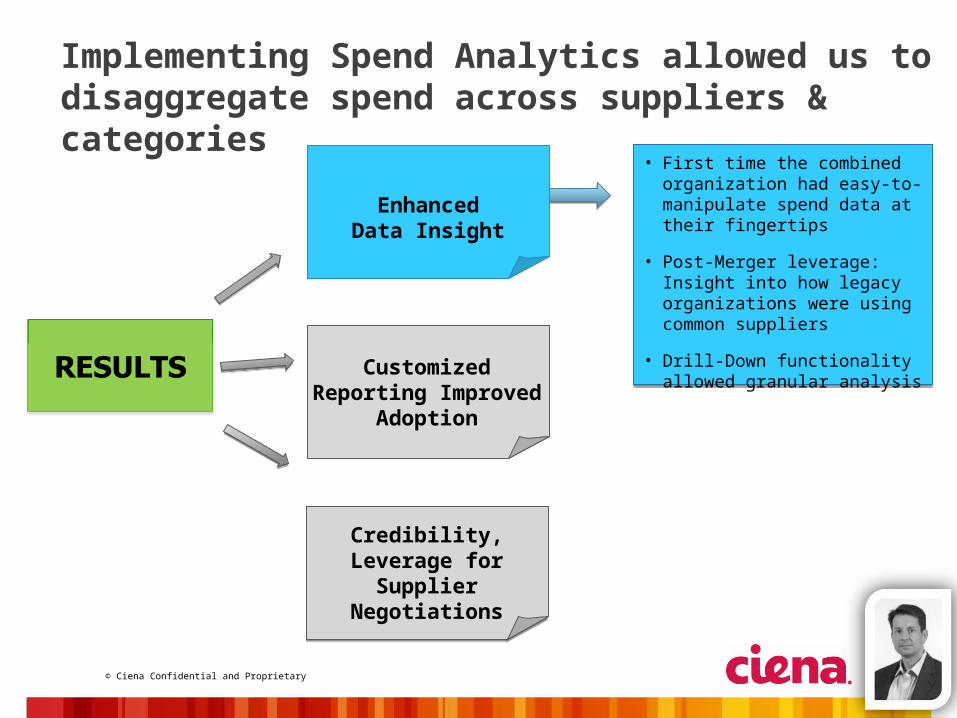
Credibility, Leverage for
Supplier Negotiations
Enhanced Data Insight
• First time the combined organization had easy-to-manipulate spend data at their fingertips
• Post-Merger leverage: Insight into how legacy organizations were using common suppliers
• Drill-Down functionality allowed granular analysis
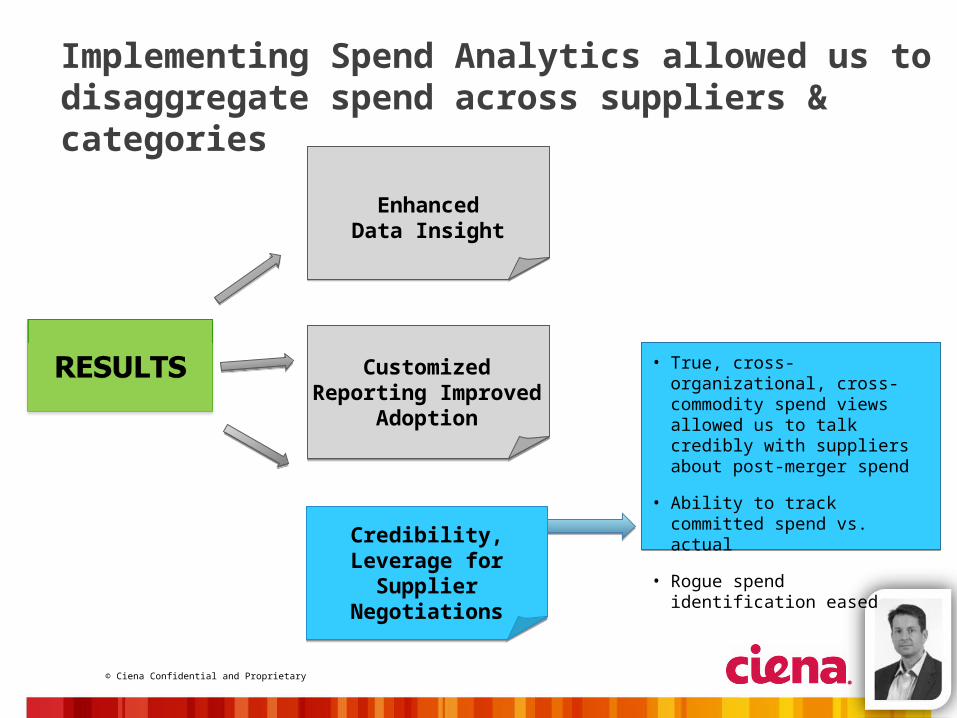
Implementing Spend Analytics allowed us to disaggregate spend across suppliers & categories
Customized Reporting
Improved Adoption
© Ciena Confidential and Proprietary
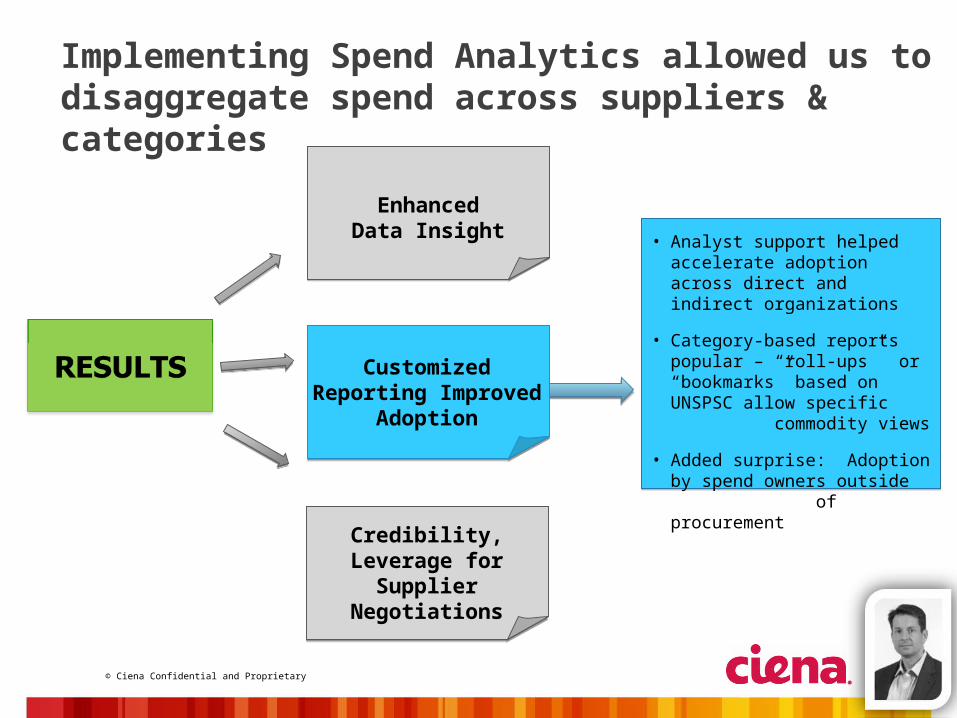
Credibility, Leverage for
Supplier Negotiations
Enhanced Data Insight • Analyst support helped
accelerate adoption across direct and indirect organizations
• Category-based reports popular – “roll-ups” or “bookmarks” based on UNSPSC allow specific commodity views
• Added surprise: Adoption by spend owners outside of procurement
Implementing Spend Analytics allowed us to disaggregate spend across suppliers & categories
Customized Reporting
Improved Adoption
© Ciena Confidential and Proprietary
Credibility, Leverage for
Supplier Negotiations
Enhanced Data Insight
• True, cross-organizational, cross-commodity spend views allowed us to talk credibly with suppliers about post-merger spend
• Ability to track committed spend vs. actual
• Rogue spend identification eased
Implementing Spend Analytics allowed us to disaggregate spend across suppliers & categories
Customized Reporting
Improved Adoption
© Ciena Confidential and Proprietary
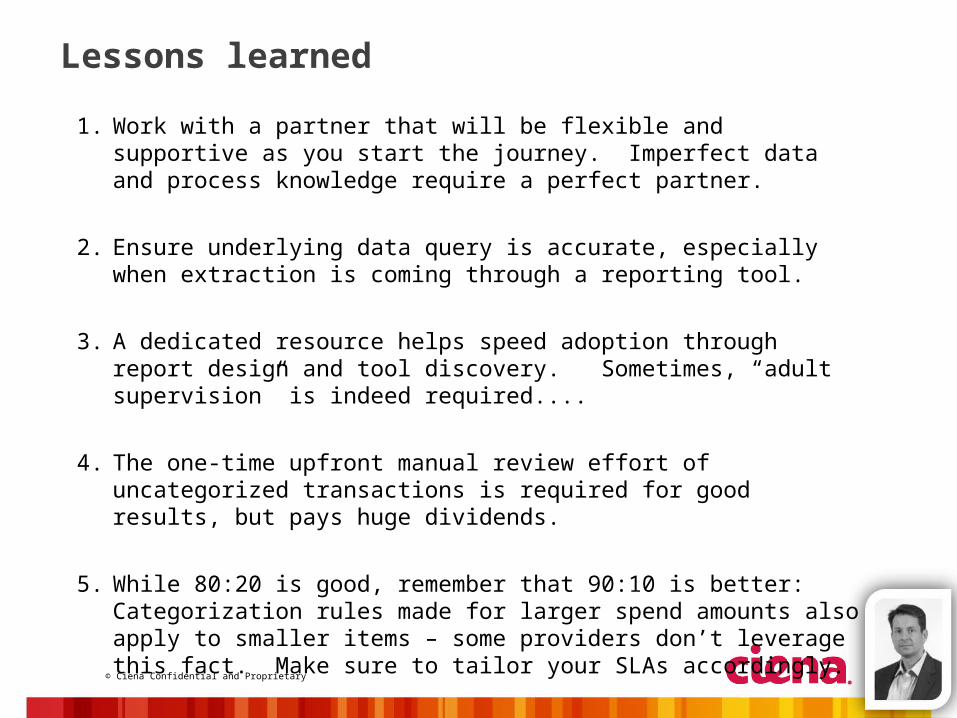
Lessons learned
1. Work with a partner that will be flexible and supportive as you start the journey. Imperfect data and process knowledge require a perfect partner.
2. Ensure underlying data query is accurate, especially when extraction is coming through a reporting tool.
3. A dedicated resource helps speed adoption through report design and tool discovery. Sometimes, “adult supervision” is indeed required....
4. The one-time upfront manual review effort of uncategorized transactions is required for good results, but pays huge dividends.
5. While 80:20 is good, remember that 90:10 is better: Categorization rules made for larger spend amounts also apply to smaller items – some providers don’t leverage this fact. Make sure to tailor your SLAs accordingly.
Copyright © Iasta, All Rights Reserved
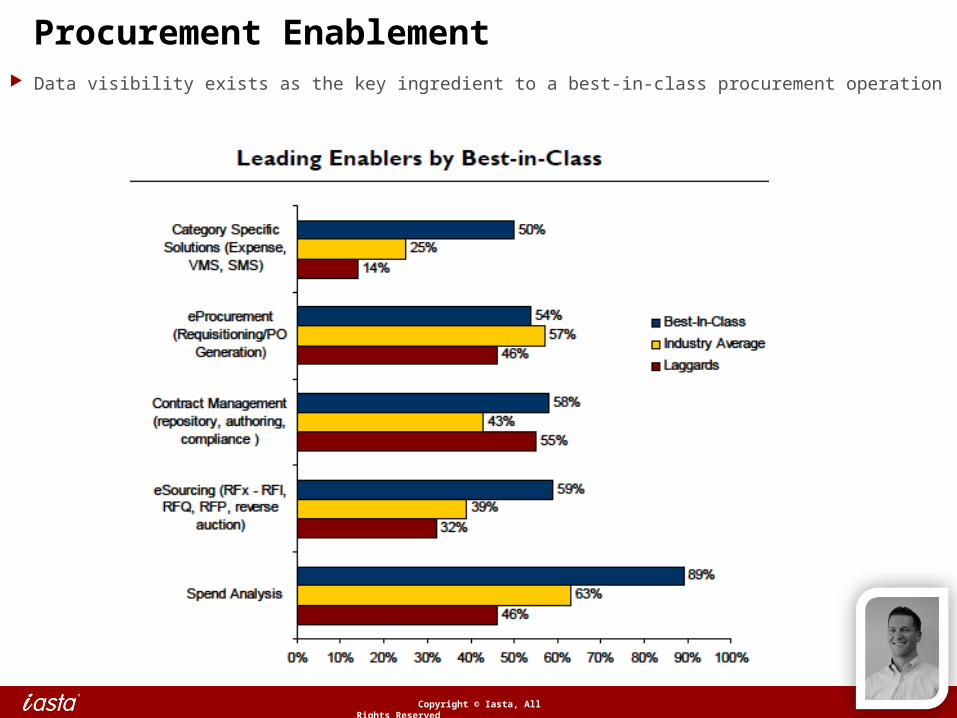
Procurement Enablement Data visibility exists as the key ingredient to a best-in-class procurement operation
Copyright © Iasta, All Rights Reserved
Data – The Communicator in Unique Deployments BPO Deployments
Communication is the primary differentiator between successful and unsuccessful Procurement BPO efforts
Spend Analysis is an accelerant in BPO scenarios, but also a common source of information shared by in-house and remote teams
Multinational Deployments
When combined with other data (sourcing, resource planning data), as with Iasta’s CPO Dashboard, a spend analysis platform allows collaboration
Copyright © Iasta, All Rights Reserved
Means vs. Ends
Most of the “Means” of Spend Analysis are similar… Raw data is cleansed, rationalized, or enriched Data transformation occurs in software to ensure iterative
refresh success Data is delivered and experienced by end user through
interactive reporting
…but the “Ends” often differ. Procurement Transformation Category-Specific Savings Regional/Departmental Politics! Data Control
Copyright © Iasta, All Rights Reserved
Q&A
Please submit your questions…
Copyright © Iasta, All Rights Reserved
Question 1
We have both an ERP system & BI (business intelligence) system that provides spend reports. Why can’t these suffice?The key reason comes back to data and the level of data gained from ERP / BI vs. automated spend analysis solution.Typically the data in an ERP system is going to be at the level of detail needed for a general ledger. For example, how much have you bought in computer equipment? But knowing how much you bought on computer equipment is not very useful if you want to go out and do sourcing. Automated spend analysis gives you the ability to drill down to give much more detailed information to explain what you bought, when you brought it, who bought it, and for how much. Good spend analysis providers can also bring in data from purchasing scorecards, such as important contract data, supplier risk, etc. There are a lot of powerful spend analysis solutions available in the marketplace that give you the ability to bring in multiple systems with multiple dimensions to bring in much more power.
Copyright © Iasta, All Rights Reserved
Question 2
What was the most difficult part of the deployment and how long did it take to implement?I think we had our spend analysis dashboard up and running in about 6-7 weeks from the time we had our data extracts complete and handed off to Iasta. The most difficult part was when we needed to make a pass from that famous category 99 – which is the question mark category. We had to pick up all of the stuff the machine didn’t get because it wasn’t clearly articulated what was purchased. We wound up taking that category and splitting it up across all commodity managers to go through it manually to make sure we captured everything. I would say that was the tough part, even though while the system was up and running so I wouldn’t add that to the deployment timeline. Even though it was a manual process for some category mangers to go through and clean up those last bits and pieces to get more granular rules in place, once you do it- it’s done. The data becomes the Holy Grail.
Copyright © Iasta, All Rights Reserved
Question 3
What advice do you have for companies who do a POC (proof of concept) before implementing a spend analysis solution?Every company has different data – so it’s extremely important for us to get involved with client / prospect to understand the data and help identify the categories that they are looking into exploring for new opportunities. Iasta takes the time to meet with the client to develop the reports they would like to see during the POC demonstration, including target categories. This process helps us become much more intimate with the data and that’s important for a successful POC.To have a successful POC the customer must still be involved, and not throw data at a vendor without context. Be realistic, a POC is designed to show the process of how your data will be classified and how adjustments will be made to make sure it is accurate. It has a limited time scope so that you shouldn’t expect all your data to be perfectly classified in 2 weeks.
Copyright © Iasta, All Rights Reserved
Question 4
How can you justify ROI (return on investment) for a spend analysis implementation?Through the cost savings achieved from gaining supplier and spend visibility, compliance, risk management, and a sourcing pipeline developed through the classification and reporting of your spend analysis partner.Iasta works with its clients to make spend dada actionable, benchmarking past sourcing experience against current client data to determine prime categories to source, identify supplier rationalization opportunities, isolating price variances and off-contract spend, and so on.Spend analysis helps companies increase the amount of “spend under management.” According to industry analysts, this is a leading indicator of a successful sourcing and procurement strategy. Best in class organizations have 85% of total spend under management and realize 60% of formally negotiated savings while other organizations only recognize 5% of negotiated savings (Aberdeen Group, 2011). That is a huge impact to ROI.
Copyright © Iasta, All Rights Reserved
Question 5
How do you recommend teams build a solid case for spend analysis?Gather referencesReview case studiesParticipate in a proof of conceptRead analyst researchEnsure the solution can bring in 3rd party data and other data, such as sourcing project details gained from Iasta’s CPO dashboard. Other data includes:
Supplier performance management Contract compliance Risk management Benchmarking
Once the POC is complete and you have gathered this information, put together a presentation for key stakeholders that includes opportunities discussed in the POC and learned their your research. Overall, demonstrate the value that spend analysis will bring to your organization.
Copyright © Iasta, All Rights Reserved
Question 6
How long does it typically take to deploy a spend analysis solution?Best-in-class spend analysis partners can deploy a solution in a timeframe of 4-10 weeks when focused on providing clean, sustainable data to the client. Best practice is to use a combination of classification software and data professionals to bring the data to a certain state out of the box and then audit the work of the software to ensure accuracy from implementation through refreshes. Iasta will create business rules for any audited data that will be stored in the software to ensure that future classifications are automatic, quick, and consistent.
Copyright © Iasta, All Rights Reserved
Question 7
How does “good” data impact the deployment process?All companies can benefit from undergoing a cleansing and classification process, no matter how clean the data may seem.In terms of deployment, the more information given in a clean format will most likely spend up the process.
Copyright © Iasta, All Rights Reserved
Question 8
In Ciena’s case, user adoption of its spend analysis solution spread quickly to other business units. What advice do you have for companies looking to collaborate with other business units / stakeholders using spend data?The key is to start out small in procurement, get some wins and gain confidence throughout the organization. Then, you can slowly gain user count and train the users to build usage across departments.Strive to maintain procurement as a Center of Excellence and bring in other business units with additional tabs / reporting information that is segmented by unit, stakeholder, department, etc.Use bookmarks, shared reports, and so on to keep driving adoption and collaboration.
Copyright © Iasta, All Rights Reserved
For more info
www.eSourcingWiki.com
Iasta European HQHartham Park
Corsham, Wiltshire
SN13 0RP
United Kingdom
Operations: +44.(0).870.199.4060Sales: +44.(0).1249.700726
www.Twitter.com/Iasta
eSourcing | forum
www.eSourcingForum.com
eSourcing |wiki
www.LinkedIn.com
Iasta Alliance Group
www.Iasta.com
Iasta Global HQ12800 N. Meridian St.
Suite 425
Carmel, IN 46032
United States of America
Operations: 317.594.8600Sales: [email protected]
Copyright © Iasta, All Rights Reserved
Related Materials
White Papers Keys to Unlocking Your Sourcing Power
Spend Analysis: It's what you don't know that costs you
Dynamic Procurement: The CPO as Collaborator, Innovator and Strategist
Case Studies Gaining Insight into Key Suppliers & Contracts with a Spend Analysis Implementation
eSourcingWiki Articles Spend Analysis and Opportunity Assessment
eSourcingForum Posts 6 Steps to Implementing Spend Analysis: Procrastination is not the 1st step Creating a Different Conversation around spend Analysis projects
Iasta Solutions SmartAnalytics Spend Analysis Services