WEBINAR SERIES INSIDE ENERGY AND SUSTAINABILITY February, 2, 2017 Q1 ENERGY OUTLOOK UPDATE Winter Update and Impacts to Energy Pricing, 2017 Expectations & DER State of the Market
Q1 ENERGY OUTLOOK UPDATEWinter Update and Impacts to Energy Pricing, 2017 Expectations & DER State of the Market
WELCOMEOUR PRESENTERS
IAN BOWMAN | PRODUCT MANAGEMENT
DIRECTOR
JONATHAN LEE | SENIOR ENERGY MARKET INTELLIGENCE MANAGER
INSIDE ENERGY & SUSTAINABILITY
TODAY’S TOPICS
DER STATE OF THE MARKET Demand for distributed energy resources continues to grow as companies
look to meet their renewables targets.
ENERGY MARKET UPDATE: Q1 2017 Natural Gas Storage: Supplies now at a deficit compared to the 5-year average. Winter Weather: Inconsistent temperatures continue to affect energy prices. Natural Gas Supply and Demand Balance: Increasing demand and stagnant production.
2017 POWER SECTOR TRENDS Changes in the generation mix and emerging technological advances have the potential to transform the industry.
INSIDE ENERGY & SUSTAINABILITY
DER STATE OF THE MARKET
INSIDE ENERGY & SUSTAINABILITY
DER STATE OF THE MARKET – MOSTLY GOOD NEWS
Solar Generation Is up ~40% Year Over Year Now totals ~1.5% of US generation mix
Wind Generation Is up 20% Year Over Year Now totals ~6% of US generation mix
Outlook Is for Similar Growth in 2017 Driven By: Declines in underlying unsubsidized costs Time sensitive federal ITC and PTC subsidies Time sensitive local Net Metering programs and caps Existing Pipeline of Utility, Municipality, Residential,
Community & Corporate Buyers
New Federal Policies Unlikely to Impact 2017 Directly But will introduce additional uncertainty into longer term decision-making
INSIDE ENERGY & SUSTAINABILITY
UNSUBSIDIZED – RECENT WIND AND SOLAR PRICE TRENDS
PRICE DECLINE DRIVERS
Wind Outlook ~3% annual Taller, Lighter, Dynamic Rotors Wind Prediction Software Focus in high wind corridors
Competition between projects asproduction tax credit decreases
Competition vs LOW wholesale rates
Solar Outlook ~7-9% annual Manufacturing Experience Minimized Racking Installation Experience Planning Software, etc.
Module Supply Glut (40% PriceDrop to 35 Cents per Watt)
Unsubsidized Price Declines Likely to Continue as Manufacturing, Deployment, and Competition Scale Wind down 10%+ over the next 5 years Solar down 30-40% over the next 5 years Industry is driving for smaller, shorter wind offtakes to enable new buyers
Federal Policy Outlook Low likelihood of additional federal regulation/incentives for decarbonization in the near term; Clean Power Plan
is weakened Significantly lower federally funded research and tracking of renewable markets Potential support for transmission infrastructure. Ie. Move wind from Wyoming to Nevada/Southern CA As Federal incentives weaken, localized policies incentives and financial market signals become more important
INSIDE ENERGY & SUSTAINABILITY
DRIVERS FOR 2017 . . . AND BEYOND
State/Utility/Local Markets Outlook States and markets vary . . . Widely, BUT share in common:
Policies and Rates require refactoring as renewables penetrations reach their policy goals. I.e.: 0.5% to 2.5% Solar RPS carve-outs are eventually overwhelmed by growth causing SREC markets to fall or RPS
carve outs to be expanded Reaching net metering caps triggers changes
In search of longer term solutions, many states are studying “Value of Solar” Tariffs So far, there is a wide variance in what counts as “Value” at first 4 Cents Tennessee, 12 Cents Minnesota, 33 cents
Maine (Often determined by who did the study and what policies) Potential jurisdictional and legal challenges await on fairness, equal access, etc. Excel MN, in July of this year was the first Public Utility to implement VOS, and it is focused on Community Solar,
which reduces some likely angles for legal challenges
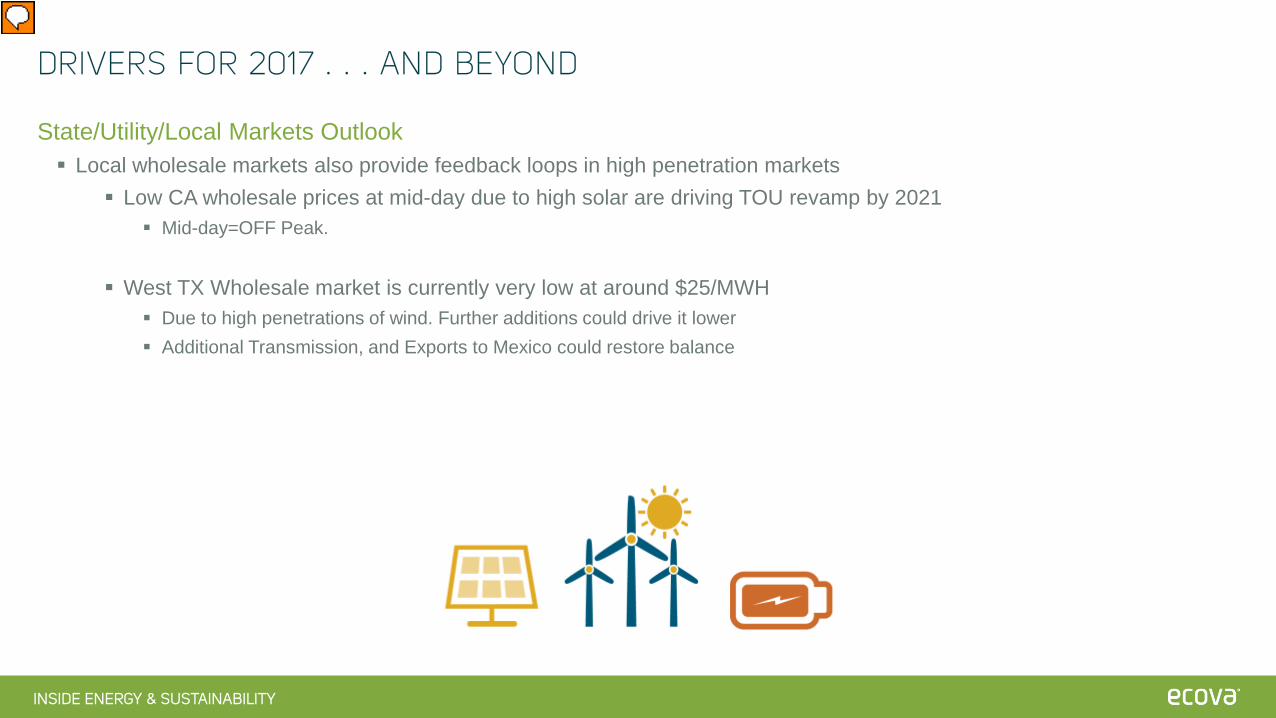
State/Utility/Local Markets Outlook Local wholesale markets also provide feedback loops in high penetration markets
Low CA wholesale prices at mid-day due to high solar are driving TOU revamp by 2021 Mid-day=OFF Peak.
West TX Wholesale market is currently very low at around $25/MWH Due to high penetrations of wind. Further additions could drive it lower Additional Transmission, and Exports to Mexico could restore balance
RISK CONCEPT OF THE DAY: HIGHER PENETRATION FEEDBACK LOOPS
http://www.nrel.gov/docs/fy15osti/64503.pdf
EIA INCLUDES THIS CONCEPT IN SOME OF THEIR MODELING.
As example of how it works in the markets: As more solar is added in CA, it drives the daytime prices lower. Thus driving the value of adding more solar lower.
IMPORTANT: Higher Penetration can retroactively impact projects already in place.
Storage and Demand Scheduling may help a bit, but expect this to continue.
Potential for persistent low wholesale market prices in windy areas due to high penetration of wind, and low load growth. Makes further new generation additions uneconomic.
INSIDE ENERGY & SUSTAINABILITY
TOP WIND PENETRATION STATES
2016 TEXAS 10%
INSIDE ENERGY & SUSTAINABILITY
SRECS PRICES DROP WHEN APPROACHING SOLAR CARVE OUT LIMIT
You can often see when a state reached their RPS Carve out Target.
Requires legislative action to add more RPS carve out or accept lower solar growth in the near term.
INSIDE ENERGY & SUSTAINABILITY
REITERATING THE GOOD NEWS!
Unsubsidized price declines likely to continue as manufacturing, deployment, and competition scale. Wind down 10% over the next 5 years Solar down 30-40% over the next 5 years
You can manage the risks of higher penetration markets through modeling for those cases, and consciously deciding when to take on the risk. Plus some of the feedback loop risks described are largely due to cleaner grid at lower prices (not all bad)
INSIDE ENERGY & SUSTAINABILITY
Q1 2017ENERGY MARKET UPDATE
INSIDE ENERGY & SUSTAINABILITY
ELECTRIC AND NATURAL GAS MARKET DRIVERS2 February 2017
Natural Gas Production – After hitting a low in October, production beginning to increase as natural gas prices rise.
Economy – Q4 2016 GDP +1.9% annualized growth 156,000 jobs created in December; holiday retail sales flat.
Coal – Weak coal prices lower baseline electric generation costs.
Regional Generation Variations – Subsidizedwind generation in West Texas, localized shale in PJM providing cheap gas to power plants, and incremental pipeline capacity easing in the Northeast.
Natural Gas Storage – At a deficit compared to last year and the five-year average.
Weather Forecast – Winter temperatures colder than last year, supporting wholesale natural gas and electric prices.
LNG – Sabine Pass LNG exporting supplies to global markets.
Mexico Pipeline Exports – Exports up to 3.8 Bcf/day.
ISO Reliability – Retiring coal plants forcing ISO’s to evaluate grid reliability.
Interest Rate Hike – Fed raised rates in December, which marginally increased the cost of capital and could slow natural gas and oil production.
Presenter
Presentation Notes
Storage – Injections to storage resume at slower-than-normal rate. Following last week's first summertime net withdrawal since 2006, net injections into storage totaled 29 Bcf, compared with the five-year (2011-15) average net injection of 53 Bcf and last year's net injections of 57 Bcf during the same week. Working gas stocks total 3,317 Bcf, 440 Bcf above the five-year average and 361 Bcf above last year at this time. This week marks the 14th consecutive week that the gap of working gas stocks compared with the five-year average declined. When the refill season began on April 1, working gas stocks were 874 Bcf above the five-year average. Production –Production levels this week were quite close to last year's levels despite the historically low natural gas rig count, which points to ongoing increases in rig efficiency. This idea is supported by data from EIA'sDrilling Productivity Report, which shows the highest level of gas production per rig since the dataset began in 2007. Demand (Bu) – Consumption falls. During the report week, total U.S. consumption of natural gas fell by 1%, according to data from PointLogic. Power burn for electricity generation declined by 1% week over week. Industrial sector consumption stayed constant, averaging 19.4 Bcf/d. In the residential and commercial sectors, consumption fell 7% from last week's levels, averaging 7.2 Bcf/d. Natural gas exports to Mexico went down 2%. Weather – Temperatures fall from week-ago levels, but remain higher than normal. Temperatures in the Lower 48 states averaged 78°F, 3°F more than the normal and 1°F more than last year at this time. Last week, temperatures reached 80°F on average in the Lower 48 states—their highest levels for the year. Cooling degree-days (CDD) in the Lower 48 states totaled 88, compared with last week's 105 CDD. Tropical Storms – CSU early 2015 Forecast: 7 named storms, 3 hurricanes, 1 major hurricane. Recap: 11 named storms, 4 Hurricanes, 2 major hurricanes LNG – U.S. LNG exports. The natural gas pipeline flows to the Sabine Pass liquefaction terminal averaged 0.9 Bcf/d, 4% lower than the previous week. Three vessels (LNG-carrying capacity 9.3 Bcf) left the terminal last week. One vessel (LNG-carrying capacity 3.4 Bcf) is currently loading at the terminal. Economy (N) – Employment Situation report for Jul showed 255k jobs created. Well above consensus at 185k. Unemployment at 4.9%. Q2 2016 GDP +1.2%�
INSIDE ENERGY & SUSTAINABILITY
Tightening of the supply and demand balance has the 12-month strip trading between $3.20 and $3.70
Currently, the strip is near its highest level in over two years
NATURAL GAS 12-MONTH STRIP TRADING AROUND $3.40$/MMBtu – 31 January 2017
Budget Impact:Natural gas 12-month strip is 34% above last year at this time and 58% above February’s 17-year low.$2.00
$2.20
$2.40
$2.60
$2.80
$3.00
$3.20
$3.40
$3.60
$3.80
$/M
MBt
u
Major Support - $2.10
Minor Support - $2.85
Resistance - $3.50
INSIDE ENERGY & SUSTAINABILITY
Futures prices elevated until March 2018
Expectation of a tighter supply and demand balance during that timeframe
Prices are cheaper in the outer months
NYMEX NATURAL GAS FUTURES BACKWARDATED$/MMBtu – 30 January 2017
Budget Impact:Consider the contract term when looking to put third-party supply contracts in place.$2.25
$2.75
$3.25
$3.75
$4.25
$/M
MBt
u
Two Year Trading Range Current PriceNYMEX Henry HubContract Period: Mar 2017 – Feb 2021As of 1/30/2017
INSIDE ENERGY & SUSTAINABILITY
12-MonthRolling Strip
NYMEX Correlation
ERCOT HZ 89.9%
NY ISO J 45.6%
PJM West 26.5%
NEPOOL 21.6%
MISO 76.5%
PG&E NP-15 85.6%
INCREASED WINTER VOLATILITY FOR ELECTRIC 12-MONTH STRIPS$/MWh – 31 January 2017
Budget Impact:Winter volatility in New York and New England markets, but not nearly as dramatic as during the 2013/2014 winter. $20
$30
$40
$50
$60
$70
$80
$90
$/M
Wh
ERCOT AVG NY ISO J PJM NEPOOL MISO PG&E NP15 W
INSIDE ENERGY & SUSTAINABILITY
WINTER 2016/2017NOAA, AccuWeather, EIA – January 2017
A cold start to this winter help propel energy prices higher. However, inconsistent HDDs during January have caused prices to move mostly sideways for the last month.
Presenter
Presentation Notes
Both natural gas futures and spot prices rose in early December because of forecasts of much colder-than-normal weather for mid-December. However, these factors affected spot prices (which represents the price for very near-term delivery) more than they affected futures prices. U.S. heating degree days (HDD) averaged 23 HDD above normal for the two weeks ending December 22, which contributed to higher natural gas demand and the largest December net inventory withdrawal since 2013, putting upward pressure on prices towards the end of the month. The January futures contract expired on December 28 at the monthly high of $3.93/MMBtu, the highest front-month futures price settlement since December 2014. With the front-month contract moving to February delivery and weather models showing a generally warmer outlook in the eastern part of the country than previously expected, futures prices again declined in the first week of 2017. The wide range in prices in December and early January shows the influence of changing weather forecasts in a market with tightening supply and demand fundamentals.
INSIDE ENERGY & SUSTAINABILITY
CALIFORNIA DROUGHT IMPROVING USDA, NOAA – 24 January 2017
Major drought improvements were made not only to CA, but at many areas of the West, including parts of NV, UT, OR, ID, MT, WY, and CO.
Presenter
Presentation Notes
http://cdec.water.ca.gov/cdecapp/snowapp/sweq.action As mentioned in the Summary, major changes were made in many areas of the West due to this week’s parade of moisture-laden Pacific storms and an already wet Water Year (WY), with California the greatest recipient of drought improvements this week. CA’s Sierra snow water content (SWC) was also well above its Jan. 30 normal, with the north (26.0”, or 150%), central (32.2”, or 180%), and south (32.5”, or 210%) producing a state average of 30.4”, or 180%. Across the Intermountain West and Rockies, a re-assessment of conditions led to the removal of dryness across New Mexico outside east-central and west-central parts of the state. Similarly, D0 was also withdrawn from south-central Utah. The heaviest precipitation (1.5 to 3.5 inches, with isolated higher amounts) affecting dry areas was observed in the northeasternmost fringe of the D0 area in Utah and, more significantly, through the higher elevations of central Arizona. A more broken pattern of significant precipitation was noted in east-central and northwestern sections of that state. Periodic flooding has resulted near Lake Havasu and along the Santa Cruz River. On the other hand, Alamo Lake remains unfavorably low despite recent abundant precipitation, and groundwater has not responded to date in one of the wettest parts of the state (centered on Pimal and Gila Counties), raising concerns for well-water users. For these reasons, only two small regions of improvement were noted in central (from D0) and east-central (from D1) parts of the state. Farther west, light to moderate precipitation prompted a few improvements from central Nevada southward through southeastern California, but heavy to excessive precipitation pounded areas farther west through most of California, particularly the Sierra Nevada, coastal locations, and the southwestern interior. Between 8 and 12 inches were common through the Sierra Nevada while 4 to locally 10 inches were dropped on areas farther west and southwest. Adjacent areas to the east of the Sierra Nevada and most of central and south-central California (outside a small area south of the Sierra Nevada) recorded at least an inch. According to the San Joaquin precipitation index (an average across that region), January was the wettest ever observed in 112 years of record, and 4- to 5-year precipitation totals climbed dramatically from approximately the 2 percentile level as of early January to around the 20th percentile through this week. Statewide average snowpack (snow water equivalent) is almost twice normal for late January, and somewhat more than twice normal in the southern Sierra Nevada. Amounts actually exceed those typically recorded April 1 (snowpack climatological maximum). Given these dramatically wet indicators, widespread 1-category improvements were again instituted this week, wiping D4 from the state and restricting D3 to part of southwestern California. It should be noted, however, that to date groundwater levels have not responded as one might expect, and remain critically low. In most of the central foothills on the east side of the San Joaquin Valley, plus a number of other communities and cities across the nearby mountains and valleys, water supply is dependent on groundwater. Thus potable water is still being trucked in to serve residents with dry wells in areas such as Tuolumne County, and the deepest wells may not respond to the recent inundation for many more months.
INSIDE ENERGY & SUSTAINABILITY
Natural gas production peaked in Feb 2016 at 79.4 Bcf/day and bottomed out in Oct 2016 at 75.9 Bcf/day
During late 2017, production is expected to climb above 80 Bcf/day, which could limit excessive upside moves
NATURAL GAS PRODUCTION EXPECTED TO RECOVEREIA – January 2017
Budget Impact:Slower production has tightened the supply and demand balance, resulting in higher prices.60
65
70
75
80
85
90
0
100
200
300
400
500
600
700
800
900
Natural G
as Rig C
ount
Mar
kete
d Pr
oduc
tion
(Bcf
/Day
)
Natural Gas Rig CountTotal marketed production (left axis) billion cubic feet per day
Presenter
Presentation Notes
Natural gas marketed production is forecast to average 77.3 billion cubic feet per day (Bcf/d) in 2016, a 1.4 Bcf/d decline from the 2015 level, which would be the first annual decline since 2005. EIA expects production to start rising in November as a result of increases in drilling activity and infrastructure build-out that connects natural gas production to demand centers. In 2017, forecast natural gas production increases by an average of 2.9 Bcf/d from the 2016 level. Growing domestic natural gas consumption, along with higher pipeline exports to Mexico and liquefied natural gas exports, contribute to the Henry Hub natural gas spot price rising from an average of $2.50/million British thermal units (MMBtu) in 2016 to $3.12/MMBtu in 2017. NYMEX contract values for February 2017 delivery traded during the five-day period ending November 3 suggest that a price range from $2.01/MMBtu to $4.84/MMBtu encompasses the market expectation of Henry Hub natural gas prices in February 2017 at the 95% confidence level. EIA projects that LNG gross exports will rise to an average of 0.5 Bcf/d in 2016, with the startup of Chenier's Sabine Pass LNG liquefaction plant in Louisiana, which sent out its first cargo in February 2016. EIA projects that gross LNG exports will average 1.3 Bcf/d in 2017, as Sabine Pass ramps up capacity. With expected growth in gross exports, net imports of natural gas decline from 2.6 Bcf/d in 2015 to a small amount of net exports in 2017. The United States is expected to become a net exporter of natural gas during the second quarter of 2017.
INSIDE ENERGY & SUSTAINABILITY
-300
-250
-200
-150
-100
-50
0
50
100
2016/2017 Last Year Five-Year Average
First 200+ storage draw in December since 2013
Began withdrawal season at an all-time high, but now supplies are 11.1% below last year and 0.7% below the five-year average
LARGE WITHDRAWALS MOVE STORAGE INTO A DEFICITEIA – January 2017
NATURAL GAS CAPACITY CONTINUES TO GROWEIA – January 2017
U.S. to add about 11.2 GW of natural gas-fired generation capacity in 2017 and 25.4 GW
during 2018.
0.0%
10.0%
20.0%
30.0%
40.0%
50.0%
60.0%
Perc
ent o
f Tot
al G
ener
atio
n
Electric Generation By Source
Coal Natural Gas Nuclear Hydro Renewables
Natural-gas fired electric generation was the largest source for the majority of 2015
and 2016.
Presenter
Presentation Notes
The electricity industry is planning to increase natural gas-fired generating capacity by 11.2 gigawatts (GW) in 2017 and 25.4 GW in 2018, based on information reported to EIA. If these plants come online as planned, annual net additions in natural gas capacity would be at their highest levels since 2005. On a combined basis, these 2017–18 additions would increase natural gas capacity by 8% from the capacity existing at the end of 2016. Depending on the timing and utilization of these plants, the new additions could help natural gas maintain its status as the primary energy source for power generation, even if natural gas prices rise moderately. The upcoming expansion of natural gas-fired electricity generating capacity follows five years of net reductions of total coal-fired electricity generating capacity. Available coal-fired capacity fell by an estimated 47.2 GW between the end of 2011 and the end of 2016, equivalent to a 15% reduction in the coal fleet over the five-year period. The electricity industry has been retiring some coal-fired generators and converting others to run on natural gas in response to the implementation of environmental regulations and to the sustained low cost of natural gas. The cost of natural gas delivered to power generators fell from an average price of $5.00 per million Btu (MMBtu) in 2014 to $3.23/MMBtu in 2015 and averaged $2.78/MMBtu from January through October 2016, the latest available data. Expanded production from shale formations is one of the main reasons that natural gas prices have remained low in recent years. Many of the natural gas-fired power plants currently under construction are located in Mid-Atlantic states and Texas, where the nation’s major natural gas shale plays are located. Expanding natural gas pipeline networks also help support the growth in natural gas-fired electric generating capacity. Based on projections in EIA’s January 2017 Short-Term Energy Outlook (STEO), natural gas prices are expected to increase in both 2017 and 2018. Rising natural gas prices could lead developers to postpone or cancel some of the upcoming power plant additions. Construction timelines for these plants are relatively short: more than half of the natural gas-fired generating capacity scheduled to come online in 2017 and 2018 was not yet under construction as of October 2016. Rising natural gas prices could also encourage power generators to lower their use of natural gas-fired capacity. Despite the additions to capacity in 2017, the STEO forecast share of total U.S. generation supplied by natural gas falls from 34% in 2016 to 32% in 2017. In contrast, coal’s share of generation is projected to rise from 30% to 32%. By 2018, however, the scheduled expansion of overall capacity fueled by natural gas is expected to more than offset the effect of higher natural gas prices and potentially reduced utilization, resulting in a slight increase in natural gas’s share of total U.S. electricity generation.
INSIDE ENERGY & SUSTAINABILITY
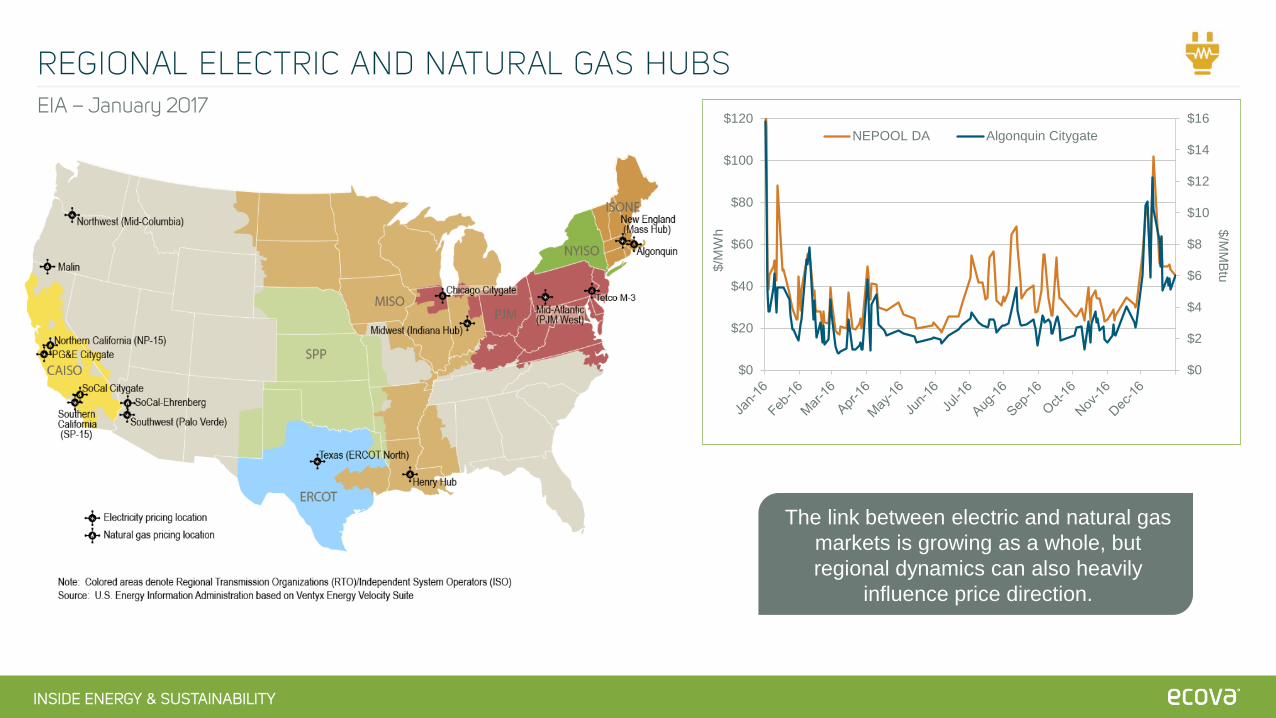
REGIONAL ELECTRIC AND NATURAL GAS HUBSEIA – January 2017
$0
$2
$4
$6
$8
$10
$12
$14
$16
$0
$20
$40
$60
$80
$100
$120
$/MM
Btu$/M
Wh
NEPOOL DA Algonquin Citygate
The link between electric and natural gas markets is growing as a whole, but regional dynamics can also heavily
influence price direction.
INSIDE ENERGY & SUSTAINABILITY
POWER SECTOR TRENDS TO WATCH DURING 2017January 2017
Generation mix will largely depend on the fate of the Clean Power Plan and other EPA regulations
Renewables continue to grow
Nuclear plants are at risk due to low-priced competition leading to potential subsidies
As energy storage matures, utilities will look to the technology as an alternative to peaking generation
DER growth is forcing utility adaptation and policy debates
Rate design reform will increase as utilities revisit the traditional business model
States will likely take a larger role in the push toward higher renewable goals
Presenter
Presentation Notes
A mammoth, wide-ranging energy measure under consideration by the Illinois legislature that would provide billions of dollars in support for energy efficiency, microgrids, and—most controversially—the Clinton and Quad Cities nuclear power plants made it out of a key committee on Nov. 29 and could see a final vote by the end of the week. An August decision by the New York Public Service Commission (PSC) approving New York’s Clean Energy Standard included a provision requiring the state’s investor-owned utilities and other energy suppliers to pay for the intrinsic value of carbon-free emissions from nuclear power plants by purchasing “Zero-Emission Credits” (ZEC). Those credits are added to the wholesale price each plant receives for its power, and the costs are passed on to ratepayers. http://www.utilitydive.com/news/citing-cross-state-pollution-maryland-pushes-epa-to-target-19-midwest-coal/430743/ New York regulators split the REV docket into two tracks. Track 1 focuses on the development of distributed resource markets and the utility as the DSP providers. Track 2 of the REV docket focuses on reforming utility ratemaking practices (evolving from traditional cost-of-service) and revenue streams to support the DSPP model.
INSIDE ENERGY & SUSTAINABILITY
MAJOR TAKEAWAYS
INCORPORATE HIGH RENEWABLE PENETRATION MARKET FEEDBACK LOOPS INTO RENEWABLES MODELING SCENARIOS
REMAINING WINTER WEATHER WILL HAVE A BIG IMPACT ON PRICE DIRECTION. If cold temperatures dominate the second half of winter, energy prices will see continued upward pressure.
Conversely, if temperatures moderate, energy prices could retreat to pre-winter lows.
POWER MARKETS FOCUSING ON REGIONAL DYNAMICS, CAUSING THE CORRELATION TO NYMEX NATURAL GAS TO DECLINE. Some regional electric markets have decoupled from natural gas during the winter, so monitoring pricing at a
more regional level may uncover more buying opportunities.
2017 POWER SECTOR TRENDS During 2017, the beginning of new and the continuation of developing trends will transform the power sector in
significant ways over the next few years.
INSIDE ENERGY & SUSTAINABILITY
ENERGY PRICE HUB
Daily Energy Market updatesRead the latest Energy Market Watch newsletterSubscribe to educational energy supply and webinar emailsInteractive Electric Price TrackerAnd more!