Embed Size (px)
Citation preview

The Life of Pumps
Pumping System Optimisation

ENERGY: - Pump Industry Facts
Pumps use a total of 20
TWh/annum in the UK
Produce 2.7 million tons of carbon
The largest user of motive power
in Industry
Pumps consume 20% of the
World’s electricity
70% of electric motor power is
used for pumps, fans, and
compressors
50% of pumping energy is wasted!
17.5
12.5
10 5
5
Pump Optimisation Pump Efficiency
Variable Speed / Trim Pipework Improvements
Correct Re-selection of Pumps

Why Pumps are expensive to operate?
Energy savings of 10% to 15% can be made by improving the efficiency of pumps.
Energy savings of 30% to 40% can be made by considering the performance of complete pumping systems.
Pump duties are often overstated at the design stage
Pumps are often throttled to meet operating conditions
Operational variations can lead to inefficient pumping regimes
Operating pumps inefficiently increases maintenance costs
Pumps wear in-service reducing their operating efficiency
Low efficiency pumps can still perform without any obvious problems
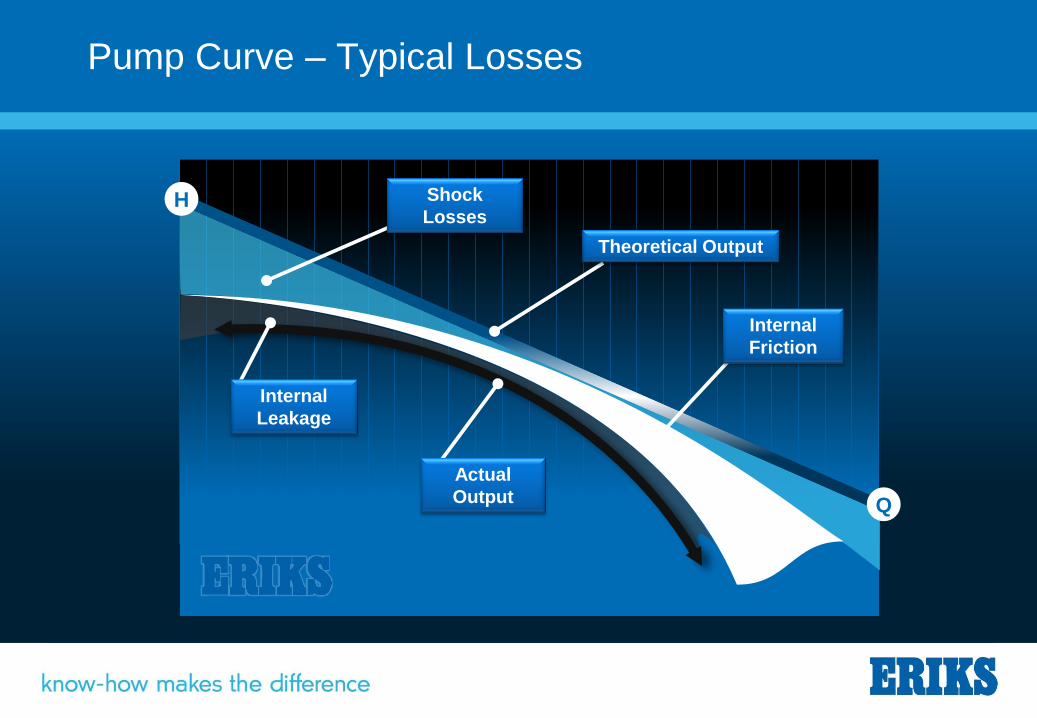
Pump Curve – Typical Losses
Actual
Output Q
H
Theoretical Output
Shock
Losses
Internal
Friction
Internal
Leakage
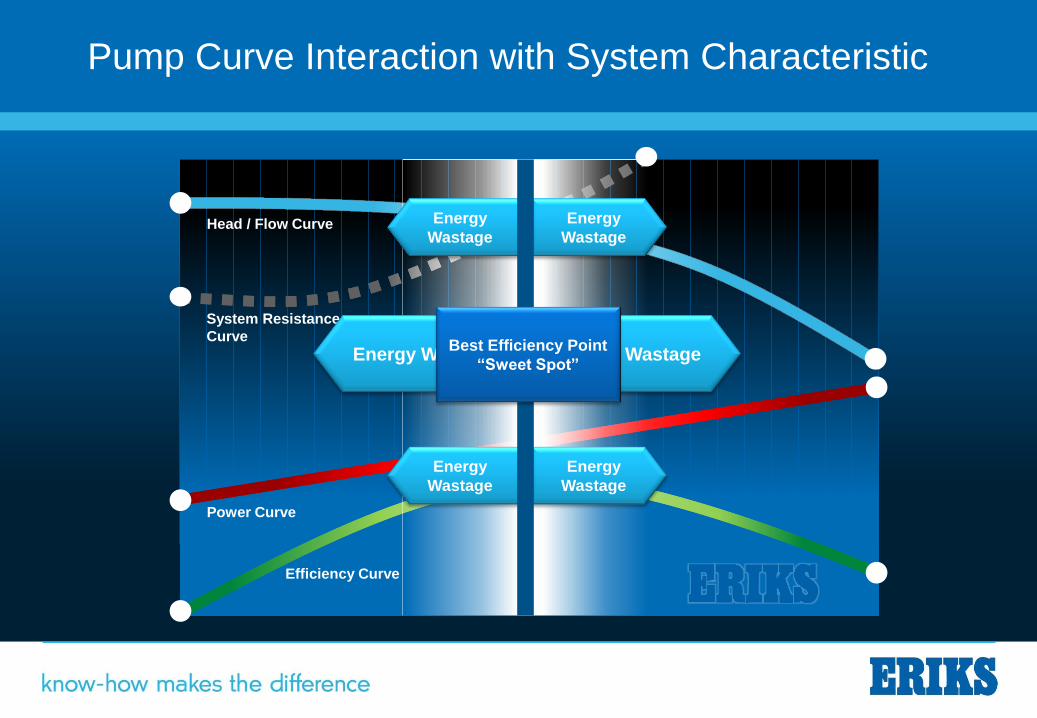
Pump Curve Interaction with System Characteristic
Efficiency Curve
Power Curve
Head / Flow Curve
System Resistance
Curve
Energy
Wastage
Energy Wastage
Energy
Wastage
Energy
Wastage
Energy Wastage
Energy
Wastage
Best Efficiency Point
“Sweet Spot”

Combined Characteristic of 4 Pumps Operating in Parallel
H
H2
H3
H4
1 Pump 2 Pumps 3 Pumps 4 Pumps
Q2 Q4 Q3 Q
Decreasing gain in head and flow with each additional pump
Head
Flow

System Curve Influence on VSD’s
1450 RPM 1350 RPM 1200 RPM 1100 RPM
Predominately Frictional System
System comprises mainly static
head with low frictional element
Best Efficiency
Point

Implications of Operating Away From BEP
The adverse effects of operating a pump away from peak efficiency
Head
Flow
High Temperature Rise
Low Flow Cavitation
Reduced Bearing/Seal Life
Reduced Impeller Life
Suction Recirculation
Discharge Recirculation
Best Efficiency Point
Cavitation from Lack of NPSH
Risk of Motor Overload

Pump Efficiency and Refurbishment
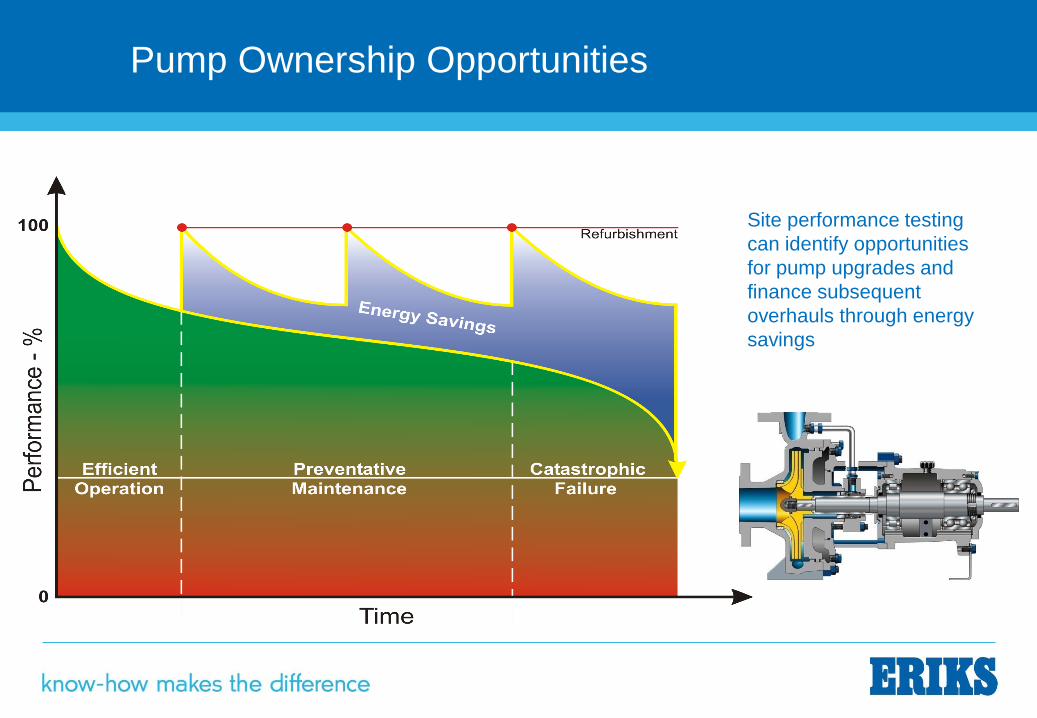
Pump Ownership Opportunities
Site performance testing
can identify opportunities
for pump upgrades and
finance subsequent
overhauls through energy
savings

Pump and System Audits
Pump Performance assessment
Pump Efficiency Improvements
System Curves
Data Logging
Pump Selection
Commissioning
Problem Solving
EU Law: Compulsory Energy Audits for large and medium businesses by 2015

Summary
Carry out pump audits:
Understand where your pumps operate in relation to BEP
Establish a hydraulic system resistance curve for all important
installations
Know how your pump is operating in relation to “as new condition”
Don’t automatically replace “like for like” without re-assessment
Make appropriate use of VSD’s, impeller trims and pump coatings
You can finance your pump maintenance and repairs through energy savings!

Thank you for Listening
Any Questions?