Embed Size (px)
Citation preview
© Canvassco 2015
INDONESIA PESTEL ANALYSIS1
CAPITAL CITY: Jakarta
LAT/LONG: 6N-11S & 95-141E
LANGUAGE: Bahasa Indonesia
CURRENCY: IDR
© Canvassco 2015
POLITIC
2
© Canvassco 2015
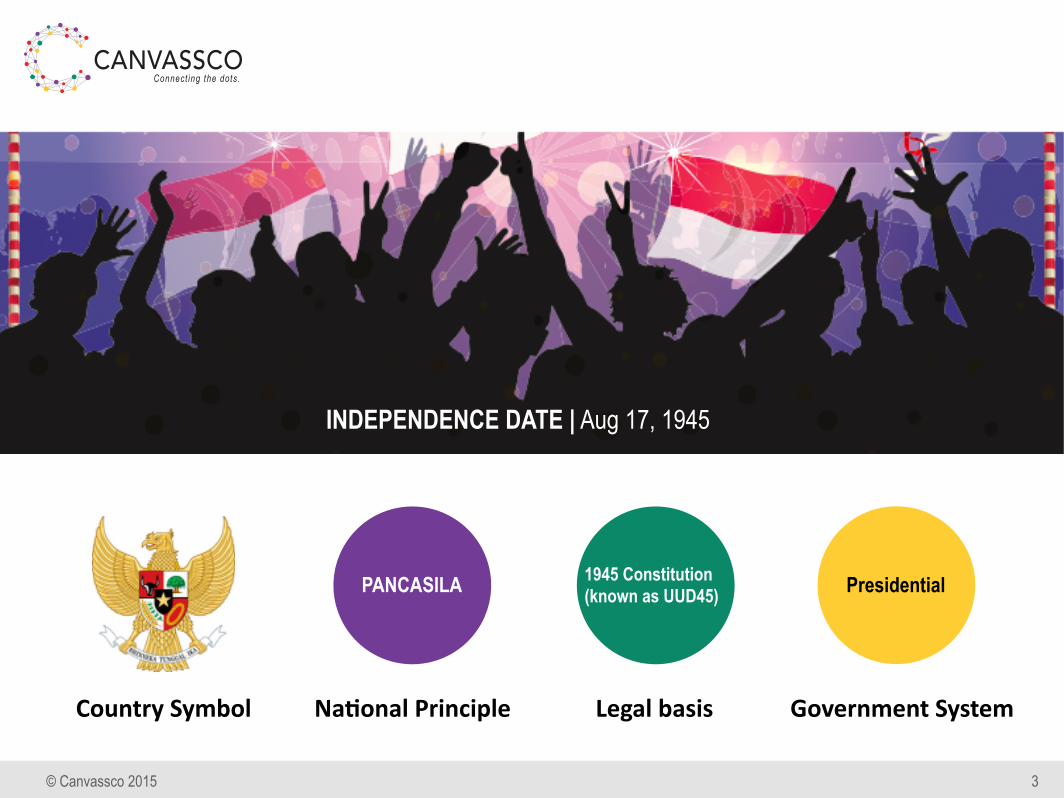
INDEPENDENCE DATE | Aug 17, 1945
3
PANCASILA 1945 Constitution (known as UUD45) Presidential
Country Symbol Na/onal Principle Legal basis Government System
© Canvassco 2015 4
Political Parties
In 2014, 12 political parties contested the national legislative election. Formed 2 coalitions & Jokowi is from the minority one.
© Canvassco 2015 5
Political Situation
Executives need to initiate win-win relationship with legislatives especially those from opposition parties to accelerate the development program execution
© Canvassco 2015 6
Political Situation
Splits that occurred in some political parties might cause uncertainty in term of loyalty to the coalition. Jokowi could have benefited from this situation.
© Canvassco 2015
ECONOMY
7

© Canvassco 2015
Macro Economic Indicator
8
GDP (US$ bio)
868.3
GDP per capita (US$)
GDP growth Inflation rate
3,475 5.8% 8.38%
N/A N/A 5.1% 8.36%
Consumer Price Index
109.8*
119.0*
2013
2014
Note: *) Highest level Source: World Bank, Statistics Indonesia
© Canvassco 2015
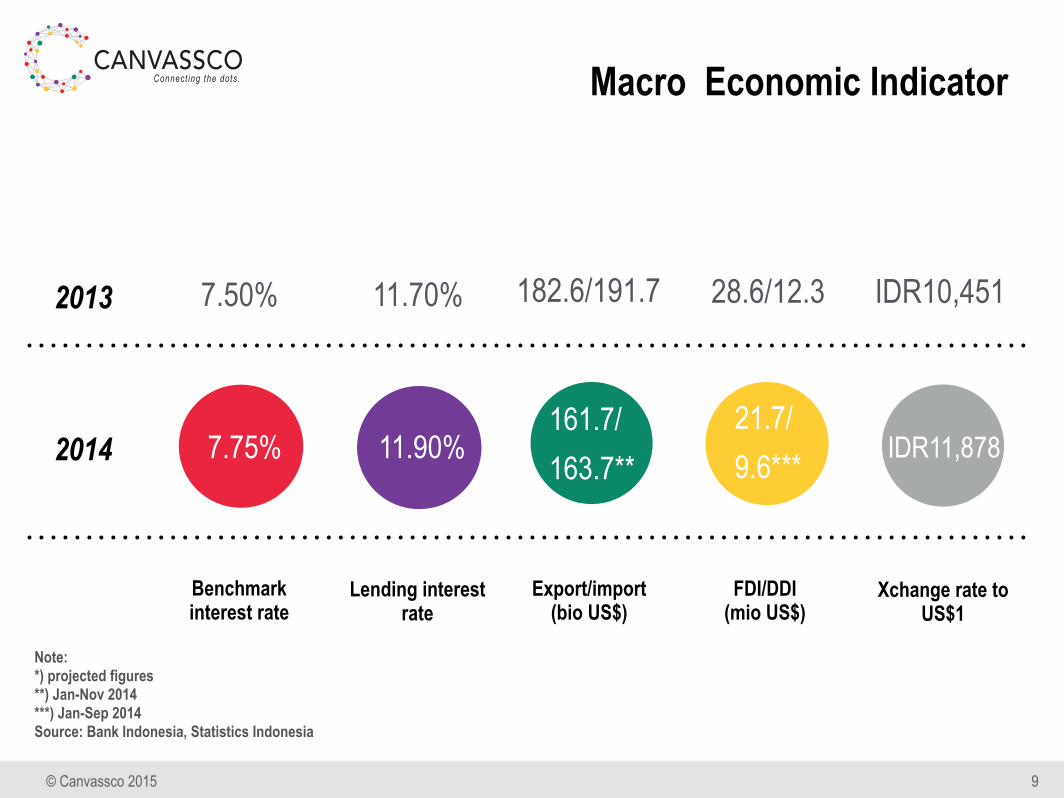
Macro Economic Indicator
9
Benchmark interest rate
7.50%
Lending interest rate
Export/import (bio US$)
FDI/DDI (mio US$)
11.70% 182.6/191.7 28.6/12.3
7.75% 11.90%161.7/ 163.7**
21.7/ 9.6***
Xchange rate to US$1
IDR10,451
IDR11,878
2013
2014
Note: *) projected figures **) Jan-Nov 2014 ***) Jan-Sep 2014 Source: Bank Indonesia, Statistics Indonesia
© Canvassco 2015
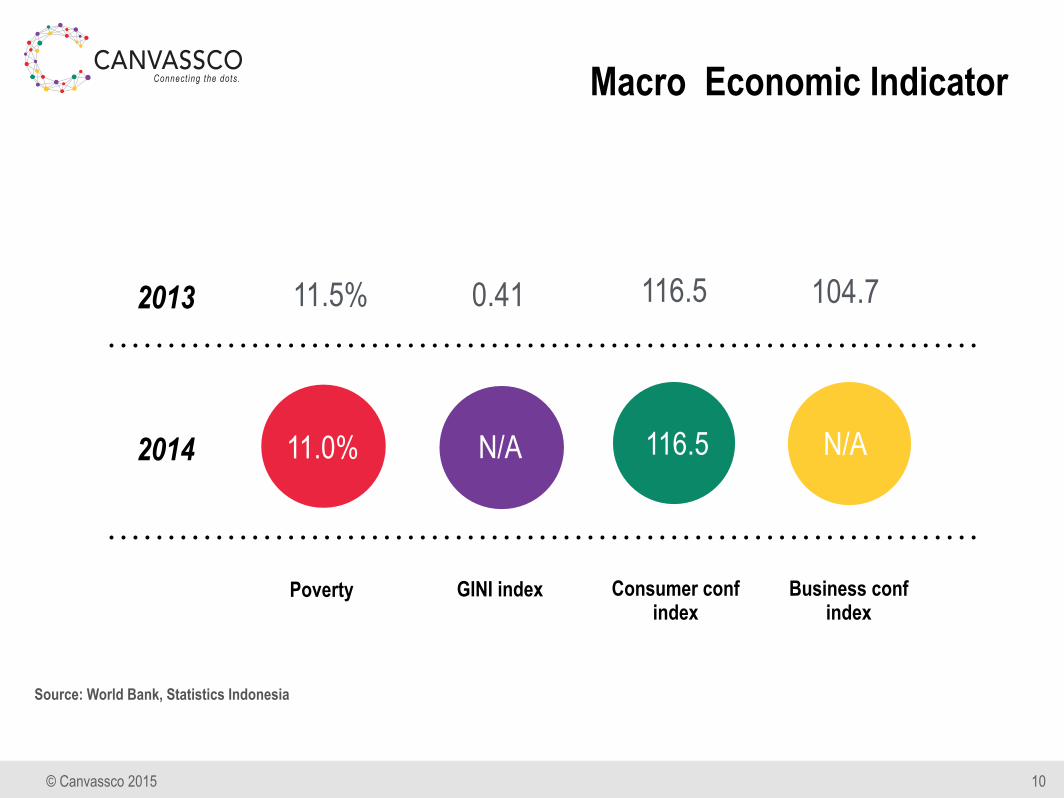
Macro Economic Indicator
10
Poverty
11.5%
GINI index Consumer conf index
Business conf index
0.41 116.5 104.7
11.0% N/A 116.5 N/A
2013
2014
Source: World Bank, Statistics Indonesia
© Canvassco 2015 11
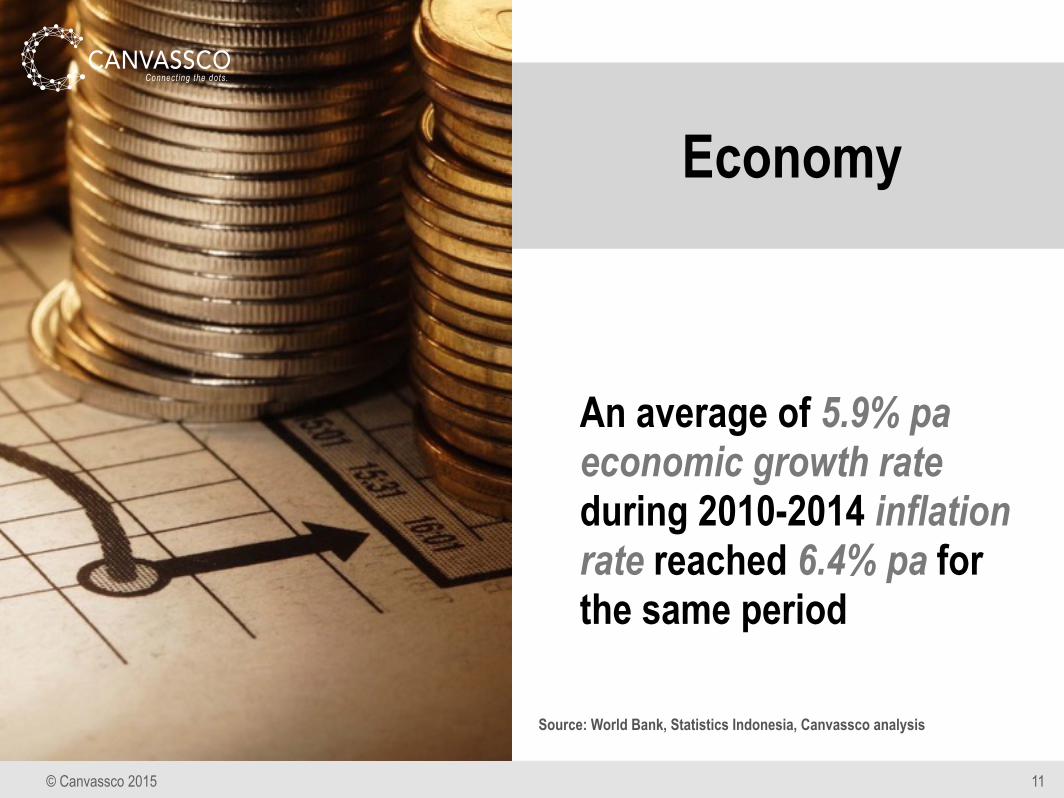
Economy
An average of 5.9% pa economic growth rate during 2010-2014 inflation rate reached 6.4% pa for the same period
Source: World Bank, Statistics Indonesia, Canvassco analysis
© Canvassco 2015
2014 IS THE MOST
STRUGGLING YEAR
12
THE GLORY OF 2011
© Canvassco 2015 13
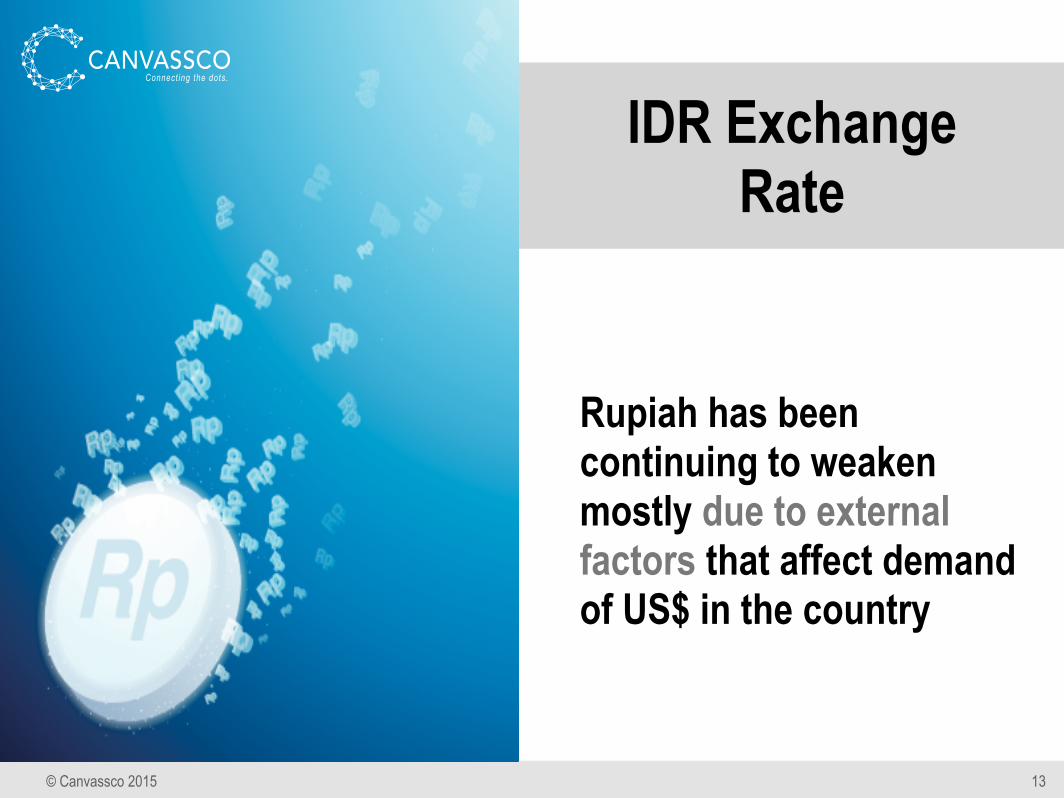
IDR Exchange Rate
Rupiah has been continuing to weaken mostly due to external factors that affect demand of US$ in the country
© Canvassco 2015 14
Poverty
People live below poverty line was still more than 10% of the population with GINI index reach 0.41 in 2013
© Canvassco 2015 15
Monetary & Fiscal Policy
Central bank(BI) enforce tight monetary policy
Government targets tax radio to GDP around 14-14.5% in 2014
© Canvassco 2015
SOCIO CULTURAL ANALYSIS
16
© Canvassco 2015
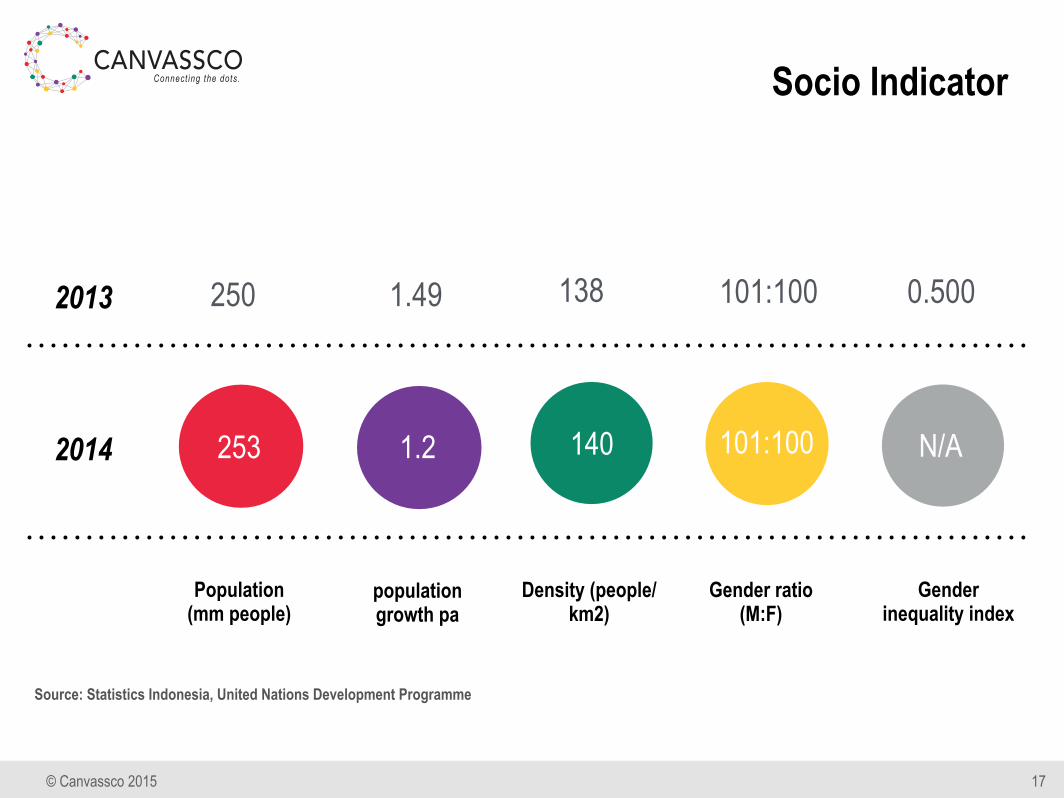
Socio Indicator
17
Population (mm people)
250
population growth pa
Density (people/km2)
Gender ratio (M:F)
1.49 138 101:100
253 1.2 140 101:100
Gender inequality index
0.500
N/A
2013
2014
Source: Statistics Indonesia, United Nations Development Programme

© Canvassco 2015
Socio Indicator
18
Number of household
63.5
Av. household size
Working population
Unemployment
3.9 120.2 6.3%
64.7 3.9 121.7 5.9%
Human Dev index
0.684
N/A
2013
2014
Source: Statistics Indonesia, United Nations Development Programme
© Canvassco 2015
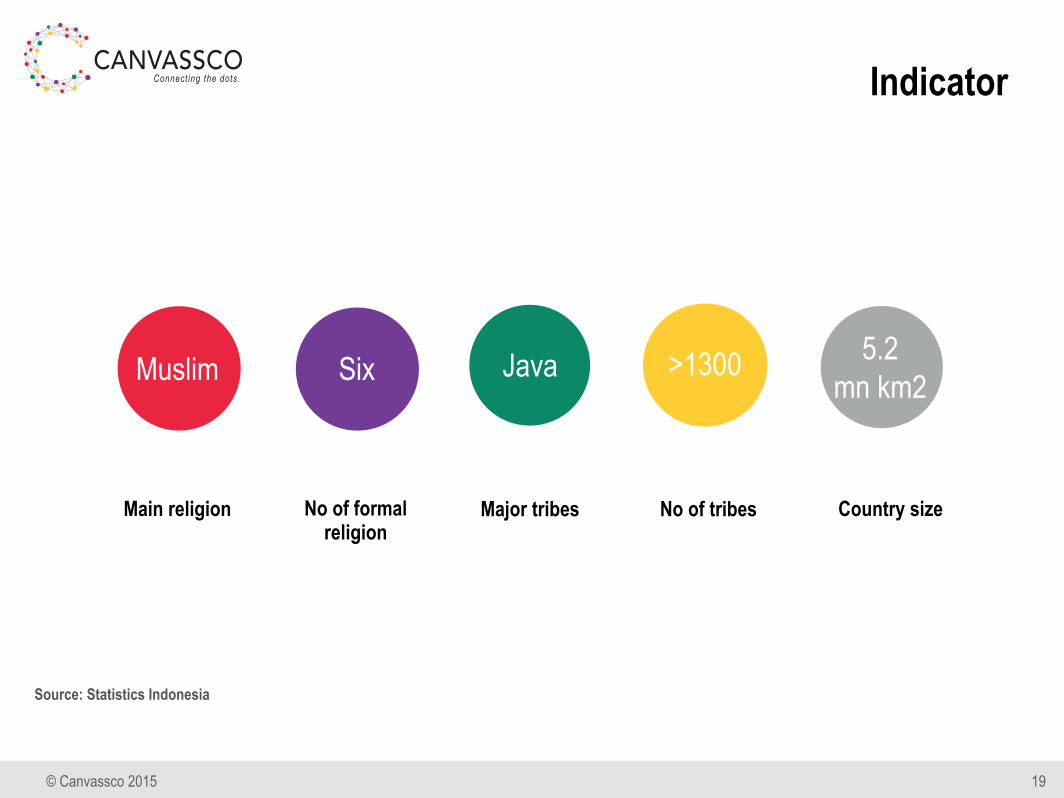
Indicator
19
Main religion No of formal religion
Major tribes No of tribes
Muslim Six Java >1300
Country size
5.2 mn km2
Source: Statistics Indonesia
© Canvassco 2015 20
Population
Indonesia is the top 4 populous country
Male population is only slightly higher than female’s
© Canvassco 2015 21
Human Development
Gender inequality index is 0.500 of which in medium human development
Source: United Nations Development Programme
© Canvassco 2015 22
Socio Economic
Sustainable FDI and DDI growth. Domestic market is very important as Indonesia is the top four populous country and most of them are on the consumer class
© Canvassco 2015 23
Socio Culture
Although more than 85% of Indonesian is Muslim, the culture is still strongly influence by Hindu Buddhist especially those originally from Java and Bali
© Canvassco 2015
TECHNOLOGY
24
© Canvassco 2015 25
Technology survey
The fourth largest users of Facebook Fifth largest users of Twitter. Jakarta ranking number one (over Tokyo) in 2012 for the total number of posted tweets.
© Canvassco 2015 26
Manufacture Industry
Technology used is considered as “out dated” even though manufacturing is the largest contributor of GDP
© Canvassco 2015 27
Agricultural
High technology is only implemented in certain areas such as seed cultivation, pest control, animal health and few others.
© Canvassco 2015 28
Trade, Hotel & Restaurant
High tech is mostly in term of e-payment (cashless). Other area is e-ordering (e-booking)
© Canvassco 2015
ENVIRONMENT
29
© Canvassco 2015 30
Green environment
Despite government programs in promoting green environment, deforestation and environmental pollution are still happening.
© Canvassco 2015 31
Deforstation
Beat Brazil in 2012 of 840,000ha due to forest conversion to plantation, industrial and housing areas. Besides forest fires and possibility of illegal lodging.
© Canvassco 2015 32
Green house gas emission
Indonesia is the 3rd major producer of green house gas emission after China and USA of which 85% were from deforestation.
© Canvassco 2015 33
Enacted regulations for various industries related to quality of waste
and emission, hazardous material and waste management, environment
conservation, and many others.
Major pollution is still happening from transportation, manufacture and energy sectors
© Canvassco 2015
LEGAL
34
© Canvassco 2015 35
Investing in Indonesia
2014 negative investment list has been enacted aiming to boost both FDI and DDI.
© Canvassco 2015
INVESTING IN INDONESIA36
Energy (oil & gas and power), transportation, pharmaceutical and trading are affected verticals.
For few industrial sectors, it takes more than a year to formally obtain the operating license.
© Canvassco 2015 37
Uncertainly
Regulatory revisions might cause business uncertainty especially for foreign investments
© Canvassco 2015 38
Regulatory Barrier
Due to loyalty to political parties and coalitions, approval process for regulatory decisions among legislative power could take a long time.
© Canvassco 2015. All Rights Reserved.
CONTACT US
CANVASSCO IN INDONESIA Ira Sustrini Account Director email: [email protected]
Tel: +6221 2985 8088