Embed Size (px)
DESCRIPTION
Internet DealBook's Q3 Report 2012 looks at the level of investment and acquisition activity in the Internet space Q3 2011 VS Q3 2012. Stats provided by: Internetdealbook.com
Citation preview
Page 1
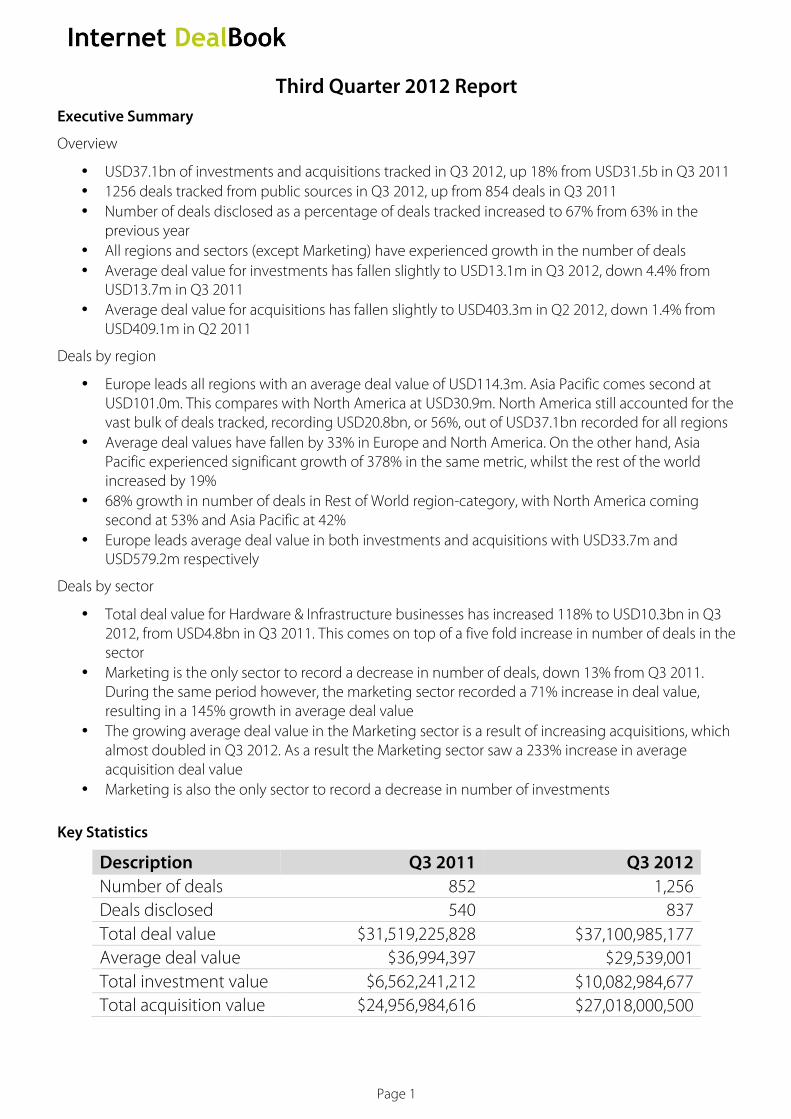
Third Quarter 2012 Report Executive Summary
Overview
• USD37.1bn of investments and acquisitions tracked in Q3 2012, up 18% from USD31.5b in Q3 2011 • 1256 deals tracked from public sources in Q3 2012, up from 854 deals in Q3 2011 • Number of deals disclosed as a percentage of deals tracked increased to 67% from 63% in the
previous year • All regions and sectors (except Marketing) have experienced growth in the number of deals • Average deal value for investments has fallen slightly to USD13.1m in Q3 2012, down 4.4% from
USD13.7m in Q3 2011 • Average deal value for acquisitions has fallen slightly to USD403.3m in Q2 2012, down 1.4% from
USD409.1m in Q2 2011
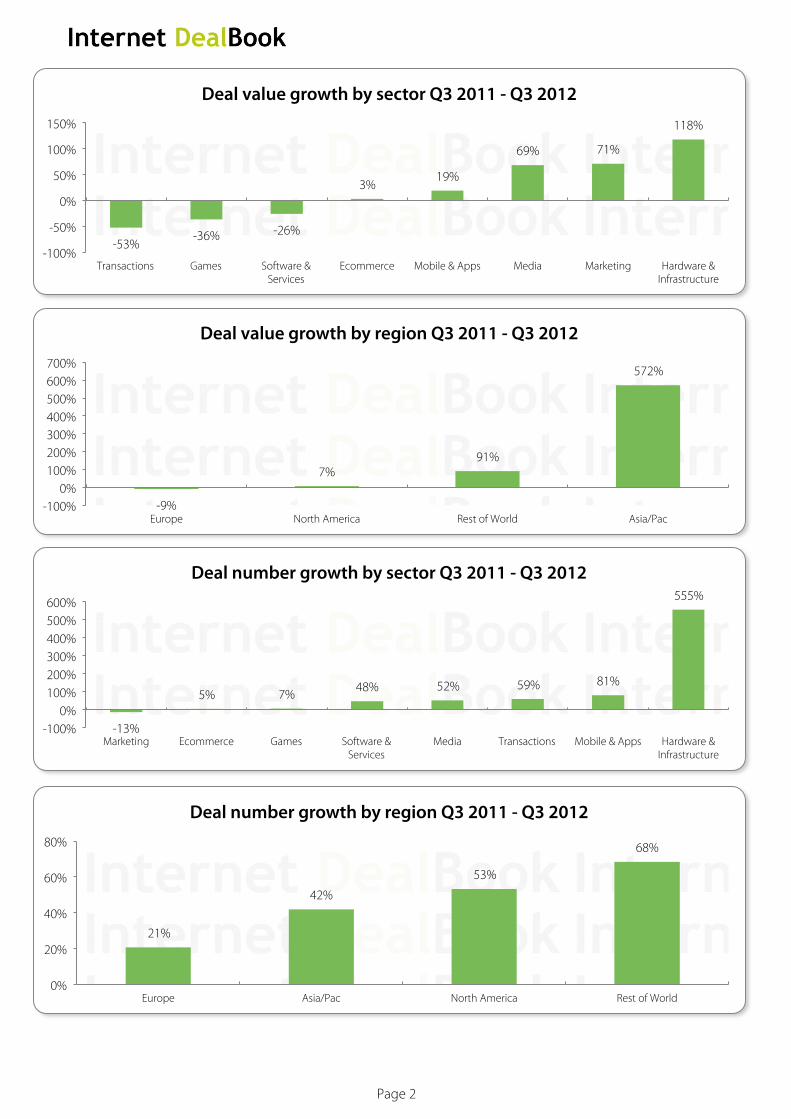
Deals by region
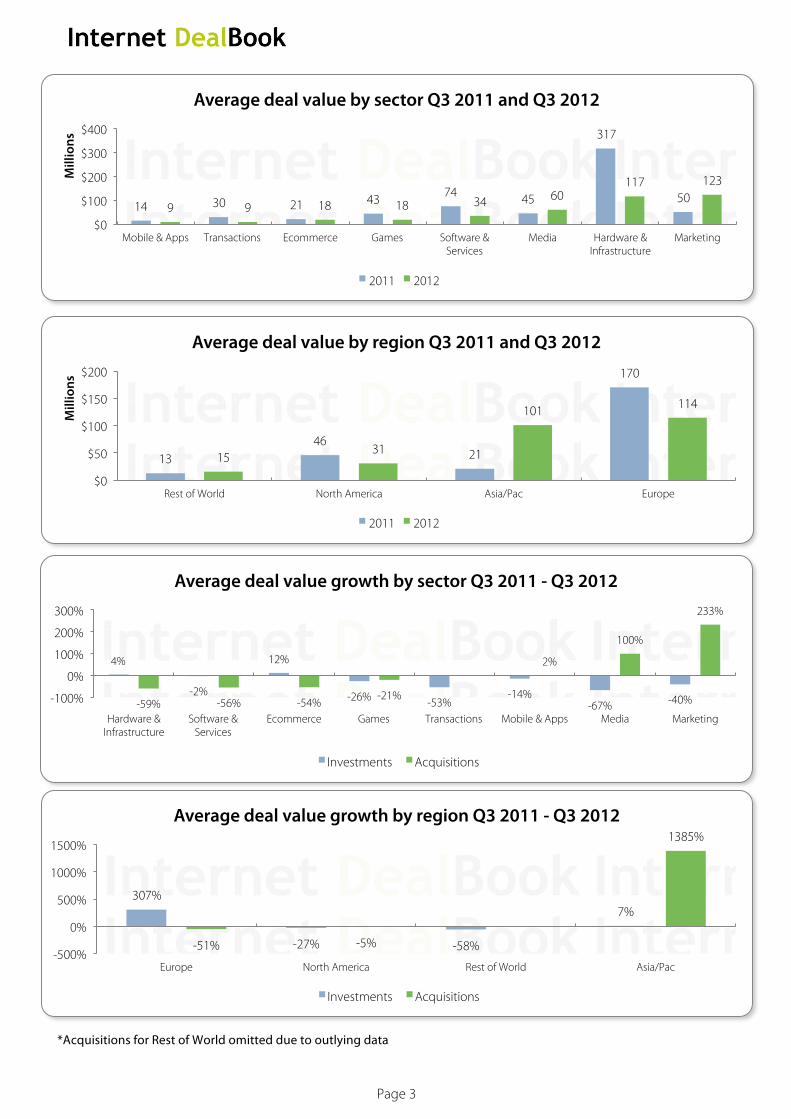
• Europe leads all regions with an average deal value of USD114.3m. Asia Pacific comes second at USD101.0m. This compares with North America at USD30.9m. North America still accounted for the vast bulk of deals tracked, recording USD20.8bn, or 56%, out of USD37.1bn recorded for all regions
• Average deal values have fallen by 33% in Europe and North America. On the other hand, Asia Pacific experienced significant growth of 378% in the same metric, whilst the rest of the world increased by 19%
• 68% growth in number of deals in Rest of World region-category, with North America coming second at 53% and Asia Pacific at 42%
• Europe leads average deal value in both investments and acquisitions with USD33.7m and USD579.2m respectively
Deals by sector
• Total deal value for Hardware & Infrastructure businesses has increased 118% to USD10.3bn in Q3 2012, from USD4.8bn in Q3 2011. This comes on top of a five fold increase in number of deals in the sector
• Marketing is the only sector to record a decrease in number of deals, down 13% from Q3 2011. During the same period however, the marketing sector recorded a 71% increase in deal value, resulting in a 145% growth in average deal value
• The growing average deal value in the Marketing sector is a result of increasing acquisitions, which almost doubled in Q3 2012. As a result the Marketing sector saw a 233% increase in average acquisition deal value
• Marketing is also the only sector to record a decrease in number of investments
Key Statistics
Description Q3 2011 Q3 2012 Number of deals 852 1,256 Deals disclosed 540 837 Total deal value $31,519,225,828 $37,100,985,177 Average deal value $36,994,397 $29,539,001 Total investment value $6,562,241,212 $10,082,984,677 Total acquisition value $24,956,984,616 $27,018,000,500
Page 2
-53% -36% -26%
3% 19%
69% 71%
118%
-100%
-50%
0%
50%
100%
150%
Transactions Games Software & Services
Ecommerce Mobile & Apps Media Marketing Hardware & Infrastructure
Deal value growth by sector Q3 2011 - Q3 2012
-13%
5% 7% 48% 52% 59% 81%
555%
-100% 0%
100% 200% 300% 400% 500% 600%
Marketing Ecommerce Games Software & Services
Media Transactions Mobile & Apps Hardware & Infrastructure
Deal number growth by sector Q3 2011 - Q3 2012
-9%
7% 91%
572%
-100% 0%
100% 200% 300% 400% 500% 600% 700%
Europe North America Rest of World Asia/Pac
Deal value growth by region Q3 2011 - Q3 2012
21%
42%
53%
68%
0%
20%
40%
60%
80%
Europe Asia/Pac North America Rest of World
Deal number growth by region Q3 2011 - Q3 2012
Page 3
307%
-27% -58%
7%
-51% -5%
1385%
-500%
0%
500%
1000%
1500%
Europe North America Rest of World Asia/Pac
Average deal value growth by region Q3 2011 - Q3 2012
Investments Acquisitions
*Acquisitions for Rest of World omitted due to outlying data
14 30 21 43 74 45
317
50 9 9 18 18 34 60
117 123
$0
$100
$200
$300
$400
Mobile & Apps Transactions Ecommerce Games Software & Services
Media Hardware & Infrastructure
Marketing
Mill
ions
Average deal value by sector Q3 2011 and Q3 2012
2011 2012
13 46
21
170
15 31
101 114
$0
$50
$100
$150
$200
Rest of World North America Asia/Pac Europe
Mill
ions
Average deal value by region Q3 2011 and Q3 2012
2011 2012
4%
-2%
12%
-26% -53% -14%
-67% -40% -59% -56% -54% -21%
2%
100%
233%
-100%
0%
100%
200%
300%
Hardware & Infrastructure
Software & Services
Ecommerce Games Transactions Mobile & Apps Media Marketing
Average deal value growth by sector Q3 2011 - Q3 2012
Investments Acquisitions
Page 4
Disclaimer The information contained herein is of a general nature and is not intended to address the circumstances of any particular individual or entity. Although we endeavour to provide accurate and timely information, there can be no guarantee that such information is accurate as of the date it is received or that it will continue to be accurate in the future. No one should act on such information without appropriate professional advice after a thorough examination of the particular situation. Accordingly Internet DealBook and all its related entities hereby excludes any liability to any person in consequence of his purported reliance upon information contained herein or omitted here from (whether express or implied) or otherwise furnished in connection herewith. Any requests for information in connection with this document should be addressed directly to Internet DealBook and to no other party.
Information Sources
Internet DealBook collects and compiles all its data from publicly available sources. Visit Internet DealBook for more information on the methodology used for tracking and collating deals.
Copyright Notice
This report is compiled and published by Internet DealBook and is covered by copyright. All rights reserved. No part of the publication may be published, reproduced (see exception below), stored in a retrieval system, translated, or transmitted in any form or by any means now or hereafter known, electronic or mechanical, without permission in writing from the publisher, Internet Dealbook.com.
The copyright owner consents that copies of articles may be made for personal or internal use, or for the personal or internal use of the company, individual or organisation who requested the creation of this document from Internet DealBook. For those kinds of purposes, permission must be sought from the publisher using the following guidelines. If you have any questions regarding our rights and permissions policies, or if you have a special request not covered by these guidelines, please contact Internet DealBook.
![Q3 2017 State of the Internet Security Report | Akamai · 2019-04-16 · 7 / The State of the Internet / Security / Q3 2017 [SECTION]1 = EMERGING TRENDS Although we have not seen](https://img.pdfslide.net/doc/110x75/5f59313ed396b31e0c2c77e3/q3-2017-state-of-the-internet-security-report-akamai-2019-04-16-7-the-state.jpg)


![Q3 2016 State of the Internet Security Report | Akamai · 2019. 4. 16. · 6 / The State of the Internet / Security / Q3 2016 [SECTION]1 = EMERGING TRENDS These attacks were remarkable](https://img.pdfslide.net/doc/110x75/60428b20b035bb00bf54f403/q3-2016-state-of-the-internet-security-report-akamai-2019-4-16-6-the-state.jpg)