Embed Size (px)
Citation preview
1
PRODUCING AND EXPLORING
JUNE 2012
2
CAUTIONARY STATEMENT This presentation contains forward looking information, within the meaning of applicable Canadian securities legislation, and forward looking statements, within the meaning of applicable United States securities legislation, which reflects management’s expectations regarding Teranga Gold Corporation’s (“Teranga” or the “Company”) future growth, results of operations (including, without limitation, future production and capital expenditures), performance (both operational and financial) and business prospects (including the timing and development of new deposits and the success of exploration activities) and opportunities. Wherever possible, words such as “plans”, “expects”, “does not expect”, “budget”, “scheduled”, “estimates”, “forecasts”, “anticipate” or “does not anticipate”, “believe”, “intend” and similar expressions or statements that certain actions, events or results “may”, “could”, “would”, “might” or “will” be taken, occur or be achieved, have been used to identify such forward looking information. Although the forward looking information contained in this presentation reflect management’s current beliefs based upon information currently available to management and based upon what management believes to be reasonable assumptions, Teranga cannot be certain that actual results will be consistent with such forward looking information. A number of factors could cause actual results, performance or achievements to differ materially from the results expressed or implied in the forward looking information, including those listed in the “Risk Factors” section of Teranga’s Annual Information Form , dated March 28, 2012 (the “AIF”). These factors should be considered carefully and prospective investors should not place undue reliance on the forward looking information. Forward looking information necessarily involves significant known and unknown risks, assumptions and uncertainties that may cause Teranga’s actual results, performance, prospects and opportunities in future periods to differ materially from those expressed or implied by such forward looking information. Although Teranga has attempted to identify important risks and factors that could cause actual actions, events or results to differ materially from those described in the forward looking information, there may be other factors and risks that cause actions, events or results not to be as anticipated, estimated or intended. There can be no assurance that the forward looking information will prove to be accurate, as actual results and future events could differ materially from those anticipated in such statements. Accordingly, prospective investors should not place undue reliance on such forward looking information. Teranga expressly disclaims any intention or obligation to update or revise any forward looking statements, whether as a result of new information, future events or otherwise, except in accordance with applicable securities law. Forward looking information and other information contained herein concerning mineral exploration and management’s general expectations concerning the mineral exploration industry are based on estimates prepared by management using data from publicly available industry sources as well as from market research and industry analysis and on assumptions based on data and knowledge of this industry which management believes to be reasonable. However, this data is inherently imprecise, although generally indicative of relative market positions, market shares and performance characteristics. While management is not aware of any misstatements regarding any industry data presented herein, mineral exploration involves risks and uncertainties and industry data is subject to change based on various factors. In addition, please note that statements relating to “reserves” or “resources” are deemed to be forward looking information as they involve the implied assessment, based on certain estimates and assumptions, that the resources and reserves described can be profitably mined in the future. While management has confidence in its projections based on exploration work done to date, the potential quantity and grade disclosed herein is conceptual in nature, and there has been insufficient exploration to define a mineral resource, therefore it is uncertain if further exploration will result in the targets being delineated as a mineral resource. This presentation does not constitute in any way an offer or invitation to subscribe for securities in Teranga pursuant to the Corporations Act 2001 (Cth) and has not been lodged with the Australian Securities and Investment Commission.
3
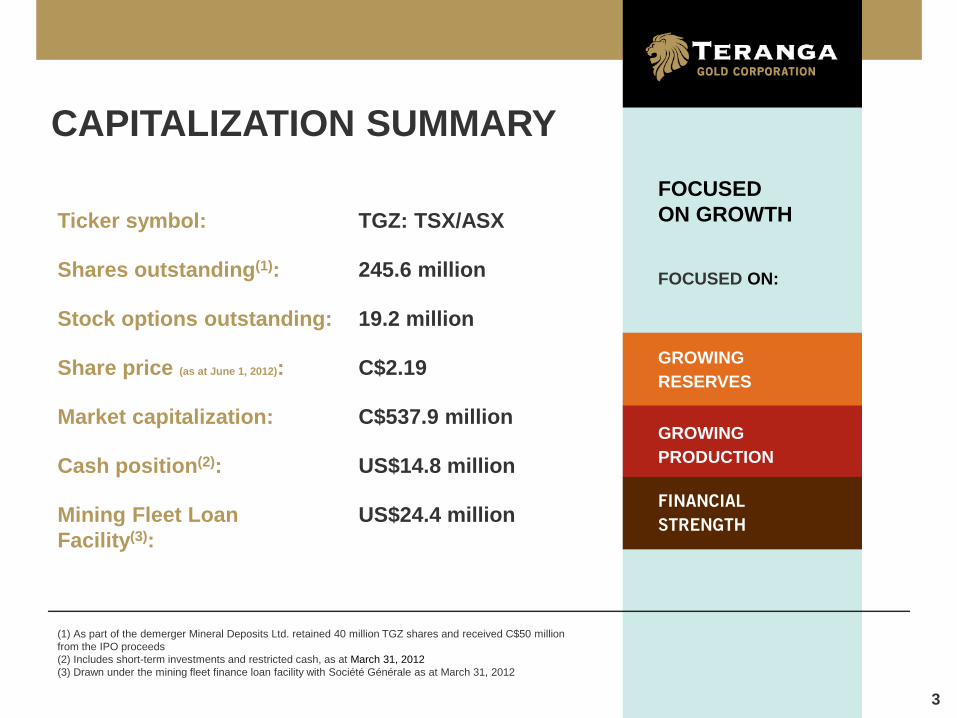
CAPITALIZATION SUMMARY
Ticker symbol: TGZ: TSX/ASX
Shares outstanding(1): 245.6 million
Stock options outstanding: 19.2 million
Share price (as at June 1, 2012): C$2.19
Market capitalization: C$537.9 million
Cash position(2): US$14.8 million
Mining Fleet Loan Facility(3):
US$24.4 million
(1) As part of the demerger Mineral Deposits Ltd. retained 40 million TGZ shares and received C$50 million from the IPO proceeds (2) Includes short-term investments and restricted cash, as at March 31, 2012 (3) Drawn under the mining fleet finance loan facility with Société Générale as at March 31, 2012
FOCUSED ON GROWTH
FOCUSED ON:
GROWING RESERVES
GROWING PRODUCTION
FINANCIAL STRENGTH
4
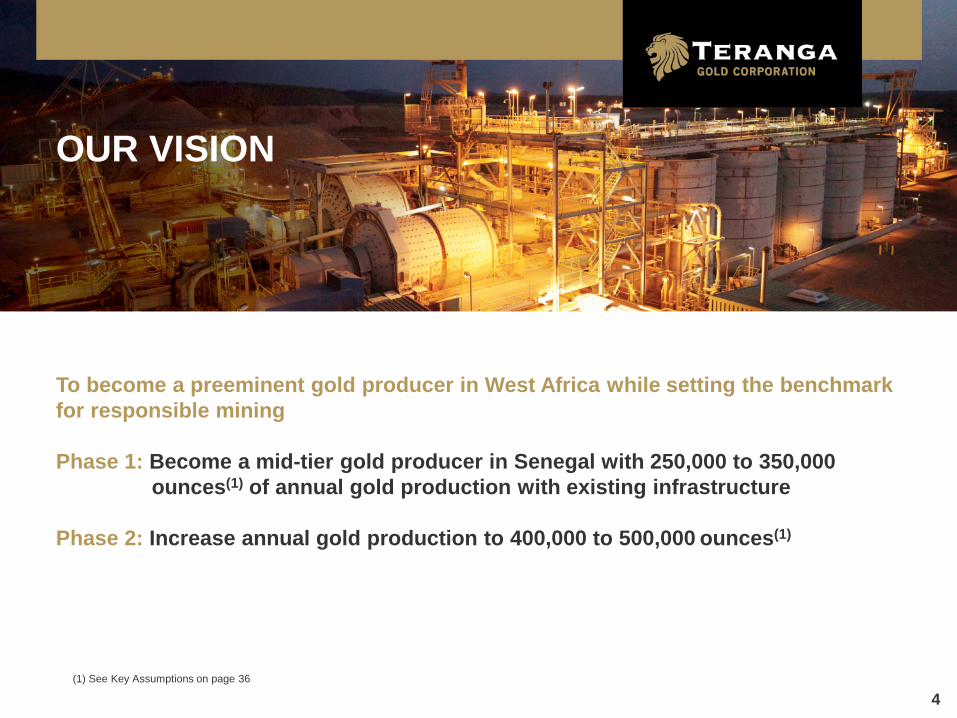
OUR VISION
To become a preeminent gold producer in West Africa while setting the benchmark for responsible mining Phase 1: Become a mid-tier gold producer in Senegal with 250,000 to 350,000 ounces(1) of annual gold production with existing infrastructure Phase 2: Increase annual gold production to 400,000 to 500,000 ounces(1)
(1) See Key Assumptions on page 36
5
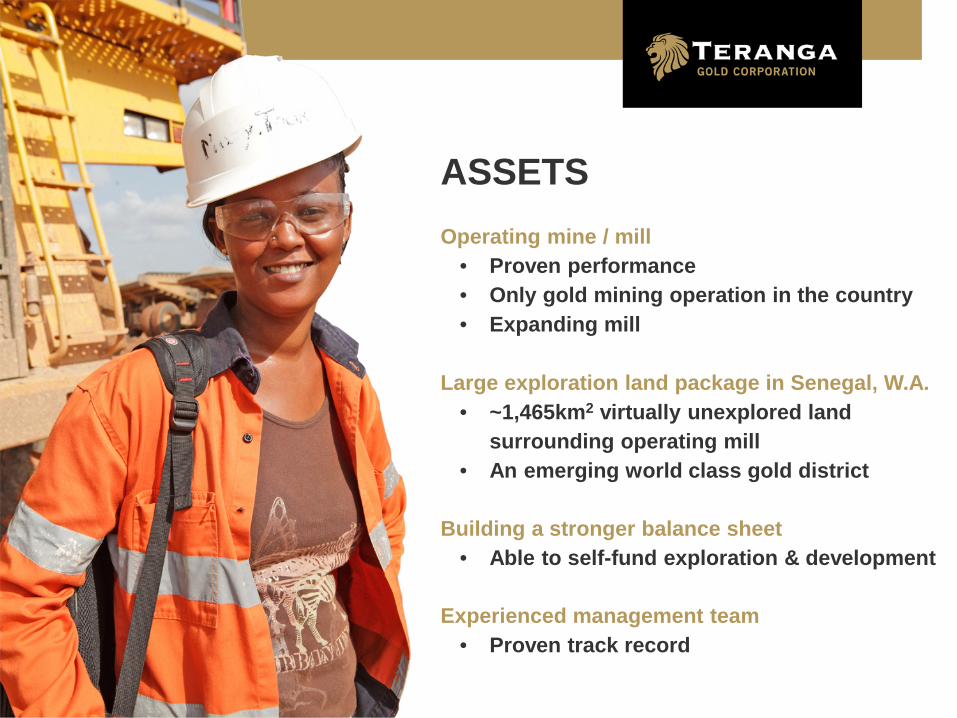
ASSETS Operating mine / mill
• Proven performance • Only gold mining operation in the country • Expanding mill
Large exploration land package in Senegal, W.A.
• ~1,465km2 virtually unexplored land surrounding operating mill
• An emerging world class gold district Building a stronger balance sheet
• Able to self-fund exploration & development Experienced management team
• Proven track record
6
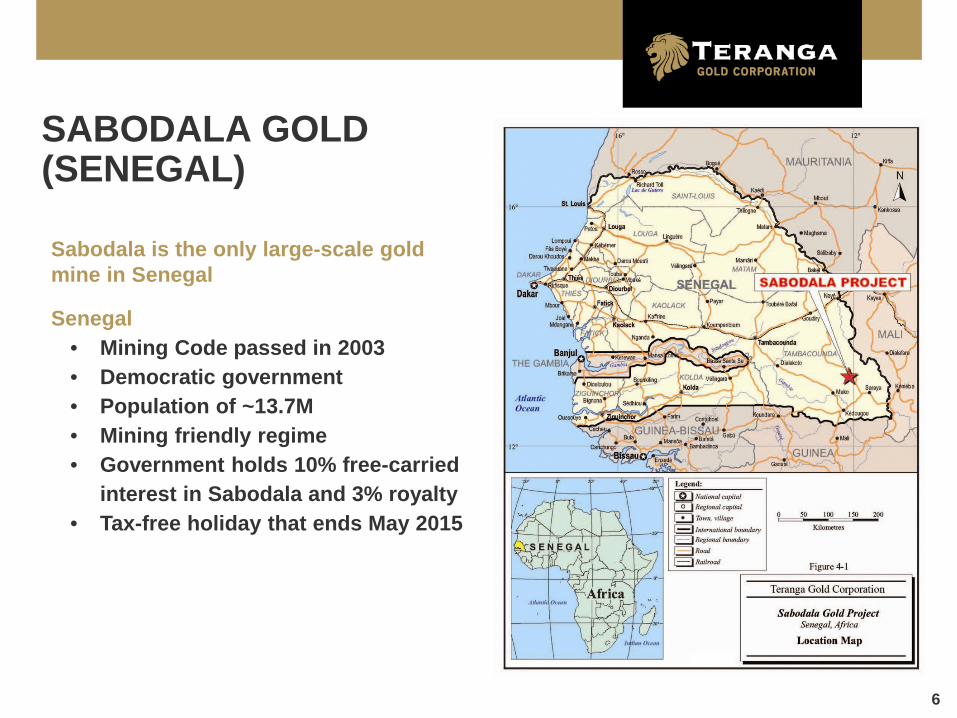
Sabodala is the only large-scale gold mine in Senegal
Senegal • Mining Code passed in 2003 • Democratic government • Population of ~13.7M • Mining friendly regime • Government holds 10% free-carried
interest in Sabodala and 3% royalty • Tax-free holiday that ends May 2015
SABODALA GOLD (SENEGAL)
7
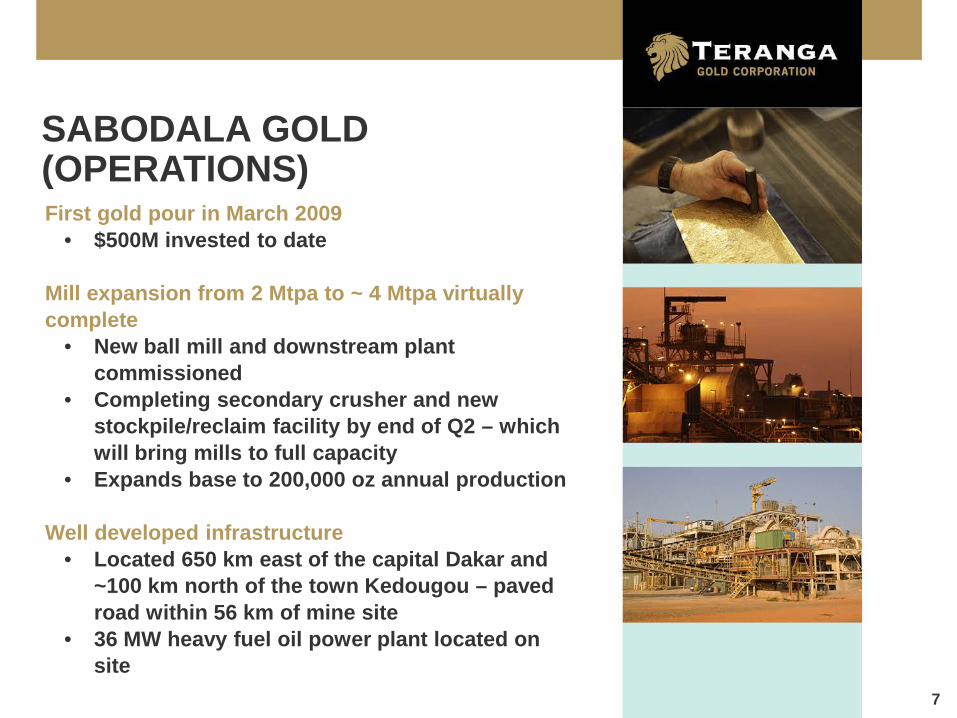
First gold pour in March 2009 • $500M invested to date
Mill expansion from 2 Mtpa to ~ 4 Mtpa virtually complete
• New ball mill and downstream plant commissioned
• Completing secondary crusher and new stockpile/reclaim facility by end of Q2 – which will bring mills to full capacity
• Expands base to 200,000 oz annual production
Well developed infrastructure • Located 650 km east of the capital Dakar and
~100 km north of the town Kedougou – paved road within 56 km of mine site
• 36 MW heavy fuel oil power plant located on site
SABODALA GOLD (OPERATIONS)
8
FOCUSED ON GROWING RESERVES(1)
• Objective: 10-15+ year mine life • Growth through exploration • Growth through regional opportunities (JV’s,
acquisitions)
FOCUSED ON GROWING PRODUCTION(1)
• Objective: 400,000 – 500,000 oz’s producer • Phase 1: 250,000 – 350,000 oz’s annually • Phase 2: 400,000 – 500,000 oz’s annually
Leveraging existing mill – land package all truckable
• Doubling mill capacity – could increase further
FOCUSED ON BUILDING FINANCIAL STRENGTH • Eliminating hedge book – quickly but prudently • Margin expansion (lower costs and eliminate hedge) • Free cash flow to self-fund exploration strategy • Manageable capex requirements
GROWTH STRATEGY
(1) See Key Assumptions on page 36
9
FOCUSED ON GROWTH
FOCUSED ON:
GROWING RESERVES
GROWING PRODUCTION
FINANCIAL STRENGTH
2011 Changes / Optimizations:
• Mill expansion
• Automated controls for better blending to increase throughput
• Second access ramp to the pit
• Revised drilling, blasting, and maintenance contracts in order to increase mining rate
• Improvements to employee compensation
10
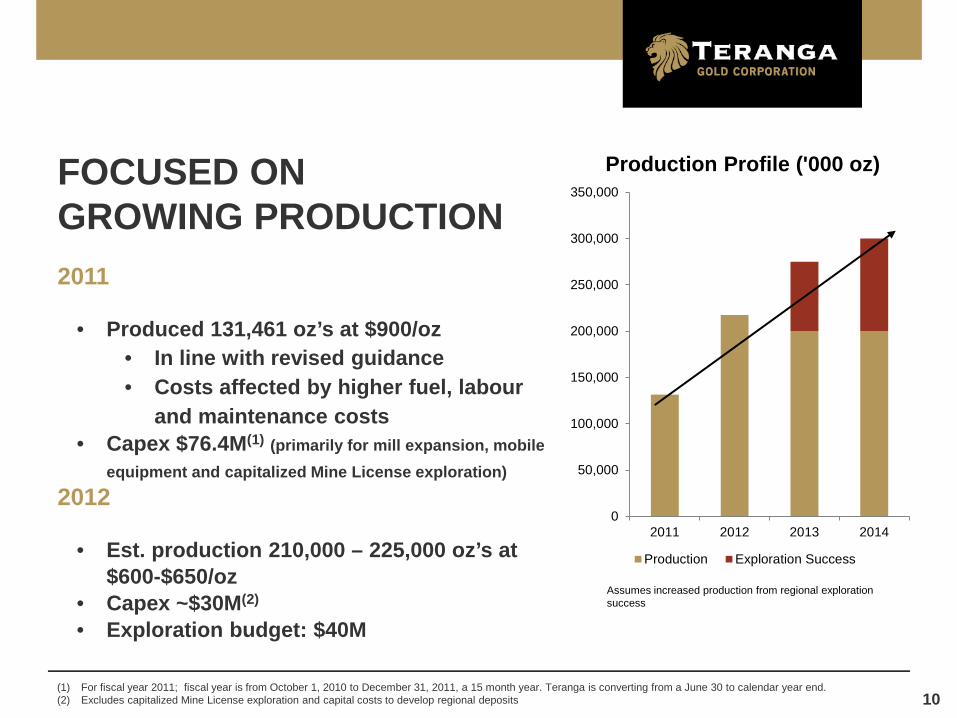
FOCUSED ON GROWING PRODUCTION 2011
• Produced 131,461 oz’s at $900/oz
• In line with revised guidance • Costs affected by higher fuel, labour
and maintenance costs • Capex $76.4M(1) (primarily for mill expansion, mobile
equipment and capitalized Mine License exploration) 2012
• Est. production 210,000 – 225,000 oz’s at
$600-$650/oz • Capex ~$30M(2) • Exploration budget: $40M
(1) For fiscal year 2011; fiscal year is from October 1, 2010 to December 31, 2011, a 15 month year. Teranga is converting from a June 30 to calendar year end. (2) Excludes capitalized Mine License exploration and capital costs to develop regional deposits
Assumes increased production from regional exploration success
0
50,000
100,000
150,000
200,000
250,000
300,000
350,000
2011 2012 2013 2014
Production Profile ('000 oz)
Production Exploration Success
11
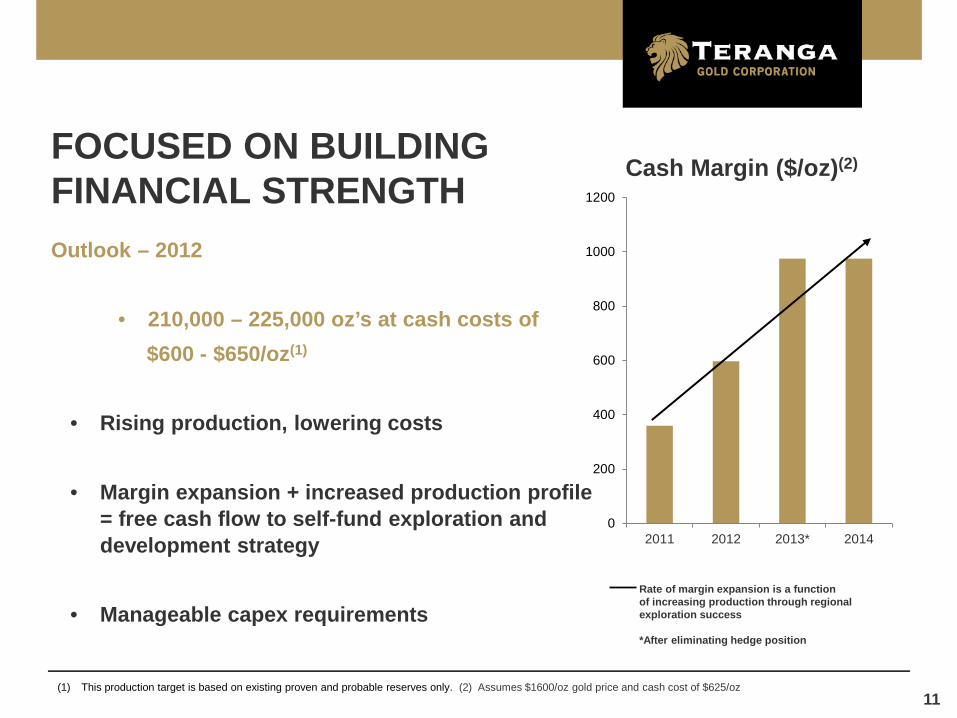
FOCUSED ON BUILDING FINANCIAL STRENGTH Outlook – 2012
• 210,000 – 225,000 oz’s at cash costs of $600 - $650/oz(1)
• Rising production, lowering costs
• Margin expansion + increased production profile
= free cash flow to self-fund exploration and development strategy
• Manageable capex requirements
(1) This production target is based on existing proven and probable reserves only. (2) Assumes $1600/oz gold price and cash cost of $625/oz
Rate of margin expansion is a function of increasing production through regional exploration success *After eliminating hedge position
0
200
400
600
800
1000
1200
2011 2012 2013* 2014
Cash Margin ($/oz)(2)
12
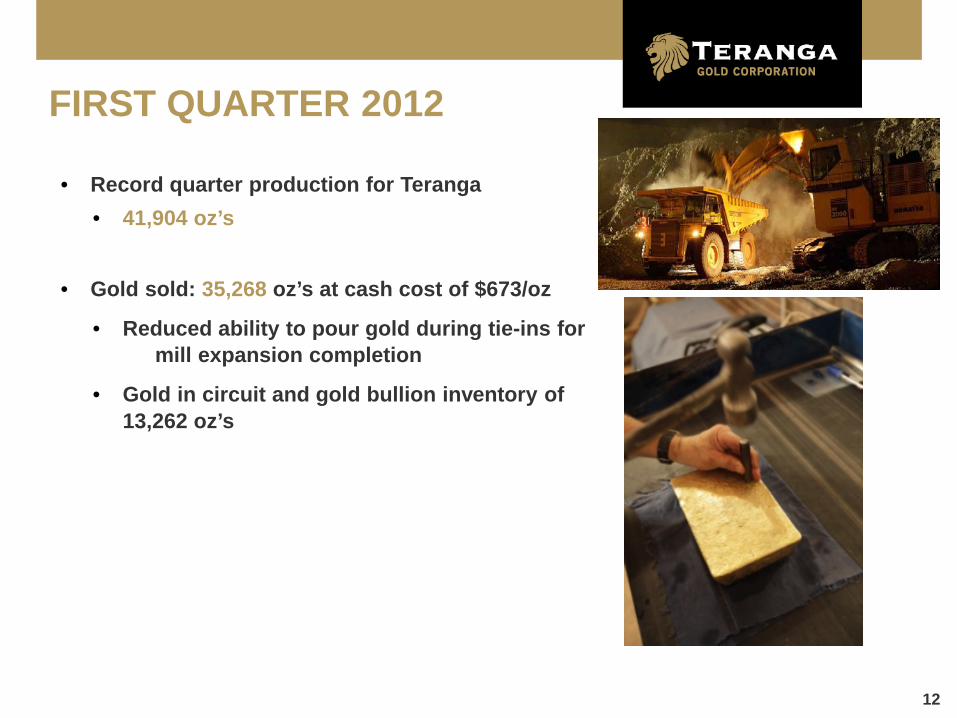
FIRST QUARTER 2012
• Record quarter production for Teranga • 41,904 oz’s
• Gold sold: 35,268 oz’s at cash cost of $673/oz
• Reduced ability to pour gold during tie-ins for mill expansion completion
• Gold in circuit and gold bullion inventory of 13,262 oz’s
13
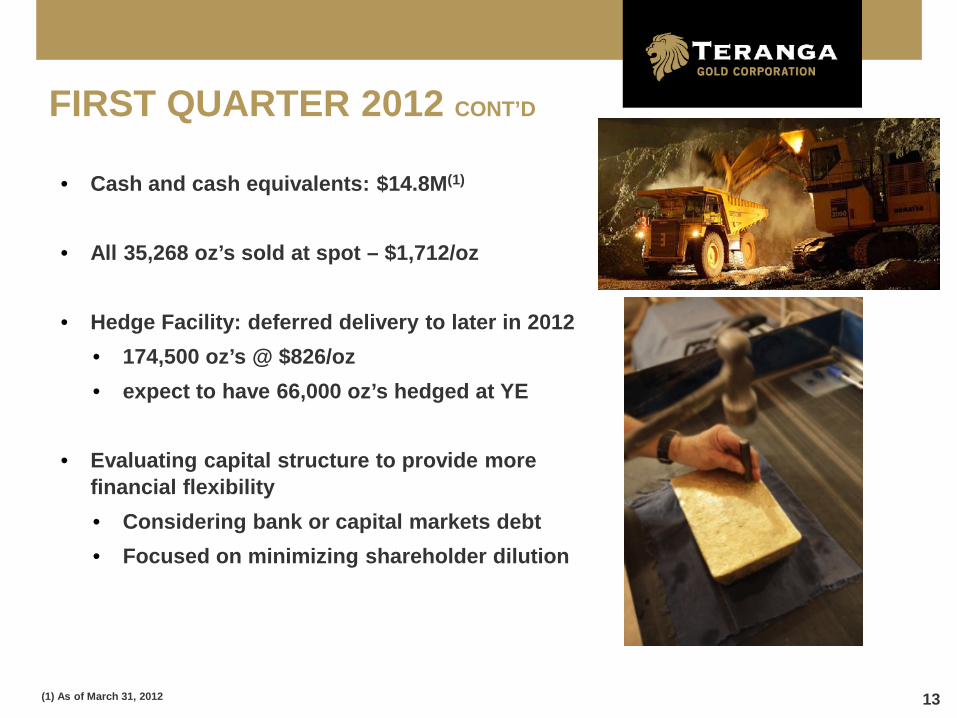
FIRST QUARTER 2012 CONT’D
• Cash and cash equivalents: $14.8M(1) • All 35,268 oz’s sold at spot – $1,712/oz
• Hedge Facility: deferred delivery to later in 2012
• 174,500 oz’s @ $826/oz • expect to have 66,000 oz’s hedged at YE
• Evaluating capital structure to provide more
financial flexibility • Considering bank or capital markets debt • Focused on minimizing shareholder dilution
(1) As of March 31, 2012
14
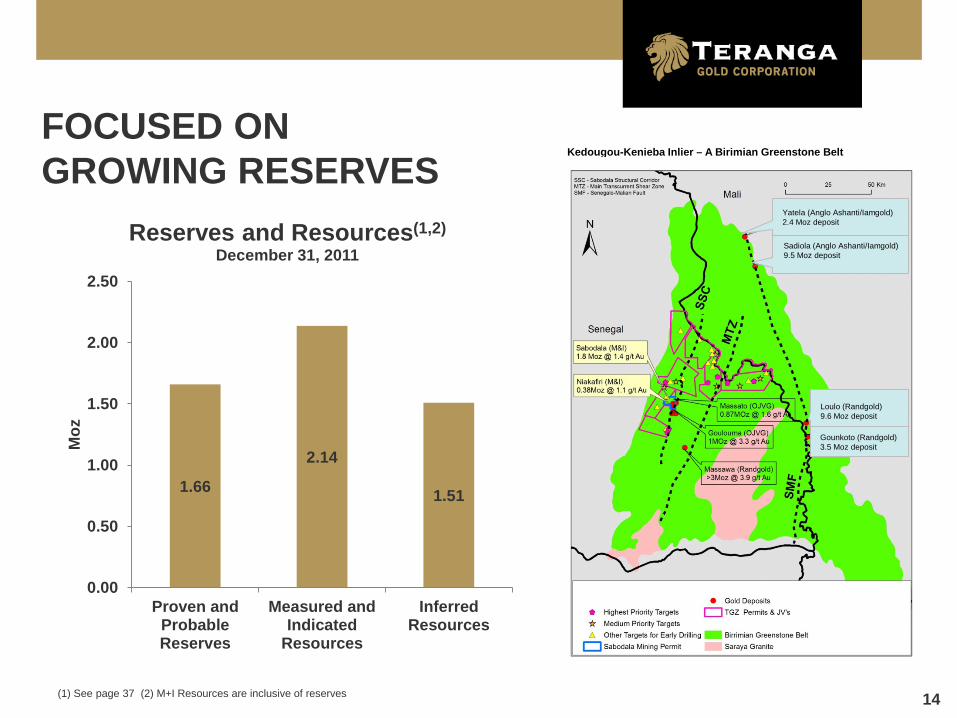
FOCUSED ON GROWING RESERVES
(1) See page 37 (2) M+I Resources are inclusive of reserves
Kedougou-Kenieba Inlier – A Birimian Greenstone Belt
1.66
2.14
1.51
0.00
0.50
1.00
1.50
2.00
2.50
Proven andProbableReserves
Measured andIndicated
Resources
InferredResources
Moz
Reserves and Resources(1,2) December 31, 2011
Yatela (Anglo Ashanti/Iamgold) 2.4 Moz deposit
Sadiola (Anglo Ashanti/Iamgold) 9.5 Moz deposit
Gounkoto (Randgold) 3.5 Moz deposit
Loulo (Randgold) 9.6 Moz deposit
15
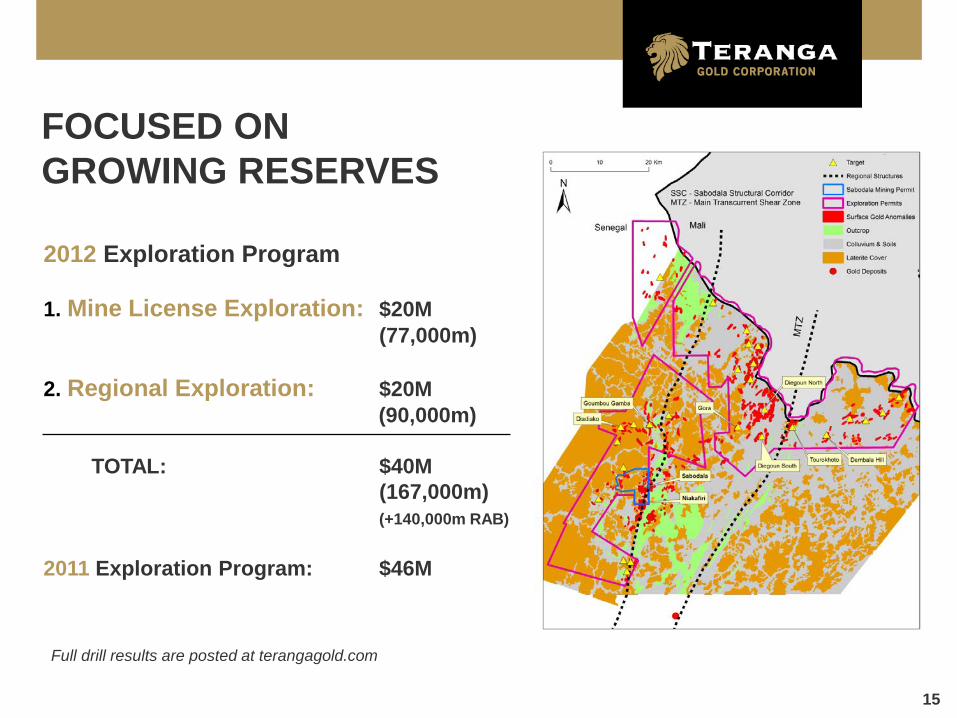
2012 Exploration Program 1. Mine License Exploration: $20M (77,000m) 2. Regional Exploration: $20M (90,000m) TOTAL: $40M (167,000m) (+140,000m RAB) 2011 Exploration Program: $46M
FOCUSED ON GROWING RESERVES
Full drill results are posted at terangagold.com
16
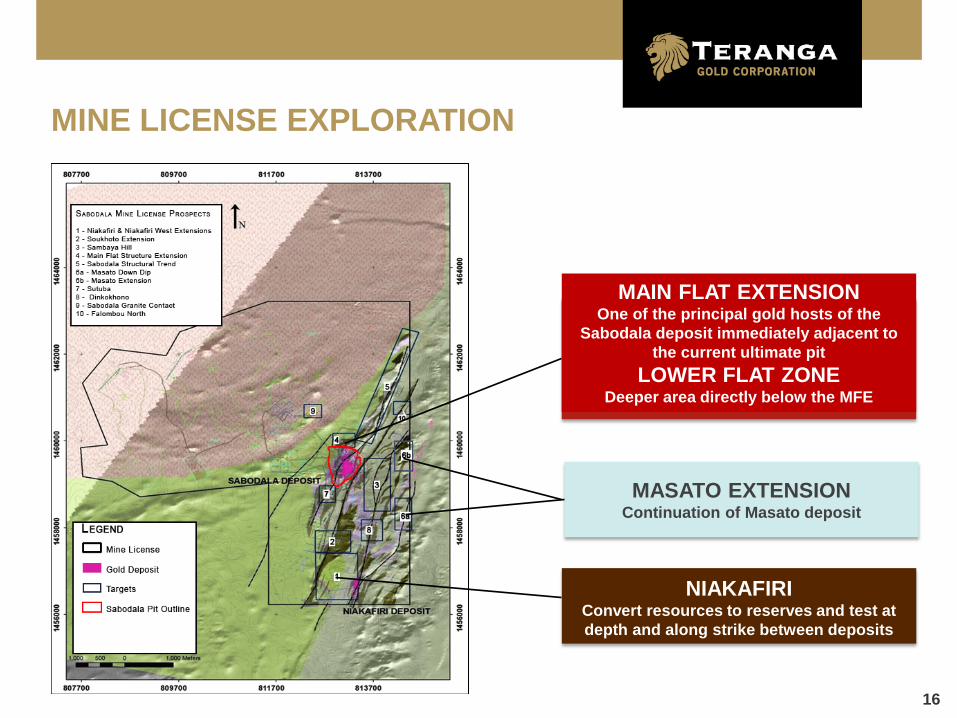
“THE CORRIDOR” Continuation of the main Sabodala
structural trend to the north
MAIN FLAT EXTENSION One of the principal gold hosts of the
Sabodala deposit immediately adjacent to the current ultimate pit
LOWER FLAT ZONE Deeper area directly below the MFE
MASATO EXTENSION Continuation of Masato deposit
MINE LICENSE EXPLORATION
NIAKAFIRI Convert resources to reserves and test at depth and along strike between deposits
17
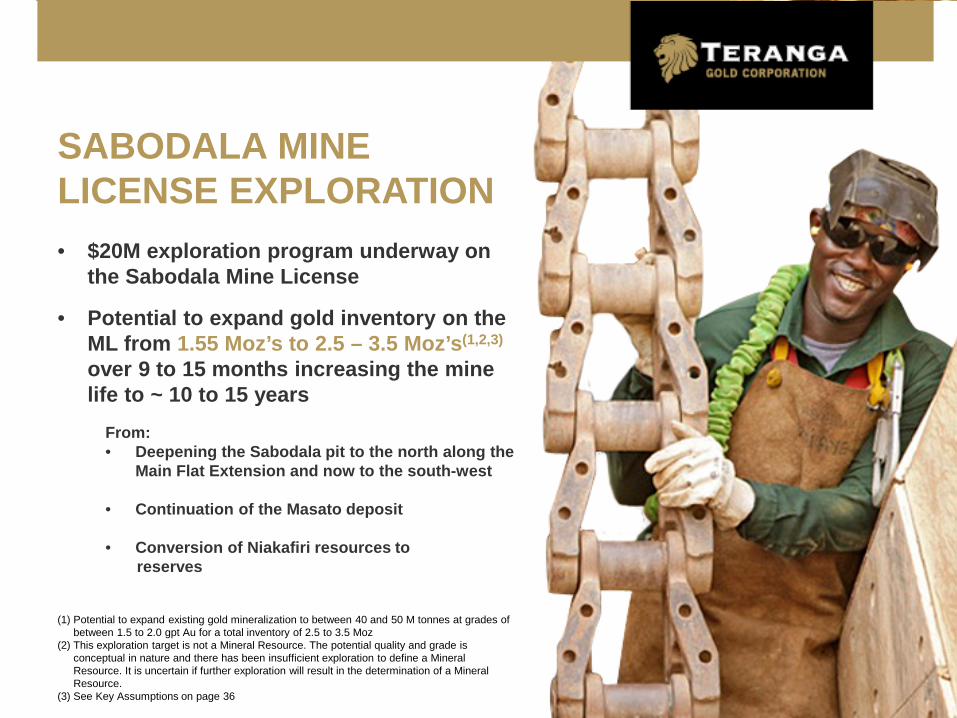
SABODALA MINE LICENSE EXPLORATION • $20M exploration program underway on
the Sabodala Mine License
• Potential to expand gold inventory on the ML from 1.55 Moz’s to 2.5 – 3.5 Moz’s(1,2,3)
over 9 to 15 months increasing the mine life to ~ 10 to 15 years
From: • Deepening the Sabodala pit to the north along the
Main Flat Extension and now to the south-west
• Continuation of the Masato deposit
• Conversion of Niakafiri resources to reserves
(1) Potential to expand existing gold mineralization to between 40 and 50 M tonnes at grades of
between 1.5 to 2.0 gpt Au for a total inventory of 2.5 to 3.5 Moz (2) This exploration target is not a Mineral Resource. The potential quality and grade is
conceptual in nature and there has been insufficient exploration to define a Mineral Resource. It is uncertain if further exploration will result in the determination of a Mineral Resource.
(3) See Key Assumptions on page 36
18
FOCUSED ON GROWTH
FOCUSED ON:
GROWING RESERVES
MINE LICENSE EXPLORATION – SABODALA PIT INCREASED OBJECTIVES:
• Sabodala pit (MFE/LFZ) objective over next 15
months
• Previous open pit objective • To add 250,000 – 500,000 oz’s*
• New open pit objective
• To add 500,000 – 1,000,000 oz’s*
• Larger pit
• Add to underground gold inventory
* At grades of between 1.5 to 2.0 gpt to gold inventory
19
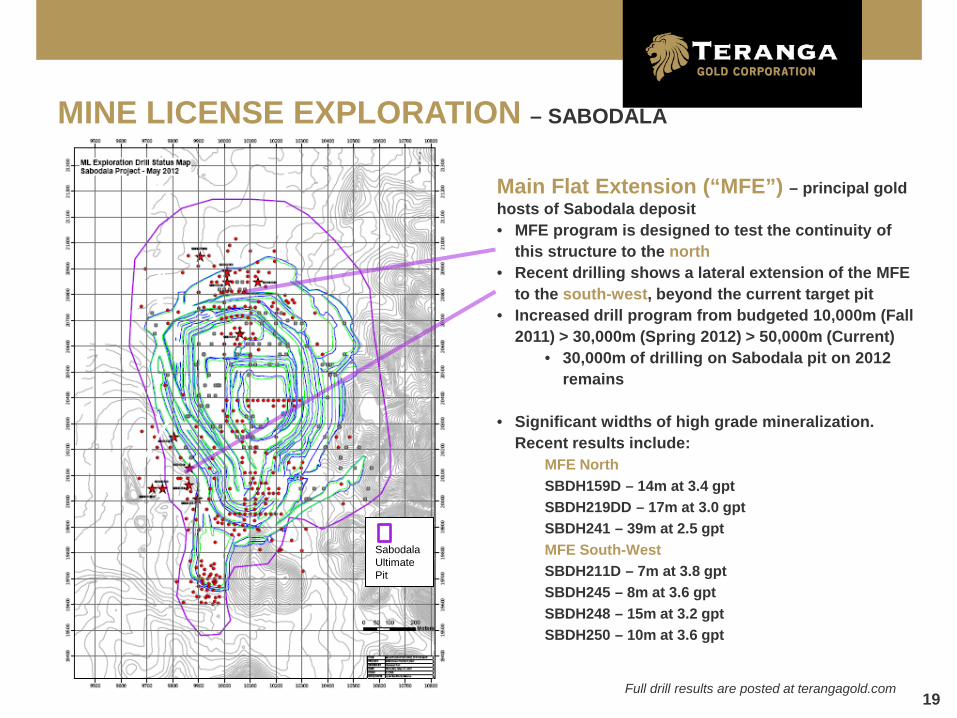
MINE LICENSE EXPLORATION – SABODALA
Main Flat Extension (“MFE”) – principal gold hosts of Sabodala deposit • MFE program is designed to test the continuity of
this structure to the north • Recent drilling shows a lateral extension of the MFE
to the south-west, beyond the current target pit • Increased drill program from budgeted 10,000m (Fall
2011) > 30,000m (Spring 2012) > 50,000m (Current) • 30,000m of drilling on Sabodala pit on 2012
remains
• Significant widths of high grade mineralization. Recent results include:
MFE North SBDH159D – 14m at 3.4 gpt SBDH219DD – 17m at 3.0 gpt SBDH241 – 39m at 2.5 gpt MFE South-West SBDH211D – 7m at 3.8 gpt SBDH245 – 8m at 3.6 gpt SBDH248 – 15m at 3.2 gpt SBDH250 – 10m at 3.6 gpt
Full drill results are posted at terangagold.com
Sabodala Ultimate Pit
20
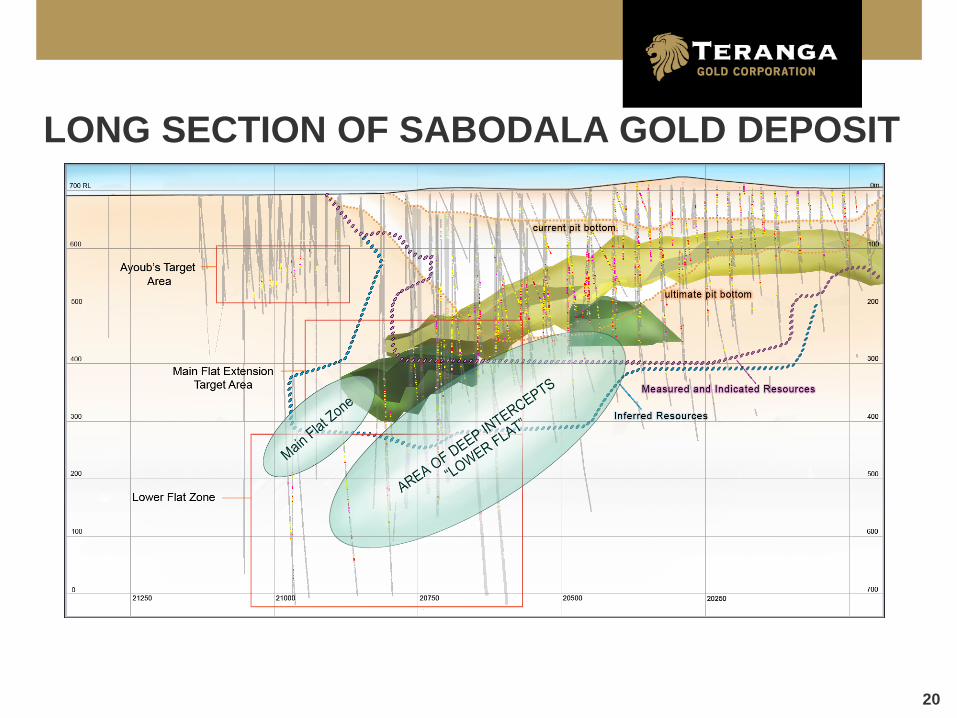
LONG SECTION OF SABODALA GOLD DEPOSIT
21
0
500
1,000
1,500
2,000
2,500
050
100150200250300350400450500
K Ounces G
old
M T
onne
s
Gold Price $/oz
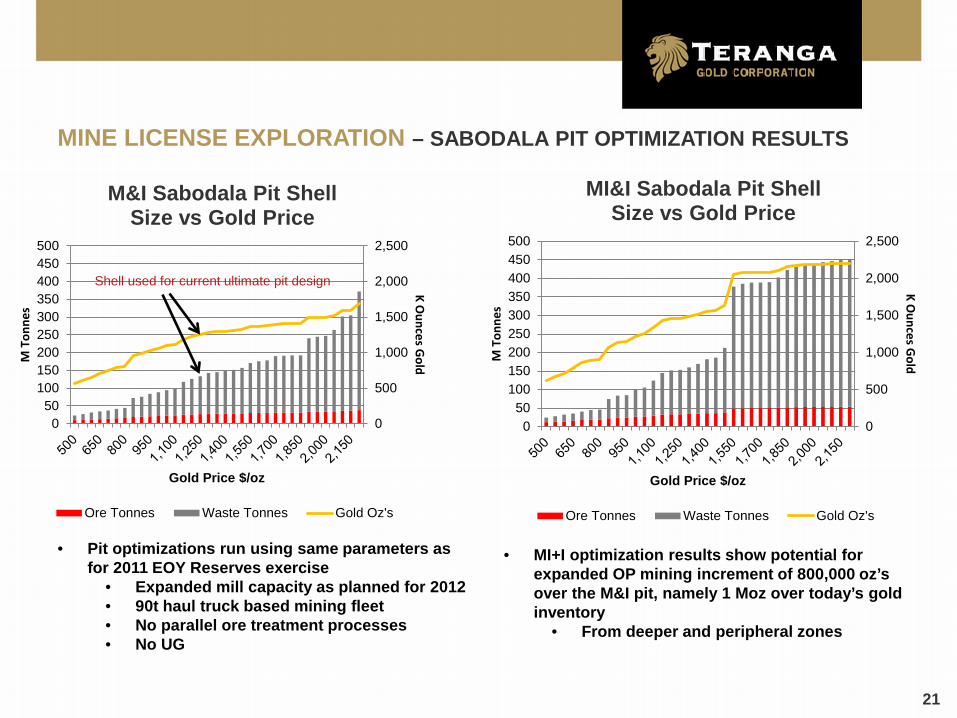
M&I Sabodala Pit Shell Size vs Gold Price
Ore Tonnes Waste Tonnes Gold Oz's
0
500
1,000
1,500
2,000
2,500
050
100150200250300350400450500
K Ounces G
old
M T
onne
s Gold Price $/oz
MI&I Sabodala Pit Shell Size vs Gold Price
Ore Tonnes Waste Tonnes Gold Oz's
MINE LICENSE EXPLORATION – SABODALA PIT OPTIMIZATION RESULTS
• Pit optimizations run using same parameters as for 2011 EOY Reserves exercise
• Expanded mill capacity as planned for 2012 • 90t haul truck based mining fleet • No parallel ore treatment processes • No UG
Shell used for current ultimate pit design
• MI+I optimization results show potential for expanded OP mining increment of 800,000 oz’s over the M&I pit, namely 1 Moz over today’s gold inventory
• From deeper and peripheral zones
22
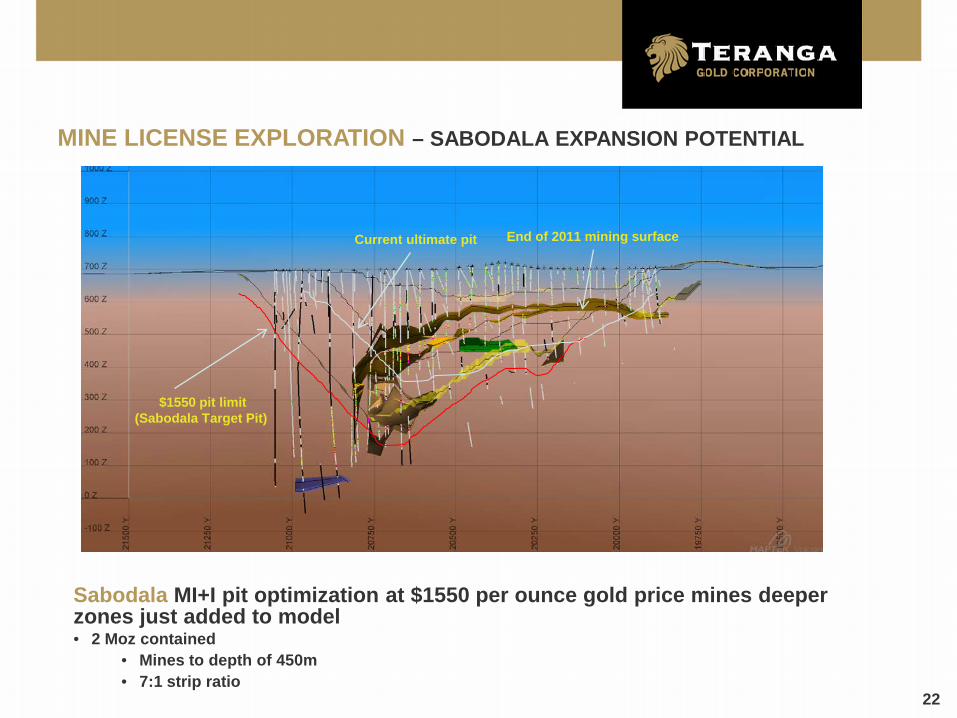
MINE LICENSE EXPLORATION – SABODALA EXPANSION POTENTIAL
Sabodala MI+I pit optimization at $1550 per ounce gold price mines deeper zones just added to model • 2 Moz contained
• Mines to depth of 450m • 7:1 strip ratio
End of 2011 mining surface Current ultimate pit
$1550 pit limit (Sabodala Target Pit)
23
Sabodala Pit
Masato Extensions
Sambaya Hill
Masato Down Dip
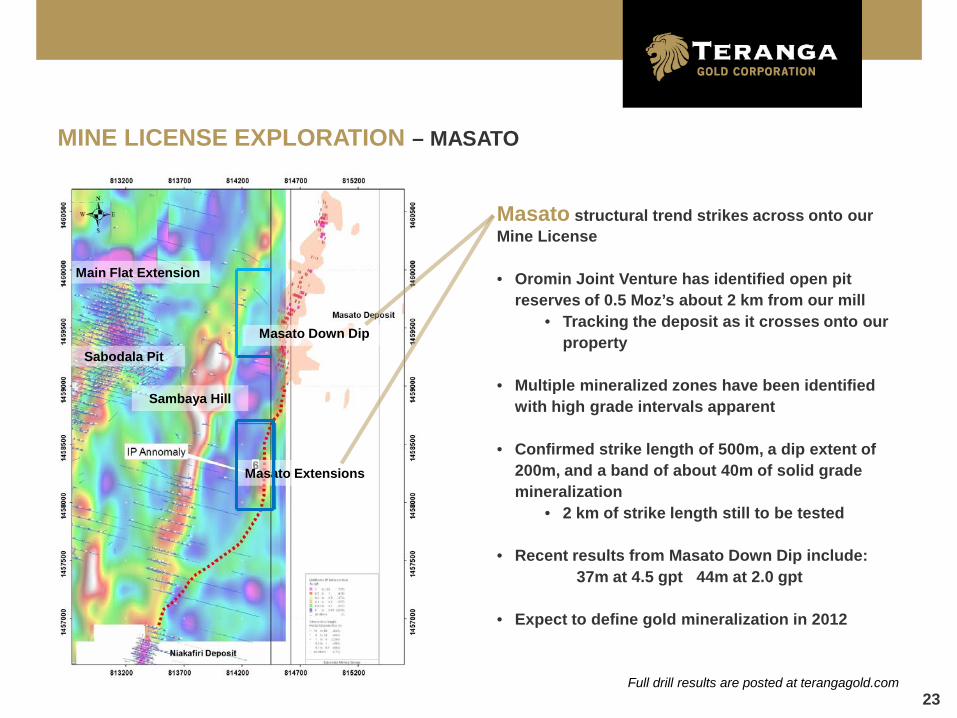
MINE LICENSE EXPLORATION – MASATO
Masato structural trend strikes across onto our Mine License • Oromin Joint Venture has identified open pit
reserves of 0.5 Moz’s about 2 km from our mill • Tracking the deposit as it crosses onto our
property
• Multiple mineralized zones have been identified with high grade intervals apparent
• Confirmed strike length of 500m, a dip extent of 200m, and a band of about 40m of solid grade mineralization
• 2 km of strike length still to be tested
• Recent results from Masato Down Dip include: 37m at 4.5 gpt 44m at 2.0 gpt
• Expect to define gold mineralization in 2012
Full drill results are posted at terangagold.com
Main Flat Extension
24
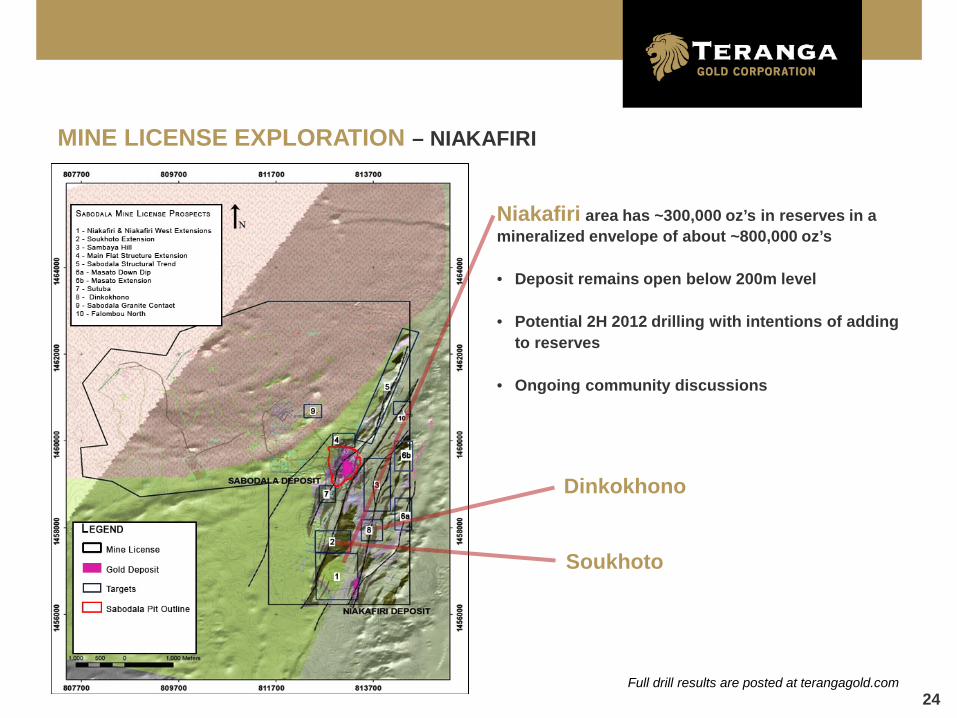
MINE LICENSE EXPLORATION – NIAKAFIRI
Niakafiri area has ~300,000 oz’s in reserves in a mineralized envelope of about ~800,000 oz’s
• Deposit remains open below 200m level
• Potential 2H 2012 drilling with intentions of adding
to reserves
• Ongoing community discussions
Full drill results are posted at terangagold.com
Dinkokhono
Soukhoto
25
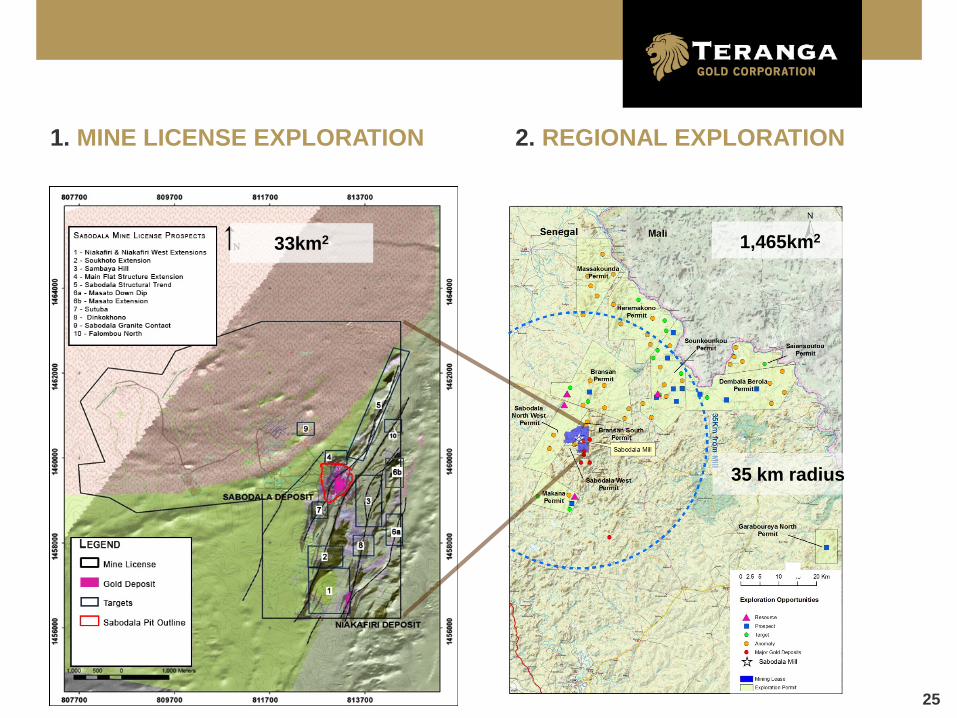
35 km radius
1. MINE LICENSE EXPLORATION 2. REGIONAL EXPLORATION
33km2 1,465km2
26
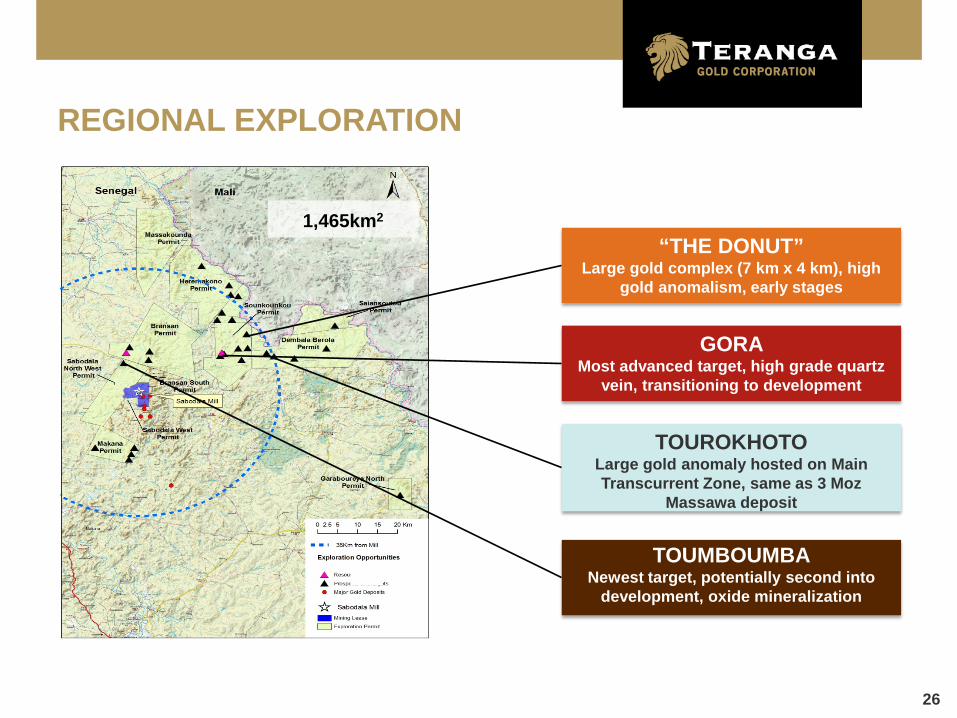
“THE DONUT” Large gold complex (7 km x 4 km), high
gold anomalism, early stages
GORA Most advanced target, high grade quartz
vein, transitioning to development
TOUROKHOTO Large gold anomaly hosted on Main Transcurrent Zone, same as 3 Moz
Massawa deposit
TOUMBOUMBA Newest target, potentially second into
development, oxide mineralization
REGIONAL EXPLORATION
1,465km2
27
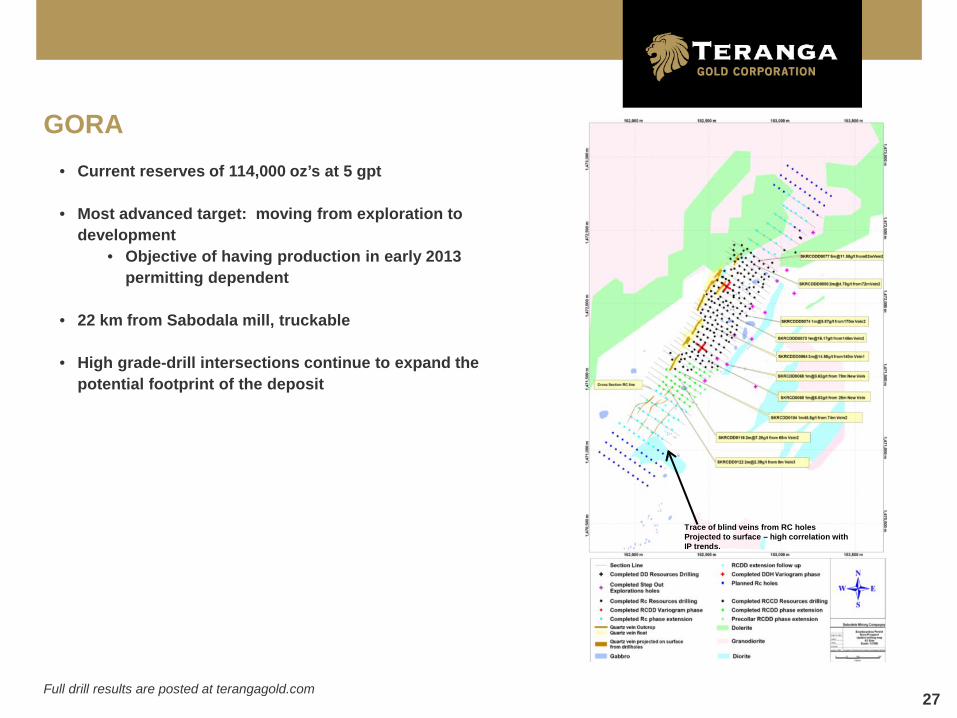
GORA • Current reserves of 114,000 oz’s at 5 gpt
• Most advanced target: moving from exploration to
development • Objective of having production in early 2013
permitting dependent
• 22 km from Sabodala mill, truckable • High grade-drill intersections continue to expand the
potential footprint of the deposit
Trace of blind veins from RC holes Projected to surface – high correlation with IP trends.
Full drill results are posted at terangagold.com
28
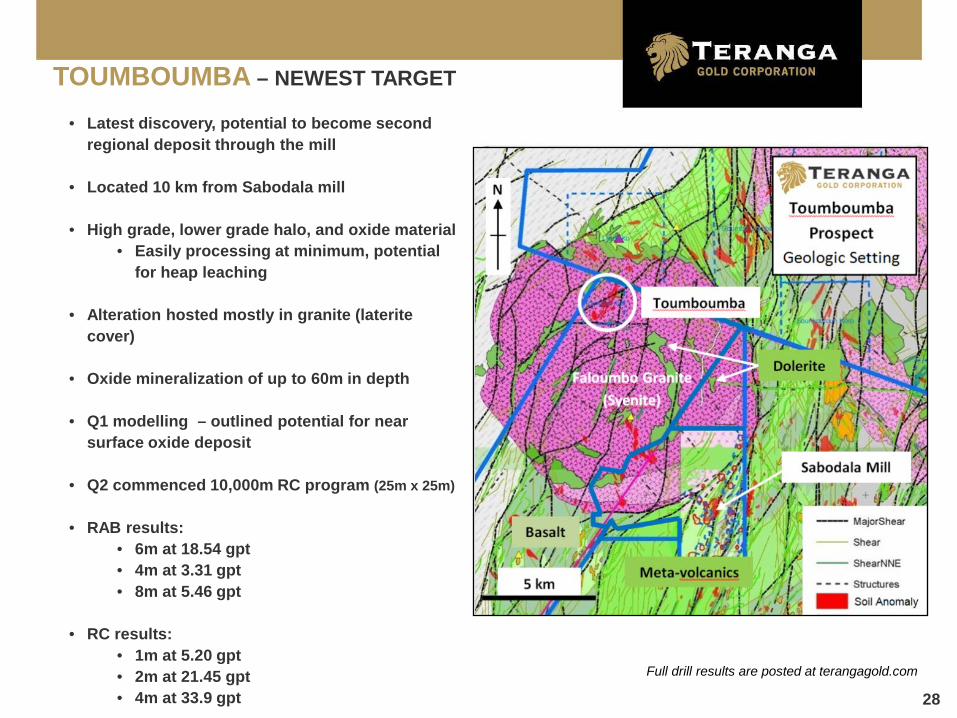
TOUMBOUMBA – NEWEST TARGET
• Latest discovery, potential to become second regional deposit through the mill
• Located 10 km from Sabodala mill
• High grade, lower grade halo, and oxide material • Easily processing at minimum, potential
for heap leaching • Alteration hosted mostly in granite (laterite
cover)
• Oxide mineralization of up to 60m in depth
• Q1 modelling – outlined potential for near surface oxide deposit
• Q2 commenced 10,000m RC program (25m x 25m)
• RAB results: • 6m at 18.54 gpt • 4m at 3.31 gpt • 8m at 5.46 gpt
• RC results:
• 1m at 5.20 gpt • 2m at 21.45 gpt • 4m at 33.9 gpt
Full drill results are posted at terangagold.com
29
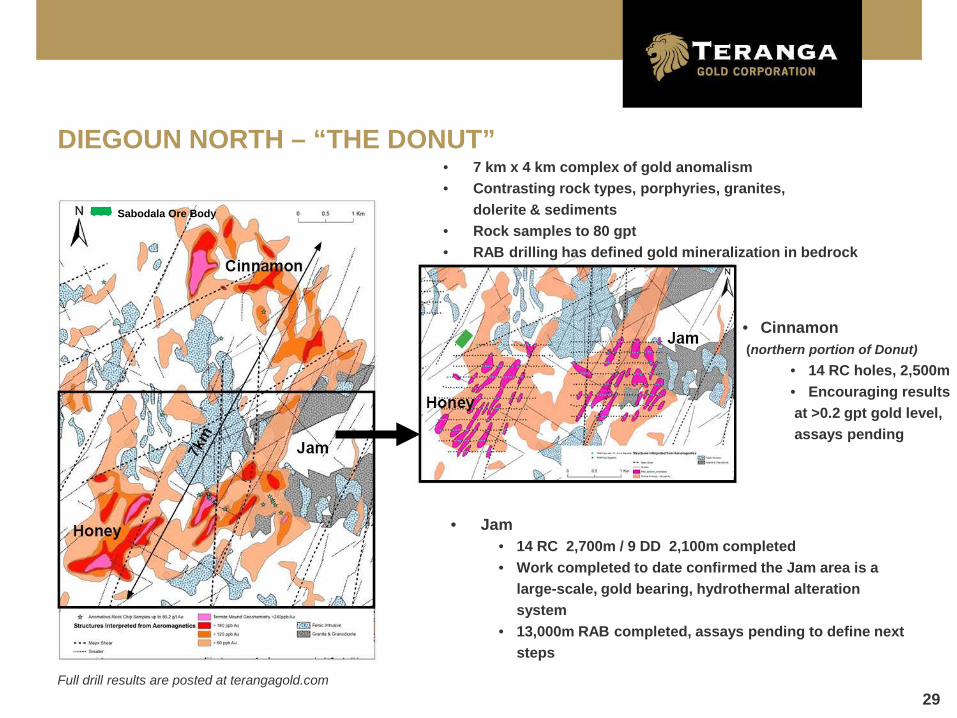
DIEGOUN NORTH – “THE DONUT” • 7 km x 4 km complex of gold anomalism • Contrasting rock types, porphyries, granites,
dolerite & sediments • Rock samples to 80 gpt • RAB drilling has defined gold mineralization in bedrock
• Jam • 14 RC 2,700m / 9 DD 2,100m completed • Work completed to date confirmed the Jam area is a
large-scale, gold bearing, hydrothermal alteration system
• 13,000m RAB completed, assays pending to define next steps
Sabodala Ore Body
Full drill results are posted at terangagold.com
• Cinnamon (northern portion of Donut)
• 14 RC holes, 2,500m • Encouraging results
at >0.2 gpt gold level, assays pending
30
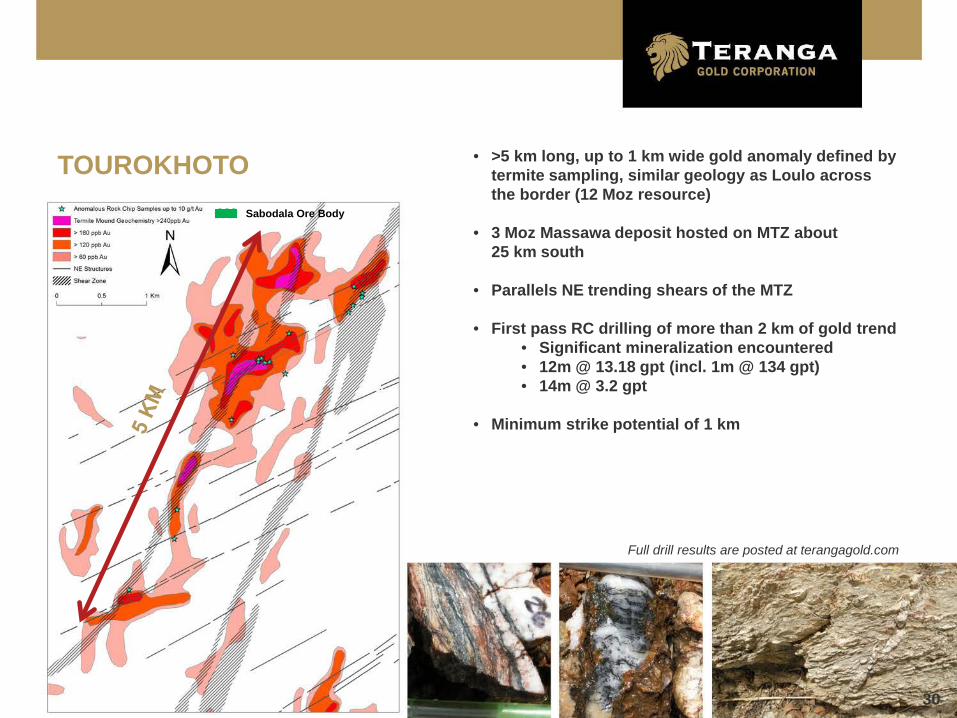
• >5 km long, up to 1 km wide gold anomaly defined by termite sampling, similar geology as Loulo across the border (12 Moz resource)
• 3 Moz Massawa deposit hosted on MTZ about 25 km south
• Parallels NE trending shears of the MTZ
• First pass RC drilling of more than 2 km of gold trend • Significant mineralization encountered • 12m @ 13.18 gpt (incl. 1m @ 134 gpt) • 14m @ 3.2 gpt
• Minimum strike potential of 1 km
TOUROKHOTO Sabodala Ore Body
Full drill results are posted at terangagold.com
31
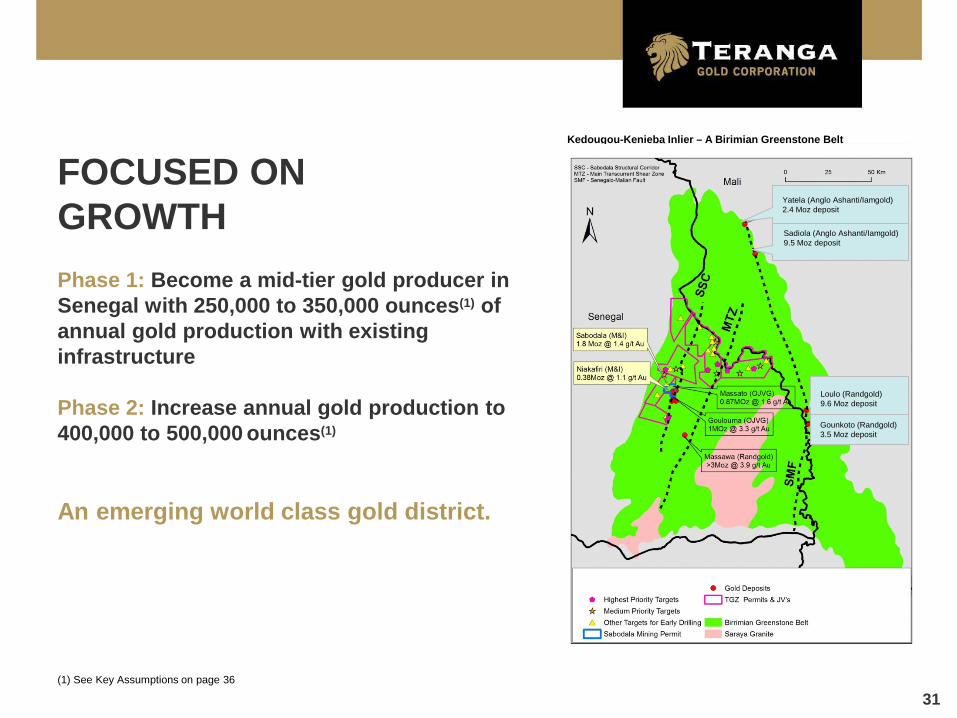
FOCUSED ON GROWTH Phase 1: Become a mid-tier gold producer in Senegal with 250,000 to 350,000 ounces(1) of annual gold production with existing infrastructure Phase 2: Increase annual gold production to 400,000 to 500,000 ounces(1) An emerging world class gold district.
(1) See Key Assumptions on page 36
Kedougou-Kenieba Inlier – A Birimian Greenstone Belt
Yatela (Anglo Ashanti/Iamgold) 2.4 Moz deposit
Sadiola (Anglo Ashanti/Iamgold) 9.5 Moz deposit
Gounkoto (Randgold) 3.5 Moz deposit
Loulo (Randgold) 9.6 Moz deposit
32
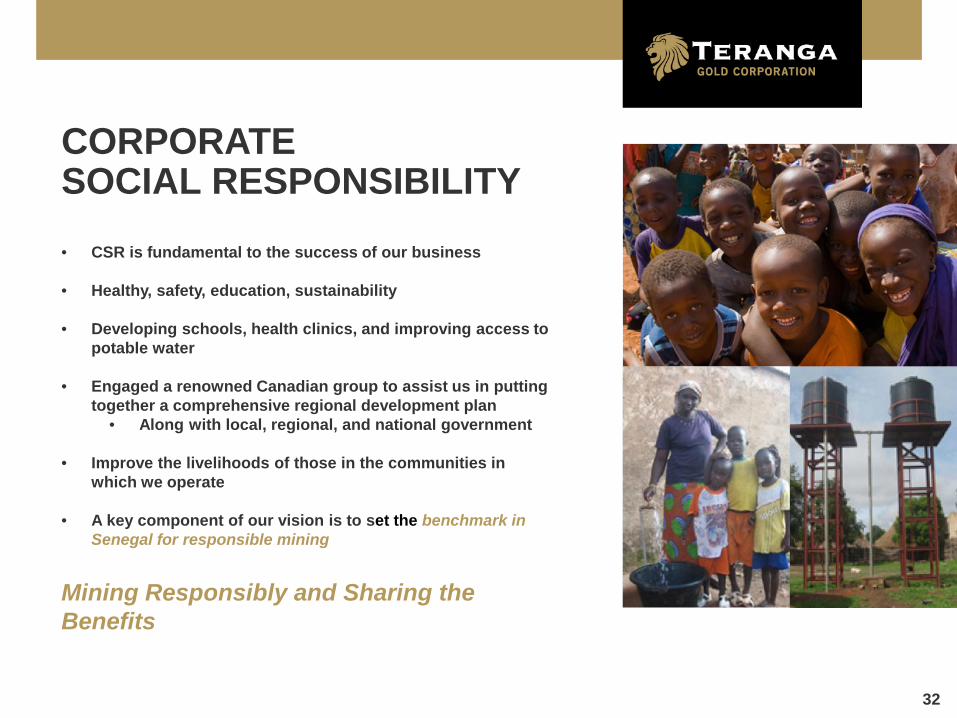
CORPORATE SOCIAL RESPONSIBILITY • CSR is fundamental to the success of our business
• Healthy, safety, education, sustainability
• Developing schools, health clinics, and improving access to
potable water
• Engaged a renowned Canadian group to assist us in putting together a comprehensive regional development plan
• Along with local, regional, and national government
• Improve the livelihoods of those in the communities in which we operate
• A key component of our vision is to set the benchmark in
Senegal for responsible mining Mining Responsibly and Sharing the Benefits
33
SUMMARY – FOCUSED ON GROWTH
1. Only mill in Senegal
2. Largest land position in Senegal
3. Rising production, declining costs
4. Building a stronger balance sheet – increasing production and free cash flow with margin expansion
5. Extensive exploration program
6. Experienced management team

34
PRODUCING AND EXPLORING
JUNE 2012
35
APPENDICES
36
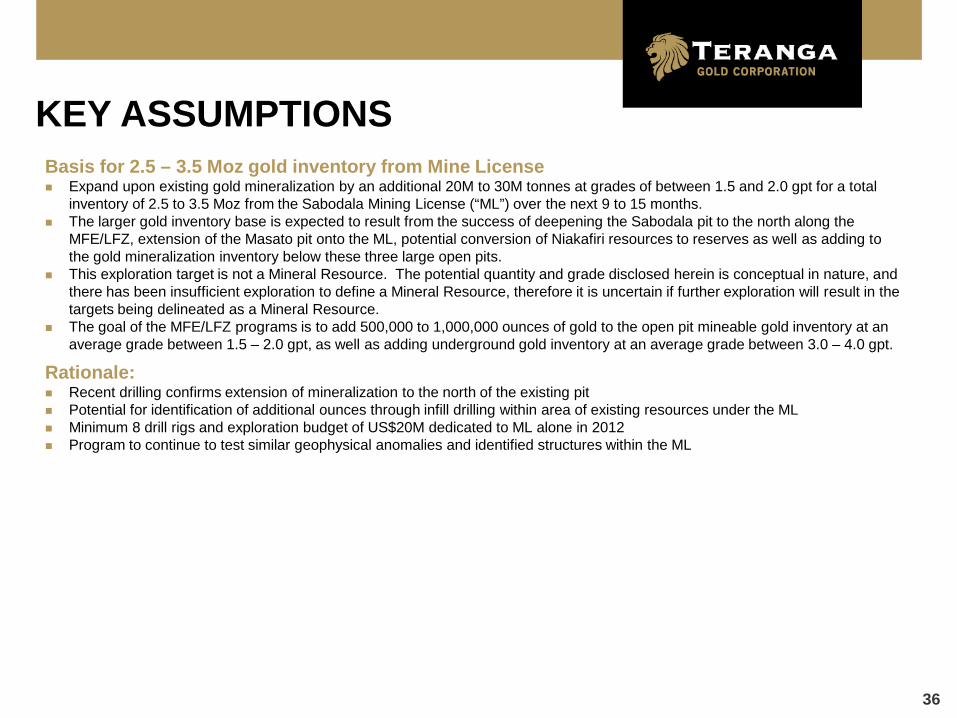
Basis for 2.5 – 3.5 Moz gold inventory from Mine License Expand upon existing gold mineralization by an additional 20M to 30M tonnes at grades of between 1.5 and 2.0 gpt for a total
inventory of 2.5 to 3.5 Moz from the Sabodala Mining License (“ML”) over the next 9 to 15 months. The larger gold inventory base is expected to result from the success of deepening the Sabodala pit to the north along the
MFE/LFZ, extension of the Masato pit onto the ML, potential conversion of Niakafiri resources to reserves as well as adding to the gold mineralization inventory below these three large open pits.
This exploration target is not a Mineral Resource. The potential quantity and grade disclosed herein is conceptual in nature, and there has been insufficient exploration to define a Mineral Resource, therefore it is uncertain if further exploration will result in the targets being delineated as a Mineral Resource.
The goal of the MFE/LFZ programs is to add 500,000 to 1,000,000 ounces of gold to the open pit mineable gold inventory at an average grade between 1.5 – 2.0 gpt, as well as adding underground gold inventory at an average grade between 3.0 – 4.0 gpt.
Rationale: Recent drilling confirms extension of mineralization to the north of the existing pit Potential for identification of additional ounces through infill drilling within area of existing resources under the ML Minimum 8 drill rigs and exploration budget of US$20M dedicated to ML alone in 2012 Program to continue to test similar geophysical anomalies and identified structures within the ML
KEY ASSUMPTIONS
37
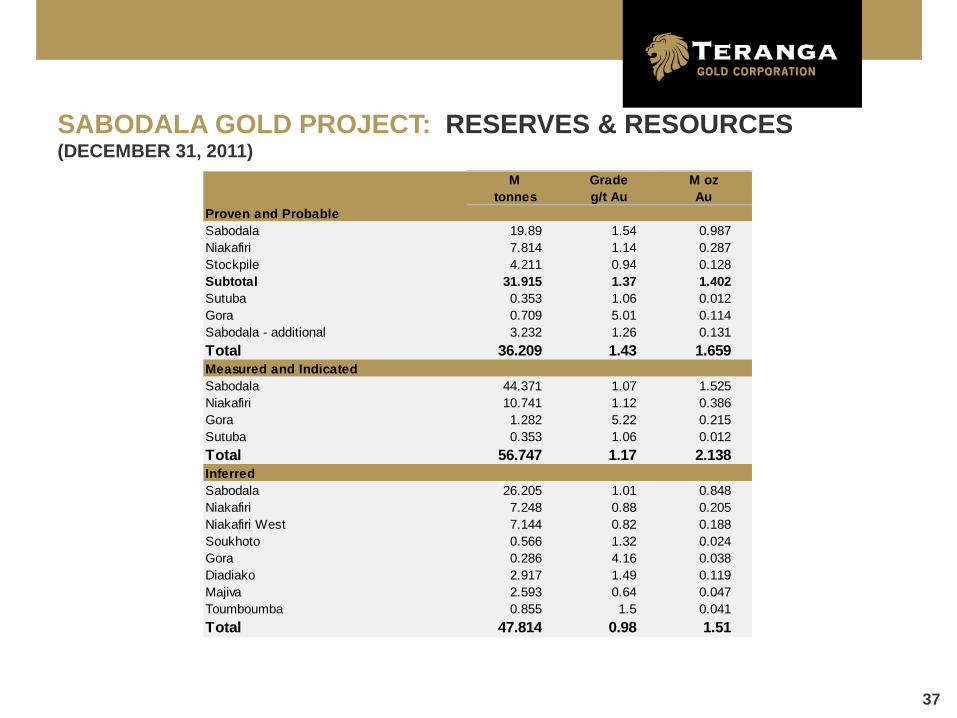
SABODALA GOLD PROJECT: RESERVES & RESOURCES (DECEMBER 31, 2011)
M Grade M oztonnes g/t Au Au
Proven and ProbableSabodala 19.89 1.54 0.987Niakafiri 7.814 1.14 0.287Stockpile 4.211 0.94 0.128Subtotal 31.915 1.37 1.402Sutuba 0.353 1.06 0.012Gora 0.709 5.01 0.114Sabodala - additional 3.232 1.26 0.131Total 36.209 1.43 1.659Measured and IndicatedSabodala 44.371 1.07 1.525Niakafiri 10.741 1.12 0.386Gora 1.282 5.22 0.215Sutuba 0.353 1.06 0.012Total 56.747 1.17 2.138InferredSabodala 26.205 1.01 0.848Niakafiri 7.248 0.88 0.205Niakafiri West 7.144 0.82 0.188Soukhoto 0.566 1.32 0.024Gora 0.286 4.16 0.038Diadiako 2.917 1.49 0.119Majiva 2.593 0.64 0.047Toumboumba 0.855 1.5 0.041Total 47.814 0.98 1.51
38
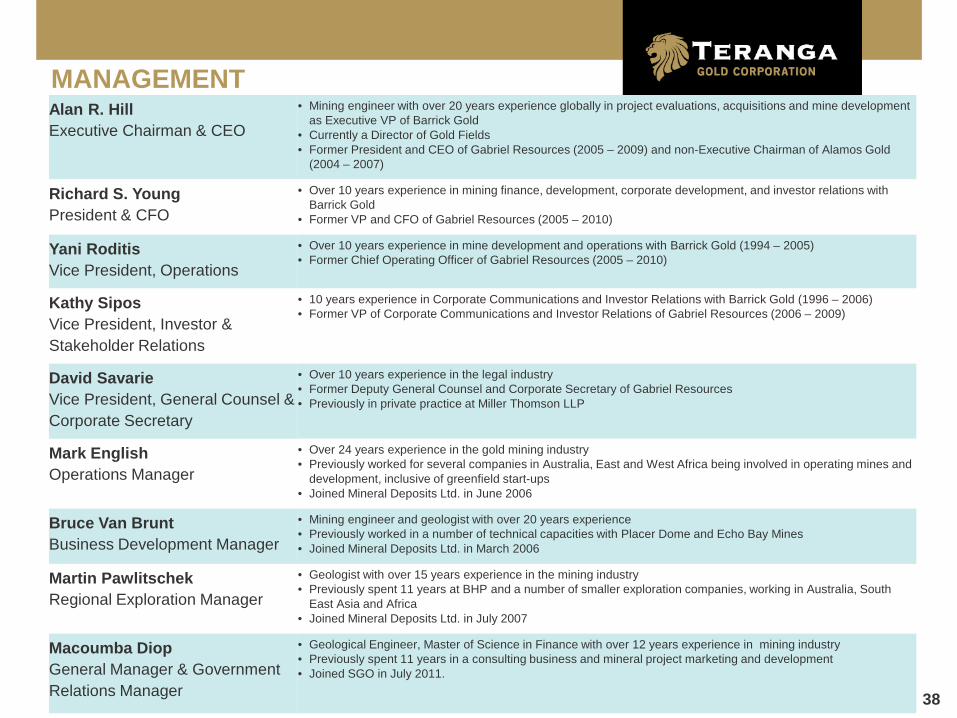
MANAGEMENT Alan R. Hill Executive Chairman & CEO
• Mining engineer with over 20 years experience globally in project evaluations, acquisitions and mine development as Executive VP of Barrick Gold
• Currently a Director of Gold Fields • Former President and CEO of Gabriel Resources (2005 – 2009) and non-Executive Chairman of Alamos Gold
(2004 – 2007)
Richard S. Young President & CFO
• Over 10 years experience in mining finance, development, corporate development, and investor relations with Barrick Gold
• Former VP and CFO of Gabriel Resources (2005 – 2010)
Yani Roditis Vice President, Operations
• Over 10 years experience in mine development and operations with Barrick Gold (1994 – 2005) • Former Chief Operating Officer of Gabriel Resources (2005 – 2010)
Kathy Sipos Vice President, Investor & Stakeholder Relations
• 10 years experience in Corporate Communications and Investor Relations with Barrick Gold (1996 – 2006) • Former VP of Corporate Communications and Investor Relations of Gabriel Resources (2006 – 2009)
David Savarie Vice President, General Counsel & Corporate Secretary
• Over 10 years experience in the legal industry • Former Deputy General Counsel and Corporate Secretary of Gabriel Resources • Previously in private practice at Miller Thomson LLP
Mark English Operations Manager
• Over 24 years experience in the gold mining industry • Previously worked for several companies in Australia, East and West Africa being involved in operating mines and
development, inclusive of greenfield start-ups • Joined Mineral Deposits Ltd. in June 2006
Bruce Van Brunt Business Development Manager
• Mining engineer and geologist with over 20 years experience • Previously worked in a number of technical capacities with Placer Dome and Echo Bay Mines • Joined Mineral Deposits Ltd. in March 2006
Martin Pawlitschek Regional Exploration Manager
• Geologist with over 15 years experience in the mining industry • Previously spent 11 years at BHP and a number of smaller exploration companies, working in Australia, South
East Asia and Africa • Joined Mineral Deposits Ltd. in July 2007
Macoumba Diop General Manager & Government Relations Manager
• Geological Engineer, Master of Science in Finance with over 12 years experience in mining industry • Previously spent 11 years in a consulting business and mineral project marketing and development • Joined SGO in July 2011.
39
COMPETENT PERSONS STATEMENT The information in this presentation relating to the reserve estimate associated with the Sabodala and Niakafiri pits as well as the Stockpiles is based on information compiled by Ms. Julia Martin, PEng, MAusIMM (CP) who is a full time employee of AMC Mining Consultants Canada and has sufficient experience which is relevant to the style of mineralisation and type of deposit under consideration and to the activity which she is undertaking to qualify as a "Competent Person" as defined in the 2004 Edition of the “Australasian Code for Reporting of Exploration Results, Mineral Resources and Ore Reserves”. Ms. Martin is a Qualified Person in accordance with NI 43-101 and consents to the inclusion in the report of the matters based on his information in the form and context in which it appears. The technical information in this presentation that relates to mineral resource estimates within the Mining License is based on information compiled by Mr. Bruce Van Brunt, who is a Fellow of the Australasian Institute of Mining and Metallurgy. Mr. Van Brunt is a full time employee of Teranga and not independent. Mr. Van Brunt has sufficient experience relevant to the style of mineralisation and type of deposit under consideration and to the activity he is undertaking to qualify as a "Competent Person" as defined in the 2004 Edition of the “Australasian Code of Reporting of exploration Results, Mineral Resources and Ore Reserves”. Mr. Van Brunt is a "Qualified Person" in accordance with National Instrument 43-101 and he consents to the inclusion of this information in the form and context in which it appears in this announcement. The technical information in this presentation that relates to the exploration results and targets within the regional exploration program are based on information compiled by Mr. Martin Pawlitschek, who is a member of the Australian Institute of Geoscientists. Mr. Pawlitschek is our full time employee and is not “independent” within the meaning of National Instrument 43-101. Mr. Pawlitschek has sufficient experience relevant to the style of mineralization and type of deposit under consideration and to the activity he is undertaking to qualify as a Competent Person as defined in the 2004 Edition of the “Australasian Code for Reporting of Exploration Results, Mineral Resources and Ore Reserves”. Mr. Pawlitschek is a “Qualified Person” in accordance with NI 43-101 and he consents to the inclusion of this information in the form and context in which it appears in this presentation.