Embed Size (px)
Citation preview
MBA IN A BOOK
1
Michael Herlache MBA
Managing Director at AltQuest Group
Doctor of Business Administration Candidate 2025, California Southern University
MBA in a Book
Investment Banking University Publishing
www.InvestmentBankingU.com

MBA IN A BOOK
2
For my wife, Svitlana, whom is my treasure.

MBA IN A BOOK
3
About the Author: Michael Herlache is the MD of M&A at AltQuest Group, a middle market boutique investment bank located in Wisconsin. He lives in his home in Wisconsin with his wife, Svitlana. Michael has an MBA in Finance from Texas A&M University and is getting his Doctorate in Business Administration with a focus on finance. To learn more about AltQuest Group, please go to www.AltQuest.com.
For those interested in going through a formal investment banking training program associated with this text, the Investment Banking University (www.InvestmentBankingU.com) course’s syllabus is based upon the content of this book.

MBA IN A BOOK
4
Contents
PERPETUITY SCIENCE:
Part I: Perpetuity Science Methodology
Chapter 1: What You Learn in Business School vs. What You Should Learn in Business School
Chapter 2: What is Business?
Chapter 3: What is a Perpetuity?
Chapter 4: Perpetuity by Industry
Chapter 5: Capitalism as a Perpetuity Game
Chapter 6: Playing the Perpetuity Game
Chapter 7: Perpetuities & the Capital Markets
FOUNDATIONS OF VALUATION:
Part I: Tracking Value (Accounting)
Chapter 4: Tracking Value with Accounts
Chapter 5: Accounts to Financial Statements
Part II: Analyzing Value (Finance)
Chapter 5: Financial Statements to Finance
Chapter 5: Analyzing Value with Finance
Part III: Modeling Value
Chapter 6: Finance with Excel
Chapter 7: Financial Statement Modeling
Chapter 7: Adjusted EBITDA Calculation
Part III: Valuation Methodologies
Chapter 8: Valuation Principle
Chapter 9: Valuation Build Up
Chapter 10: Public Company Valuation
Chapter 11: Comp Companies
Chapter 12: Comp Transactions
Chapter 13: Discounted Cash Flow (DCF)
Chapter 14: Triangulating Valuation with the Football Field
BUILD-SIDE:
Part I: How to Build a Perpetuity?
Chapter 9: How to Build a Benefit Stream?
Chapter 10: How to De-Risk the Benefit Stream?
Chapter 10: The Build Side & Corporate Finance
Chapter 10: Corporate Finance Decision 1: Uses (Investment)
Chapter 10: Corporate Finance Decision 2: Sources (Financing)
Chapter 10: Corporate Finance Decision 3: Reinvest vs. Return Capital (Dividend)
MBA IN A BOOK
5
Chapter 10: Sources & Uses Matching
Chapter 10: Cash Surplus/Shortfall Tracking
Part II: Perpetuity Analysis
Chapter 12: Net Present Value (NPV)
Chapter 12: Internal Rate of Return (IRR)
Chapter 12: Ratio Analysis
Part III: Perpetuity Modeling & Valuation
Chapter 14: Return Expectations
Chapter 14: Finding Weighted Average Cost of Capital (WACC)
Chapter 15: Finding Intrinsic Value Using DCF
Chapter 14: Framing Valuation
Part IV: Perpetuity Engineering
Chapter 15: How to Be an Engineer?
Chapter 16: Mechanical Engineering
Chapter 16: Knowledge Engineering
Chapter 17: Content Engineering
Chapter 18: Platform Engineering
Part V: Perpetuity Management
Chapter 12: How to Be a CEO?
Chapter 13: How to Be a Consultant?
Chapter 19: Perpetuity Management
Chapter 22: The Market for Perpetuities
Chapter 20: Index Building & Benchmarking
Chapter 21: Financial Data Sources
SELL-SIDE:
Part I: How to Sell a Perpetuity?
Chapter 23: Investment Banking
Chapter 24: How to Build a Middle Market M&A Practice
Part II: The Middle Market
Chapter 25: Middle Market Breakdown
Chapter 26: Buyer Profile: Individuals & Search Funds
Chapter 27: Buyer Profile: Lower Middle Market Private Equity
Chapter 28: Buyer Profile: Middle Market Private Equity
Chapter 29: Buyer Profile: Strategics
Part III: M&A Multiples
Chapter 30: M&A Multiples
Part IV: Investment Banking Coverage Methodology
Chapter 31: Investment Banking Coverage Methodology
Chapter 32: Index Building & Benchmarking
Chapter 33: Financial Data Sources
MBA IN A BOOK
6
Chapter 34: Industry or Sector Newsletter
Chapter 35: Industry or Sector Report
Chapter 36: Rolodex Building
Chapter 36: Industry & State Level Coverage
Part V: M&A Origination Methodology
Chapter 37: M&A Origination Methodology
Part VI: Mandate/Target Matching Methodology
Chapter 38: Mandate/Target Matching Methodology
Part VI: M&A Fee Methodology
Chapter 39: M&A Success Fee
Chapter 40: The M&A Engagement Letter
Part VI: Buyer List Methodology
Chapter 41: How to Build a Buyer List
Chapter 42: Outreach to the Buyer List
Part VII: Deal Structuring
Chapter 43: Deal Structuring
Chapter 43: Asset Sale vs. Stock Sale
Part VIII: M&A Process
Chapter 44: M&A Process
Chapter 44: Dealing with Sellers
Chapter 44: Dealing with Buyers
Part IX: Investment Bank Management
Chapter 45: How to Build a Boutique Investment Bank?
Chapter 46: Running the Boutique Investment Bank
Part X: Investment Banking Deliverables
Chapter 47: Investment Banking Deliverables
Chapter 48: Adjusted EBITDA
Chapter 49: Valuation
Chapter 50: Teaser
Chapter 51: CIM (Confidential Information Memorandum)
Chapter 51: Letter of Intent (LOI)
Chapter 51: Purchase Agreement
Chapter 51: Minimum Financials to Do a Deal
BUY-SIDE:
Part I: How to Buy a Perpetuity?
Chapter 12: Recurring Revenue Analysis
Chapter 12: Owner Dependence Analysis
Chapter 12: Customer Concentration Analysis
Chapter 52: The Principle of Investing
Chapter 53: How to Be a Warren Buffett?

MBA IN A BOOK
7
Chapter 54: The Operating Model
Chapter 55: The Financial Buyer aka Private Equity
Chapter 55: Leveraged Buyout (LBO) Modeling
Chapter 56: The Strategic Buyer aka Corporation
Chapter 56: Merger Modeling
Chapter 57: Perpetuity Science & Portfolio Theory
Chapter 58: How to Start a LMM Search Fund?
CASES:
Part XVIII: Build Side Cases
Chapter 59: AltQuest Group
Chapter 60: Investment Banking University
Chapter 61: CI Institute
Chapter 62: M&A Nexus
Part XVIII: Sell Side Cases
Chapter 63: Sigma Solve
Chapter 64: Aesthetics Institute
Chapter 65: Esco Fasteners
Chapter 65: Guiliante Machine Tool
Chapter 65: Toledo Jet
Chapter 65: Martens Farm
Part XVIII: Buy Side Cases
MBA IN A BOOK
8
Preface
There are many investment banking texts out there that claim that financial modeling and valuation is the core work of the investment banker. This is simply not the truth. The core work of the investment banker is origination, mandate/target matching, and deal structuring. It should follow that a text/course on investment banking should be based upon the same. It is the good fortune that the reader has encountered such a book/course. Investment Banking: M&A Origination, Execution, Financial Modeling & Valuation explains origination, mandate/target matching, and deal structuring (i.e. how investment bankers actually make their money). For those new to investment banking you are first going to want to clarify whether you would like to work on the sell side for a few years or pursue a career in investment banking. The skills that you will need to get started in investment banking are different than those that you will need to have a long and successful career in investment banking. The role in investment banking transforms from one that is research, financial modeling & valuation based into one focused on origination and facilitating the M&A process. M&A (Mergers & Acquisitions) is the core product of investment banking, and the other products, advisory & capital-raising, simply support this. We founded Investment Banking University (www.InvestmentBankingU.com) to prepare students for both bulge bracket and middle market investment banking career opportunities.
We see a paradigm shift occurring in the field of investment banking. The idea that you need to spend three years of your life as an analyst doing 80+ hour workweeks building financial models to become an investment banker is a faulty paradigm. The real value add of an investment banker is not financial modeling & valuation, but rather origination, mandate/target matching, and deal structuring. You don’t need Goldman Sachs’ permission to be an investment banker just like you don’t need McKinsey’s permission to be a consultant. Investment banking for private companies in the middle market is a great way to build your initial coverage and career as an investment banker without sacrificing a family life or your health.
MBA IN A BOOK
9
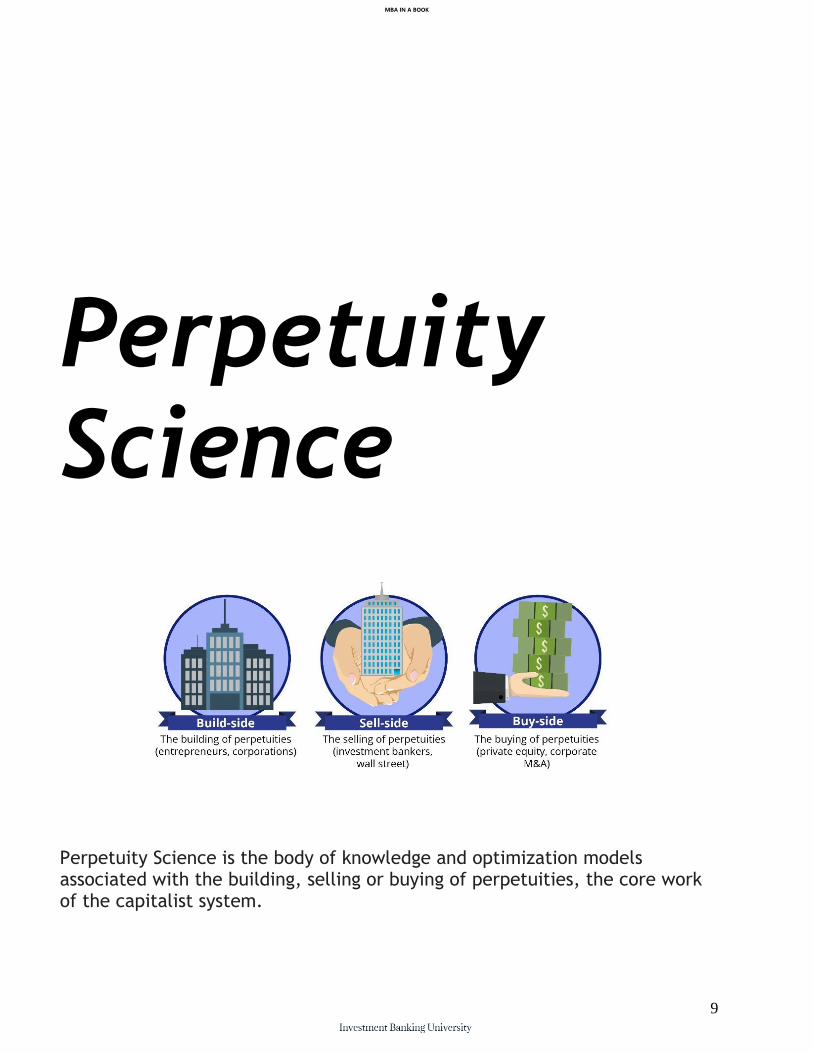
Perpetuity Science
Perpetuity Science is the body of knowledge and optimization models associated with the building, selling or buying of perpetuities, the core work of the capitalist system.
MBA IN A BOOK
10
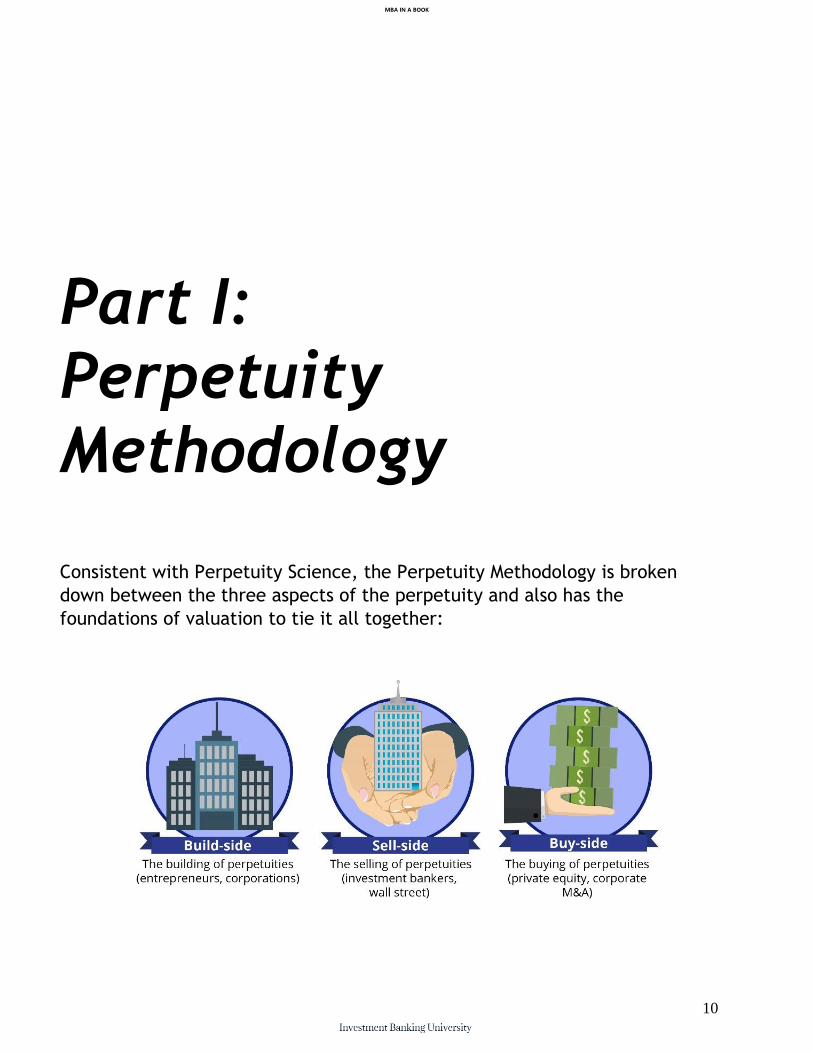
Part I:
Perpetuity Methodology Consistent with Perpetuity Science, the Perpetuity Methodology is broken
down between the three aspects of the perpetuity and also has the
foundations of valuation to tie it all together:
MBA IN A BOOK
11
Chapter 1:
What You Learn in Business School vs. What You Should Learn in Business School
The standard MBA curriculum at most business schools is broken down along siloed subjects such as accounting, finance, management, operations, and marketing and attempts to teach students how to be a mid-level manager at a large corporation for the rest of their lives. Unfortunately, these jobs are mostly gone, having been shipped overseas or automated. This MBA curriculum is thus outdated and not appropriate for the 21st century when most individuals will have multiple jobs and roles throughout their careers and lives. The more appropriate field of study which has yet to make it to business schools is known as Perpetuity Science. Perpetuity Science is the body of knowledge, methodologies, and optimization models related to the building, selling, and buying of perpetuities. It explains how perpetuities can be built, managed and exited from to create wealth. Perpetuity science is a paradigm shift in business and finance education in that it replaces the siloed subjects traditionally taught in undergraduate and graduate business schools with a holistic methodology that integrates industry and the capital markets into one framework.
MBA IN A BOOK
12
Instead of a disparate business taxonomy along the lines of economics, finance, accounting, marketing, etc., we have an initial taxonomy broken down in relation to the perpetuity, namely: Build-side – the building of perpetuities (entrepreneurs, corporations) Sell-side – the selling of perpetuities (investment bankers, wall street) Buy-side – the buying of perpetuities (private equity, corporate M&A) Within each of the three, we have various methodologies and optimization models that may touch on various subjects such as accounting, finance, economics. By starting with perpetuity science however, the student can better synthesize the various moving parts of industry and the capital markets. This integrated understanding is what we are calling Perpetuity Science.
Perpetuity Science:
1. Nature of the Perpetuity
2. Sides of the Perpetuity
3. Phases of the Perpetuity
4. Perpetuity Analysis
5. The Market for Perpetuities
6. Perpetuity Modeling & Valuation
7. The Perpetuity Game
8. Perpetuities & the Capital Markets
MBA IN A BOOK
13
Chapter 2:
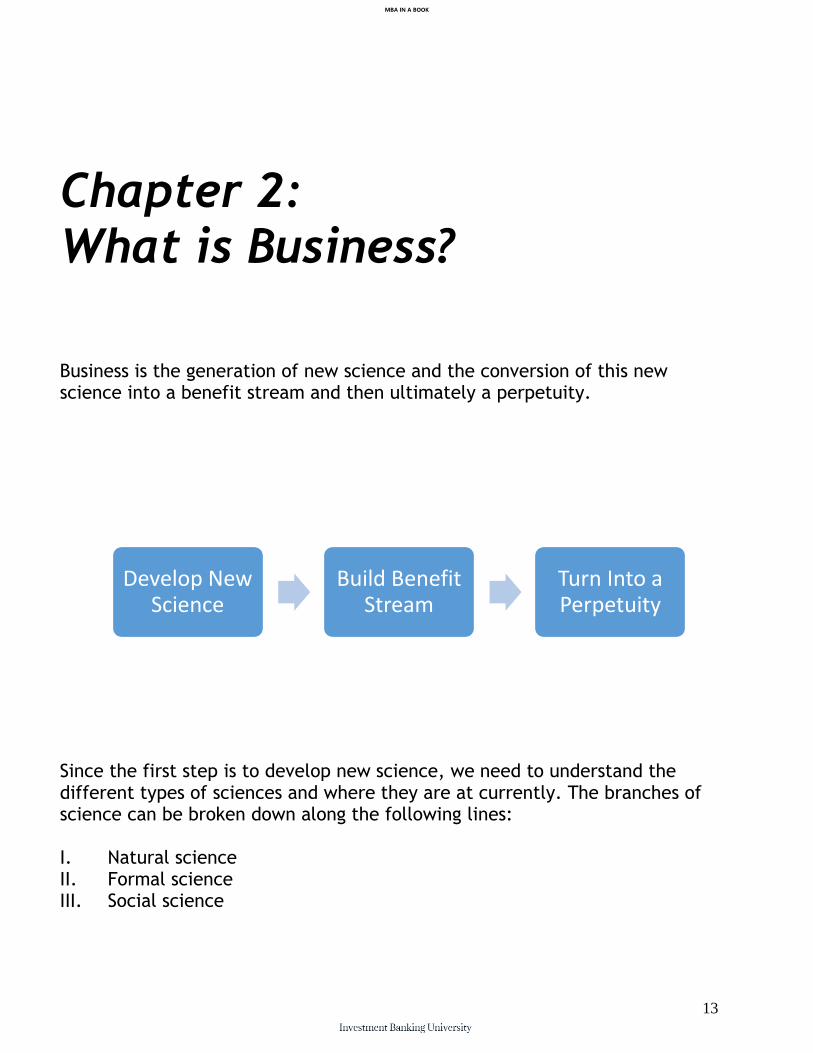
What is Business? Business is the generation of new science and the conversion of this new science into a benefit stream and then ultimately a perpetuity.
Since the first step is to develop new science, we need to understand the different types of sciences and where they are at currently. The branches of science can be broken down along the following lines: I. Natural science II. Formal science III. Social science
Develop New Science
Build Benefit Stream
Turn Into a Perpetuity
MBA IN A BOOK
14
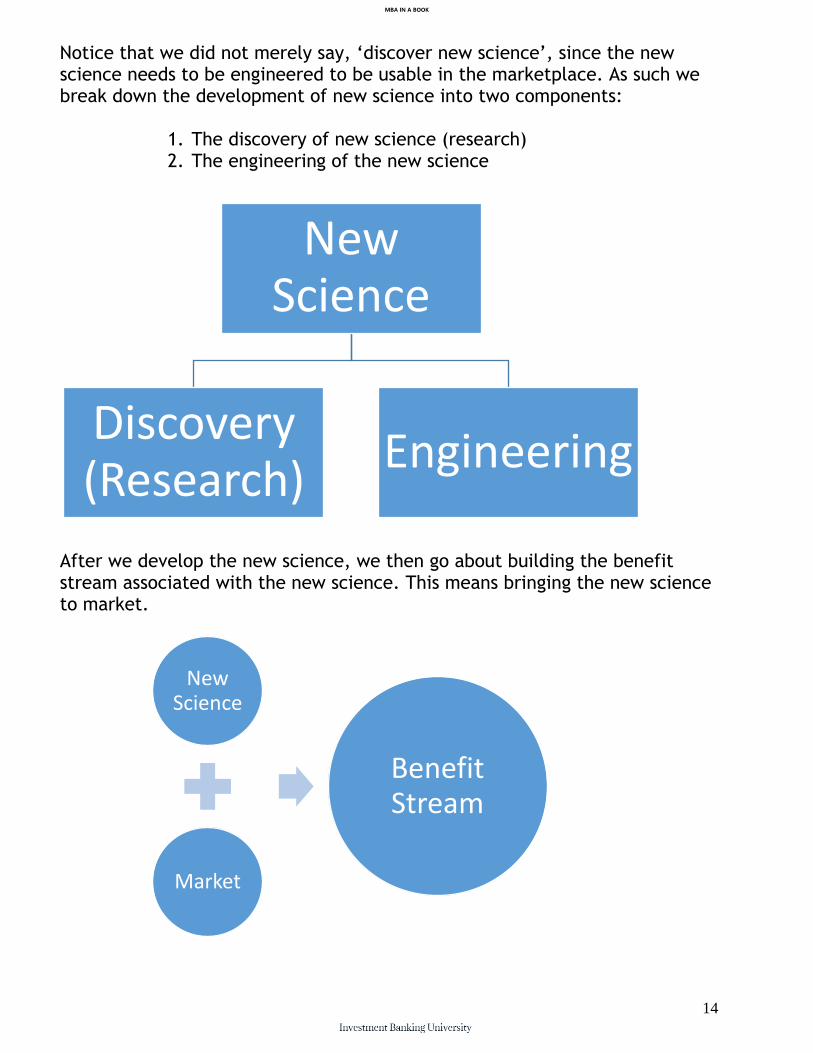
Notice that we did not merely say, ‘discover new science’, since the new science needs to be engineered to be usable in the marketplace. As such we break down the development of new science into two components:
1. The discovery of new science (research) 2. The engineering of the new science
After we develop the new science, we then go about building the benefit stream associated with the new science. This means bringing the new science to market.
New Science
Discovery (Research)
Engineering
New Science
Market
Benefit Stream
MBA IN A BOOK
15
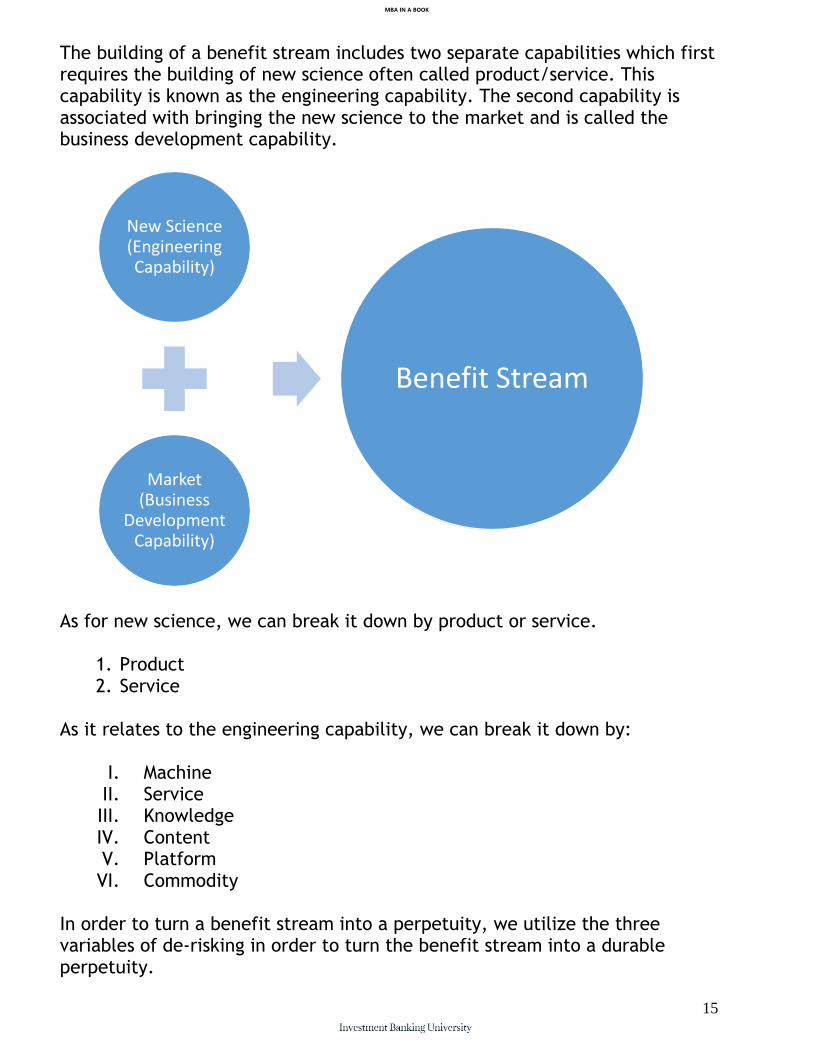
The building of a benefit stream includes two separate capabilities which first requires the building of new science often called product/service. This capability is known as the engineering capability. The second capability is associated with bringing the new science to the market and is called the business development capability.
As for new science, we can break it down by product or service.
1. Product 2. Service
As it relates to the engineering capability, we can break it down by:
I. Machine II. Service III. Knowledge IV. Content V. Platform VI. Commodity
In order to turn a benefit stream into a perpetuity, we utilize the three variables of de-risking in order to turn the benefit stream into a durable perpetuity.
New Science (Engineering Capability)
Market (Business
Development Capability)
Benefit Stream

MBA IN A BOOK
16
As new science turns into benefit streams which turn into perpetuities the capitalist system is formed. Within the capitalist system, there are different sides to the perpetuity including the build side, sell side and buy side which each have different responsibilities.
As the sides interplay, a perpetuity game emerges which is towards the ends of maximizing the valuation of a perpetuity. The Business Pattern:
Customer Concentration
Owner Dependence
Recurring Revenue
MBA IN A BOOK
17
As mentioned, business brings demand together with at least one product/service in order to build a benefit stream. The demand can be purchased and the product/service can be built, purchased or merely sold. As demand transacts to obtain the product, the benefit stream grows. The goal of the businessman is to broaden and deepen the pipeline of demand while improving the product until it is irreplaceable to consumers and moves from discretionary to a necessity. As transactions grow, the division of labor can occur within the business in order to make the ownership of the benefit stream more passive for the owner amounting in an organizational structure. As demand becomes recurring, additional products may be built, bought, or merely sold that are complementary/synergistic to the original. The pattern goes from broadening and deepening the demand pipeline for one product to broadening and deepening the product pipeline itself so that ultimately you have an infinite loop of demand and product bringing the benefit stream to ever increasing valuation. Perpetuity Phases: Business goes through phases of development including: I. Syndication – initially bringing together of demand purchased or built via
databases with the initial product being, purchased or sold. II. Job shop – division of labor initially with owner actively involved in day
to day. Initial pipeline of demand and products matched in one off jobs III. Perpetuity - organizational structure takes over fully for the owner.
Pipeline of demand becoming recurring in nature. IV. Growing perpetuity – pipeline of demand recurring and growing
(broadening and deepening demand pipeline) V. Diversified – additional benefit streams built or purchased forming a
portfolio. The Dual Existence Principle A business exists in both a real and financial capacity. In terms of its real existence, it produces and/or sells at least one produce or service. In its financial existence, it is a perpetuity producing a benefit stream with some degree of variability. Strategy focuses on the businesses real existence while finance focuses on the businesses financial existence. In this book, we are primarily focused on the business' financial existence as a perpetuity, hence our body of knowledge called Perpetuity Science. The business as a perpetuity can be broken down along the perpetuity game, sides of the perpetuity, phases of the perpetuity and market for perpetuities. We will explain each in the different segments of this book. It is first, however, important to get an understanding of the basis of the perpetuity which is valuation. This is how we begin the initial part of this book.
MBA IN A BOOK
18
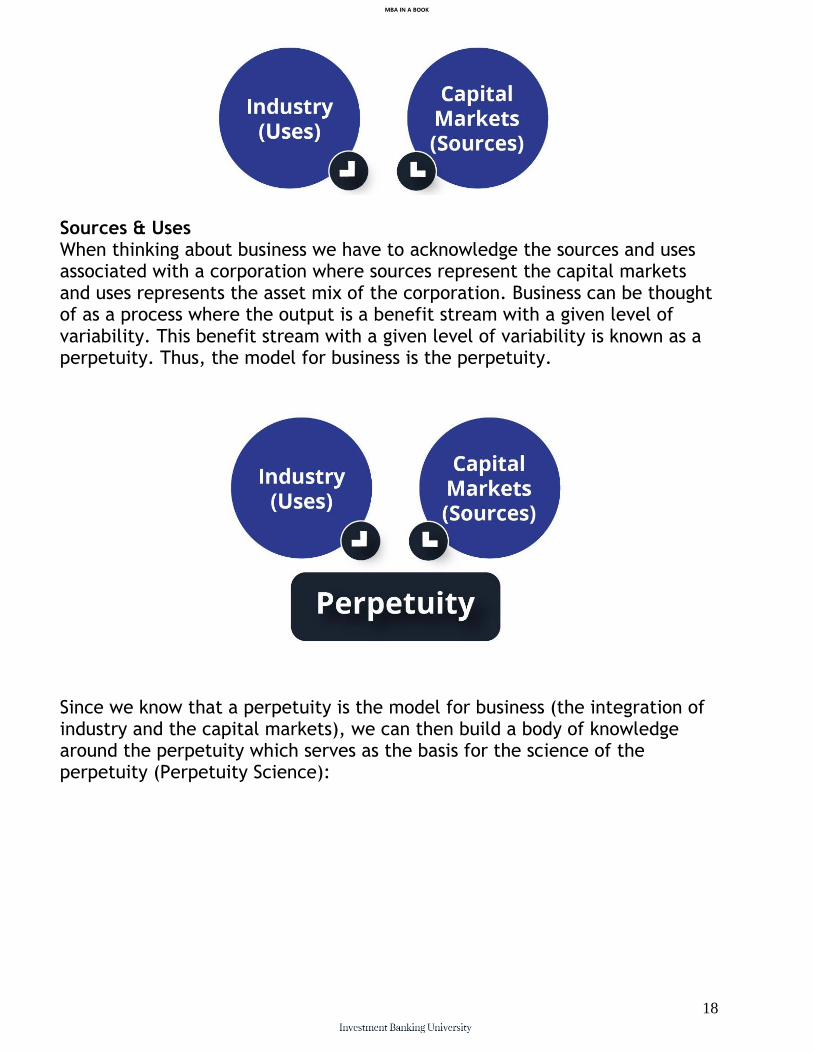
Sources & Uses When thinking about business we have to acknowledge the sources and uses associated with a corporation where sources represent the capital markets and uses represents the asset mix of the corporation. Business can be thought of as a process where the output is a benefit stream with a given level of variability. This benefit stream with a given level of variability is known as a perpetuity. Thus, the model for business is the perpetuity.
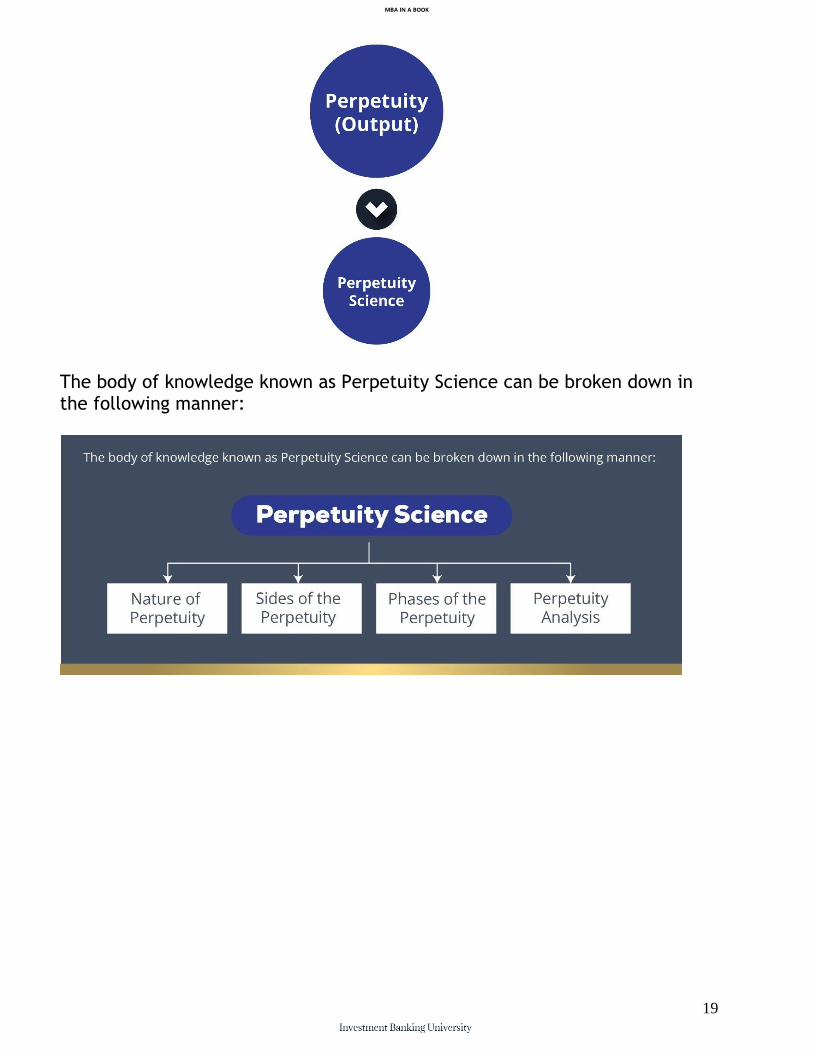
Since we know that a perpetuity is the model for business (the integration of industry and the capital markets), we can then build a body of knowledge around the perpetuity which serves as the basis for the science of the perpetuity (Perpetuity Science):
MBA IN A BOOK
19
The body of knowledge known as Perpetuity Science can be broken down in the following manner:
MBA IN A BOOK
20
Chapter 3:
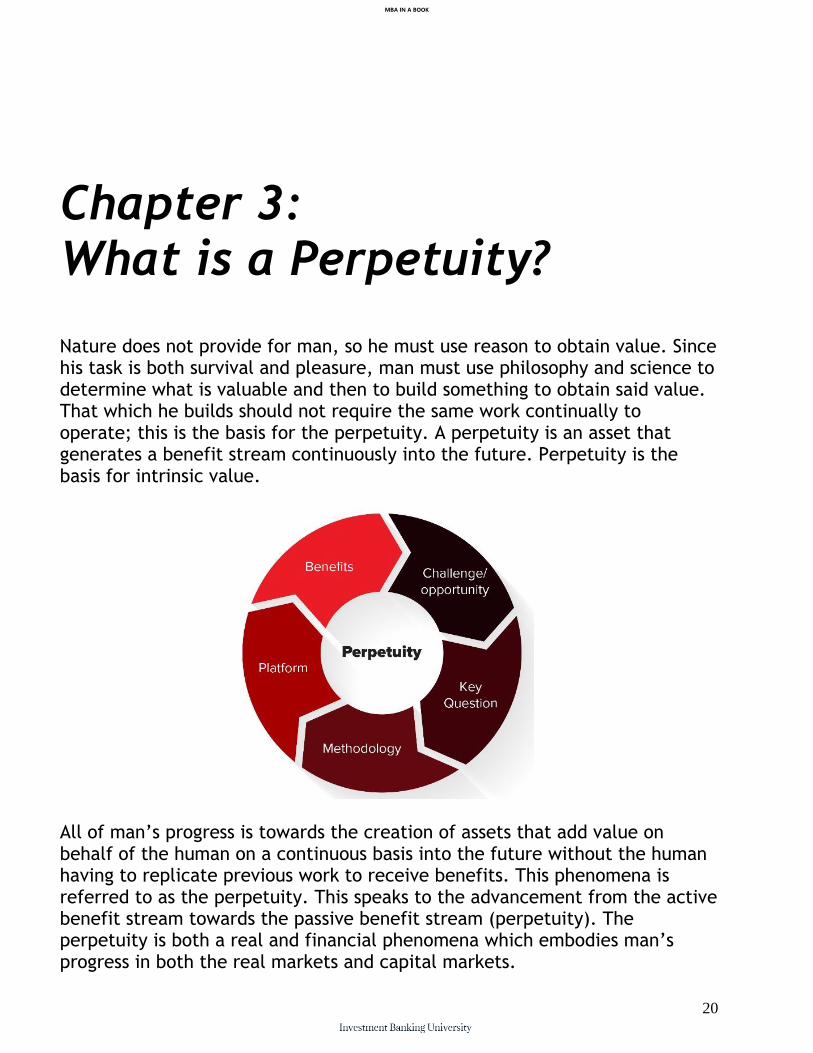
What is a Perpetuity? Nature does not provide for man, so he must use reason to obtain value. Since his task is both survival and pleasure, man must use philosophy and science to determine what is valuable and then to build something to obtain said value. That which he builds should not require the same work continually to operate; this is the basis for the perpetuity. A perpetuity is an asset that generates a benefit stream continuously into the future. Perpetuity is the basis for intrinsic value.
All of man’s progress is towards the creation of assets that add value on behalf of the human on a continuous basis into the future without the human having to replicate previous work to receive benefits. This phenomena is referred to as the perpetuity. This speaks to the advancement from the active benefit stream towards the passive benefit stream (perpetuity). The perpetuity is both a real and financial phenomena which embodies man’s progress in both the real markets and capital markets.
MBA IN A BOOK
21
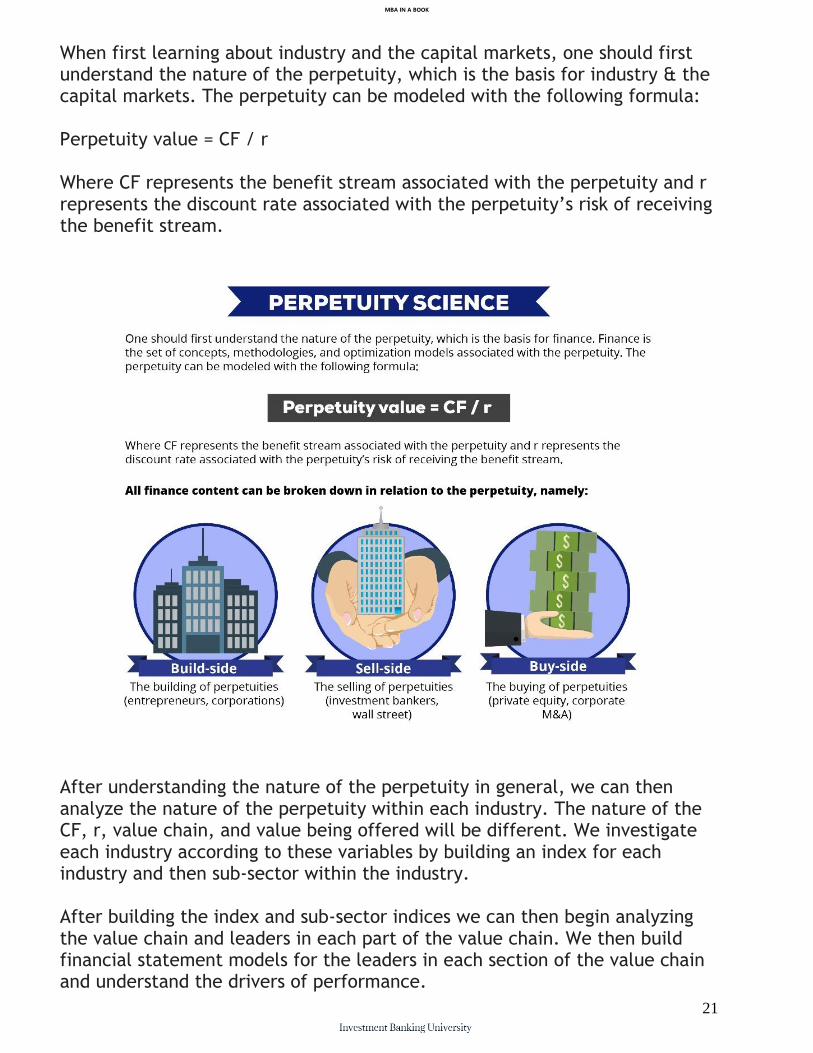
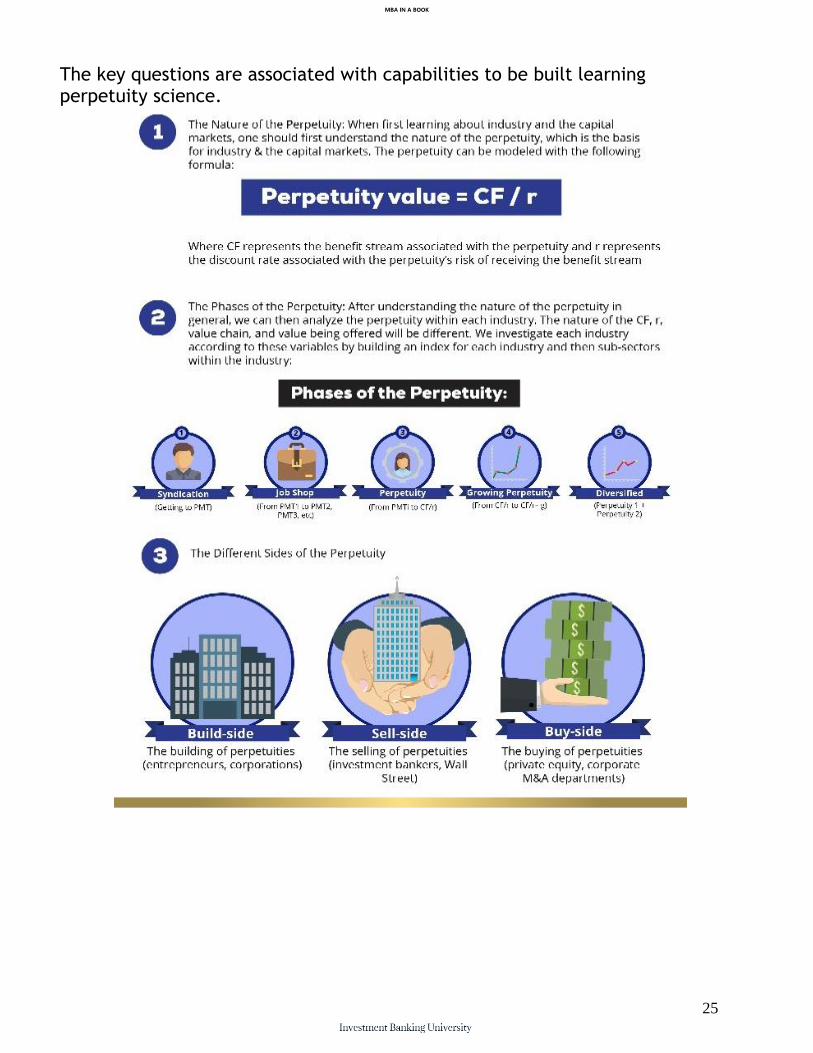
When first learning about industry and the capital markets, one should first understand the nature of the perpetuity, which is the basis for industry & the capital markets. The perpetuity can be modeled with the following formula: Perpetuity value = CF / r Where CF represents the benefit stream associated with the perpetuity and r represents the discount rate associated with the perpetuity’s risk of receiving the benefit stream.
After understanding the nature of the perpetuity in general, we can then analyze the nature of the perpetuity within each industry. The nature of the CF, r, value chain, and value being offered will be different. We investigate each industry according to these variables by building an index for each industry and then sub-sector within the industry. After building the index and sub-sector indices we can then begin analyzing the value chain and leaders in each part of the value chain. We then build financial statement models for the leaders in each section of the value chain and understand the drivers of performance.
MBA IN A BOOK
22
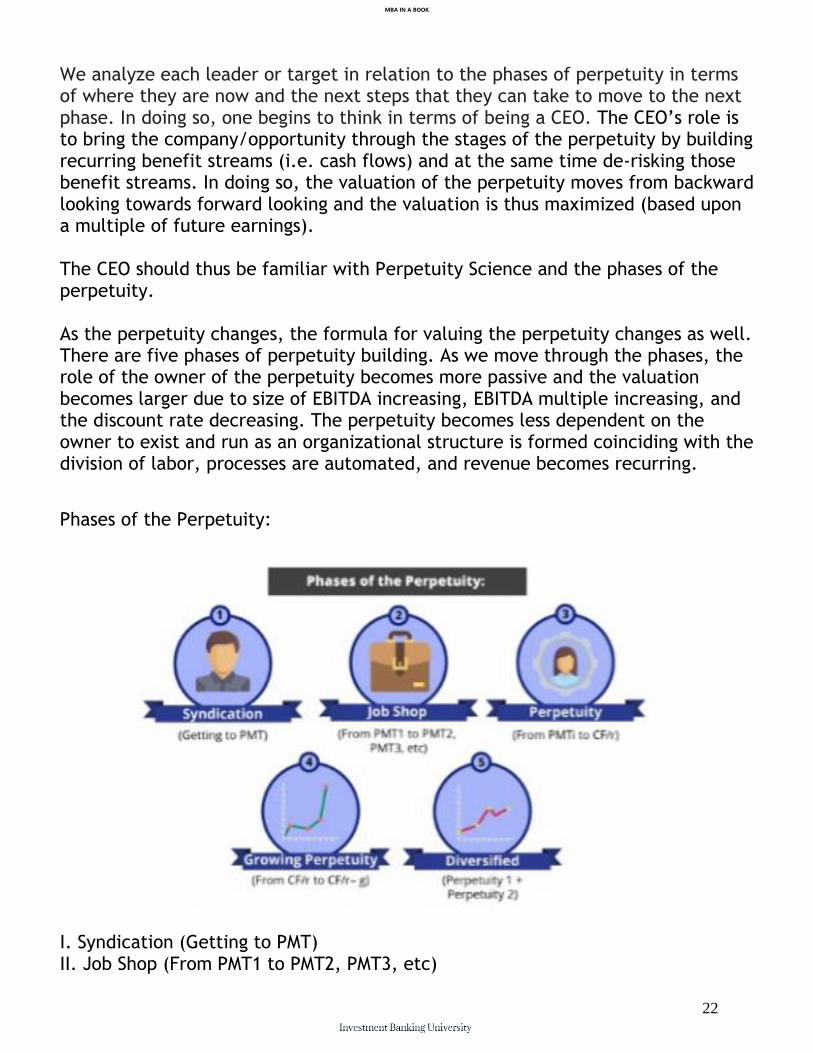
We analyze each leader or target in relation to the phases of perpetuity in terms of where they are now and the next steps that they can take to move to the next phase. In doing so, one begins to think in terms of being a CEO. The CEO’s role is to bring the company/opportunity through the stages of the perpetuity by building recurring benefit streams (i.e. cash flows) and at the same time de-risking those benefit streams. In doing so, the valuation of the perpetuity moves from backward looking towards forward looking and the valuation is thus maximized (based upon a multiple of future earnings). The CEO should thus be familiar with Perpetuity Science and the phases of the perpetuity. As the perpetuity changes, the formula for valuing the perpetuity changes as well. There are five phases of perpetuity building. As we move through the phases, the role of the owner of the perpetuity becomes more passive and the valuation becomes larger due to size of EBITDA increasing, EBITDA multiple increasing, and the discount rate decreasing. The perpetuity becomes less dependent on the owner to exist and run as an organizational structure is formed coinciding with the division of labor, processes are automated, and revenue becomes recurring.
Phases of the Perpetuity:
I. Syndication (Getting to PMT) II. Job Shop (From PMT1 to PMT2, PMT3, etc)
MBA IN A BOOK
23
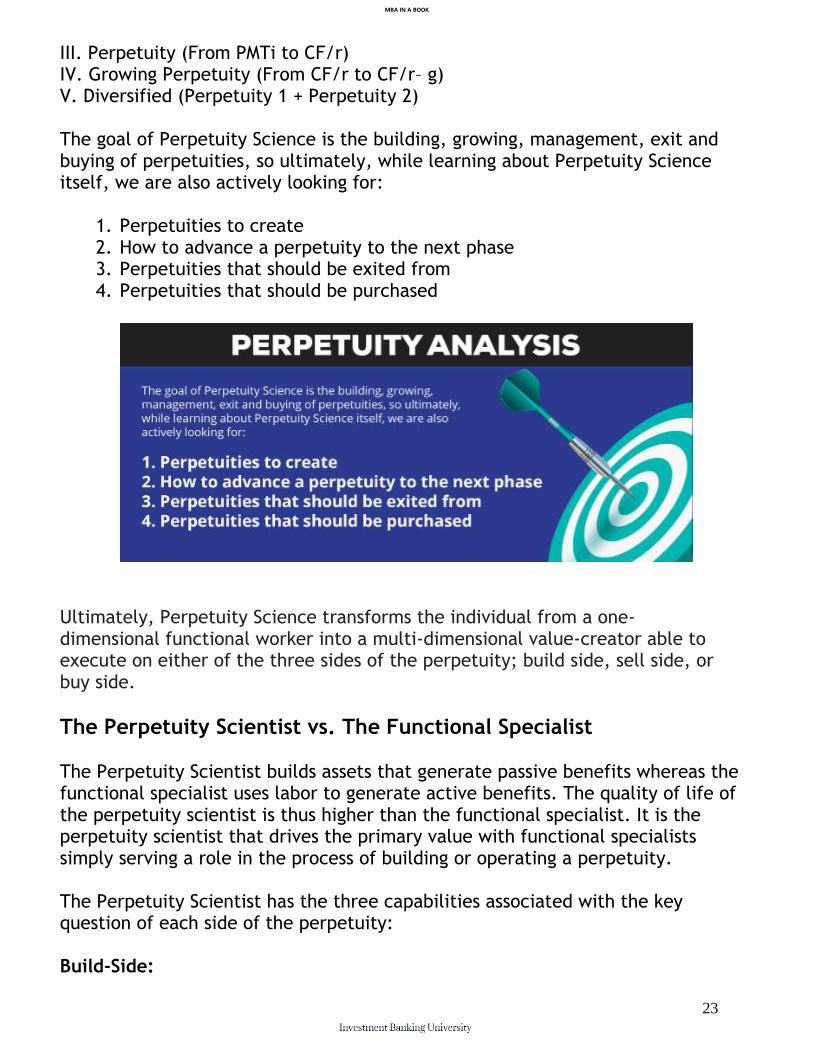
III. Perpetuity (From PMTi to CF/r) IV. Growing Perpetuity (From CF/r to CF/r– g) V. Diversified (Perpetuity 1 + Perpetuity 2) The goal of Perpetuity Science is the building, growing, management, exit and buying of perpetuities, so ultimately, while learning about Perpetuity Science itself, we are also actively looking for:
1. Perpetuities to create 2. How to advance a perpetuity to the next phase 3. Perpetuities that should be exited from 4. Perpetuities that should be purchased
Ultimately, Perpetuity Science transforms the individual from a one-dimensional functional worker into a multi-dimensional value-creator able to execute on either of the three sides of the perpetuity; build side, sell side, or buy side.
The Perpetuity Scientist vs. The Functional Specialist
The Perpetuity Scientist builds assets that generate passive benefits whereas the functional specialist uses labor to generate active benefits. The quality of life of the perpetuity scientist is thus higher than the functional specialist. It is the perpetuity scientist that drives the primary value with functional specialists simply serving a role in the process of building or operating a perpetuity. The Perpetuity Scientist has the three capabilities associated with the key question of each side of the perpetuity: Build-Side:
MBA IN A BOOK
24
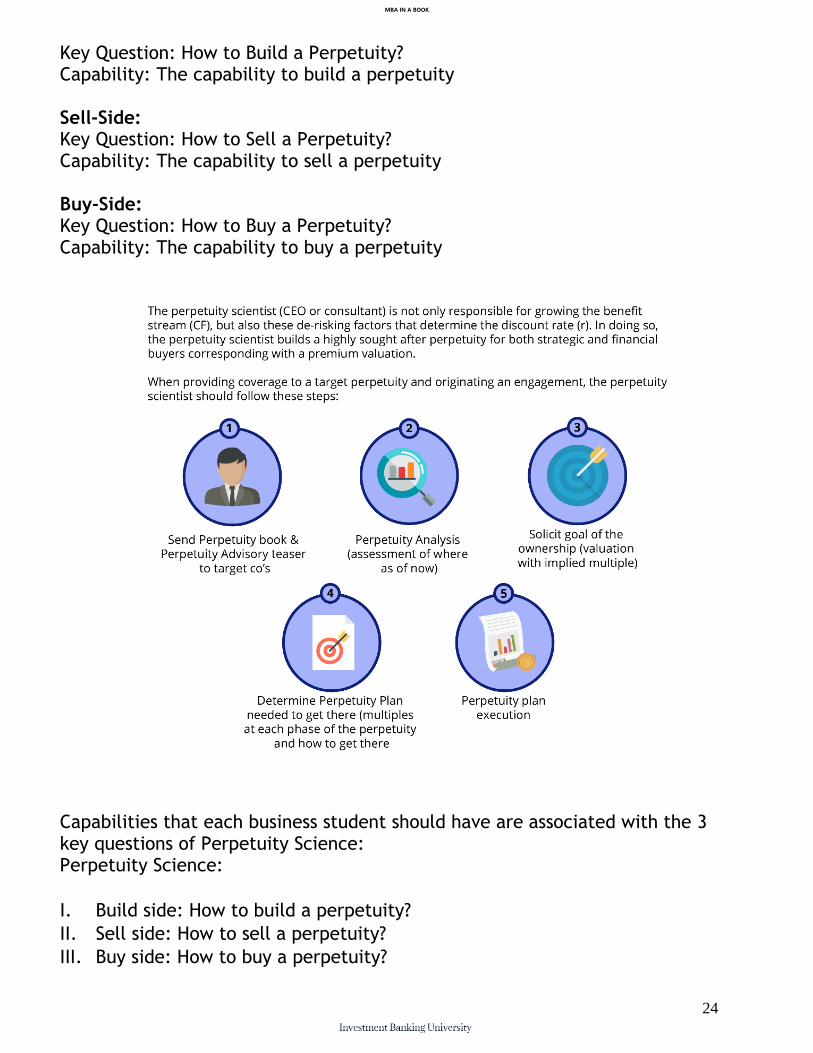
Key Question: How to Build a Perpetuity? Capability: The capability to build a perpetuity Sell-Side: Key Question: How to Sell a Perpetuity? Capability: The capability to sell a perpetuity Buy-Side: Key Question: How to Buy a Perpetuity? Capability: The capability to buy a perpetuity
Capabilities that each business student should have are associated with the 3 key questions of Perpetuity Science: Perpetuity Science:
I. Build side: How to build a perpetuity?
II. Sell side: How to sell a perpetuity?
III. Buy side: How to buy a perpetuity?
MBA IN A BOOK
25
The key questions are associated with capabilities to be built learning perpetuity science.
MBA IN A BOOK
26
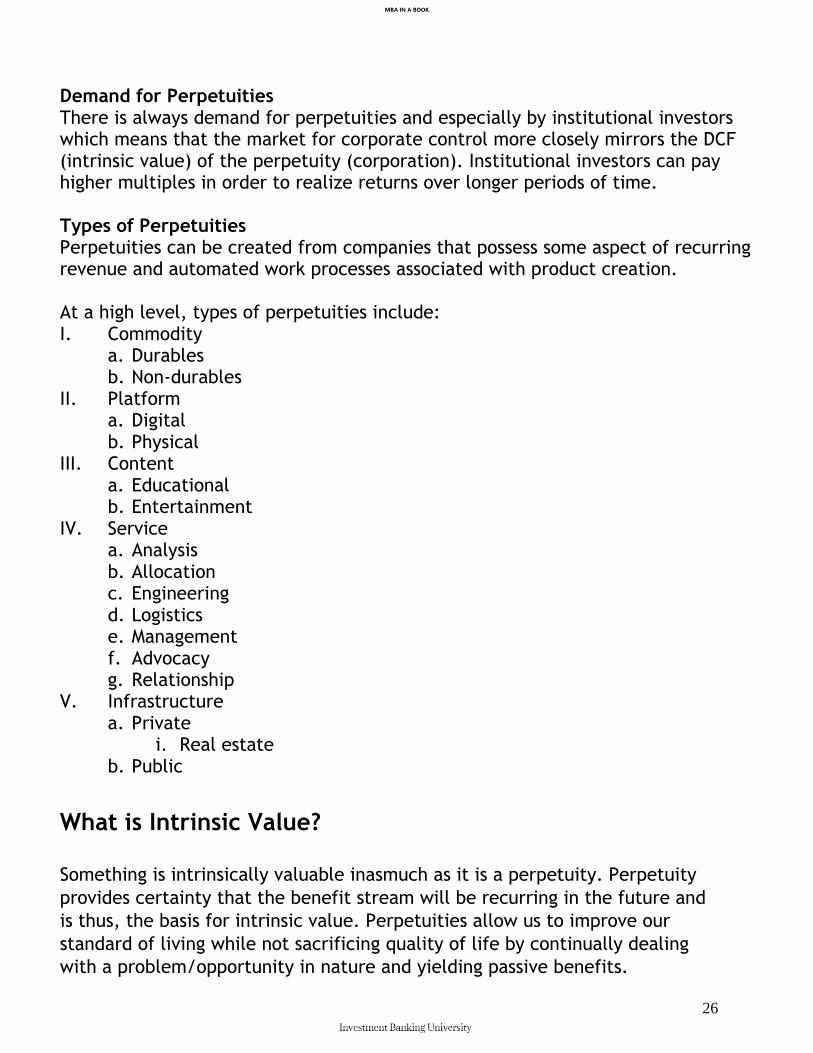
Demand for Perpetuities There is always demand for perpetuities and especially by institutional investors which means that the market for corporate control more closely mirrors the DCF (intrinsic value) of the perpetuity (corporation). Institutional investors can pay higher multiples in order to realize returns over longer periods of time. Types of Perpetuities Perpetuities can be created from companies that possess some aspect of recurring revenue and automated work processes associated with product creation. At a high level, types of perpetuities include: I. Commodity
a. Durables b. Non-durables
II. Platform a. Digital b. Physical
III. Content a. Educational b. Entertainment
IV. Service a. Analysis b. Allocation c. Engineering d. Logistics e. Management f. Advocacy g. Relationship
V. Infrastructure a. Private
i. Real estate b. Public
What is Intrinsic Value? Something is intrinsically valuable inasmuch as it is a perpetuity. Perpetuity
provides certainty that the benefit stream will be recurring in the future and
is thus, the basis for intrinsic value. Perpetuities allow us to improve our
standard of living while not sacrificing quality of life by continually dealing
with a problem/opportunity in nature and yielding passive benefits.
MBA IN A BOOK
27
Chapter 4:
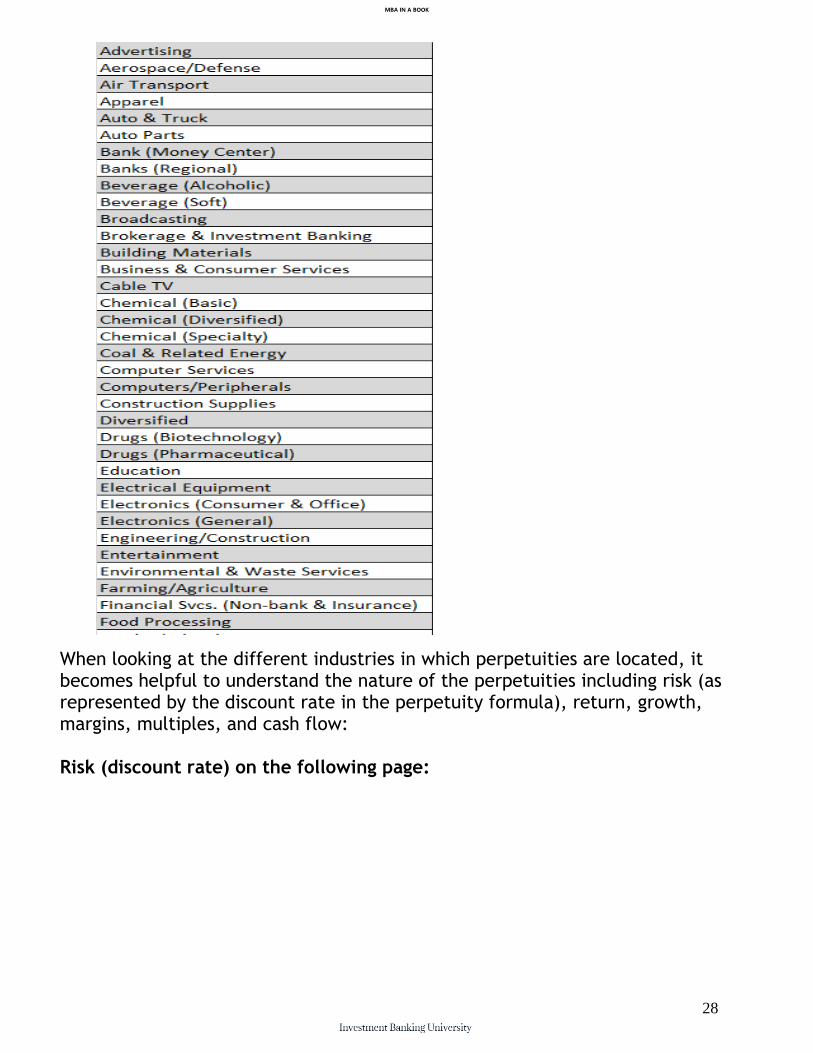
Perpetuity by Industry & Sub-Industry (Coverage) When thinking about business we have to acknowledge the sources and uses associated with a corporation where sources represent the capital markets and uses represents the asset mix of the corporation. Business can be thought of as a process where the output is a benefit stream with a given level of variability. This benefit stream with a given level of variability is known as a perpetuity. Thus, the model for business is the perpetuity. From the types of perpetuities, when applied to the main value themes of human existence we arrive at industries associated with the perpetuities (according to Aswath Damodaran at NYU). Essentially, Aswath is providing coverage for all industries by tracking the discount rate, return, growth, margins & multiples:
MBA IN A BOOK
28
When looking at the different industries in which perpetuities are located, it becomes helpful to understand the nature of the perpetuities including risk (as represented by the discount rate in the perpetuity formula), return, growth, margins, multiples, and cash flow: Risk (discount rate) on the following page:
MBA IN A BOOK
29
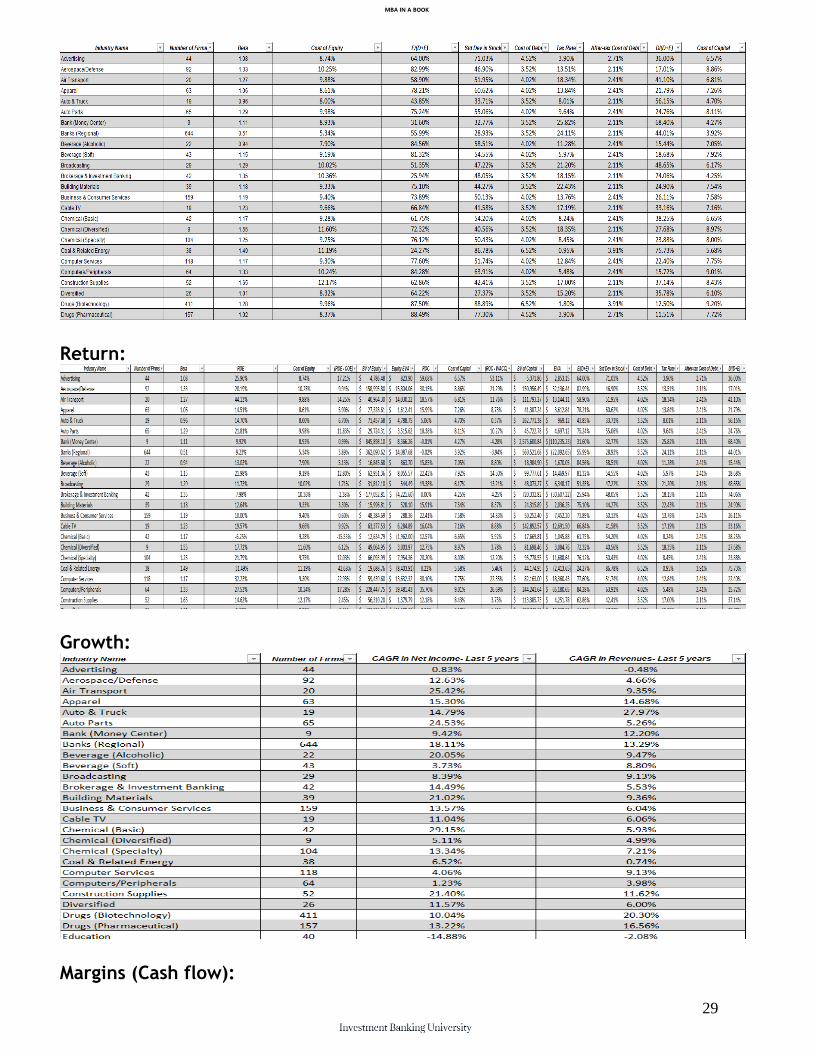
Return:
Growth:
Margins (Cash flow):
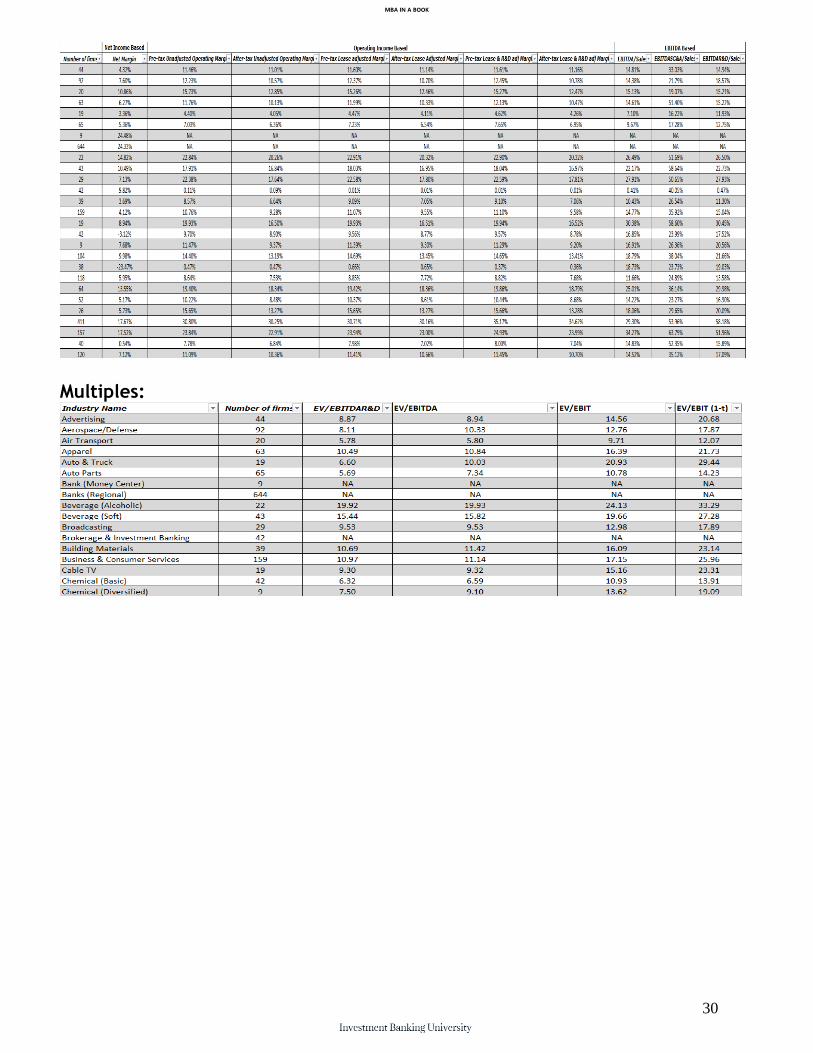
MBA IN A BOOK
30
Multiples:

MBA IN A BOOK
31
Chapter 5:
Capitalism as a Perpetuity Game In order to build benefit streams (wealth), individuals engage in the perpetuity game by building or buying perpetuities. In order to build a perpetuity, a single benefit stream must be created first and then that benefit stream is to be de-risked. After de-risking that benefit stream and continuing to grow it, the individual may build another benefit stream that is synergistic with the initial benefit stream so that capabilities and functionality may be taken advantage of. Due to existing capital that is accumulated desiring passive returns from already built perpetuities, a marketplace for perpetuities emerges where the benefit stream itself is valued in a multiple capacity meaning that it is worth more than the work put into the creation of it. This marketplace means that there are those that seek to enter and exit perpetuities in order to generate passive benefit streams for themselves and thus the perpetuity game emerges. This is the essence of the capitalist system that we live in whether you are aware of it or not. Within the perpetuity game, there are different sides of the perpetuity that emerge including the build side, sell side and buy side that have different players within each category with various hurdle goals. On the build side, the perpetuity scientist seeks to build a benefit stream with the largest multiple in order to then exit the perpetuity. This means getting the benefit stream to qualify for the most liquid marketplace by going from a private perpetuity to a public perpetuity (“going public”). These players include entrepreneurs and corporations.

MBA IN A BOOK
32
On the sell side, the perpetuity scientist seeks to aid those that have already built perpetuities in exiting them at a strong multiple and take a fee for doing so. These players include investment bankers and Wall Street. Finally, on the buy side, the perpetuity scientist utilizes an existing or borrowed pool of capital to enter and exit perpetuities to create a passive benefit stream for themselves at some hurdle goal (“hurdle rate” or IRR). By entering perpetuities, operating them and then exiting them five to seven years later, the financial or strategic buyer is able to generate the new benefit stream and the rate of return in relation to the capital invested.
MBA IN A BOOK
33
Chapter 6:
Playing the Perpetuity Game The name of the perpetuity game is to build as large and passive a benefit stream as possible. There are three sides that one can engage in in order to do so as mentioned in the last chapter; the build side, sell side and buy side. Though there are different sides to the perpetuity, the perpetuity scientist should understand the entire process of playing the perpetuity game including mastering the capabilities and knowledge necessary to play the game. Process of Playing the Perpetuity Game The perpetuity scientist uses the valuation methodologies to determine a valuation range for a target perpetuity that is less than its DCF value (positive NPV project) via using the two valuation methodologies of:
1. Comp companies 2. Comp transactions The perpetuity scientist then uses an LBO or merger structure for the purchase (syndication on build side) of the perpetuity utilizing a deal structure (cash, stock, cash & stock) and goes through the syndication or M&A process to build or buy the perpetuity. The perpetuity scientist then operates the company, focusing on debt paydown if there is any and then in five to seven years exits the perpetuity receiving a 25%+ return on capital invested.
MBA IN A BOOK
34
The perpetuity scientist understand the buy side perspective to every deal, the perpetuity marketplace (multiples), the process and thus he knows the perpetuity game. The perpetuity scientist knows how to pull comps from a coverage database such as Mergr (www.mergr.com) as well as comp transactions to get an understanding of the multiples in a sector and then sub-sector. He then knows how to spread these comps into his valuation model to obtain a mean and median multiple for the sector and sub-sector to value his own target. The perpetuity scientist then knows how to collect financials and calculate adjusted EBITDA (proxy for cash flow) including addbacks (also called Total Owners Benefit in the lower middle market). The perpetuity scientist then knowns how to perform a DCF valuation in excel based upon the adjusted EBITDA and compare the NPV valuation to the multiples of comp companies and comp transactions. This gives an understanding if an investment actually exists (if DCF value > comp multiples). The perpetuity scientist then knows how to procure financing of various sorts to fund the transaction including various types of equity, debt or hybrid from their different sources (can be found in Mergr). He builds a financial model that incorporates these sources of capital along with the corresponding uses of capital in the perpetuity itself and runs an analysis according to what type of buyer he is (strategic with a merger model or financial with an LBO model) in excel to understand the returns from an IRR perspective. The perpetuity scientist then knows how to originate the M&A opportunity in terms of approaching the target and issuing an IOI in order to do a deeper dive with management and how to have a buyer/seller meeting. The perpetuity scientist then knows how to obtain longer period and more detailed financials of 3 to 5 years and confirms the analysis from before to see if still meeting the hurdle rate and performs various sensitivity analysis. The perpetuity scientist then knows how to issue an LOI then purchase agreement to begin due diligence and then ultimately takes ownership of the perpetuity.
MBA IN A BOOK
35
Chapter 6:
Perpetuities & the Capital Markets The players within the perpetuity game are continuously engaging in sources & uses matching for positive NPV projects. Sources & uses matching means accessing the capital markets for capital to finance positive NPV projects in the form of perpetuities. There are two major components to the capital markets:
I. Equity capital markets II. Debt capital markets
MBA IN A BOOK
36
FOUNDATIONS OF VALUATION
In order to understand the role and work of the investment banker, we need to first have a strong understanding of the foundations of valuation. This helps us to understand why it is that the investment banking industry exists and where investment bankers fit into the bigger picture.
MBA IN A BOOK
37
Part I:
Tracking Value (Accounting) As a perpetuity is built, it becomes necessary to track the financial existence of the perpetuity through time. Accounting is the set of concepts, methodologies, and models that allows us to do exactly that.
MBA IN A BOOK
38
Chapter 7: Tracking Value with Accounts Financial accounting – How financial information of a business is recorded and classified (i.e. financial statements of public companies) Accounting is ultimately towards the ends of financial reporting. In the United States, public companies are required by the government (SEC) to release their financial statements to the public four times per year Once a year, companies release a “10-K” or annual report that must be audited by an accounting firm For the three other quarters, companies release a “10-Q” or quarterly report that is unaudited Accounts and Accounting In order to track valuation performance of the perpetuity (i..e business), companies create accounts for each item of it’s financial existence. These accounts are the basis of valuation. Valuation is the basis of actions taken in a capitalist economy. Accounts, Accounting & Excel Excel is the software used to model the accounts of the enterprise and determine the valuation of the perpetuity (i.e. business).
MBA IN A BOOK
39
Chapter 7: Accounts to Financial Statements Account Statements: Income Statement aka P&L The income statement presents the results of the operating activities of a firm for a specific period of time (i.e. one year, one quarter, etc.) The basic equation of the income statement is total revenues (also called sales or the “top line”) less total expenses (or costs) equals net income (or earnings or the “bottom line”) Revenues measure the inflows of assets (or reductions in liabilities) from selling goods and services Expenses measure the outflow of assets (or increases in liabilities) used in generating revenues Net income is the difference between revenues and expenses (positive if the firm made a profit and negative if the firm made a loss)
There are two accounting approaches that a firm can use to measure operating performance: (1) cash basis or (2) accrual basis Cash basis of accounting Under the cash basis, a firm recognizes revenue from selling goods or providing services in the period when it received cash from customers Similarly, the firm recognizes expenses in the period when it makes cash expenditures (i.e. pays) for merchandise, salaries, taxes, etc. Disadvantages of cash basis accounting The cost of generating
revenues are not adequately matched with the benefits of generating revenues. – For example, if inventory is purchased at the end of a year, and that inventory is sold to customers at the beginning of the following year, the firm’s income statement will show an expense (but no revenue) the first year and revenue (but no expense) the following year – This

MBA IN A BOOK
40
“mismatch” makes it difficult to compare operational performance from one year to the next
Disadvantages of cash basis accounting (continued) Revenue recognition can be significantly delayed – The firm does not book revenues when goods are sold or services provided but when payment is received for those goods or services – Again, this can cause a timing “mismatch” from the difficult “work” of manufacturing and selling goods or providing services, and the recognition of revenues Operating performance can be easily manipulated – Because expenses are recognized only when cash expenditure is made, firms have the ability to time payments in order to manipulate profits. For example, firms can delay payments until the next fiscal year in order to show a higher profit for the current year Advantages of cash basis accounting Bookkeeping is easier since only cash inflows and outflows need be recognized and accounted for For firms with no inventories, few multi-period assets (such as buildings or equipment) and who usually receive payment for services shortly after providing services (e.g. professionals such as lawyers and accountants), cash basis accounting can be suitable Accrual basis of accounting Most firms, including all public firms, use the accrual basis of accounting The accrual basis recognizes revenue when a firm sells goods or provides services The costs of assets used in producing the goods that were sold are recognized in the same period from which the associated revenue is recognized – The key factor (and advantage) of accrual accounting is that expenses are matched with associated revenues – If the cost of assets used do not easily match up with particular revenues, then the expenses appear in the period in which the assets are used An added benefit of the accrual method is that there are fewer opportunities for the firm to distort or manipulate earnings All of the analysis performed in this class will assume the accrual basis of accounting Revenue recognition Under accrual accounting, revenue is recognized when the following two conditions have been met: – A firm has performed all or most of the services it expects to provide – The firm has received cash or another asset (such as a receivable) capable of measuring (reasonably precisely) the revenue to be recognized Adjustments to revenue If a firm recognizes revenue in a period before it collects cash, it may need to make adjustments to the agreed upon price. These adjustments are made at the same time (or same period) as the revenue is recognized. Such adjustments include: – Uncollectible amounts or bad debts: the firm does not expect to collect the entire amount – Sales discounts, allowances or returns: discounts off the purchase price or allowances for unsatisfactory merchandise or services or returned goods – Delayed payments: payments longer than one-year from delivery of the goods or services require the revenue to be reduced by an implied interest charge Gross revenue net of any adjustments is referred to as Net Revenue Usually, only net revenue will be
MBA IN A BOOK
41
reported on a firm’s income statement but sometimes gross revenue and adjustments will also be shown Expense recognition Under accrual accounting, expenses are recognized as follows: – If an asset expiration (e.g. using inventory) can be associated directly with a particular revenue, that expiration becomes an expense when the firm recognizes revenue This is knows as the “matching principle”. Costs are matched with revenues – If an asset expiration does not clearly associate with particular revenue, then that asset expiration becomes an expense in the period when the firm consumes or uses the benefit of that asset Costs that can be easily matched to revenues are known as direct costs or Cost of Goods Sold or COGS (also called cost or sales, cost of revenue, cost of product). Examples include: – Cost of materials that comprise the goods being sold – Cost of labor directly responsible for making the goods being sold On the income statement, net revenues less COGS equals Gross Profit (also called Gross Margin) Costs that cannot be directly matched to revenue are known as indirect costs. The largest category of indirect costs that almost always appears on an income statement is Selling, General and Administrative costs (SG&A) SG&A is typically comprised of costs such as: Marketing and advertising Salaries of management Office expenses Travel and entertainment Professional services such as legal
and accounting Other indirect operating expenses may include research and development, depreciation (see the following page) as well as nonrecurring or restructuring expenses Gross Profit less SG&A and other indirect operating expenses equals Operating Income or EBIT (Earnings Before Interest and Taxes). EBIT represents the profits of the company’s operations or equivalently, the
profits of the company before taking out interest and taxes One additional and significant operating cost that has not been mentioned yet is depreciation Accrual accounting stipulates that when assets such as factories and equipment are purchased, rather than have the entire amount expensed through the income statement when the property is purchased, the property gets “depreciated” over time Because the asset will be used for a future benefit (e.g. used to generate future revenues), the cost of depreciating the asset is accounting’s attempt to “match” the benefit of the asset with the cost of the asset The periodic (e.g. annual) cost of depreciating the assets becomes a cost on the income statement Depreciation is a process of cost allocation, and NOT meant to measure the decline in value of the asset There are various methods of depreciating assets (i.e. straight-line, accelerated) and because different assets have different useful lives, they can be depreciated over differing time periods – Land is not typically depreciated as it does not have a finite life The cost of depreciation can be considered a direct cost (Cost of Goods) or an indirect cost (SG&A or other expense) depending on the type of asset and the type

MBA IN A BOOK
42
of company. For example: A manufacturing company that owns machinery that produces goods, would consider the depreciation of that machinery a part of COGS That same manufacturing company which also owns the building for its corporate headquarters, would consider the depreciation of the headquarters building as an indirect cost (SG&A) Depreciation (and amortization) is sometimes listed separately on the income statement as an operating expense but rarely broken out from COGS The only way to ensure that the entire amount of depreciation and amortization is known, is to consult the cash flow statement Amortization is similar to depreciation but is used for expensing over time intangible assets rather than tangible assets such as property and equipment Interest expense and interest income are shown below the operating income or EBIT line on the income statement Sometimes interest expense and interest income are shown separately and sometimes only the net interest expense (interest expense less interest income) is shown Interest expense and interest income are not considered operating expenses or operating income for most companies (banks and other financial institutions are an exception) because the amount of interest expense is dependant on the amount of debt which is primarily a financing, rather than operational decision Operating income (EBIT) less net interest expense equals Earnings Before Taxes (EBT) Occasionally, an income statement will also list non-operating income. This will come below operating income (typically below net interest expense) and before the line for taxes The income statement will also have a line item for taxes (often called “Provision for income taxes”). This represents the income taxes that the company owes based on financial accounting (book basis) but not necessarily the amount that will actually be paid to the government (see Advanced Topics for more information) In the United States, the statutory rate for income taxes is 35% but the actual tax that a firm pays can vary significantly depending on many factors including state taxes, foreign taxes, previous operations and tax treatments (e.g. Net Operating Losses), etc. Earnings Before Taxes (EBT) less the Income Tax Provision equals Net Income (also called Net Earnings or the “bottom line”) On a public company’s income statement, Earnings Per Share (EPS) is typically listed directly below net income Earnings per share is the net income of the company divided by the number of common shares outstanding Usually two different metrics of earnings per share are shown: basic and diluted Basic earnings per share equals net income divided by the number of common shares currently outstanding Diluted earnings equals the same net income divided by the number of common shares outstanding taking into account the effects of any company issued stock options outstanding – Stock options, when exercised have the effect of diluting the common ownership because new shares must be issued. That is, more shares (or more owners) have ownership stake or claims on the same net income – Diluted shares are always greater than basic shares so diluted EPS is
MBA IN A BOOK
43
always less than basic EPS (assuming at least one option is exercisable and “in-the-money”) Income statement (P&L): Revenues COGS Gross Profit Operating Expenses EBIT Interest Cost EBT Taxes Earnings Account Statements: Balance Sheet The balance sheet contains three main sections: assets, liabilities and shareholders’ equity Assets are economic resources with the ability or potential to provide future benefits to the firm Liabilities are creditors’ claims on the assets of the firm Shareholders’ equity is the owners’ claim on the assets of the firm The balance sheet presents the financial position of a firm at a particular moment in time Recognition of assets: A firm will recognize an asset only if (1) the firm has acquired rights to its use in the future as a result of a past transaction or exchange and (2) the firm can measure or quantify the future benefits with a reasonable degree of precision While all assets represent future benefits, not all future benefits are assets Valuation of assets: Accountants must assign a monetary amount to each asset in the balance sheet. Several methods can be used to assign value: – Acquisition or Historical Cost represents the amount of cash (or cash equivalent) paid in acquiring the asset – Current Replacement Cost represents the amount currently required to acquire the asset – Current Net Realizable Value represents the amount of cash that a firm would receive if it sold the asset (less the cost involved to sell the asset) – Present Value of Future Net Cash Flows represents the future benefits of the asset discounted to the current period by an appropriate discount rate Valuation of Assets (continued): Generally Accepted Accounting Principles (GAAP) stipulate which valuation method to use depending on the type of asset Monetary assets such as cash and accounts receivable generally appear on the balance sheet at their net present value (i.e. their current cash or cash equivalent value) – Cash appears as the amount of cash on hand or in the bank – Accounts receivables appear as the amount of cash the firm expects to receive but
MBA IN A BOOK
44
undiscounted since the firm expects to receive payment in a short period of time (e.g. days to several months) Non-monetary assets such as inventory, equipment, building and land appear at acquisition cost (less accumulated depreciation value which will be discussed later) Assets are typically divided into two categories: current assets and noncurrent assets (or long-term assets) Current assets include assets that the firm expects to turn into cash, sell or consume within one year. Examples of current assets include: Cash and cash equivalents Temporary investments in securities Accounts receivable from customers Merchandise Inventories, which includes: – raw materials – supplies – work-in-progress – finished goods Prepaid operating costs such as prepaid rent or insurance Noncurrent or long-term assets are assets that the firm expects to hold or use for longer than one year. Common noncurrent assets include: Long-term investments in securities Property, Plant and Equipment (PP&E) also called ‘fixed assets” including: – Land – Buildings – Machinery – Equipment – Computers – Furniture and Fixtures Intangible Assets, such as: – Patents – Trademarks – Franchises – Goodwill Liability recognition A liability is recognized when the firm receives a benefit or service and in exchange, promises to pay the provider of that good or service a reasonably definite amount in a reasonably definite time – Similar to the discussion of assets, all liabilities are obligations but not all obligations are liabilities Valuation of liabilities Liabilities that require payments of specific amounts of cash due in less than one year appear on the balance sheet at the amount of cash the firm expects to pay to discharge the obligation Obligations that require specific amounts of cash due in more than one year appear at the present value of the future cash outflows Liabilities that require delivery of goods or providing services rather than cash can appear on the balance sheet either at the cost of providing the goods or service, or at the cash amount received for providing the future goods or services (depending on circumstances). For example: – Liability for a product warranty for goods already sold appears at the expected cost of providing the warranty – Liability for advance payment for goods to be sold appear as the amount of cash received As with assets, liabilities are also typically divided into two categories: current liabilities and noncurrent liabilities (or long-term liabilities) Current liabilities represent obligations a firm expects to pay within one year. Examples of current liabilities include: Notes payable to banks Accounts payable to suppliers Salaries payable to employees Taxes payable to governments Noncurrent or long-term liabilities are liabilities that the firm expects to pay beyond one year. Common noncurrent liabilities include: Debt due or having maturities in more
MBA IN A BOOK
45
than one year (such as bonds, mortgages and certain long-term leases) Other long-term liabilities can include deferred income taxes and certain retirement obligations While not its own balance sheet item, working capital is a key concept that is derived from the balance sheet as well as an important measure of firm’s short-term financial health Working capital is also sometimes referred to as net working capital Working capital equals a firm’s current operating assets less its current operating liabilities Current operating assets = current assets – cash and cash equivalents Current operating liabilities = current liabilities – short-term debt Shareholder’s equity is generally made up of two types: contributed capital and retained earnings Contributed capital reflects the funds invested by shareholders for an ownership stake. Contributed capital includes: – Par value of common or preferred stock: the amount (usually a nominal amount) assigned to the common or preferred stock. Note: Par value does not equal the market value of the stock – Additional Paid-in Capital: in the issuance of common or preferred stock, the amount received by the firm in excess of par value Retained earnings represents a firm’s earnings since its formation less the dividends paid out to the firm’s owners since formation – Retained earnings can often be negative, especially for a new company that loses money in its first few years of operation In addition, if a firm acquires or buys back shares originally issued, the cost of those shares is classified on the balance sheet as “Treasury Shares” or “Treasury Stock” Assets = Liabilities + Shareholder’s Equity Total Assets = Total Liabilities + Shareholder’s Equity Current Assets + Long Term Assets = Current Liabilities + Long Term Liabilities + Value of Shares Previously Issued + Retained Earnings – Treasury Stock Account Statements: Statement of Cash Flows The statement of cash flows reports the net cash flows relating to operating, investing and financing activities for a period of time (the same period of time as the income statement) Due to accrual accounting, the income statement does not measure cash inflows and outflows. However, since cash is so important (“cash is king”), the cash flow statement is a very important tool for understanding the operations of the company The basic equation of the cash flow statement is: cash at the beginning period + cash from operations + cash from investing + cash from financing = cash at the end of period The cash flow statement is divided into three categories: Cash from operations equals cash received from selling goods and services less cash paid for providing goods and services Cash from investing equals cash received from sales of investments and
MBA IN A BOOK
46
PP&E less cash paid for the acquisition of investments and PP&E Cash from financing equals cash received from the issue of debt or equity less cash paid for dividends and the reacquisition of debt or equity In theory, firms could prepare their cash flow statements by accounting for each and every cash inflow and outflow, however, this would be burdensome The simpler way to prepare a cash flow statement is examine the balance sheet for changes in assets, liabilities and shareholders’ equity from the beginning of the period to the end of the period That is, the change to the value of any item on the balance sheet must have a corresponding cash impact (and must be accounted for somewhere in the cash flow statement). An increase in assets on the balance sheet MUST correspond to a decrease in cash on the cash flow statement – For example, other things equal, an increase in PP&E (asset) on the balance sheet results in decrease in cash as cash is used to purchase the new equipment An increase in liabilities and shareholders’ equity on the balance sheet MUST correspond to an increase in cash on the cash flow statement – For example, other things equal, an increase in debt (liability) on the balance sheet (i.e. a new bank loan) results in an increase in cash Most firms report cash flow from operations using the “indirect method” In the indirect method, cash flow from operations is the result of adjusting net income for non-cash items An alternative, but less frequently used method is the “direct method” whereby cash flow from operations lists the cash received from customers and the cash expenditures to suppliers This difference between the two methods is purely presentation – numerically they will give the same result Under the indirect method, the first line in this section is net income Typically, the next line is depreciation and amortization (D&A) While D&A does not provide cash, it must be added back in the cash flow statement since it was included in net income (as an expense). – D&A will have a positive sign on the cash flow statement Then adjust for changes in operating assets (i.e. working capital). For example: Change in accounts receivable (asset) Change in inventories (asset) Change in other current assets (asset) Change in accounts payable (liability) Change in accrued expenses (liability) Change in other current liabilities (liability) Remember, an increase in assets is a negative cash impact or “use of cash” while an increase in liabilities is a positive cash impact or “source of cash” Be mindful of the signs (positive/negative): an increase in assets will have a negative sign and an increase in liabilities will have a positive sign (and vice versa for decreases) Summing up net income, D&A, changes in working capital and changes in other operating items results in Cash Flow from Operations Cash flow from Investing takes into account acquisitions and sales of investments and property, plant and equipment (PP&E) The first line item in this section is
MBA IN A BOOK
47
usually additions to PP&E (commonly referred to as capital expenditures or “capex”) – Capex is a use of cash and will have a negative sign The next line item(s) is typically proceeds form any sales of PP&E – Proceeds from the sale of PP&E is a source of cash and will have a positive sign Finally, the acquisition of or proceeds from the sale of any other investments is listed The sum of capex (negative), proceeds from the sale of PP&E (positive) and net investment activity (negative) results in Cash Flow from Investing Cash flow from Financing takes into account changes to a firm’s debt and equity positions. Line items in this section include: Increase/decrease in short-term borrowings or short-term debt Increase/decrease in long-term borrowings or long-term debt Payments of dividends Issue of capital stock (i.e. common stock, preferred stock) Purchase of treasury stock (decrease of capital stock) Other financing transactions Again, increases in liabilities and shareholders’ equity (e.g. increase in borrowings) will have a positive sign and decreases will have a negative sign (e.g. purchase of treasury stock) The sum of all of the above line items results in Cash Flow from Financing The sum of Cash Flow from Operations, Cash Flow from Investing and Cash Flow from Financing equals net cash flow for the period and the sum of net cash flow + the beginning cash balance equals the ending cash balance CF from Operating CF from Investing CF from Financing Statement of Cash Flows is the linkage between the income statement and the balance sheet. Get D&A from SCF (CF from Operations) and CAPEX from SCF (CF from Investing) The following is a 10-K from Berkshire Hathaway: The following is a 10-Q from Berkshire Hathaway: The following is the IS from Berkshire Hathaway: The following is the BS from Berkshire Hathaway: The following is the SCF from Berkshire Hathaway:
MBA IN A BOOK
48
Part II:
Analyzing Value with Models (Finance) As the economic existence of the perpetuity continues to grow, one becomes interested in the value of the perpetuity. Enter finance, whose concepts, methodologies, and models allow us to understand the valuation of the perpetuity.
MBA IN A BOOK
49
Chapter 8: From Financial Statements to Finance From Accounts to Models To go from accounts (accounting) to a finance number we use models. We only use Free Cash Flow to determine valuation for major transactions in a capitalist economy including restructuring, growth, M&A, and capital raising. To go from account filings to models, we need to “clean the numbers”, “scrub the financials”, “normalize the financials”. This amounts to recasting accounts to get to a finance number. We try to get to a finance number to get to a valuation. We get to a valuation to then take actions in a capitalist economy. *We want more add backs to get to a higher valuation Modeling After getting valuation, we can then model the different actions we can take in a capitalist economy to increase the valuation of the strategic, financial or entrepreneurial firm. Modeling in Excel Just like our account statements, our models are built and exist in Excel Analysis of Account Statements Analysis of account statements (ratio of analysis) has various uses including from a liquidity perspective, commercial bank perspective, activity perspective, profitability perspective, and growth perspective.

MBA IN A BOOK
50
Ex. 4x-7x debt multiple for lending purposes The following is the adjusted financials for Berkshire Hathaway:

MBA IN A BOOK
51
Chapter 8: Analyzing Value with Models Analyzing Value Strategics, financials, and entrepreneurs undertake investment with the expectation of NPV & IRR. They accept projects that have positive NPV and IRR higher than the cost of capital. They actively find and structure positive NPV projects and then match financial products to them. The positive NPV project is ideally a perpetuity with the value of the business being the perpetuity value: Perpetuity value = CF / Discount rate Calculating NPV & IRR is the main analytical work of finance. *Growth statistic CAGR (Compound Annual Growth Rate) is yearly IRR
MBA IN A BOOK
52
Part III:
Modeling Value Continuing deeper into the field of finance we now discuss the actual work associated with understanding the value of a perpetuity. The work is done by modeling the perpetuity in Excel.
MBA IN A BOOK
53
Chapter 9: Finance with Excel
Finance with Excel Express your decisions using Excel. Excel is the premier business computational tool Implement financial analysis using the tool for financial analysis, Excel Valuation process Heart of finance is time value of money and discounting Excel Concepts Needed for Finance Write down variables (defining the parameters of the decision) Absolute or relative values copying (=A1) (=$A$1) and formulas Functions (=fx( )) Data tables (“sensitivity tables”) Express Decisions with Excel Implement financial analysis with Excel
MBA IN A BOOK
54
Using a Financial Model for Decision Making: The Investment Decision Ability to get financing from financial institutions depends on ability to make a financial model for the new or existing business The financial model projects future earnings from the organization Predict the future performance of a firm. Accounting statements report what happened to the firm in the past. A financial model predicts what the firm’s accounting statements will look like in the future. Start by taking the initial accounting statements and inputting them into Excel Difference between accounting and financial model is in the current assets and current liabilities. In financial model we are concerned only with operating assets and operating liabilities. We exclude financing related Financial model has three components: Model parameters (value drivers) Financing decision assumptions (i.e. Mix between debt and equity, what does firm do with excess cash? Repay debt, payments to shareholders, or as cash balance) Pro forma financial statements Cash in the financial model is a plug. The plug is so that the balance sheet balances. Cash = total liabilities and equity – current assets – net fixed assets The plug is the balance sheet item that guarantees the equality of the future projected total assets and future projected total liabilities and equity. Every financial model has a plug and the plug is almost always cash, debt, or stock. Financial Model and Valuation Process: Assumptions (value drivers) Existing accounting statements (IS and BS) Projected financial statements Free cash flow calculation (FCFs) Terminal value calculation Valuation calculation Sensitivity table for major value drivers to see range of valuation
MBA IN A BOOK
55
Once the financial model is complete (i.e. accounting statements have been projected), we can use the model to: Value the firm by projecting free cash flows (FCFs) Determine ability of firm to pay it’s debts (i.e. credit analysis) Using a Financial Model for Decision Making: The Financing Decision All companies must decide how to finance their activities Proportion of debt and equity The discount rate should be appropriate to the riskiness (i.e. variability or beta) of the cash flows being discounted. Discount rate is also called interest rate, cost of capital, opportunity cost. Compute annualized IRR The cost of capital of an investment is related to the risk of the cash flows of the investment. The relationship of individual asset returns to the risk is called the security market line (SML). You can use SML to get the discount rate for individual investments. The SML is used for private companies. The cost of capital of an organization is related to the risk of the combined riskiness of the investments in the portfolio. The relationship of portfolio returns to the risk is called the capital asset pricing model (CAPM). You use CAPM to get the discount rate (i.e. cost of capital). When the investment is a public security, you use CAPM since the buyer of the security will have a portfolio to diversify away risk. Portfolio risk is associated with statistics. Wealth Maximizing Decisions Investment decision – What is it worth? NPV of strategic alternative Financing decision – What does it cost? IRR of financing alternative Cash is King Wealth maximization has to do with maximizing cash. Cash in the context or organizations is known as cash flow. Return is a word for cash flows Cash Flow Definition (FCF) Profit after taxes
MBA IN A BOOK
56
+ Depreciation (noncash expense) + Change in net working capital (- increase in current assets and + increase in current liabilities) Capital expenditures (CAPEX) + After-tax interest payments = Free Cash Flow (FCF) Role of the Finance Professional The role of the financial professional is to quantify the cash flows and risk of strategic alternatives available to the individual or organization. Investment bankers compute the IRR and NPV of strategic alternatives. Capital Markets The capital markets is made up of cash flows and discounts Capital Markets and Information Information is valuable in determining investment and financing decisions in the capital markets. Overall, markets are weak form efficient meaning that their valuations reflect previous stock price performance (i.e. stock price data) and are sometimes semistrong meaning that valuations incorporate all public information. Capital markets are not strong form efficient meaning that valuations do not reflect private information. Multiple Investment and Financing Decisions: Portfolio When there is multiple investment and financing decisions, we have something called a portfolio. The discount rate can be decreased by diversifying with a portfolio. When the discount rate is decreased, the valuation of the portfolio increases as cash flows have maintained more value. A corporation/organization is simply a portfolio of sources and uses Modeling a Strategic Alternative Put all variables (“value drivers”) at the top of the spreadsheet Never use a number where a formula will also work Blue for hard codes Black for links and outputs Finance: Exchanging Value Through Time Assets have a time dimension Future value function =FV( ) Value in the future of a sum of money compounded into the future
MBA IN A BOOK
57
Present value =PV( ) Value today of future payments discounted to present Net present value (NPV) =-First payment + NPV( ) Incremental wealth increase earned by a strategic alternative. NPV tells you economic value of an investment today. Always use NPV in the investment decision. Internal rate of return (IRR) =IRR( ) Compound rate of return earned by a strategic alternative VIII. Rate of Return vs. Cost of Capital What is the asset’s IRR? Compare to the cost of capital (Effective annual interest rate – which is the annualized IRR used to compare financing alternatives aka Compound Annual Growth Rate (CAGR)) Cost of Capital Calculate IRR of financing alternatives to determine cost of capital Need to get IRR in annual terms to facilitate comparison. May have to start with monthly IRR then annualize Annualized IRR = (1 + Monthly IRR)^n-1 Finding a Value in a Financial Model When we want to find a value by setting a particular value to another cell, we use: Goal seek – Alt, A, G Financing Alternatives: Loan Amortization =PMT( ) To calculate the debt payment per period =IPMT( ) To calculate the interest portion of the payment of debt =PPMT( ) To calculate the principal portion of the payment VIII. Financing Alternatives: Direct Comparison
MBA IN A BOOK
58
IRR of differential cash flows tells you the cost of the option IRR tells you the cost of the financing alternative CAGR is Effective Annual Interest Rate (EAIR) to allow for comparison Analyzing the Strategic Alternative: Sensitivity Table Data Table is Alt, A, W, T Tells you how output changes with incremental changes in the inputs (i.e. variables) The Financing Alternative: Nominal vs. Real Cost In determining the true cost of a financing alternative, it is important to use the real rate of interest which incorporates inflation. The real rate of interest is determined by using the real cash flows. Inflation acts as a discount rate Strategic Alternatives Analysis For each strategic alternative, compute the NPV and IRR, then have decision rules for investing including: Minimum NPV Hurdle rate (IRR) You are using NPV and IRR to make investment decisions but you need the discount rate. The discount rate is associated with the financing decision Cash Flows and Risk Are cash flows riskless (i.e. treasury bills) or are they risky (i.e. market portfolio) Cost of Capital and Opportunity Cost The returns of similar investments should be used as the cost of capital The Discount Rate An organization’s discount rate is the cost of equity and cost of debt. The cost of the total capital structure is known as the Weighted Average Cost of Capital (WACC): WACC = rE* (E/(E+D)) + rD (1-Tc)*(D/(E+D)) Value of Equity The value of equity is the present value of all future dividends
MBA IN A BOOK
59
Sources & Uses Uses Sources Free Cash Flows WACC CAPM to get cost of equity Accounting Statements: Statement of Cash Flows The purpose of the statement of cash flow is to explain the increase in the cash accounts on the balance sheet as a function of the firm’s operating, investing, and financing activities. Valuation Methods: Total Enterprise Value (TEV) vs. DCF Market valuation: Total Enterprise Value (TEV) = MVE + MVD + Preferred – Cash 2. DCF Method (intrinsic value) = PV(FCFs) @ WACC + liquid assets Accounting Value vs. Finance Value Accounting value of firm is backward looking and thus incorrect to use in valuation. Finance value is forward looking and consistent with the fact that the owner of an organization or security has claims on the future cash flows of the business. FCF and DCF Free cash flow (FCF) calculations is DCF Portfolio Analysis and the Capital Asset Pricing Model (CAPM) Discount rate is a measure of risk associated with: Horizon Safety Liquidity We get the discount rate by analyzing the distribution of an investment’s returns. We get the standard deviation which is a measure of variance in returns. Standard deviation is a component to finding the discount rate: =STDEVP( ) What does the frequency distribution look like? Determine risk measure known as beta and plug this into CAPM to get the discount rate of equity. Derive the cost of debt and then calculate WACC to get the discount rate of the firm.
MBA IN A BOOK
60
Ex Ante vs. Ex Post Returns Ex Ante is the expected return Ex Post is the actual return VIII. Statistics for Portfolios =Average( ) To get mean return =Varp( ) To get variance of returns =Stdevp( ) To get standard deviation of returns =Covar( ) To get covariance between two sets of returns =Correl( ) To get correlation between two sets of returns Trendline (regression) – click on points of XY graph and right click to Add Trendline with linear regression and display equation and R-squared on chart Portfolio Returns and The Efficient Frontier Statistics are used to determine acceptable and unacceptable portfolios Diversification lowers standard deviation of the portfolio Are the returns correlated? If no, then add security to the portfolio (i.e. diversify) The efficient frontier is the set of all portfolios that are on the upward-sloping part of the graph starting with the minimum variance portfolio (i.e. the market portfolio). Choose the portfolio that is on the efficient frontier. The Efficient Frontier and the Optimal Portfolio The best investment portfolio is made up of the risk free asset and a risky asset representing the market (i.e. the market portfolio) Determine the market portfolio (the portfolio with the highest attainable sharpe ratio) Market portfolio is the best combination of risky assets available to the investor Security Market Line & CAPM
MBA IN A BOOK
61
The security market line says that the expected return of an asset is a function of the asset’s beta (i.e. sensitivity to the market). Only relevant risk is systematic risk since the investors will all be diversified Security Market Line & Investment Performance The security market line says that the expected return of an asset is a function of the asset’s beta (i.e. sensitivity to the market). Only relevant risk is systematic risk since the investors will all be diversified Security Market Line & Investment Performance The security market line says that the expected return of an asset is a function of the asset’s beta (i.e. sensitivity to the market). Only relevant risk is systematic risk since the investors will all be diversified VIII. Security Market Line & Investment Performance Continued Investment performance: Risk adjusted performance; excess returns? Risk Adjusted Performance Market portfolio proxy is S&P 500 Beta is measure of riskiness of security Alpha measures excess return Market portfolio proxy is S&P 500 Beta is measure of riskiness of security Alpha measures excess return It is about investment performance versus the risk involved in the investment CAPM & Investment Performance Use CAPM to get the discount rate of equity and compare to cost of financing alternatives Is there risk adjusted overperformance or underperformance? Is performance commensurate with risk?
MBA IN A BOOK
62
Excess Return Excess return is the investment’s spread over the one year treasury (i.e. risk free rate) Use regression equation to determine if underperformance (negative alpha) or overperformance (positive alpha) When regressing asset’s returns against the market portfolio, alpha measures excess returns over the market portfolio Beta & R^2 High beta is an aggressive stock Low beta is a defensive stock R^2 is percentage of variability that is market related risk when returns are regressed on the market portfolio Diversification increases R^2 of the portfolio and decreases nonsystematic risk Alpha and Efficient Markets In efficient markets, there is no alpha and investments earn their risk-adjusted return CAPM and the Cost of Capital CAPM = rf + Beta [ E(rm) – rf] In CAPM, use Beta of asset to calculate cost of equity WACC is the discount rate based upon the capital structure of the investment Valuing Securities in Efficient Markets Market efficiency and the role of information in determining asset prices Publicly available information should be reflected in market price
MBA IN A BOOK
63
Chapter 10: Financial Statement Modeling Financial statement modeling refers to the creation of a standalone operating model for a company. The operating model is built using historical performance (i.e. historical financial statements). We use the operating model to see pro forma performance of a company given certain assumptions. These pro-formas are the basis for decision making within the corporation. Financial statement modeling best practices: Blue is hard codes, black is formulas Be consistent with millions and billions (keep conventions the same) Footnote everything in presentation Keep your model simple (1,000 cells is better than 10,000 cells) Financial Modeling Steps: 1. Spread historical financial statements
a. 3 to 5 years history for IS, BS, and SCF b. Public information for company 10K, 10Q c. If private company, get audited financial statements provided by
company 2. Adjust for non-recurrings 3. Build cases into the operating model
a. Best case b. Base case c. Worst case d. Disruption case
4. Build assumptions based upon historical trends in assumptions tab (margins and growth rates)
5. Project LIBOR and interest rates a. Spread over LIBOR b. LIBOR is the base that banks use to price spread their loans to make
money (called “L”)

MBA IN A BOOK
64
c. 3 month LIBOR is the standard reference 6. Project IS and BS & two items on SCF (D&A and CAPEX (before gross PPE on BS))
a. Maintenance CAPEX vs. Discretionary (growth) CAPEX 7. Separate debt and interest schedule (calculate debt and interest schedule
before calculating BS items for revolver, term loan, and unsecured debt) 8. Project Working Capital
a. Days payable & Days receivable (360 day method) 9. Project rest of SCF (all items pulled from IS or BS)
a. AR goes up, need negative sign on SCF b. AP goes up, need positive sign on SCF c. BS cash is ending cash position on SCF
10. Calculate paydown/drawdown for revolver as minimum (Min function) of CF before revolver and beginning revolver balance
11. Operating model is done when you finish SCF. Operating model check (zero for Assets – (Liabilities + Owners Equity)
NEXT STEP IS TO USE THE OPERATING MODEL FOR VARIOUS ANALYSES INCLUDING ORGANIC GROWTH & INORGANIC GROWTH (STRATEGIC ALTERNATIVES). THE KEY QUESTION TO ASK IS: WHAT IS THE BEST STRATEGIC ALTERNATIVE FOR THE CORPORATION (I.E. HOW TO BE A GROWING PERPETUITY OR PARENT COMPANY OF MULTIPLE GROWING PERPETUITIES)? The following is a financial statement model for Berkshire Hathaway:

MBA IN A BOOK
65
Chapter 10: Adjusted EBITDA Calculation In finance, we are trying to get to the actual cash flow. A proxy for this that is used in finance is EBITDA. It needs to be adjusted EBITDA to come closer to an actual cash flow metric.
MBA IN A BOOK
66
Part IV:
Valuation Methodologies Continuing on through foundations of valuation, we arrive at the actual valuation methodologies used in investment banking & private equity.
MBA IN A BOOK
67
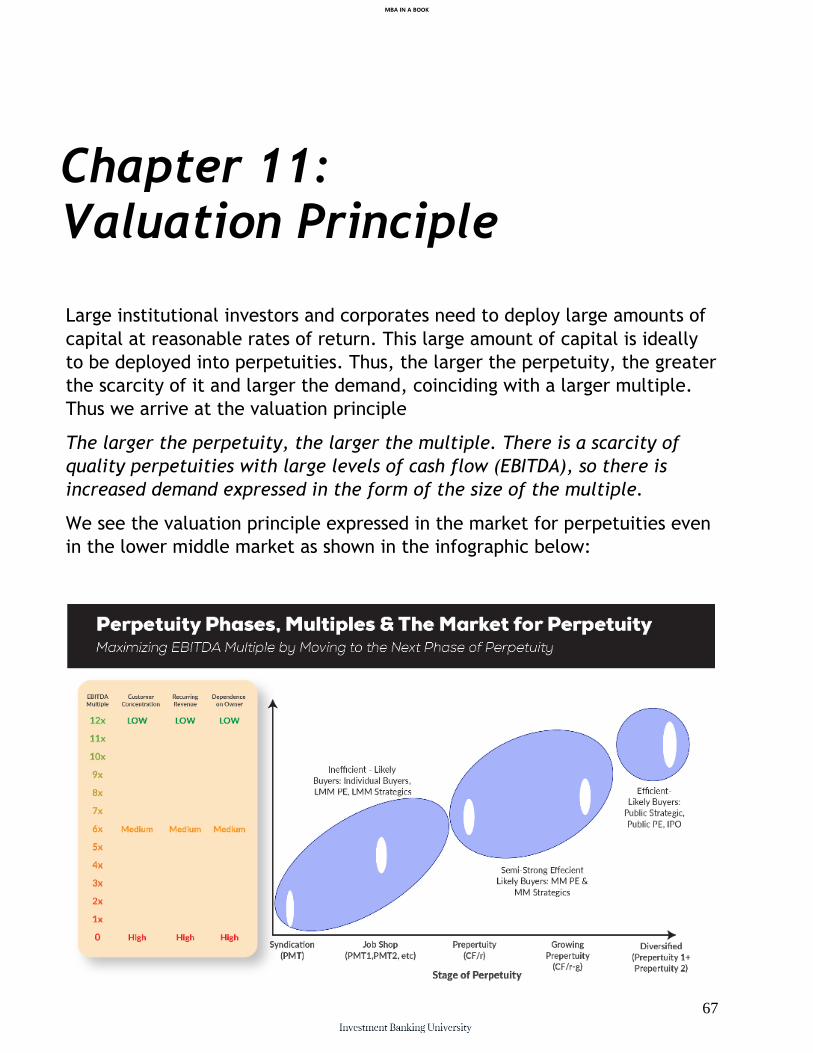
Chapter 11: Valuation Principle Large institutional investors and corporates need to deploy large amounts of
capital at reasonable rates of return. This large amount of capital is ideally
to be deployed into perpetuities. Thus, the larger the perpetuity, the greater
the scarcity of it and larger the demand, coinciding with a larger multiple.
Thus we arrive at the valuation principle
The larger the perpetuity, the larger the multiple. There is a scarcity of
quality perpetuities with large levels of cash flow (EBITDA), so there is
increased demand expressed in the form of the size of the multiple.
We see the valuation principle expressed in the market for perpetuities even
in the lower middle market as shown in the infographic below:

MBA IN A BOOK
68
Chapter 12: Valuation Build Up A company is a perpetuity in a financial sense. The valuation for a simple perpetuity is: Perpetuity Valuation (Intrinsic) = CF / r CF = Adjusted EBITDA (proxy for CF from NI on financial statements P&L) r = Discount rate for phase of perpetuity To determine the r, we look at the discount rate for each phase of the perpetuity as demanded by the source of capital and compare it to comp companies where available. It may be necessary to look at public comp WACCs and then make adjustments for size and risk: I. Syndication = 45%+ (VC) II. Job Shop = 35% (LMM PE) III. Perpetuity = 25% (PE) IV. Growing Perpetuity = 15% (Strategic) V. Diversified Perpetuity = 7% to 10% (Mature Strategic)
We then take the proxy for cash flow, EBITDA, and divide by the discount rate of the phase of the perpetuity to get a base line valuation build up for the perpetuity. This should give you a high level simplified understanding of valuation of the corporation as if its cash flow behaved like a perpetuity for the rest of its existence.

MBA IN A BOOK
69
We can then triangulate valuation with the various methodologies to come up with a range of for the actual valuation of the company and then look at the midpoint of the range for the actual valuation of the company.

MBA IN A BOOK
70
Chapter 13: Public Company Valuation
MBA IN A BOOK
71
Chapter 13: Comp Companies
Also known as trading comps. Management team gives you 1 to 2 years projections or equity research comp reports to get forward multiples (x Revenue or x EBITDA ) which may be used as the basis for this valuation. You can get comps from the general overview as it will discuss the target’s comps in the 10K. Find comps with good multiples to then tell your story to the marketplace to then get a certain valuation.
a. Select the universe of comparable companies – Choose 7, 8, 10 comps, need their 10K, 10Q, analyst reports to get TEV for each comp then divide by line item to get multiple.
b. Locate financial information on comp companies – Information must come from latest filing (10K or 10Q). Print out 10K, 10Q, analyst reports.
c. Spread key financial information, ratios and multiples – Calculate TEV (in comp spread tab). To get MVE, use TSM method. TSM = Exercisable options outstanding x (share price – strike) / share price.
d. Benchmark comp companies – Get the multiple that the company is trading at for each metric for each comp and get mean and median of comps for the metrics (ex. TEV/EBITDA)
e. Determine implied valuation – Multiply mean and median multiple x the revenue or EBITDA to get the valuation range for your target company.
Notes: The better the company, the higher the multiple and the better valuation you get. In IB/PE/CorpFin, you need to know comp companies and transaction comps. “Here are the comps in your sector…”

MBA IN A BOOK
72
Higher multiple because… Operating in better markets, better operations The multiple tells you which company is better, margin analysis tells you why they are better. Sell side key question: “Which comp would you use to guide potential buyers?”
MBA IN A BOOK
73
Chapter 13: Comp Transactions
The basis for precedent transactions being used as a valuation methodology is that M&A involving similar companies on a business and financial basis will yield similar multiples to your target. a. Select universe of comp transactions b. Locate deal-related and financial information – Need press release of the deal,
8K, 10K, and 10Q. Type of payment: cash, stock, cash & stock. c. Spread financial information, ratios and multiples – Get transaction TEV
(implied) & transaction MVE (implied) d. Benchmark precedent transactions e. Determine implied valuation
Notes: 20% to 25% control premium paid with the transaction multiple being an implied one based upon the valuation. Determine whether the market is good or bad based upon whether people are paying good premiums (control premiums). When a transaction occurs, update client on the latest transaction to show them impact on the control premiums being paid and implied multiple as well. Point to the transaction comps that have the highest control premium.
MBA IN A BOOK
74
Chapter 13: Discounted Cash Flow (DCF) a. Spread historical financial statements (input historicals) and derive historical
ratios, trends and variables (drivers of future performance; margins and growth rates). Project financial statements (proforma). Revolver modeling to link IS, BS, and SCF
b. Project free cash flow (FCF) c. Determine Weighted Average Cost of Capital (WACC) – Discount rate
Cost of equity:
Rf = 10 year treasury Market risk premium = Rm – Rf. Refer to Ibbotson. Ultimately this is S&P returns over 70, 80, or 90 years Beta = Levered beta of comps to unlevered median and mean of comps (unlevered beta); should be .5 to 2.5; 2 year to 5 year betas (taking out capital structure and relever to actual capital structure. With beta, we are putting capital structure on unlevered beta mean and median of comps to calculate WACC of own company. Cost of debt: weighted average of tranches of debt tax effected; found in 10K. Rates from the notes. If private company, get from clients the tranches and to get rates, go to DCM to get approximation.
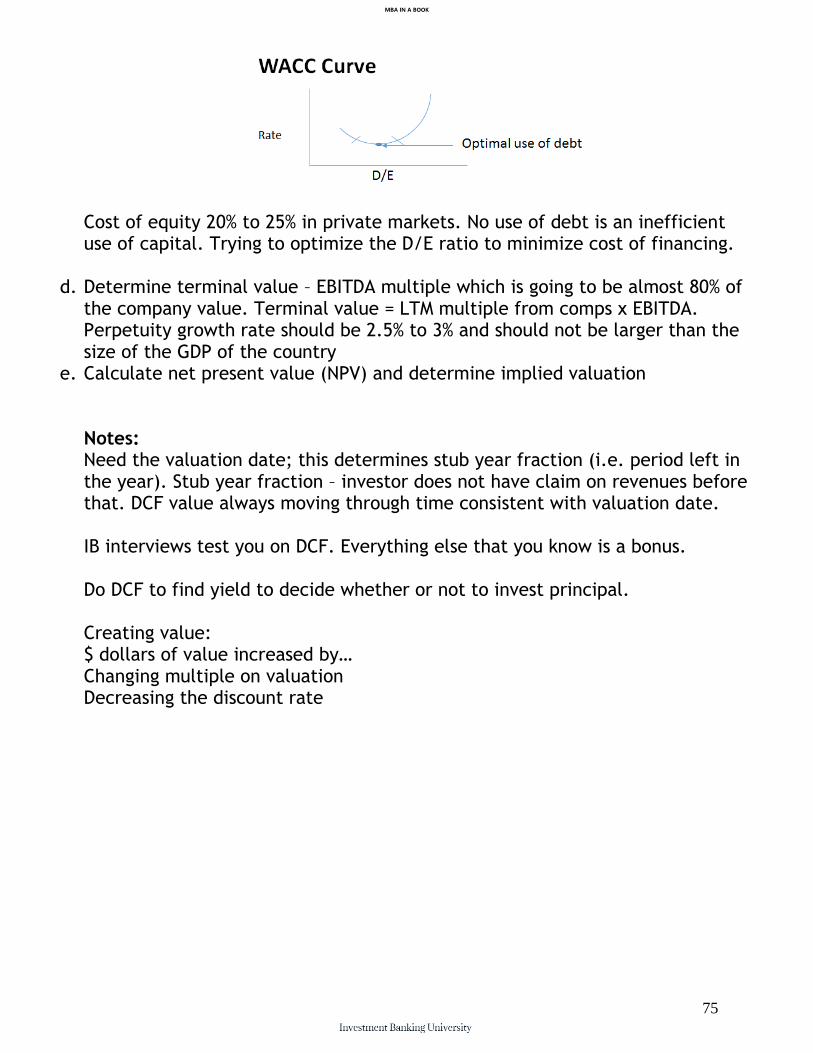
MBA IN A BOOK
75
Cost of equity 20% to 25% in private markets. No use of debt is an inefficient use of capital. Trying to optimize the D/E ratio to minimize cost of financing.
d. Determine terminal value – EBITDA multiple which is going to be almost 80% of the company value. Terminal value = LTM multiple from comps x EBITDA. Perpetuity growth rate should be 2.5% to 3% and should not be larger than the size of the GDP of the country
e. Calculate net present value (NPV) and determine implied valuation Notes: Need the valuation date; this determines stub year fraction (i.e. period left in the year). Stub year fraction – investor does not have claim on revenues before that. DCF value always moving through time consistent with valuation date. IB interviews test you on DCF. Everything else that you know is a bonus. Do DCF to find yield to decide whether or not to invest principal. Creating value: $ dollars of value increased by… Changing multiple on valuation Decreasing the discount rate
MBA IN A BOOK
76
Chapter 13: Triangulating Valuation with the Football Field
After going through and determining the valuation range for each of the various valuation methodologies, we are going to triangulate the ultimate valuation of the target company by using the valuation football field. We are going to display each of the ranges on a chart and then paint lines with will be the ultimate valuation range for the target company and then determine the mean of the ultimate range to arrive at the valuation. The more confidence we have in a valuation, the tighter the range will be.

MBA IN A BOOK
77
BUILD-SIDE
Related to the intentional creation of perpetuities following a methodology, we have what is known as the build-side. The build-side is associated with the creation and management of perpetuities. Participants on the build-side include startups, growing businesses, and established corporations.

MBA IN A BOOK
78
Part I:
How to Build a Perpetuity?
As mentioned, business is the generation of new science and the conversion of this new science into a benefit stream and then ultimately a perpetuity.
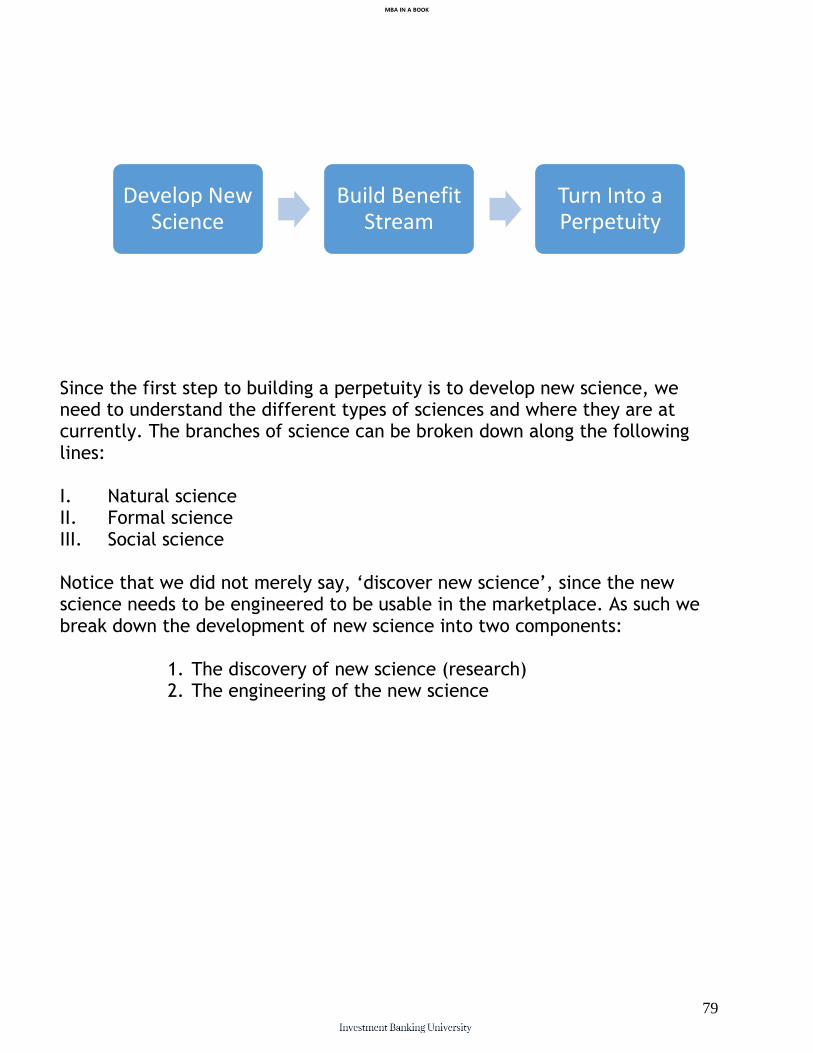
MBA IN A BOOK
79
Since the first step to building a perpetuity is to develop new science, we need to understand the different types of sciences and where they are at currently. The branches of science can be broken down along the following lines: I. Natural science II. Formal science III. Social science Notice that we did not merely say, ‘discover new science’, since the new science needs to be engineered to be usable in the marketplace. As such we break down the development of new science into two components:
1. The discovery of new science (research) 2. The engineering of the new science
Develop New Science
Build Benefit Stream
Turn Into a Perpetuity

MBA IN A BOOK
80
After we develop the new science, we then go about building the benefit stream associated with the new science. This means bringing the new science to market.
The building of a benefit stream includes two separate capabilities which first requires the building of new science often called product/service. This capability is known as the engineering capability. The second capability is associated with bringing the new science to the market and is called the business development capability.
New Science
Discovery (Research)
Engineering
New Science
Market
Benefit Stream
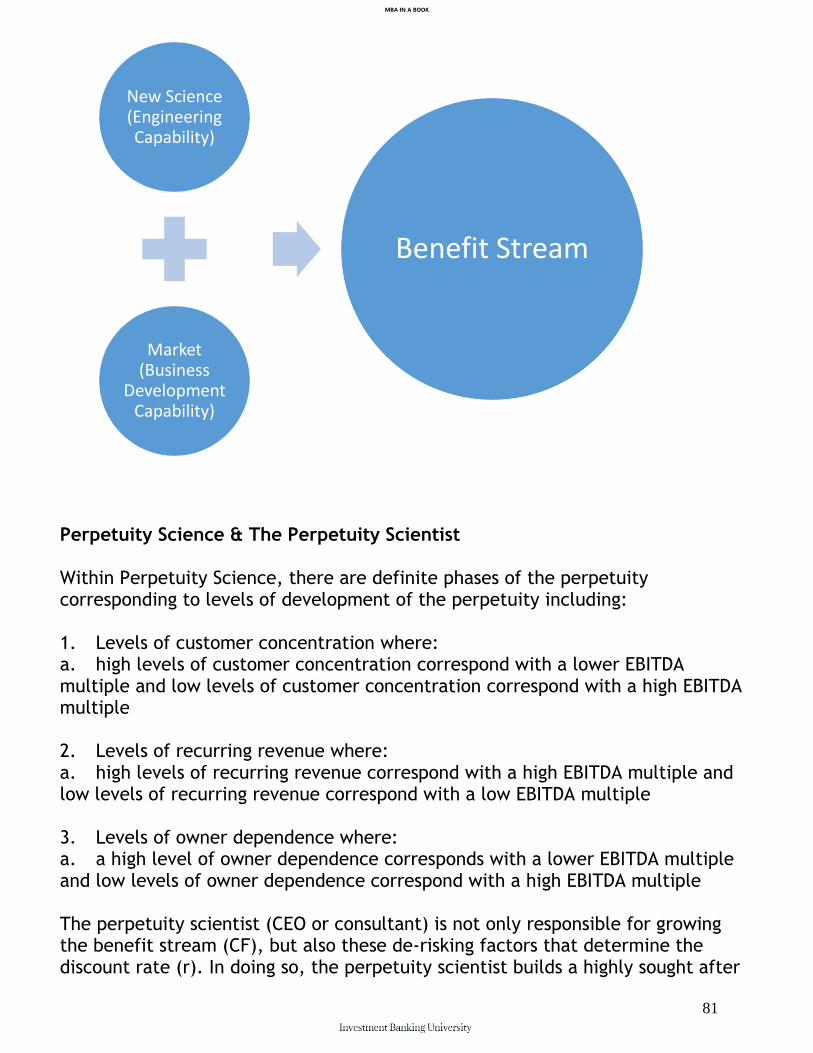
MBA IN A BOOK
81
Perpetuity Science & The Perpetuity Scientist Within Perpetuity Science, there are definite phases of the perpetuity corresponding to levels of development of the perpetuity including: 1. Levels of customer concentration where: a. high levels of customer concentration correspond with a lower EBITDA multiple and low levels of customer concentration correspond with a high EBITDA multiple 2. Levels of recurring revenue where: a. high levels of recurring revenue correspond with a high EBITDA multiple and low levels of recurring revenue correspond with a low EBITDA multiple 3. Levels of owner dependence where: a. a high level of owner dependence corresponds with a lower EBITDA multiple and low levels of owner dependence correspond with a high EBITDA multiple The perpetuity scientist (CEO or consultant) is not only responsible for growing the benefit stream (CF), but also these de-risking factors that determine the discount rate (r). In doing so, the perpetuity scientist builds a highly sought after
New Science (Engineering Capability)
Market (Business
Development Capability)
Benefit Stream
MBA IN A BOOK
82
perpetuity for both strategic and financial buyers corresponding with a premium valuation. When providing coverage to a target perpetuity and originating an engagement, the perpetuity scientist should follow these steps: Stage of the Perpetuity: 1. Syndication: (Getting to PMT) Initial revenue generation The key here is taking a concept that has a large enough total addressable market and turning it into a single sale as represented by PMT. This demonstrates product market fit between the minimum viable product/platform and allows the owner to invest additional time/energy/resources into turning the syndication into a perpetuity. The syndication’s value to the owner will be related to the NPV/DCF value, however, since there is an inefficient market for syndications, the value is going to be discounted at a high rate, in the 80% to 100% range. The syndication is entirely reliant on the owner’s active involvement. If the owner no longer works in the syndication, the syndication will cease to operate. The market here is inefficient. 2. Job Shop: (From PMT1 to PMT2, PMT3, etc) The initial efforts create a job shop The key here is taking a syndication that has demonstrated product/market fit and turning it into a job shop with multiple projects as represented by PMT1, PMT2, PMT3. This demonstrates product market fit between the minimum viable product/platform and allows the owner to invest additional time/energy/resources into turning the syndication into a perpetuity. The job shop’s valuation is based upon a multiple of its EBITDA and is usually in the range of 3x to 5x. The job shop is not entirely reliant on the owner’s active involvement and there is thus a larger, albeit still inefficient market for the prospective perpetuity with likely buyers being individuals and LMM strategic and financial buyers. The owner’s primary responsibility is to first turn the company into a project or job shop (PMT representing a given job). The company is looked at solely as the sum of the value of its projects/jobs meaning that the valuation of the company is backward looking.
MBA IN A BOOK
83
3. Perpetuity: (From PMTi to CF/r) Transitioning from a job shop to a recurring revenue stream The key here is taking a job shop with disparate projects (PMT1, PMT2, PMT3) and turning it into a perpetuity with a predictable if not recurring benefit stream. The perpetuity’s value is based on a larger EBITDA multiple since there is a semi-strong efficient market for perpetuities with likely buyers being middle market strategic and financial buyers. The perpetuity is almost entirely not reliant on the owner’s active involvement. From here, the owner is to turn the company into a perpetuity as characterized by predictable, preferably recurring revenue. This can be done by building an organizational structure with division of labor, automated processes with technology, and a business model that is recurring by nature. When this is accomplished, the valuation becomes forward looking. 4. Growing Perpetuity: (From CF/r to CF/r– g) Going from recurring revenue stream to a growing perpetuity The key here is taking a perpetuity with a durable benefit stream (CF) and reasonable amount or variability in that benefit stream (r) and turning it into a growing perpetuity with a corresponding growth rate (g). The perpetuity’s value is based on an even larger EBITDA multiple since there is a weak form efficient market for growing perpetuities with likely buyers being middle market strategic and financial buyers and some public strategic and financial buyers. The growing perpetuity is almost entirely not reliant on the owner’s active involvement. This can be accomplished by building a scalable platform as part of the core business. The valuation of the company now has to incorporate a growth factor. 5. Diversified: (Perpetuity 1 + Perpetuity 2) From one growing perpetuity to growing another perpetuity organically or purchasing one to grow inorganically Finally, the owner is to diversify either organically (new product, new business) or inorganically. If the diversification is organic, the new product/business will naturally move through the phases of: 1. Syndication 2. Project/job shop 2. Perpetuity

MBA IN A BOOK
84
3. Growing perpetuity Since the valuation is forward looking, it has to incorporate the new product/business’ financial performance. Since the parent company is now becoming diversified, the discount rate will now decrease which adds value to the parent company.

MBA IN A BOOK
85
Chapter 14: How to Build a Benefit Stream? After we develop the new science, we then go about building the benefit stream associated with the new science. This means bringing the new science to market.
The building of a benefit stream includes two separate capabilities which first requires the building of new science often called product/service. This capability is known as the engineering capability. The second capability is associated with bringing the new science to the market and is called the business development capability.
New Science
Market
Benefit Stream
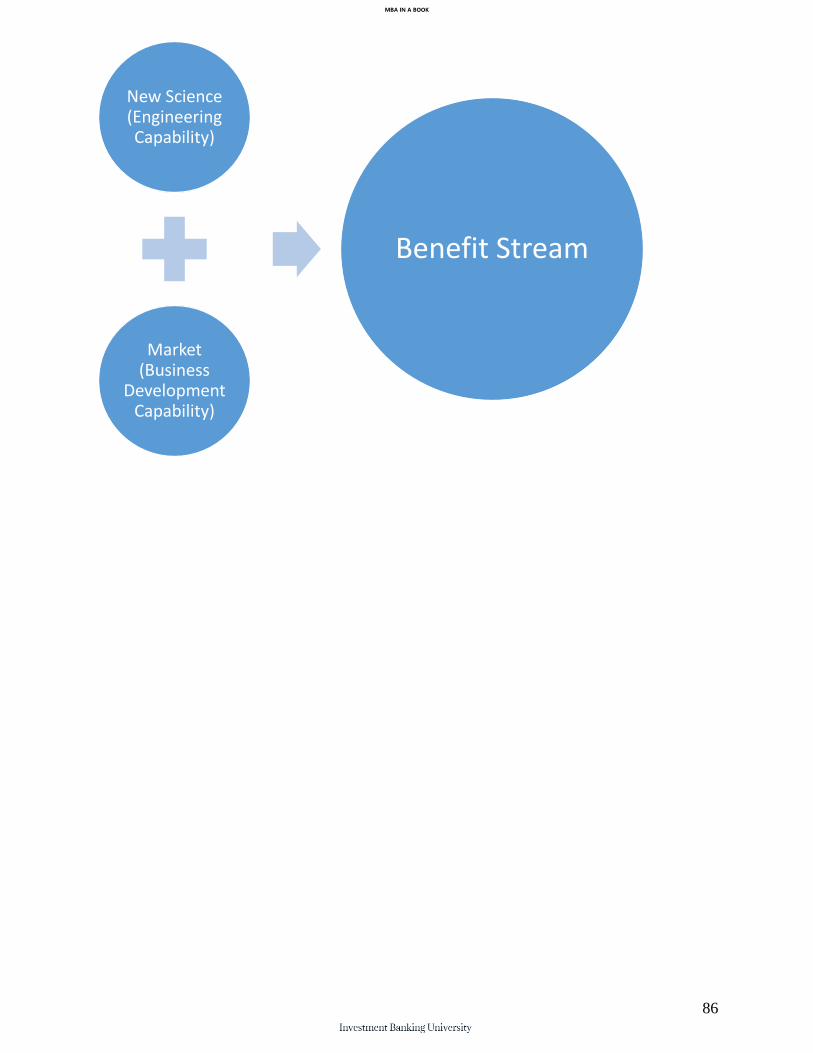
MBA IN A BOOK
86
New Science (Engineering Capability)
Market (Business
Development Capability)
Benefit Stream
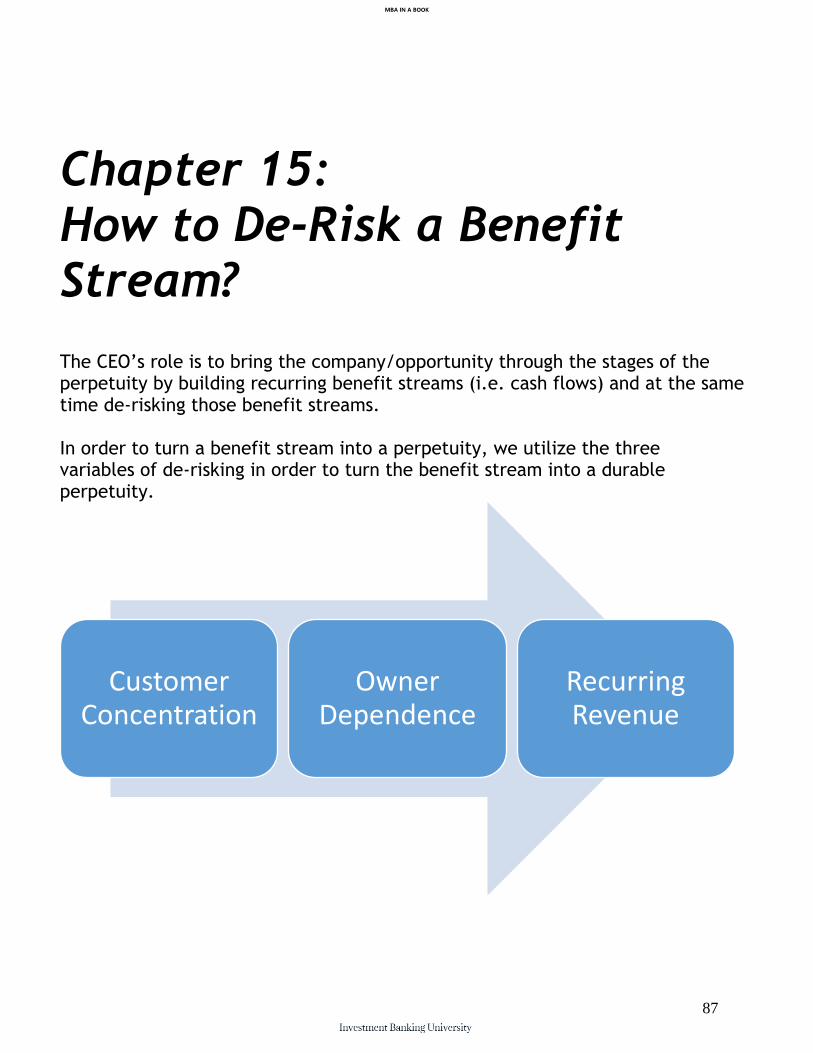
MBA IN A BOOK
87
Chapter 15: How to De-Risk a Benefit Stream? The CEO’s role is to bring the company/opportunity through the stages of the perpetuity by building recurring benefit streams (i.e. cash flows) and at the same time de-risking those benefit streams. In order to turn a benefit stream into a perpetuity, we utilize the three variables of de-risking in order to turn the benefit stream into a durable perpetuity.
Customer Concentration
Owner Dependence
Recurring Revenue
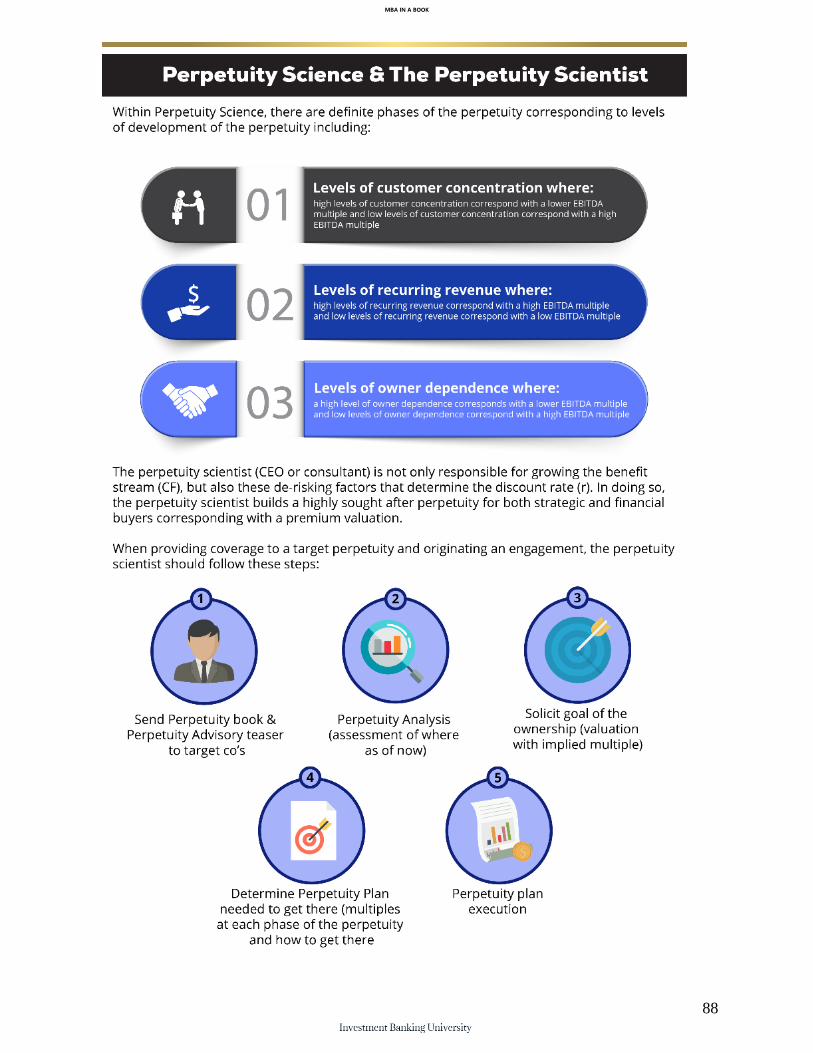
MBA IN A BOOK
88
MBA IN A BOOK
89
Chapter 15: The Build-Side & Corporate Finance
Corporate finance can also be referred to as the build-side of the
perpetuity.
Sources & uses of capital should yield a return on the new science above
the hurdle rate associated with the source of capital and the company’s
own standard as well as beating alternative financial products (ex. bank
account, bonds, comparable stocks).
Uses of capital are determined from the new science and are modeled
into the future (forecasting).
Sources of capital are determined to match uses of capital where capital
type matches asset life.
Dividend vs. reinvestment is determined after a return (benefit stream) is
made on the new science based upon whether there are additional
positive NPV projects avaialable (reinvest) or not (pay dividend).
Aggregate sources and uses of all positive NPV projects amounts to a
financial statement model (plan) with three interlinked financial
statements
Different cases (varied assumptions) built into financial statement model
(upside, most likely, downside).
Different strategic alternatives (transactions) can be built onto the
financial statement model to show the impact of the alternative.
The capital budget feeds into a financial statement model since the
capital budget provides inputs.

MBA IN A BOOK
90
BS is sources & uses, IS is returns, and SCF is change in BS accounts over
the period
MBA IN A BOOK
91
Chapter 15: Corporate Finance Decision 1: Uses (Investment) For positive
MBA IN A BOOK
92
Chapter 15: Corporate Finance Decision 2: Sources (Investment) For positive
MBA IN A BOOK
93
Chapter 15: Corporate Finance Decision 3: Reinvest vs. Return Capital (Dividend)
MBA IN A BOOK
94
Chapter 15: Sources & Uses Matching
For positive NPV projects, the individual must match the sources of
capital with the uses of capital in order to finance the project. This
speaks to the work of the corporate financier/CFO.

MBA IN A BOOK
95
Chapter 15: Cash Surplus/Shortfall Tracking
In addition to sources & uses matching, the corporate financier must
track cash surplus or shortfall on a continual basis to ensure that the
perpetuity remains solvent.
MBA IN A BOOK
96
Part II:
Perpetuity Analysis On the build-side, we are ultimately concerned with the creation and management of perpetuities. We first explore the perpetuity analysis, perpetuity building process/timeline (including sources and uses) and then move towards a methodology for perpetuity management. The goal of Perpetuity Science is the building, growing, management, exit and buying of perpetuities, so ultimately, while learning about Perpetuity Science itself, we are also actively looking for: 1. Perpetuities to create 2. How to advance a perpetuity to the next phase 3. Perpetuities that should be exited from 4. Perpetuities that should be purchased Perpetuity analysis is performed with an understanding that a perpetuity’s ideal course of action at any given time is related to one of the three sides of the perpetuity (Build-side, Sell-side, Buy-side) which depends on the phase that the perpetuity is in: I. Industry and sub-industry indices made up of public comps II. Benchmark comps into Perpetuity Phases III. Build financial statement models for each IV. Determine DCF, Comp Companies & Precedent Transactions valuation football field

MBA IN A BOOK
97
V. Compare peers in Perpetuity Phase to intrinsic value to determine if this is a Buy-Side, Sell-Side or Build-Side deal (where are peer multiples at in relation to intrinsic value?) a. If Build-Side: What needs to be done to get to the next phase of the perpetuity? b. If Sell-Side: How to exit the perpetuity? c. If Buy-Side: How to acquire a target perpetuity?
Perpetuity science explains how perpetuities can be built, managed and exited
from to create wealth. As such, it inherently has an owner focus rather than
simply a capital markets focus which is manifested by the dual goals of
decreasing the owner’s active involvement in the day to day of the business
and the maximizing of valuation.
Perpetuity Analysis can occur at three levels:
1. Vertical (Industry) At the level of the industry, we can take the public comps as place them on the Market for Perpetuities chart:
For example, we can take a look at the Oil & Gas vertical and see where the various players at:

MBA IN A BOOK
98
2. Sub-Vertical At the level of the industry, we can take the public comps as place them on the Market for Perpetuities chart:
For example, we can take a look at the Oil & Gas machine manufacturing sub-vertical and see where the various players at:
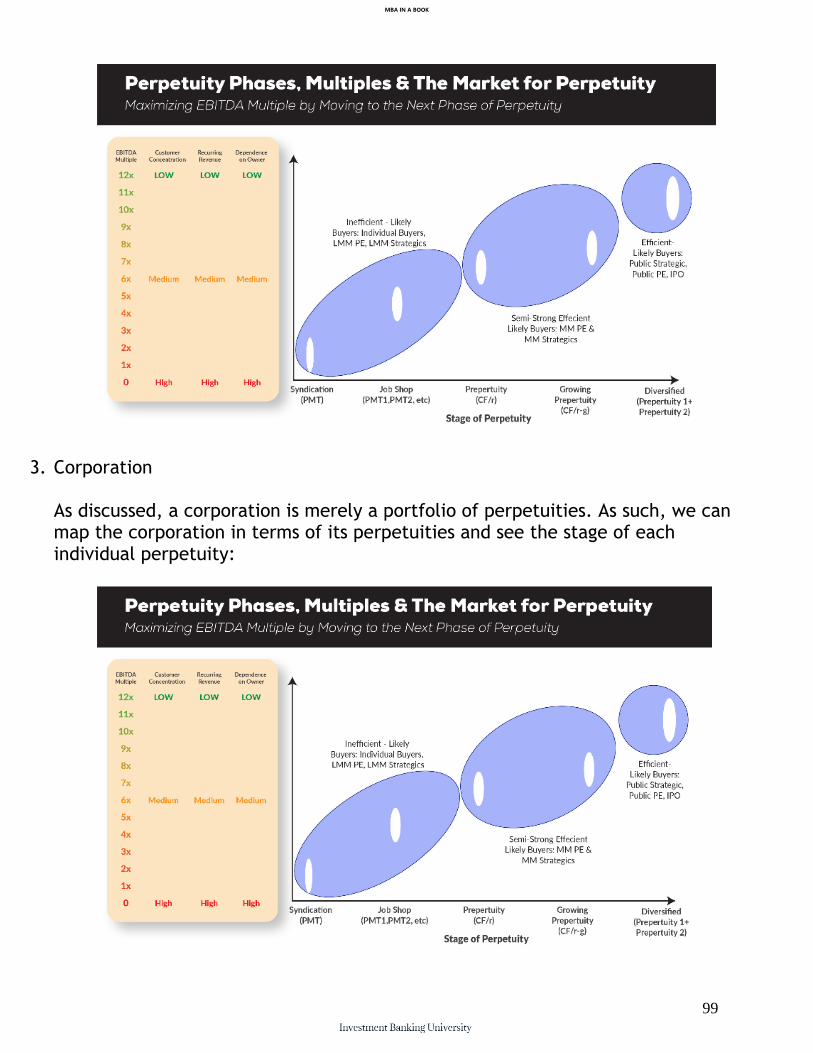
MBA IN A BOOK
99
3. Corporation As discussed, a corporation is merely a portfolio of perpetuities. As such, we can map the corporation in terms of its perpetuities and see the stage of each individual perpetuity:

MBA IN A BOOK
100
An example of Perpetuity Analysis at the corporate level would be Berkshire Hathaway, which we have mapped below:
Perpetuity science is where entrepreneurship, strategy & finance come
together. It a field of study complete with a body of knowledge,
methodologies, and optimization models towards improving the individual's
quality of life by the building of a perpetuity that accomplishes two dual
goals:
1. ever decreasing involvement of the perpetuity owner in the perpetuity
2. ever increasing valuation of the perpetuity
GDP
Industry Spend

MBA IN A BOOK
101
Sub sector spending
Sub sector spending by product
Value Chain Analysis
General
Industry
Sub-sector
Sub-sector by product
Gap Analysis
General
Industry
Sub-sector
Sub-sector by product
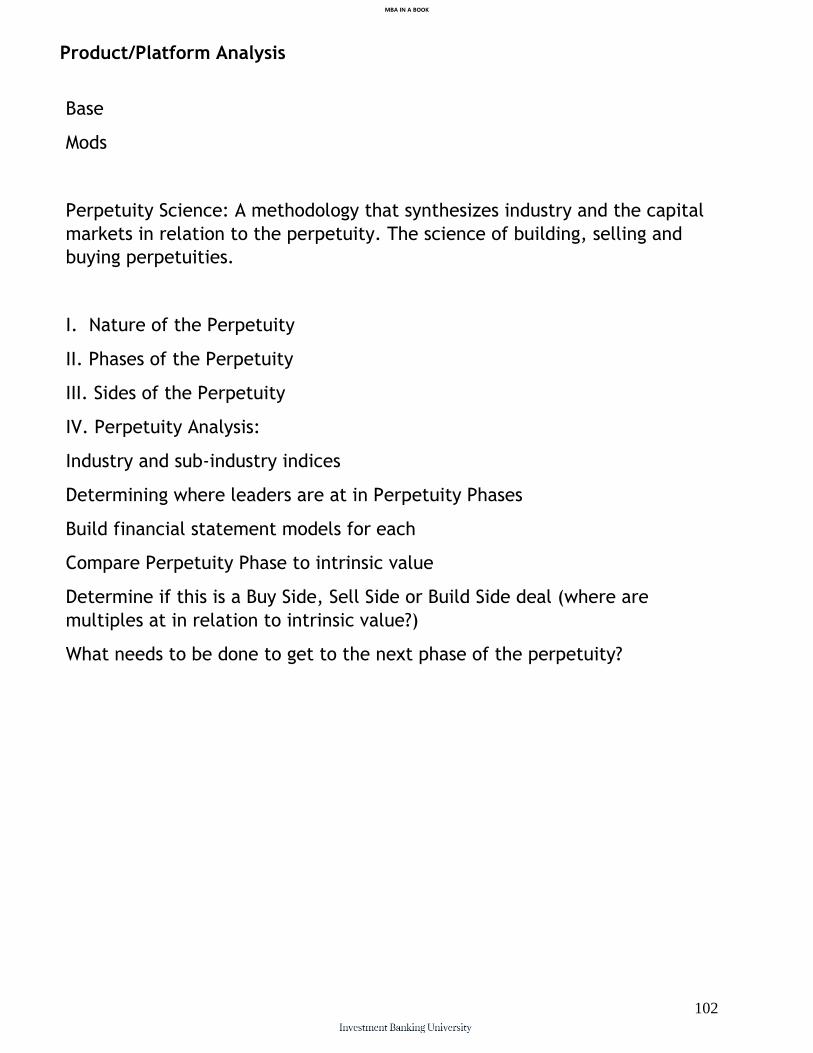
MBA IN A BOOK
102
Product/Platform Analysis
Base
Mods
Perpetuity Science: A methodology that synthesizes industry and the capital
markets in relation to the perpetuity. The science of building, selling and
buying perpetuities.
I. Nature of the Perpetuity
II. Phases of the Perpetuity
III. Sides of the Perpetuity
IV. Perpetuity Analysis:
Industry and sub-industry indices
Determining where leaders are at in Perpetuity Phases
Build financial statement models for each
Compare Perpetuity Phase to intrinsic value
Determine if this is a Buy Side, Sell Side or Build Side deal (where are
multiples at in relation to intrinsic value?)
What needs to be done to get to the next phase of the perpetuity?

MBA IN A BOOK
103
MBA IN A BOOK
104
Chapter 19: Net Present Value (NPV) Net Present Value (NPV) is the present value of expected cash inflows associated with an investment / project NPV compares the value of today’s dollar to the value of that same dollar in the future, taking inflation and required returns into account NPV is the present value of the cash flows less the initial outlay at time 0
NPV Decision Rule Accept projects/investments with a positive NPV – it will increase shareholder wealth Reject projects with negative NPV – it will decrease shareholder wealth
MBA IN A BOOK
105
Chapter 19: Internal Rate of Return (IRR)
Internal Rate or Return (IRR) is the rate of return that equates the PV of
an investment’s benefits (positive cash flows) with the PV of its costs
(negative cash flows) IRR makes the net present value of all cash flows
from a particular project equal to zero (IRR = NPV = 0) It is the “r” in
the NPV formula Generally speaking, the higher a project's internal rate
of return, the more desirable it is to undertake the project As such, IRR
can be used to rank several prospective projects a firm is considering
(note that the size of the project is similar) 0 = C0 + C1 + C2 +
…. + C3 (1+IRR) (1+IRR)2 (1+IRR)3 There is no
formula that will manually solve the IRR besides a trial and error basis.
However, calculator or a computer will do it easily
IRR Decision Rule Accept projects with an IRR that its greater than the
firm/investor’s required rate of return (aka hurdle rate) Reject projects
with an IRR that is less than the firm/investor’s required rate of return
(aka hurdle rate)
MBA IN A BOOK
106
Chapter 19: Recurring Revenue Analysis We are not looking at

MBA IN A BOOK
107
Chapter 19: Owner Dependence Analysis We are not looking at
MBA IN A BOOK
108
Chapter 19: Customer Concentration Analysis We are not looking at
MBA IN A BOOK
109
Part III:
Perpetuity Modeling & Valuation When analyzing a perpetuity, we are going to need to do perpetuity modeling & valuation in excel for a deep level analysis.
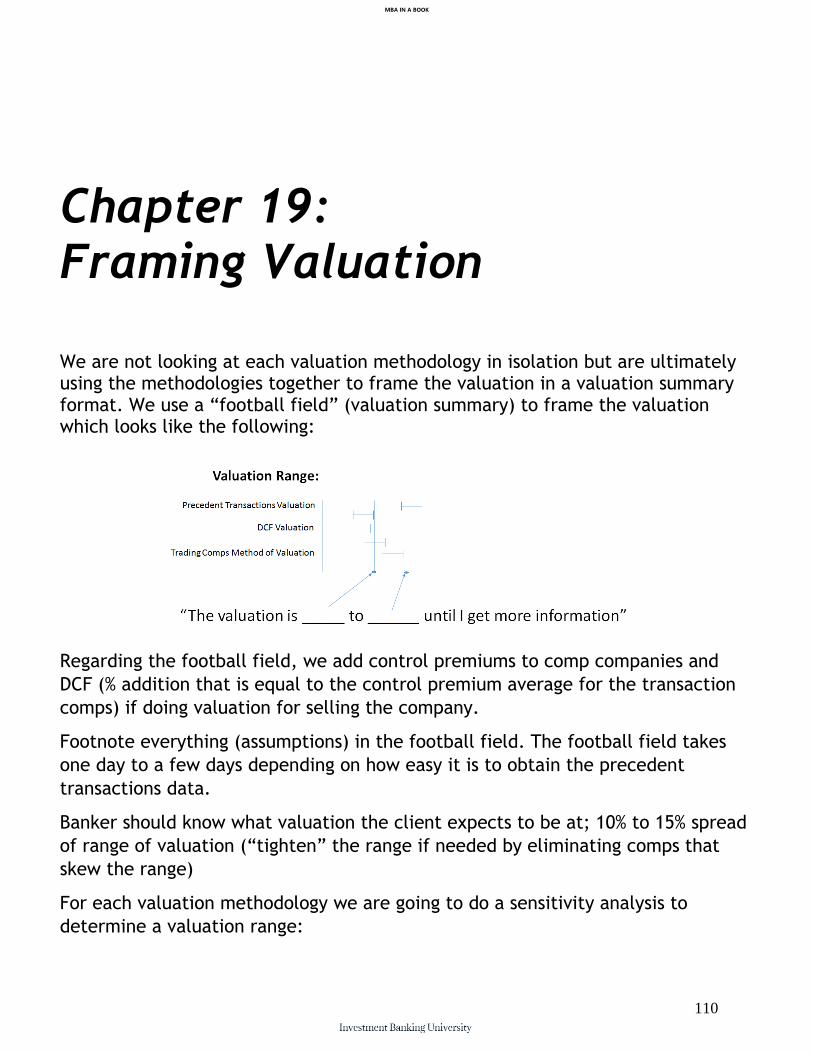
MBA IN A BOOK
110
Chapter 19: Framing Valuation We are not looking at each valuation methodology in isolation but are ultimately using the methodologies together to frame the valuation in a valuation summary format. We use a “football field” (valuation summary) to frame the valuation which looks like the following:
Regarding the football field, we add control premiums to comp companies and
DCF (% addition that is equal to the control premium average for the transaction
comps) if doing valuation for selling the company.
Footnote everything (assumptions) in the football field. The football field takes
one day to a few days depending on how easy it is to obtain the precedent
transactions data.
Banker should know what valuation the client expects to be at; 10% to 15% spread
of range of valuation (“tighten” the range if needed by eliminating comps that
skew the range)
For each valuation methodology we are going to do a sensitivity analysis to
determine a valuation range:

MBA IN A BOOK
111
MBA IN A BOOK
112
Chapter 20: Return Expectations On the build side, we can take a look at return expectations in order to get an
understanding of hurdle rates used in corporate projects.
45%+ Venture Capital
25% - 35% Buyout Private Equity
10% Corporation
MBA IN A BOOK
113
Chapter 21: Finding Weighted Average Cost of Capital (WACC) WACC for large mature companies is 7% to 8%. We can build up the discount rate
from comp companies then add risk premiums for size, liquidity, maturity.
Companies raise capital to fund their business or finance their growth On the
right side of a firm’s balance sheet, there are (i) debt, (ii) preferred stock and (iii)
common equity These items are commonly referred to as capital components
and they are used to finance the company’s total assets (right side of the balance
sheet) Increase in company’s total assets need to be financed through an
increase in one of the capital components
Many capital investments/project analyses which involve discounting cash flows
require calculating the correct discount rate (aka cost of capital or Weighted
Average Cost of Capital (WACC))
Cost of Debt (kd) The interest rate that the company will pay to a lender for
borrowing cash – This is referred to as the before-tax cost of debt – After-tax Cost
of Debt (kd (1-t)) – since interest expense is tax deductible, the true cost of debt
has to be adjusted by the tax shield – t = tax rate; tax shield is the benefit gained
from a lower tax bill due to interest expense
Cost of Preferred (Kps) Company’s dividend % rate upon issuance of new
preferred stock – Kps = Dps / Pnet – Dps = preferred dividends per share –
Pnet= issuing preferred price per share
Cost of Equity Returns that new equity investors require upon purchase of a
company’s stock In order to calculate cost of equity, use the CAPM model
CAPM = Rf + β x (RM – Rf) – Rf = risk-free rate (10, 20 or 30 year treasury notes) –

MBA IN A BOOK
114
RM = market rate (Expected return of the market portfolio) – β = Sensitivity of the
stock to the market portfolio

MBA IN A BOOK
115
Part III:
Perpetuity Engineering On the build-side, our focus is the building of perpetuities and the growing and
de-risking of their cash flows (EBITDA). The primary types of perpetuities coincide
with engineering to build them. These include:
1. Mechanical engineering
2. Knowledge engineering
3. Content engineering
4. Platform engineering
Perpetuity engineering concerns ourself with the actual science associated with
the perpetuity.

MBA IN A BOOK
116
Chapter 22: Mechanical Engineering
Within a given perpetuity, there will be various machines necessary to automate the work of the perpetuity. Herein lies the work of mechanical engineering.

MBA IN A BOOK
117
Chapter 23: Knowledge Engineering
In a knowledge and service economy, knowledge needs to be engineered.

MBA IN A BOOK
118
Chapter 24: Content Engineering
In addition to knowledge, there is content that can be paramount to building a perpetuity.

MBA IN A BOOK
119
Chapter 25: Platform Engineering
In the age of the computer, a perpetuity can be an application or system on a computer. We can this type of perpetuity a platform.

MBA IN A BOOK
120
Part III:
Perpetuity Management On the build-side, we are ultimately concerned with the creation and management of perpetuities. We first explore the perpetuity analysis, perpetuity building process/timeline (including sources and uses) and then move towards a methodology for perpetuity management.

MBA IN A BOOK
121
Chapter 17: How to Be a CEO? The CEO’s role is to bring the company/opportunity through the stages of the perpetuity by building recurring benefit streams (i.e. cash flows) and at the same time de-risking those benefit streams. In doing so, the valuation of the perpetuity moves from backward looking towards forward looking and the valuation is thus maximized (based upon a multiple of future earnings). The CEO should thus be familiar with perpetuity science and the phases of the perpetuity. As the perpetuity changes, the formula for valuing the perpetuity changes as well. There are five phases of perpetuity building. As we move through the phases, the role of the owner of the perpetuity becomes more passive and the valuation becomes larger due to size of EBITDA increasing, EBITDA multiple increasing, and the discount rate decreasing. The perpetuity becomes less dependent on the owner to exist and run as an organizational structure is formed coinciding with the division of labor, processes are automated, and revenue becomes recurring. Phases of the Perpetuity: I. Syndication (Getting to PMT) II. Job Shop (From PMT1 to PMT2, PMT3, etc) III. Perpetuity (From PMTi to CF/r) IV. Growing Perpetuity (From CF/r to CF/r– g) V. Diversified (Perpetuity 1 + Perpetuity 2)
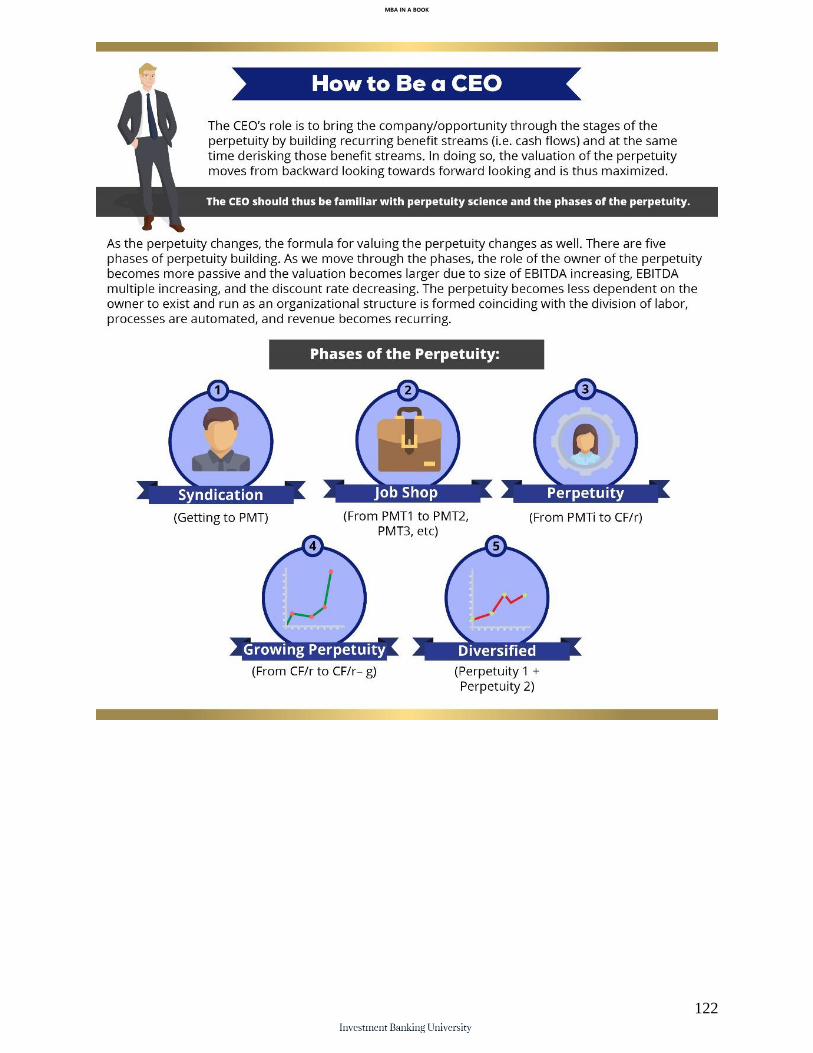
MBA IN A BOOK
122

MBA IN A BOOK
123
Chapter 18: How to Be a Consultant? The consultant’s role is to aid in the building, selling, or buying of a perpetuity. Since the consultant’s value is in relation to the perpetuity, the consultant’s core methodology/body of knowledge is Perpetuity Science. Perpetuity Science is the set of methodologies related to building, selling, and buying of perpetuities which is referred to as the build-side, sell-side, and buy-side respectively. The key questions related to each side of the perpetuity are:
The consultant uses methodologies related to each one of these key questions which serve as the basis for a consulting engagement:
1. Build-Side: How to move a company/opportunity to the next stage of the perpetuity building process? The methodology for the phases of a perpetuity is the following:
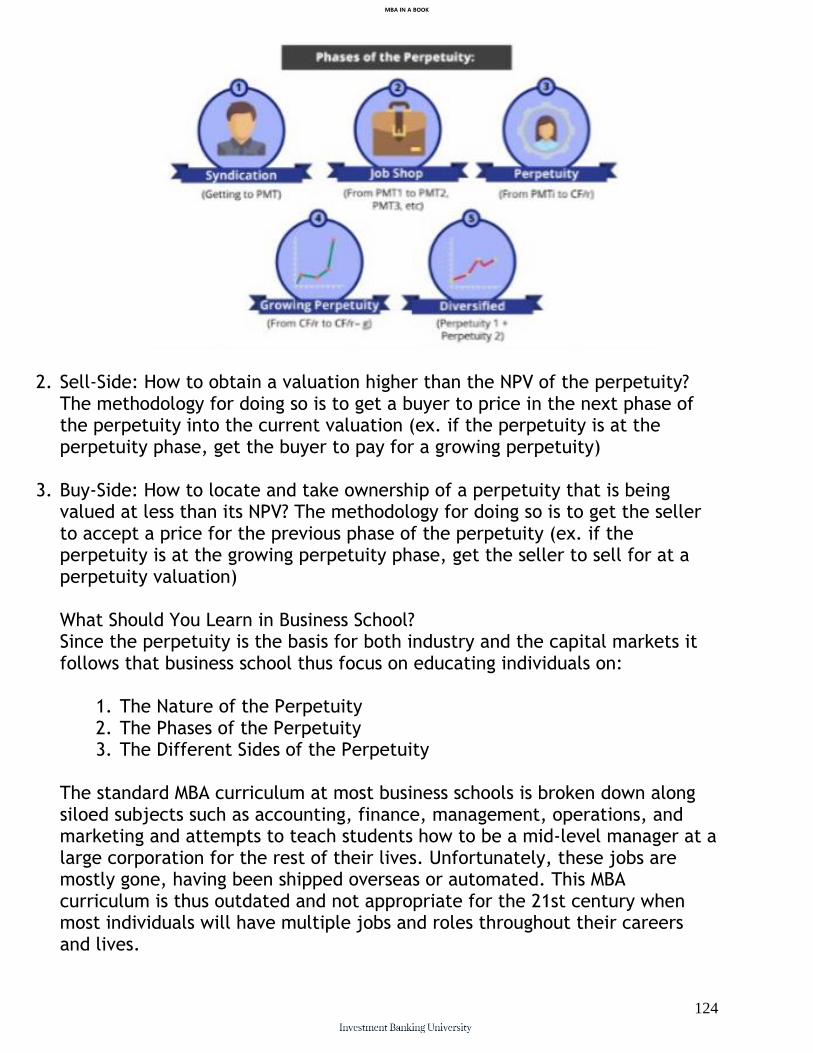
MBA IN A BOOK
124
2. Sell-Side: How to obtain a valuation higher than the NPV of the perpetuity? The methodology for doing so is to get a buyer to price in the next phase of the perpetuity into the current valuation (ex. if the perpetuity is at the perpetuity phase, get the buyer to pay for a growing perpetuity)
3. Buy-Side: How to locate and take ownership of a perpetuity that is being valued at less than its NPV? The methodology for doing so is to get the seller to accept a price for the previous phase of the perpetuity (ex. if the perpetuity is at the growing perpetuity phase, get the seller to sell for at a perpetuity valuation) What Should You Learn in Business School? Since the perpetuity is the basis for both industry and the capital markets it follows that business school thus focus on educating individuals on:
1. The Nature of the Perpetuity 2. The Phases of the Perpetuity 3. The Different Sides of the Perpetuity
The standard MBA curriculum at most business schools is broken down along siloed subjects such as accounting, finance, management, operations, and marketing and attempts to teach students how to be a mid-level manager at a large corporation for the rest of their lives. Unfortunately, these jobs are mostly gone, having been shipped overseas or automated. This MBA curriculum is thus outdated and not appropriate for the 21st century when most individuals will have multiple jobs and roles throughout their careers and lives.
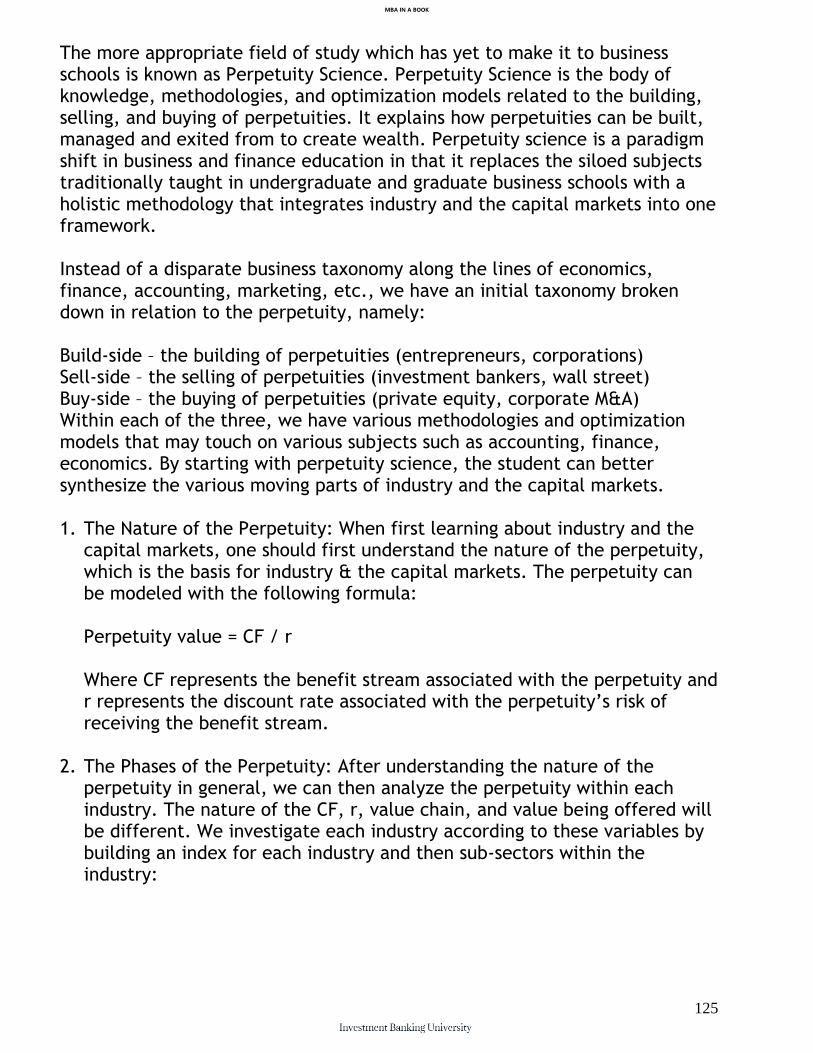
MBA IN A BOOK
125
The more appropriate field of study which has yet to make it to business schools is known as Perpetuity Science. Perpetuity Science is the body of knowledge, methodologies, and optimization models related to the building, selling, and buying of perpetuities. It explains how perpetuities can be built, managed and exited from to create wealth. Perpetuity science is a paradigm shift in business and finance education in that it replaces the siloed subjects traditionally taught in undergraduate and graduate business schools with a holistic methodology that integrates industry and the capital markets into one framework. Instead of a disparate business taxonomy along the lines of economics, finance, accounting, marketing, etc., we have an initial taxonomy broken down in relation to the perpetuity, namely: Build-side – the building of perpetuities (entrepreneurs, corporations) Sell-side – the selling of perpetuities (investment bankers, wall street) Buy-side – the buying of perpetuities (private equity, corporate M&A) Within each of the three, we have various methodologies and optimization models that may touch on various subjects such as accounting, finance, economics. By starting with perpetuity science, the student can better synthesize the various moving parts of industry and the capital markets. 1. The Nature of the Perpetuity: When first learning about industry and the
capital markets, one should first understand the nature of the perpetuity, which is the basis for industry & the capital markets. The perpetuity can be modeled with the following formula:
Perpetuity value = CF / r Where CF represents the benefit stream associated with the perpetuity and r represents the discount rate associated with the perpetuity’s risk of receiving the benefit stream.
2. The Phases of the Perpetuity: After understanding the nature of the
perpetuity in general, we can then analyze the perpetuity within each industry. The nature of the CF, r, value chain, and value being offered will be different. We investigate each industry according to these variables by building an index for each industry and then sub-sectors within the industry:
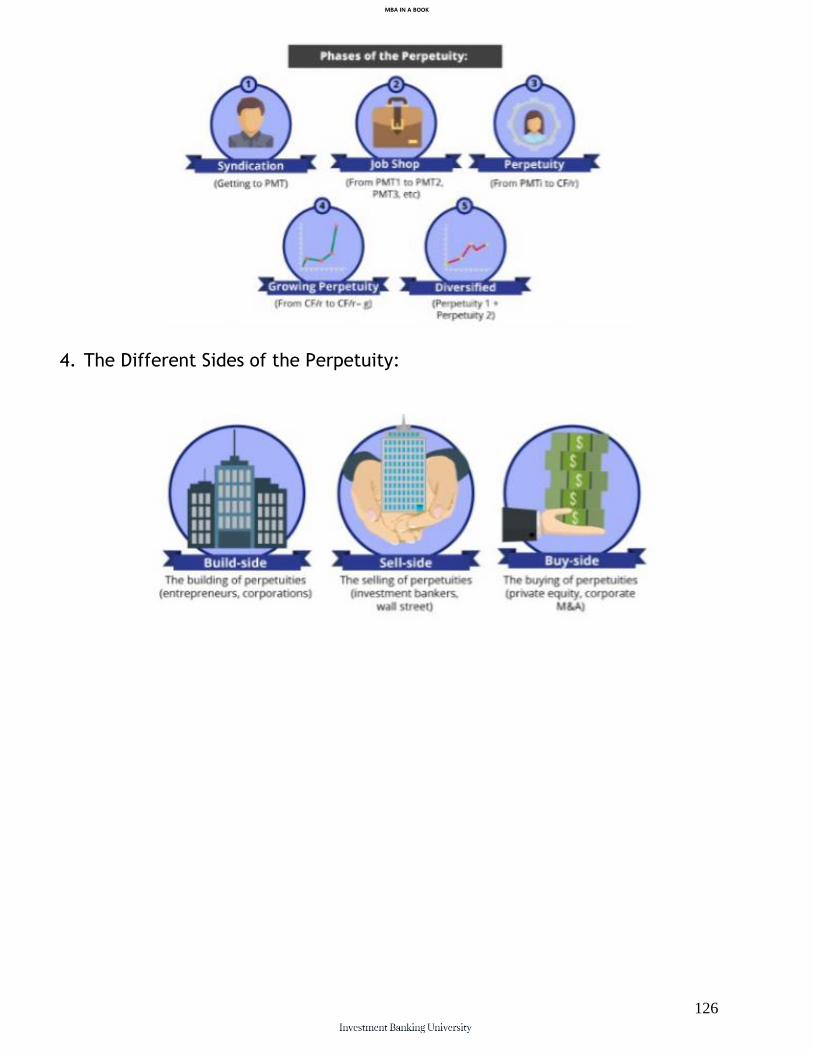
MBA IN A BOOK
126
4. The Different Sides of the Perpetuity:

MBA IN A BOOK
127
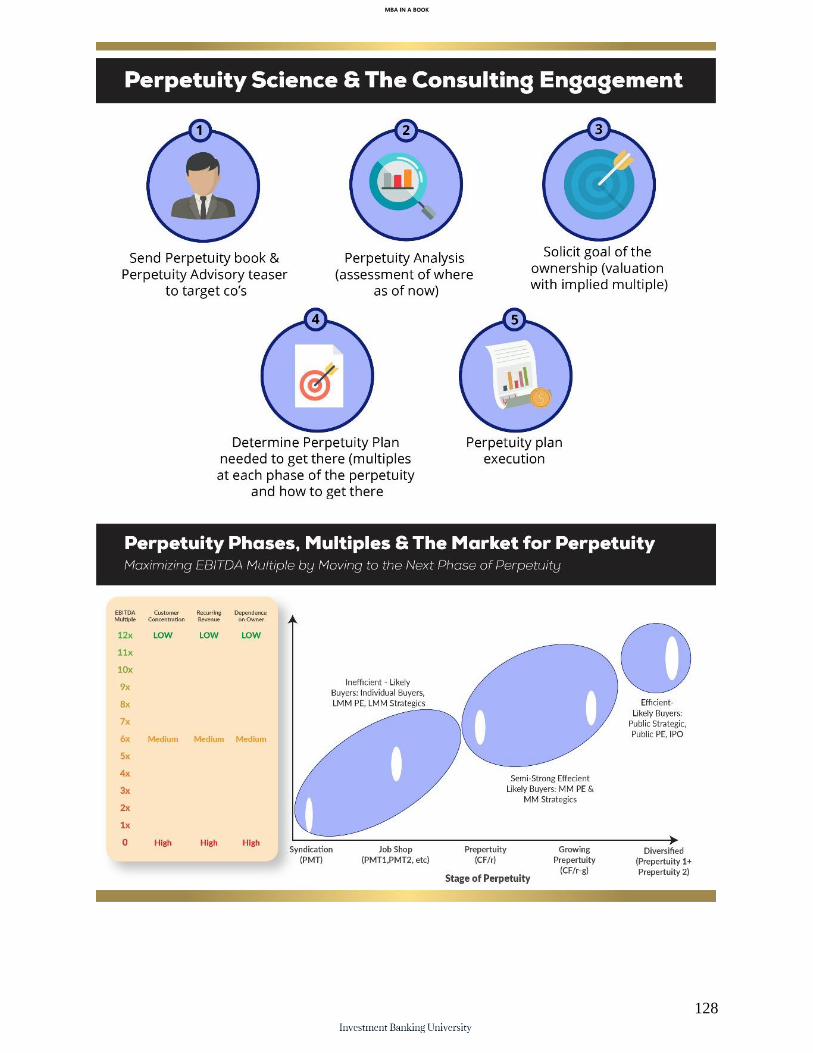
MBA IN A BOOK
128
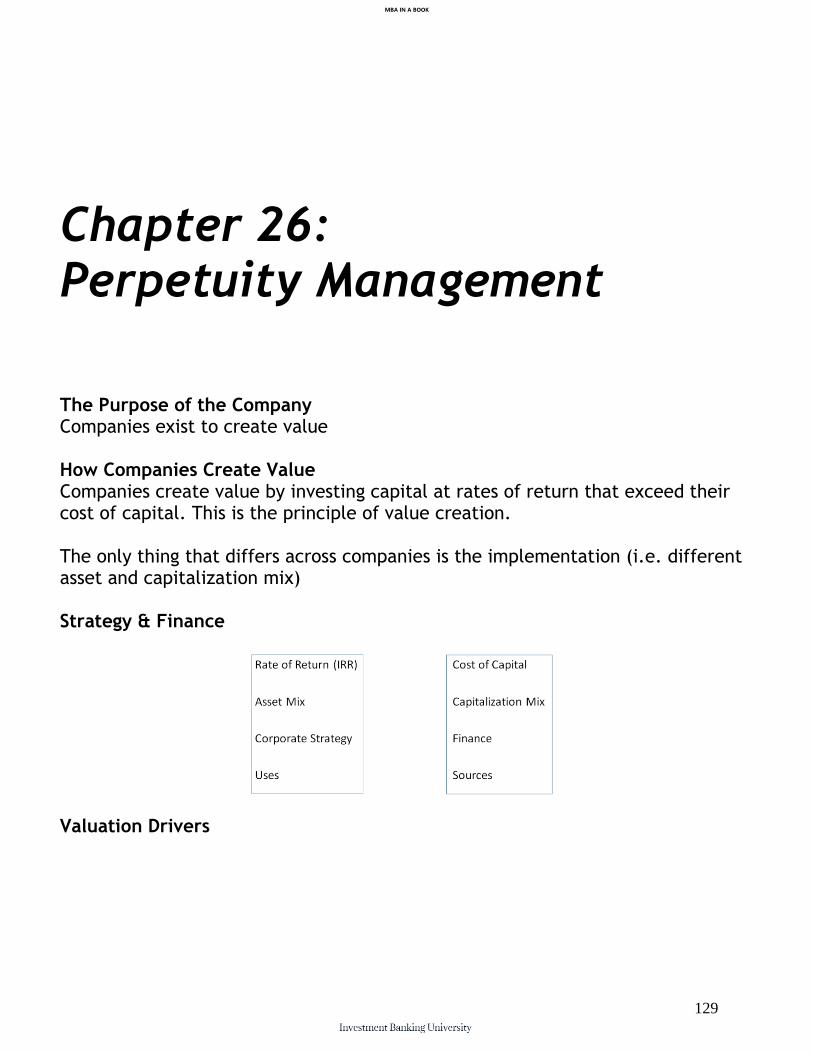
MBA IN A BOOK
129
Chapter 26: Perpetuity Management
The Purpose of the Company Companies exist to create value How Companies Create Value Companies create value by investing capital at rates of return that exceed their cost of capital. This is the principle of value creation. The only thing that differs across companies is the implementation (i.e. different asset and capitalization mix) Strategy & Finance
Valuation Drivers
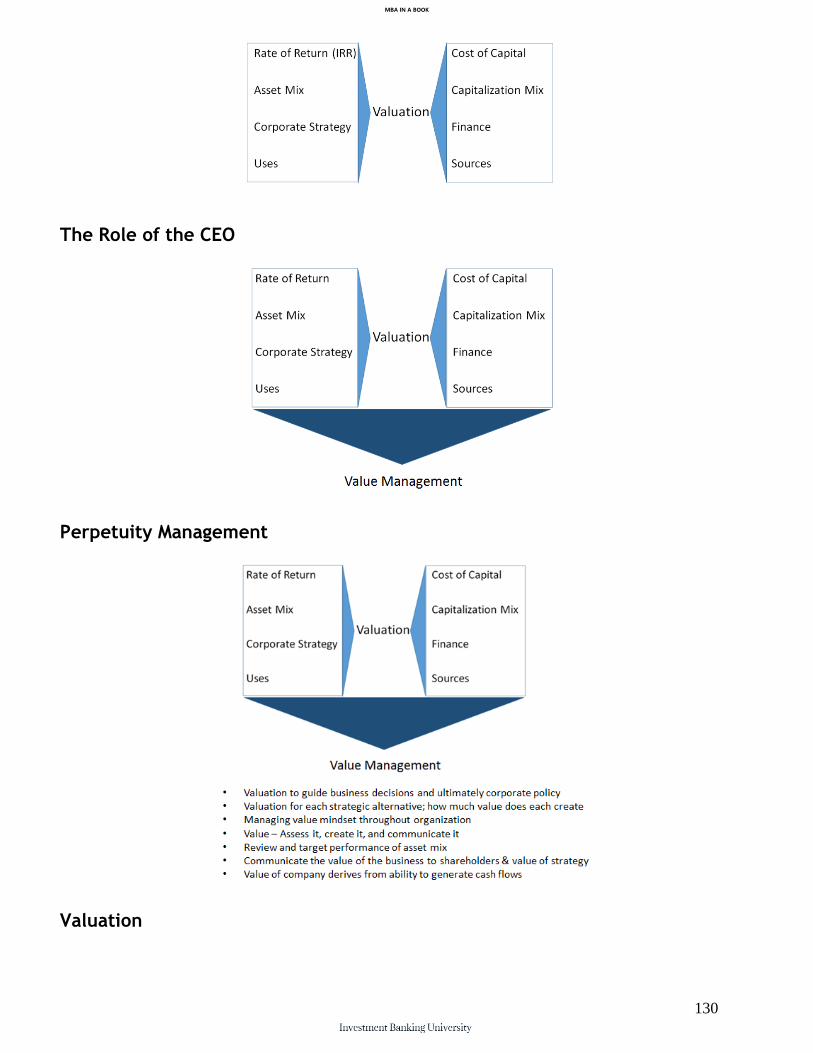
MBA IN A BOOK
130
The Role of the CEO
Perpetuity Management
Valuation
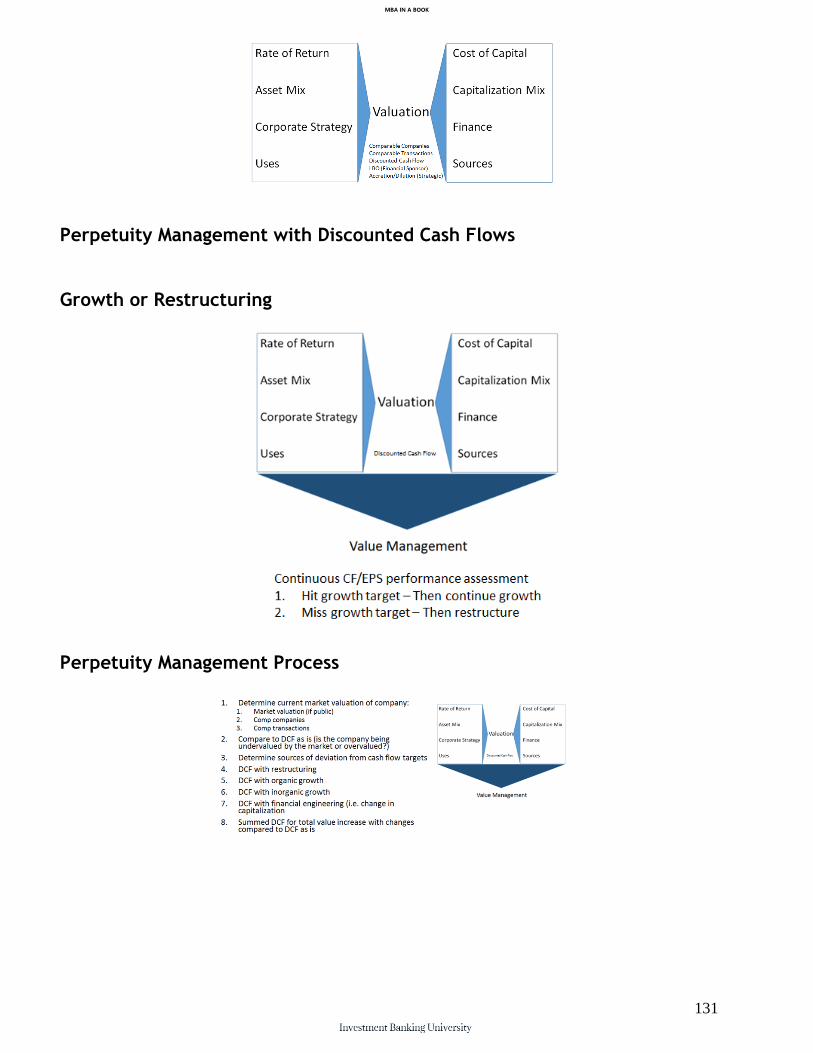
MBA IN A BOOK
131
Perpetuity Management with Discounted Cash Flows Growth or Restructuring
Perpetuity Management Process
MBA IN A BOOK
132
Measuring Value Added: ROIC vs. Market Return Measure return on invested capital (after-tax operating profits divided by capital invested in working capital, PP&E) and compare it with stock market returns Measuring Value Added: Economic Profit & NPV Economic profit = ROIC spread % over cost of capital x invested capital The objective is to maximize economic profit. When the company is larger, one should use Net Present Value (NPV) which calculates economic profit in a more robust and flexible fashion. Valuation in the Public Markets Valuation in the public markets has investors paying for the performance they expect the company to achieve in the future; investors ultimately end up paying more since their valuations are not based upon the past or cost of the assets. The CEO should endeavor to have his company in the public markets since the largest multiples are applied in valuation Real Markets & Financial Markets When a public company, the CEO has to both maximize the intrinsic (DCF) value of the company and manage the expectations of the financial market Differences between actual performance and market expectations and changes in these expectations drive share prices. The delivery of surprises produces higher or lower total shareholder returns Perpetuity Planning & Control (i.e. Management) Planning & control system should be put in place to monitor the NPV of every business unit and summed to get the NPV of the corporation. Economic profit (i.e. NPV) targets set annually for next three years, progress monitored monthly and managers’ compensation tied to economic profit against these targets Value Metrics Metrics are to drive decisions and guide all employees toward value creation. Perpetuity Planning & Control (i.e. Management) in Practice
MBA IN A BOOK
133
Corporate management sets long-term value creation targets in terms of market value of a company or total returns to shareholders (TRS) Strategic alternatives valued in DCF (i.e. NPV) Intrinsic value of chosen strategic alternative translated into short and medium term financial targets and then targets for operating and strategic value drivers Performance assessed by comparing results with targets on both financial indicators and key value drivers. Managerial rewards linked to performance on financial measures and key value drivers Value Metrics: Market Value Added & Total Return to Shareholders Market Value Added is the difference between the market value of a company’s debt and equity and the amount of capital invested. Measures financial market’s view of future performance relative to capital invested in business. Total Return to Shareholders measure performance against the expectations of financial markets and changes in these expectations. TRS measures how well a company betas the target set by market expectations Value Metrics: DCF vs. Earnings Multiple DCF is intrinsic value. Earnings multiples are market values. Earnings alone is inadequate without understanding the investment required to generate the earnings. Should know ROIC Cash Flow Cash flow equals the operating profits of the company less the net investment in working capital and fixed assets to support the company’s growth. Perpetuity Management Capability
1. Analyze where perpetuity is currently at (which phase) 2. Determine which phase is the goal 3. Determine steps to get to next phase of the perpetuity 4. Build Work Breakdown Structure (WBS) to get to next phase working
backward from the next phase 5. Execute the plan
Perpetuity Lifecycle:
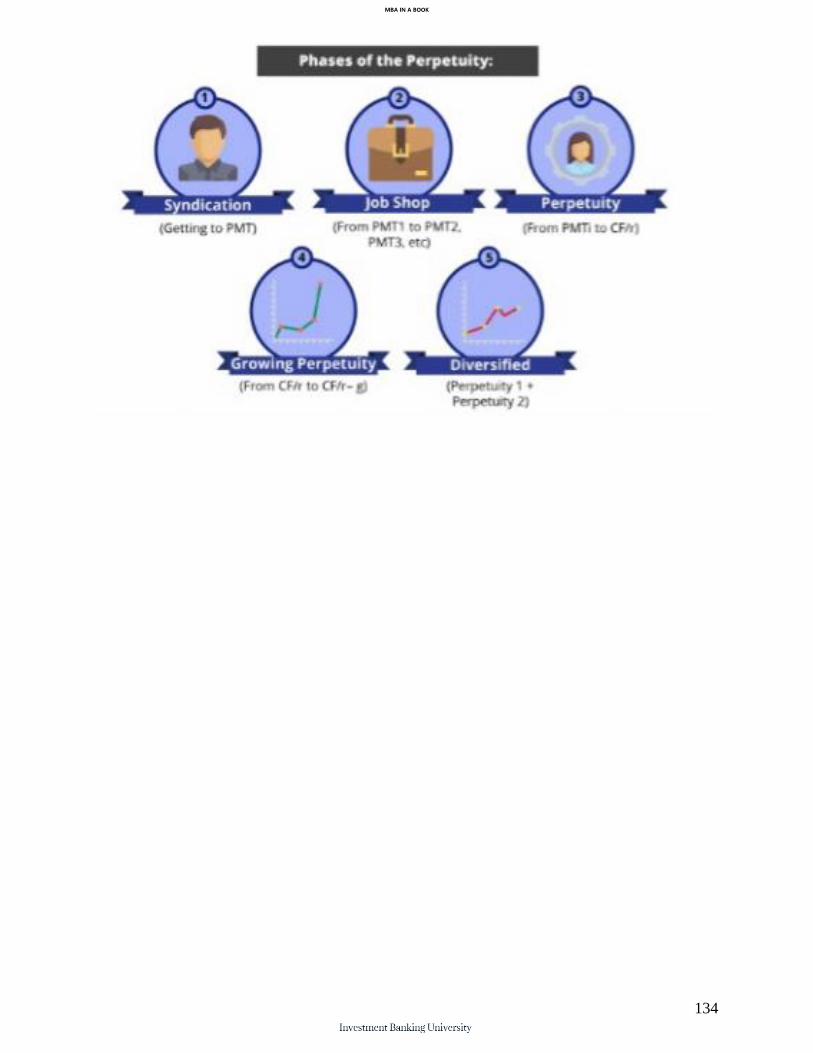
MBA IN A BOOK
134

MBA IN A BOOK
135
Chapter 27: The Market for Perpetuities
The market for the perpetuity at its initial stages is inefficient, but as it moves through the stages of a perpetuity, the market becomes more efficient. You can observe the coinciding cost of capital move from almost 100% going all the way down to 3.5%. You can observe the EBITDA multiple for the perpetuity increasing as the perpetuity moves through the phases of the perpetuity.
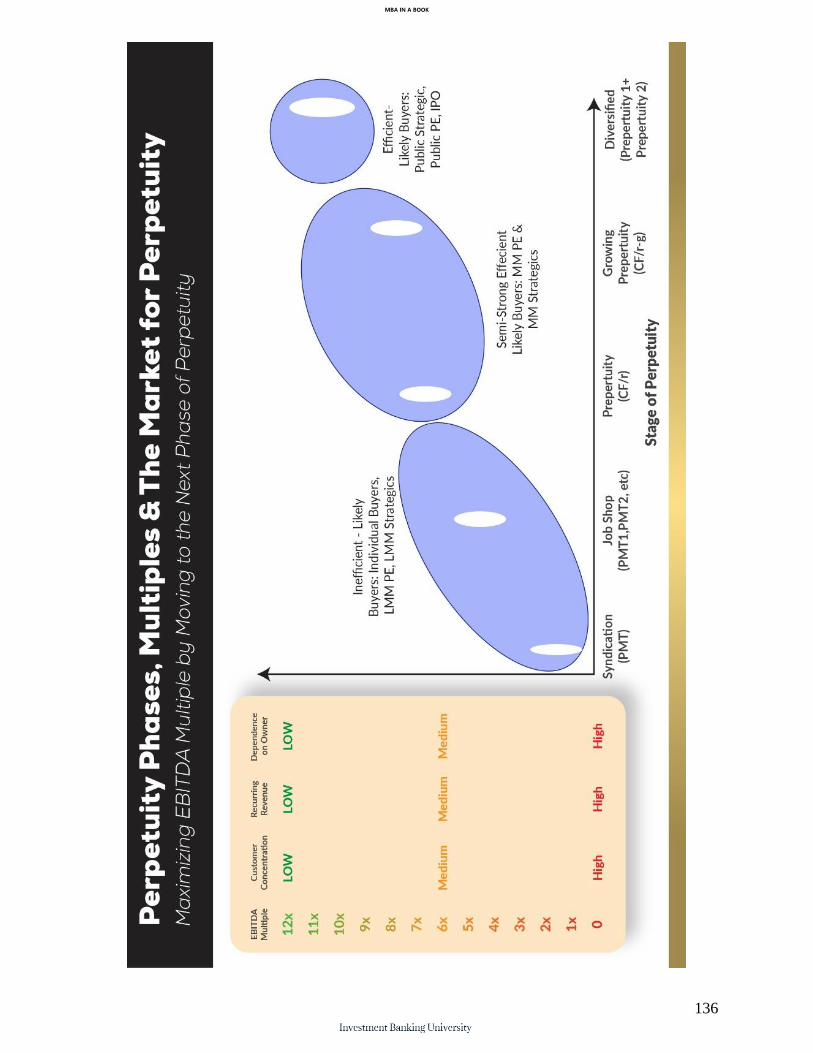
MBA IN A BOOK
136
MBA IN A BOOK
137
Chapter 28: Index Building & Benchmarking In addition to sell side and buy side players building and maintaining coverage of a given vertical and sub-vertical, the build-side should have an index for their vertical and sub-vertical. Within this index, it should benchmark against the comps within the index to establish its strategy.
MBA IN A BOOK
138
Chapter 29: Financial Data Sources In order to build and maintain and index of public companies, it is going to be necessary to utilize a source of financial data. For established companies, this means using FactSet, CapitalIQ, or Bloomberg. For smaller companies, this could mean using Yahoo Finance or Google Finance.

MBA IN A BOOK
139
SELL-SIDE
As perpetuities continue to grow, the builder of the perpetuity seeks to grow the perpetuity inorganically or exit the perpetuity. This is the primary role of the sell-side, which is to aid in the buying and selling of perpetuities. Investment bankers now enter the picture as this is their core work.
MBA IN A BOOK
140
Part I:
How to Sell a Perpetuity?
On the sell side, the primary responsibility of the investment banker is to aid those owning perpetuities in analyzing their strategic alternatives related to inorganic growth or exit. Which phase is the perpetuity in? (SMB, LMM, MM, UMM, L) Which buyers are likely interested in the perpetuity? (Individual, Financial, Strategic, Special Situation) Each of these buyers have a different valuation range Individual – Desire 30% to 40% IRR, 3x EBITDA Financial – 4x to 7x EBITDA
MBA IN A BOOK
141
Strategic – 5x to 10x EBITDA Valuation is a range Determine valuation method (DCF, comp companies, precedent transactions) Calculate benefit stream (synergistic vs. owner benefit) Determine required rate of return given the phase of the perpetuity and the buyer (discount rate) Convert benefit stream into present value at the discount rate Sensitize the variables for a range of values to see effect on valuation (sensitivity table) Strategics and financials establish their filter criteria (hurdle IRRs for financial and minimum EPS increase for strategics) and test targets against this filter Strategics have a range of values with standalone value as the lower end and valuation with all synergies on the higher end. A deal happens usually in the middle
MBA IN A BOOK
142
Chapter 30:
Investment Banking
Since M&A (Mergers & Acquisitions) is the core product of investment banking, discussions around investment banking typically relate to M&A. M&A is the selling of a perpetuity in the form of a corporation to either a financial or strategic buyer. Financial and strategic buyers have what is known as investment/corporate M&A mandates which detail the size and industry of prospective targets for acquisition. The investment banker takes these mandates and matches them with targets and takes a fee for doing so. Investment bankers typically focus on one industry and provide what is known as coverage by building an index of public companies and tracking changes in targets relative to the index in terms of:
MBA IN A BOOK
143
Revenue EBITDA Multiples The investment banker monitors trends in these variables and determines the optimal time to sell (when multiples are strong) or acquire (when multiples are weak) and advises target management accordingly. When a target agrees to sell via an investment banker, this relationship is known as a sell-side mandate and an M&A process will be led by the investment banker. During the M&A process, there are definite steps and deliverables including a teaser, CIM, and management presentation. The M&A process can include many prospective buyers (broad auction) or few prospective buyers (targeted or negotiated sale). The investment banking core product is M&A. As such, the investment banker’s role is to aid in the growth of perpetuities via an inorganic strategy (merger, acquisition).
The real work of M&A is origination, matching and deal-structuring. Financial modeling and valuation is merely for decision support and deals often get done simply based upon precedent transactions analysis. Thus, the priority of the investment bankers is to obtain a base level understanding of financial modeling & valuation but then to immediately start originating sell side and buy side mandates. Investment bankers explore strategic alternatives (value creation opportunities) with corporation’s CEO’s/owners. Notes: Valuation Football Field and the Midpoint is the final valuation of the company. Calculate NPV and IRR to the sponsor in LBO or EPS Change and Balance Sheet Effects in Merger Compare NPV and IRR OR compare EPS change and BS effects to other strategic alternatives and choose the highest return/EPS alternative Ultimately, as an investment banker, you are to: Use valuation methodologies to determine valuation ranges of each strategic alternative and see if capital sources match uses. IBankers should provide the client with tight ranges on valuation. Use an operating model of the target (and acquirer if strategic) and then tailor it to the specific client:
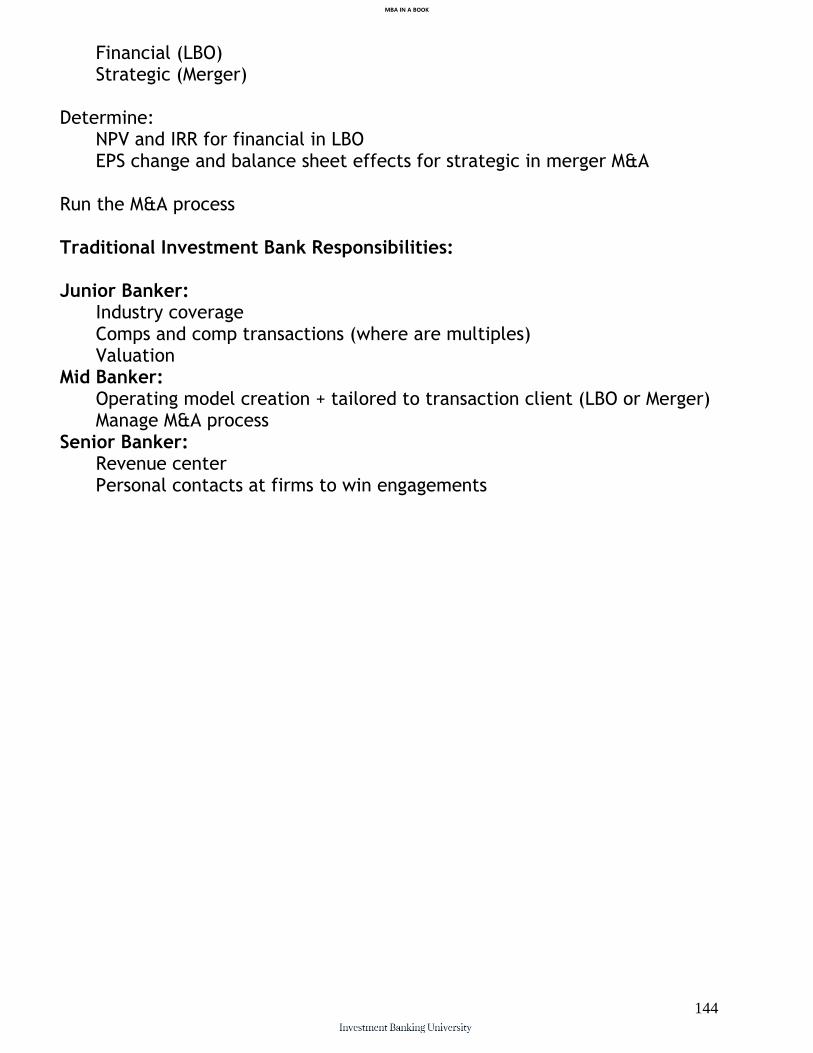
MBA IN A BOOK
144
Financial (LBO) Strategic (Merger)
Determine:
NPV and IRR for financial in LBO EPS change and balance sheet effects for strategic in merger M&A
Run the M&A process Traditional Investment Bank Responsibilities: Junior Banker:
Industry coverage Comps and comp transactions (where are multiples) Valuation
Mid Banker: Operating model creation + tailored to transaction client (LBO or Merger) Manage M&A process
Senior Banker: Revenue center Personal contacts at firms to win engagements
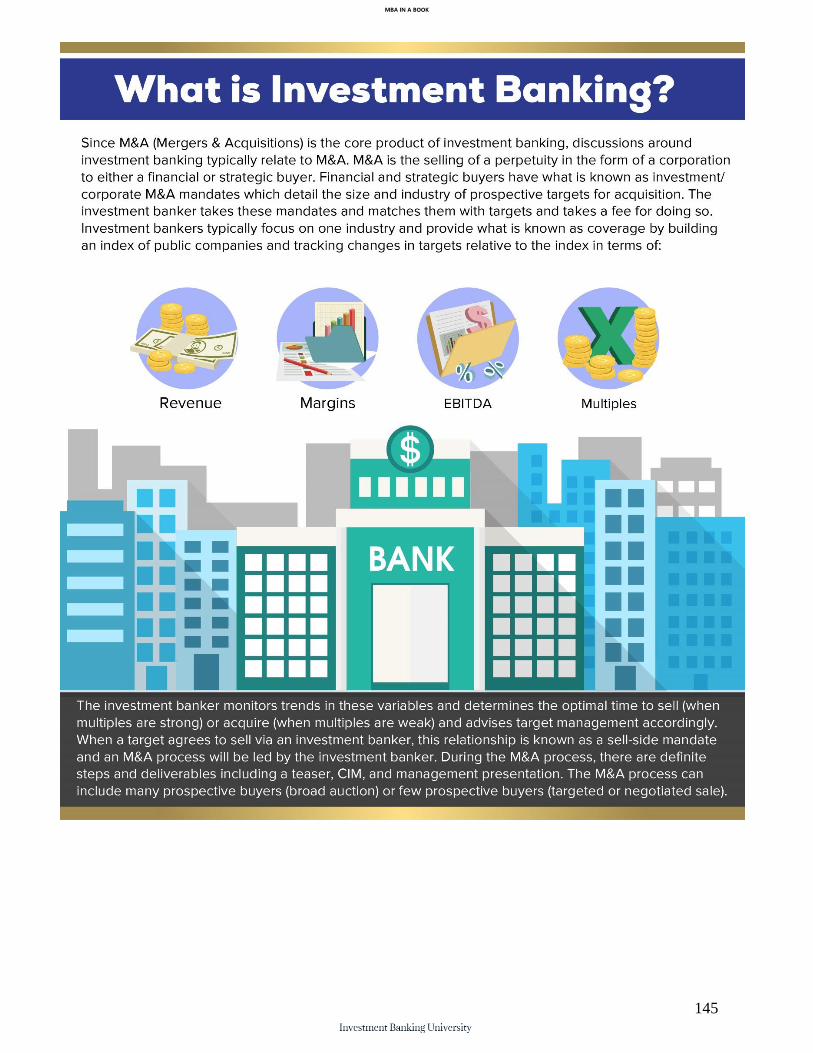
MBA IN A BOOK
145
MBA IN A BOOK
146
Chapter 31:
How to Build a Middle Market M&A Practice Methodology
In order to build a middle market M&A practice, one must fulfill the two parts of investment banking; coverage & origination and running the M&A process. Coverage & origination is usually reserved for the highest levels of the front office including the Managing Director of the coverage group. In building your own M&A practice, you are going to need to act as the Managing Director yourself as well as fulfill the M&A process once you land an M&A engagement. The following page shows both processes that will be running simultaneously.
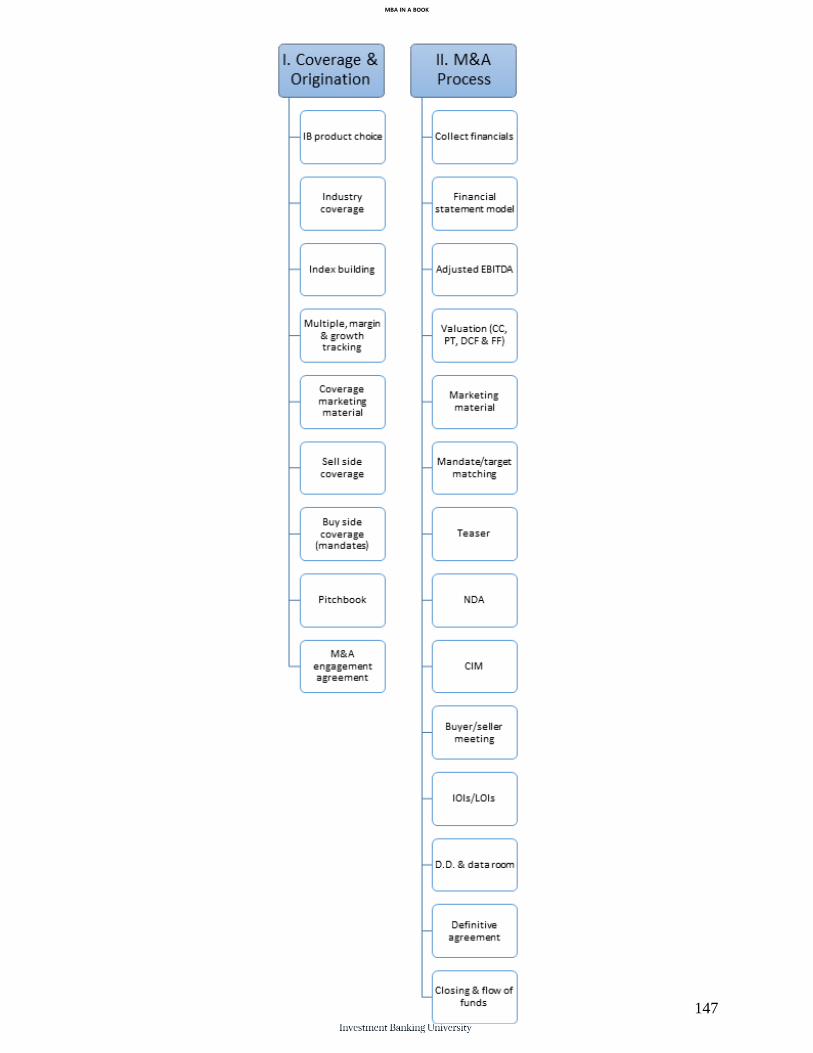
MBA IN A BOOK
147
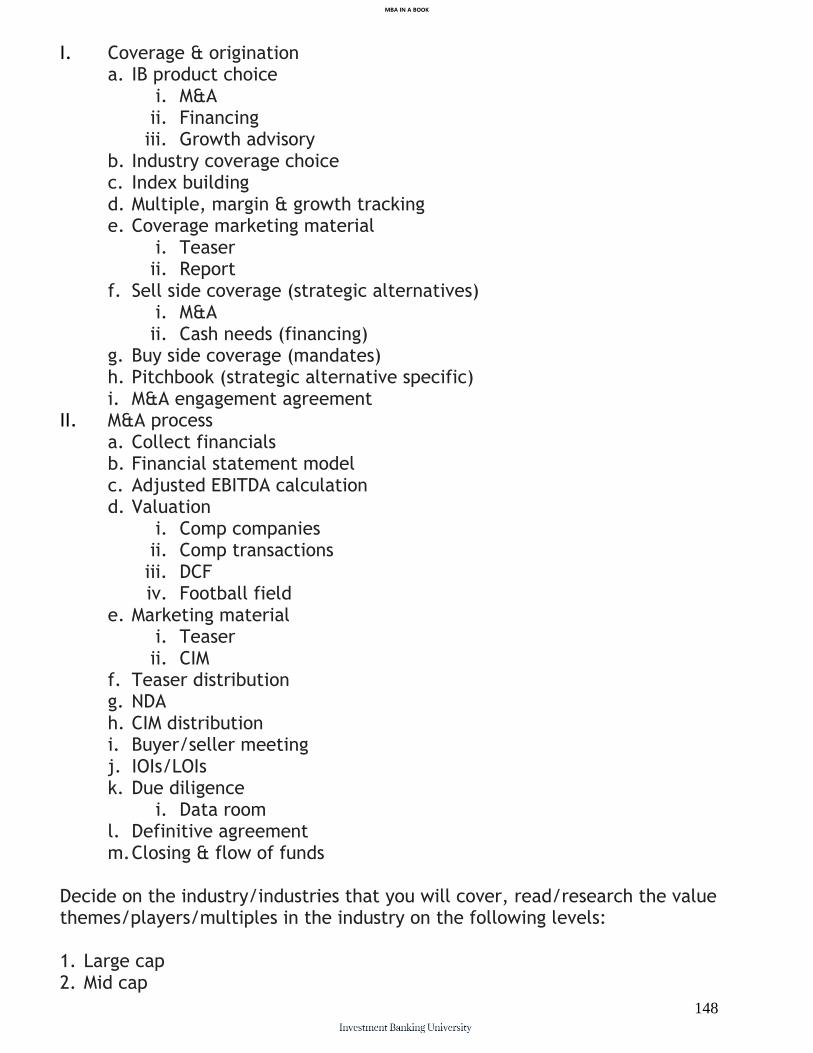
MBA IN A BOOK
148
I. Coverage & origination a. IB product choice
i. M&A ii. Financing iii. Growth advisory
b. Industry coverage choice c. Index building d. Multiple, margin & growth tracking e. Coverage marketing material
i. Teaser ii. Report
f. Sell side coverage (strategic alternatives) i. M&A ii. Cash needs (financing)
g. Buy side coverage (mandates) h. Pitchbook (strategic alternative specific) i. M&A engagement agreement
II. M&A process a. Collect financials b. Financial statement model c. Adjusted EBITDA calculation d. Valuation
i. Comp companies ii. Comp transactions iii. DCF iv. Football field
e. Marketing material i. Teaser ii. CIM
f. Teaser distribution g. NDA h. CIM distribution i. Buyer/seller meeting j. IOIs/LOIs k. Due diligence
i. Data room l. Definitive agreement m. Closing & flow of funds
Decide on the industry/industries that you will cover, read/research the value themes/players/multiples in the industry on the following levels: 1. Large cap 2. Mid cap
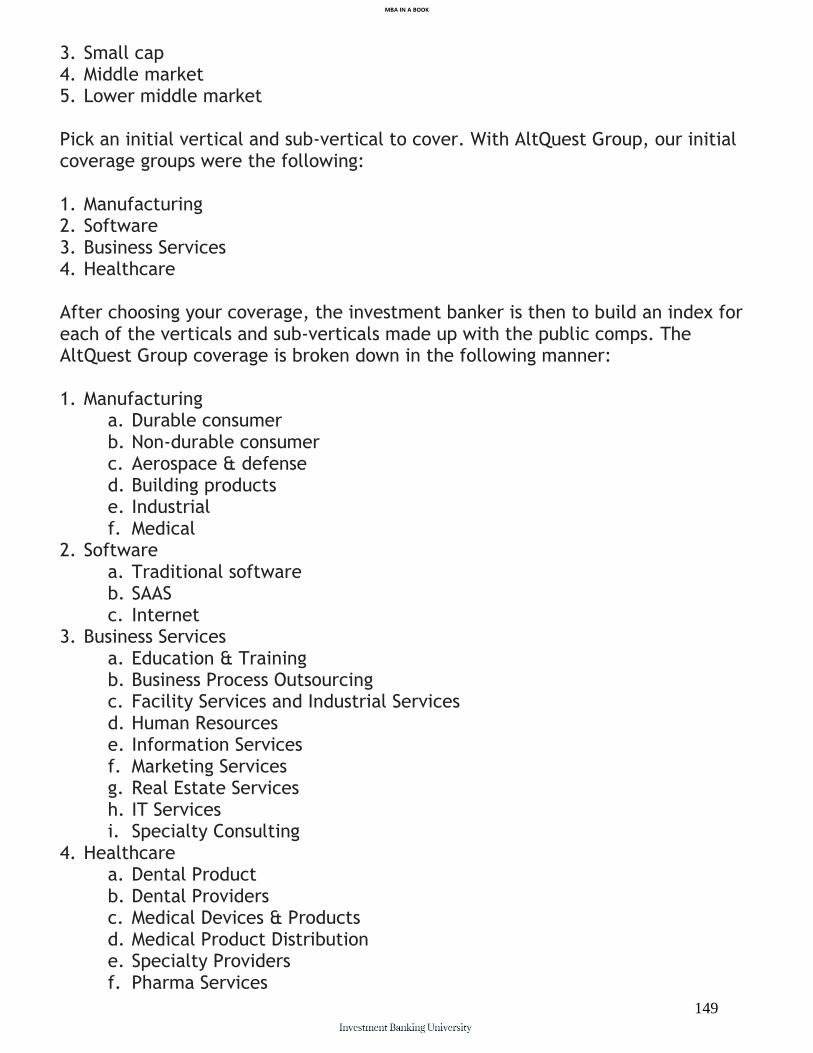
MBA IN A BOOK
149
3. Small cap 4. Middle market 5. Lower middle market Pick an initial vertical and sub-vertical to cover. With AltQuest Group, our initial coverage groups were the following: 1. Manufacturing 2. Software 3. Business Services 4. Healthcare After choosing your coverage, the investment banker is then to build an index for each of the verticals and sub-verticals made up with the public comps. The AltQuest Group coverage is broken down in the following manner: 1. Manufacturing
a. Durable consumer b. Non-durable consumer c. Aerospace & defense d. Building products e. Industrial f. Medical
2. Software a. Traditional software b. SAAS c. Internet
3. Business Services a. Education & Training b. Business Process Outsourcing c. Facility Services and Industrial Services d. Human Resources e. Information Services f. Marketing Services g. Real Estate Services h. IT Services i. Specialty Consulting
4. Healthcare a. Dental Product b. Dental Providers c. Medical Devices & Products d. Medical Product Distribution e. Specialty Providers f. Pharma Services
MBA IN A BOOK
150
g. Practice Management h. Provider Services i. Long Term & Behavioral Care
The investment banker then spreads each public comp and the financial data feeds into the median and average for the vertical and sub-vertical which ultimately ends up in the research (industry report, newsletter), pitchbooks, and CIMs of the investment bank. For investment banks with an equity research department, financial statement models will be built for each public comp that is being covered and consensus EPS data taken from research reports will be used to establish the value of the public comp. The investment banker ultimately uses the vertical index and sub-vertical index to perform proprietary research and develop industry reports and newsletters which will aid in coverage and ultimately origination. The research, which we will go into greater detail on later in the book focuses on vertical and sub-vertical trends in margins, multiples, and M&A. After establishing one's coverage and then building an index for the vertical and sub-vertical as well as establishing relationships with strategic and financial buyers within the vertical and sub-vertical, the investment banker may begin advising targets on their strategic alternatives using information gleaned from the vertical and sub-vertical indices. Regarding the vertical index and sub-vertical index, the investment banker ultimately tracks trends in: Growth rates Margins Debt to Equity Multiples The investment banker takes the index and establishes tiers which turn into peer groups. This is why we pull public comps; to benchmark a target against the comps. By comparing a target's level of performance to it's peers and the industry in general the investment banker can determine when it is ideal to exit the business (when multiples are strong) and when it is not (when multiples are weak). This is how investment bankers advise on strategic alternatives. Getting Started in Investment Banking For those just getting started in investment banking, it is preferable to start with the lower middle market and middle market building relationships with financial
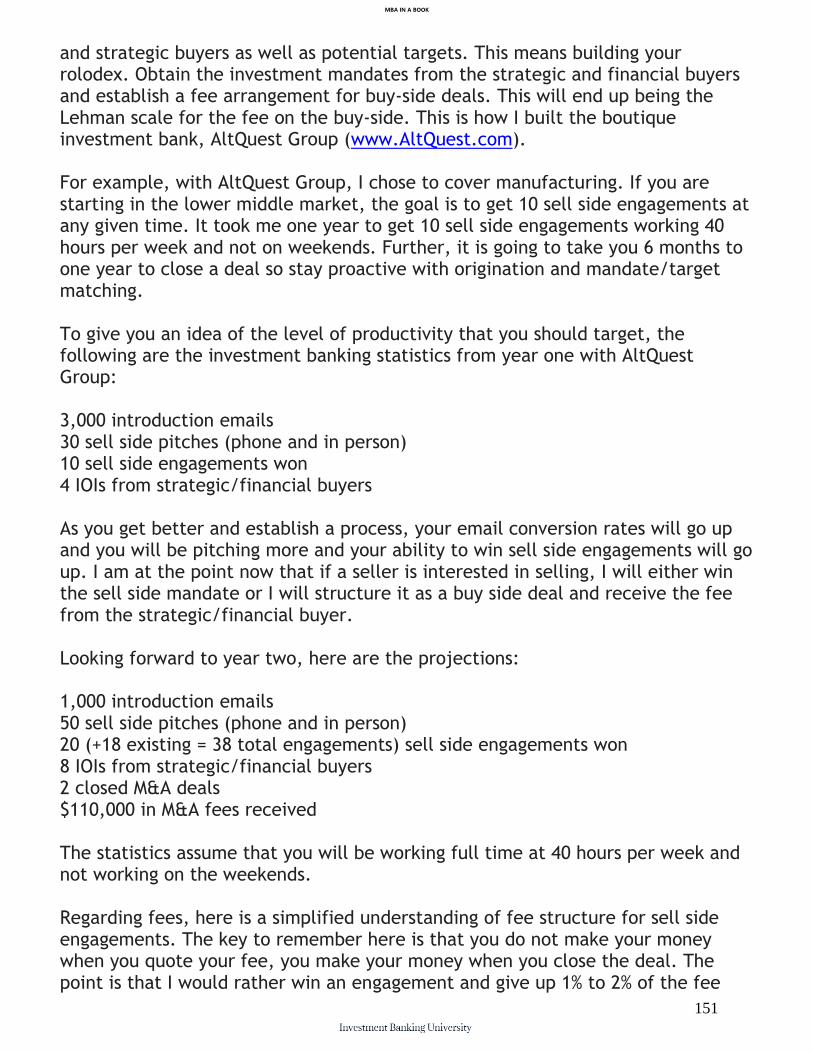
MBA IN A BOOK
151
and strategic buyers as well as potential targets. This means building your rolodex. Obtain the investment mandates from the strategic and financial buyers and establish a fee arrangement for buy-side deals. This will end up being the Lehman scale for the fee on the buy-side. This is how I built the boutique investment bank, AltQuest Group (www.AltQuest.com). For example, with AltQuest Group, I chose to cover manufacturing. If you are starting in the lower middle market, the goal is to get 10 sell side engagements at any given time. It took me one year to get 10 sell side engagements working 40 hours per week and not on weekends. Further, it is going to take you 6 months to one year to close a deal so stay proactive with origination and mandate/target matching. To give you an idea of the level of productivity that you should target, the following are the investment banking statistics from year one with AltQuest Group: 3,000 introduction emails 30 sell side pitches (phone and in person) 10 sell side engagements won 4 IOIs from strategic/financial buyers As you get better and establish a process, your email conversion rates will go up and you will be pitching more and your ability to win sell side engagements will go up. I am at the point now that if a seller is interested in selling, I will either win the sell side mandate or I will structure it as a buy side deal and receive the fee from the strategic/financial buyer. Looking forward to year two, here are the projections: 1,000 introduction emails 50 sell side pitches (phone and in person) 20 (+18 existing = 38 total engagements) sell side engagements won 8 IOIs from strategic/financial buyers 2 closed M&A deals $110,000 in M&A fees received The statistics assume that you will be working full time at 40 hours per week and not working on the weekends.
Regarding fees, here is a simplified understanding of fee structure for sell side engagements. The key to remember here is that you do not make your money when you quote your fee, you make your money when you close the deal. The point is that I would rather win an engagement and give up 1% to 2% of the fee

MBA IN A BOOK
152
than have the seller think that I am not being fair. The Lehman scale simplifies this a bit but often times the seller will want to know the exact % that they will be paying you. Large cap – Lehman scale Mid cap – Lehman scale Small cap – Lehman scale Middle market – Double Lehman structure Lower middle market – 3% to 10%
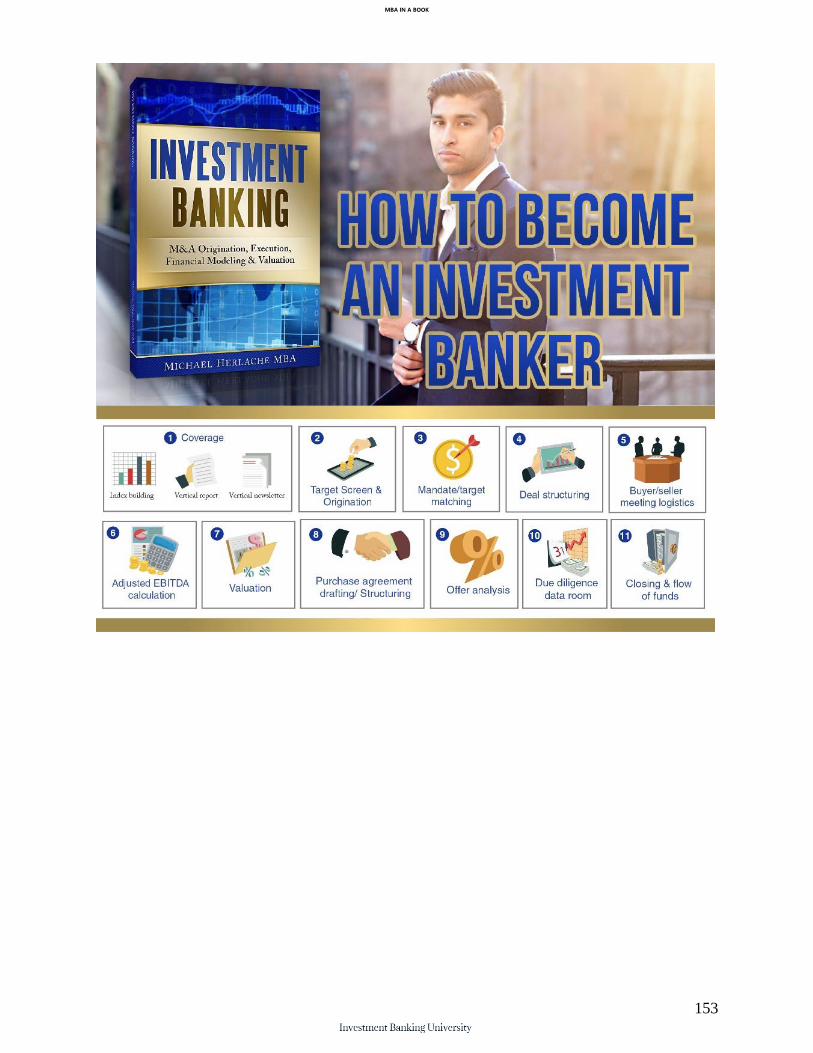
MBA IN A BOOK
153

MBA IN A BOOK
154
Part II:
The Middle Market The majority of perpetuities are in what is known as the middle market, a classification for mid-sized perpetuities. This is where the majority of the transactions occur and where the average investment banker will make his living.
MBA IN A BOOK
155
Chapter 32:
Middle Market Breakdown Because of the wide range of company sizes within the definition, the middle market can be further broken down into the following: Overview of Middle Market Pitchbook defines the middle market as companies with total enterprise value between $25 million and $1 billion and the “core middle market” as between $100 million and $500 million. Lower Middle Market: $5 - $50 million of revenue; Companies with EBITDA below about $10 million (lower middle market) are typically family or entrepreneur owned and individual customer wins and losses greatly impact performance. Many of those sales relationships are concentrated in the family, and senior management ranks are often populated with family members. Middle Market: $50 - $500 million of revenue; and We define the core middle market as companies with $10 to $75 million of EBITDA. Upper Middle Market: $500 million - $1 billion of revenue. Upper middle market companies typically have $75 million of EBITDA or more, and are often publicly held or sponsor backed.

MBA IN A BOOK
156
Chapter 33:
Buyer Profile: Individuals & Search Funds Individuals and search funds like to be in the 3x to 4x range. Be sure to qualify these individuals ahead of time. You realistically only want financials and strategics talking to the seller for deals with approx $1M of EBITDA up. Deals south of $1M EBITDA, you start to get into the individual buyer range of reasonability. Qualify individual buyers to make sure you are talking with PE and strategics for deals approx. $500k EBITDA up. Individuals and PE search funds should be looking at smaller deals where their multiple expectations of 3x to 4x are in line with the size of the company. On solid perpetuity deals, the seller is willing to wait for a strategic buyer even if it takes a longer time period. Individual buyers are looking for companies that they can run passively and work on growing the business instead of working in the business doing the manufacturing, building the product etc. They do not want to be operators in addition to owners. Unfortunately, their multiple expectations of 3x to 4x are very close to only qualifying them to speak with owner/operator businesses.

MBA IN A BOOK
157
Chapter 34:
Buyer Profile: Lower Middle Market Private Equity Comes in at about $1M of EBITDA and wants to be in the 5x range. Sets your buyer floor. LMM PE funds typically look at deals in the $1M to $3M of EBITDA range. An example of a LMM PE group is Prospect Partners:

MBA IN A BOOK
158
Chapter 35:
Buyer Profile: Middle Market Private Equity Minimum EBITDA of $2M for a platform to pursue a roll up in the space. 7x EBITDA up from there. An example of a middle market private equity group would be Centre Partners:
MBA IN A BOOK
159
Chapter 36:
Buyer Profile: Strategic Buyers Strategic buyers come in at ~$500k of EBITDA and provide a valuation floor of 5x EBITDA.
MBA IN A BOOK
160
Part III:
M&A Multiples It is crucial for investment bankers to understand the M&A marketplace in the middle market and particularly for the industries that they cover. In M&A, everyone goes off of multiples of adjusted EBITDA. It is important for the investment banker to have a strong understanding of multiples in the M&A marketplace in general and then in his/her sector and sub-sector. In general in the middle market, we typically see 7x - 7.5x EBITDA for companies that are larger than $25M in TEV. For companies that are smaller than $25M in TEV, we typically see 5x - 5.5x EBITDA. There are adjustments that need to be made for size and predictability of revenues as well as for certain sectors (ex. software). In the lower middle market to middle market, multiples usually are the following: 4x for <$1M EBITDA 5x for ~$1M EBITDA 6x for $1M - $2M EBITDA 7x for >$2M EBITDA This is the method that we use at AltQuest Group to quickly value companies on the back of a napkin in discussions with CEOs and owners of companies. It can help set expectations with CEOs and owners and provide a roadmap to increasing

MBA IN A BOOK
161
valuation to met a target (for example, $5M or $10M in Total Enterprise Value (TEV)). Additional services can be provided to the company to move the company through the different phases of the perpetuity in additional to M&A such as growth advisory (management consulting).
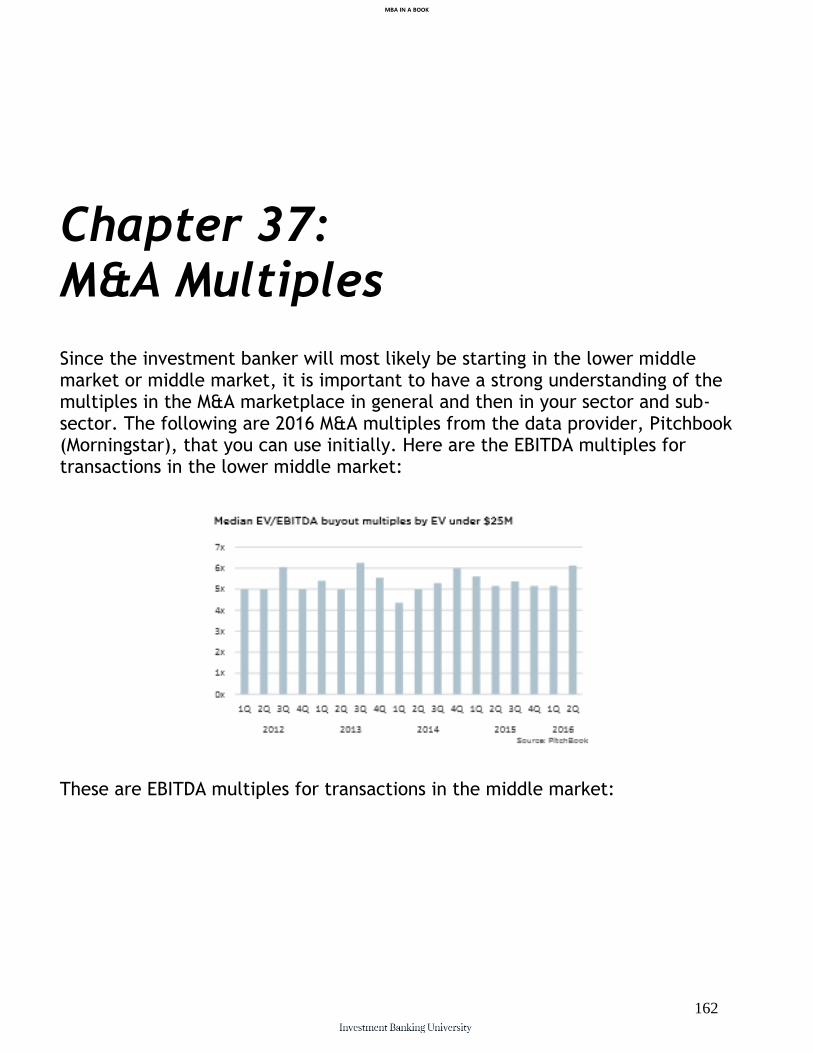
MBA IN A BOOK
162
Chapter 37:
M&A Multiples Since the investment banker will most likely be starting in the lower middle market or middle market, it is important to have a strong understanding of the multiples in the M&A marketplace in general and then in your sector and sub-sector. The following are 2016 M&A multiples from the data provider, Pitchbook (Morningstar), that you can use initially. Here are the EBITDA multiples for transactions in the lower middle market:
These are EBITDA multiples for transactions in the middle market:
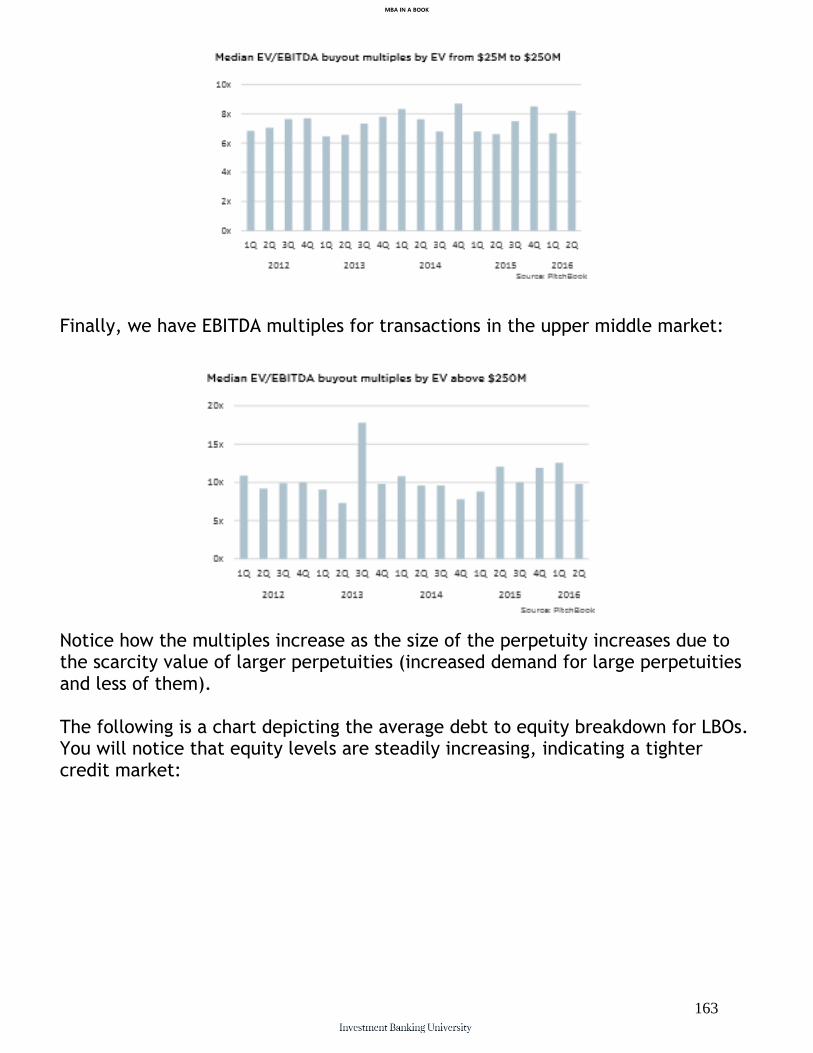
MBA IN A BOOK
163
Finally, we have EBITDA multiples for transactions in the upper middle market:
Notice how the multiples increase as the size of the perpetuity increases due to the scarcity value of larger perpetuities (increased demand for large perpetuities and less of them). The following is a chart depicting the average debt to equity breakdown for LBOs. You will notice that equity levels are steadily increasing, indicating a tighter credit market:
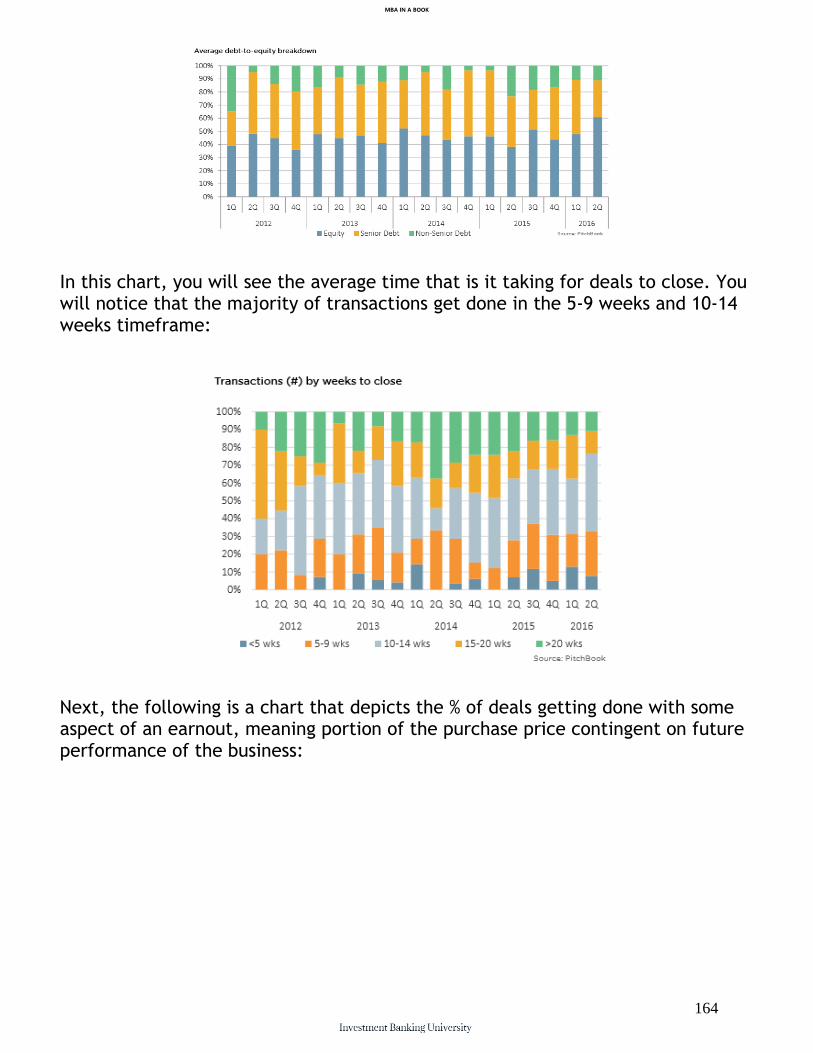
MBA IN A BOOK
164
In this chart, you will see the average time that is it taking for deals to close. You will notice that the majority of transactions get done in the 5-9 weeks and 10-14 weeks timeframe:
Next, the following is a chart that depicts the % of deals getting done with some aspect of an earnout, meaning portion of the purchase price contingent on future performance of the business:
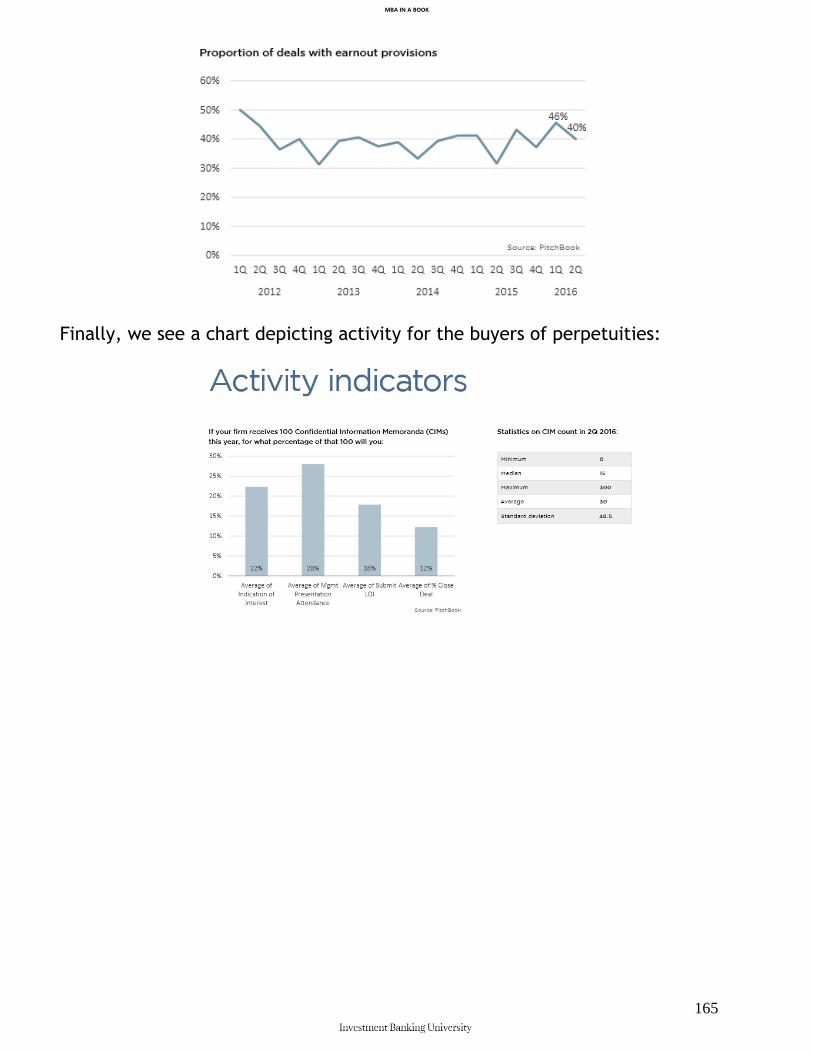
MBA IN A BOOK
165
Finally, we see a chart depicting activity for the buyers of perpetuities:

MBA IN A BOOK
166
Part IV:
Investment Banking Coverage Methodology It is crucial for investment bankers to understand the M&A marketplace in the middle market and particularly for the industries that they cover.

MBA IN A BOOK
167
Chapter 38:
Investment Banking Coverage Methodology
First, the investment banker is going to choose what size of companies he/she is going to cover (ex. public co's, middle market, lower middle market). From there, the investment banker chooses an initial vertical and sub-verticals to cover. With AltQuest Group, our initial coverage groups were the following: 1. Manufacturing 2. Software 3. Business Services 4. Healthcare After choosing your coverage, the investment banker is then to build an index for each of the verticals and sub-verticals made up with the public comps. The index and the changes in the index are going to provide a measuring stick within which to evaluate targets against. It is important for the investment banker to have a strong understanding of multiples in the M&A marketplace in general and then in his/her sector and sub-sector. In general in the middle market, we typically see 7x - 7.5x EBITDA for companies that are larger than $25M in TEV. For companies that are smaller than $25M in TEV, we typically see 5x - 5.5x EBITDA. There are adjustments that need to be made for size and predictability of revenues as well as for certain sectors (ex. software).
For those just getting started in investment banking, it is preferable to start with the lower middle market and middle market building relationships with financial and strategic buyers as well as potential targets. This means building your rolodex. Obtain the investment mandates from the strategic and financial buyers
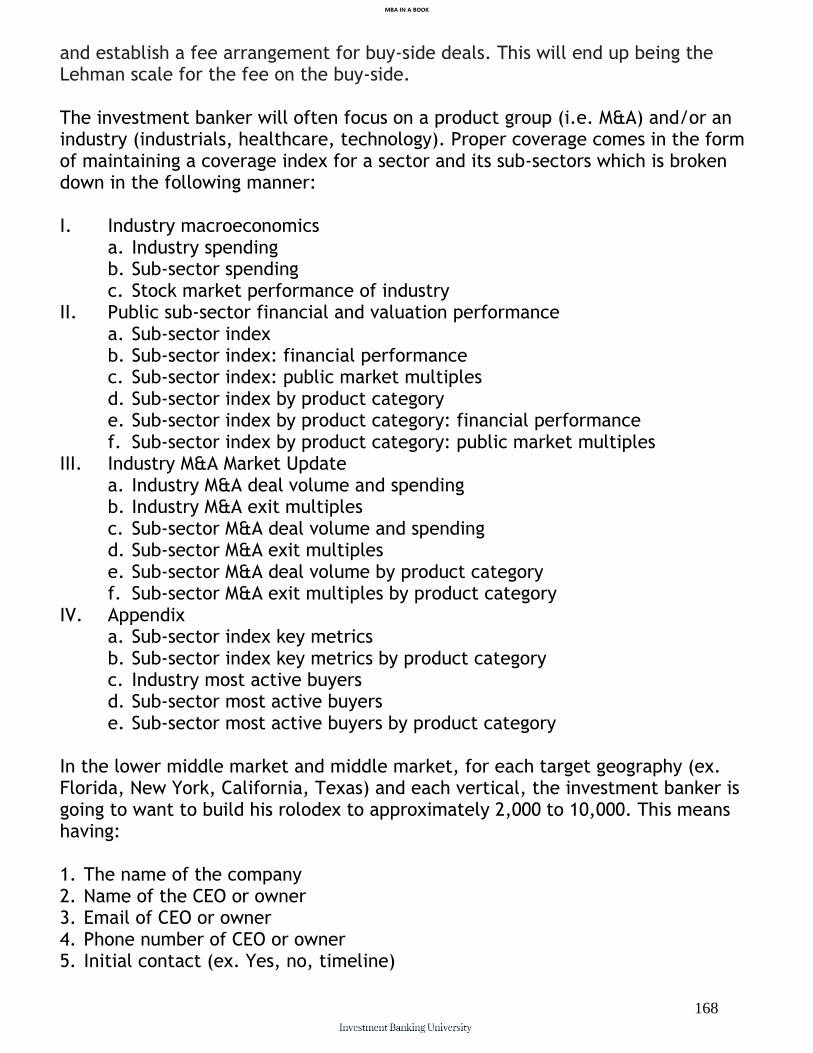
MBA IN A BOOK
168
and establish a fee arrangement for buy-side deals. This will end up being the Lehman scale for the fee on the buy-side. The investment banker will often focus on a product group (i.e. M&A) and/or an industry (industrials, healthcare, technology). Proper coverage comes in the form of maintaining a coverage index for a sector and its sub-sectors which is broken down in the following manner: I. Industry macroeconomics
a. Industry spending b. Sub-sector spending c. Stock market performance of industry
II. Public sub-sector financial and valuation performance a. Sub-sector index b. Sub-sector index: financial performance c. Sub-sector index: public market multiples d. Sub-sector index by product category e. Sub-sector index by product category: financial performance f. Sub-sector index by product category: public market multiples
III. Industry M&A Market Update a. Industry M&A deal volume and spending b. Industry M&A exit multiples c. Sub-sector M&A deal volume and spending d. Sub-sector M&A exit multiples e. Sub-sector M&A deal volume by product category f. Sub-sector M&A exit multiples by product category
IV. Appendix a. Sub-sector index key metrics b. Sub-sector index key metrics by product category c. Industry most active buyers d. Sub-sector most active buyers e. Sub-sector most active buyers by product category
In the lower middle market and middle market, for each target geography (ex. Florida, New York, California, Texas) and each vertical, the investment banker is going to want to build his rolodex to approximately 2,000 to 10,000. This means having: 1. The name of the company 2. Name of the CEO or owner 3. Email of CEO or owner 4. Phone number of CEO or owner 5. Initial contact (ex. Yes, no, timeline)
MBA IN A BOOK
169
The investment banker is going to want to inquire as to whether the company is willing to take an offer on their business every six months as new scenarios emerge within the coverage companies which change exit dynamics. After getting the initial contact, the investment banker can begin providing coverage to the individual company which includes providing sector and sub-sector coverage including: 1. Industry macroeconomics 2. Public sub-sector financial and valuation performance (public comps) 3. Industry M&A market update From this data and information the investment banker can advise on strategic alternatives including capital raising, M&A and growth advisory. Key questions include: 1. Which way are multiples going? 2. Whom are likely acquirers? 3. What are likely multiples for the acquisition? 4. What precedent transactions can we point to in order to justify a premium
valuation?
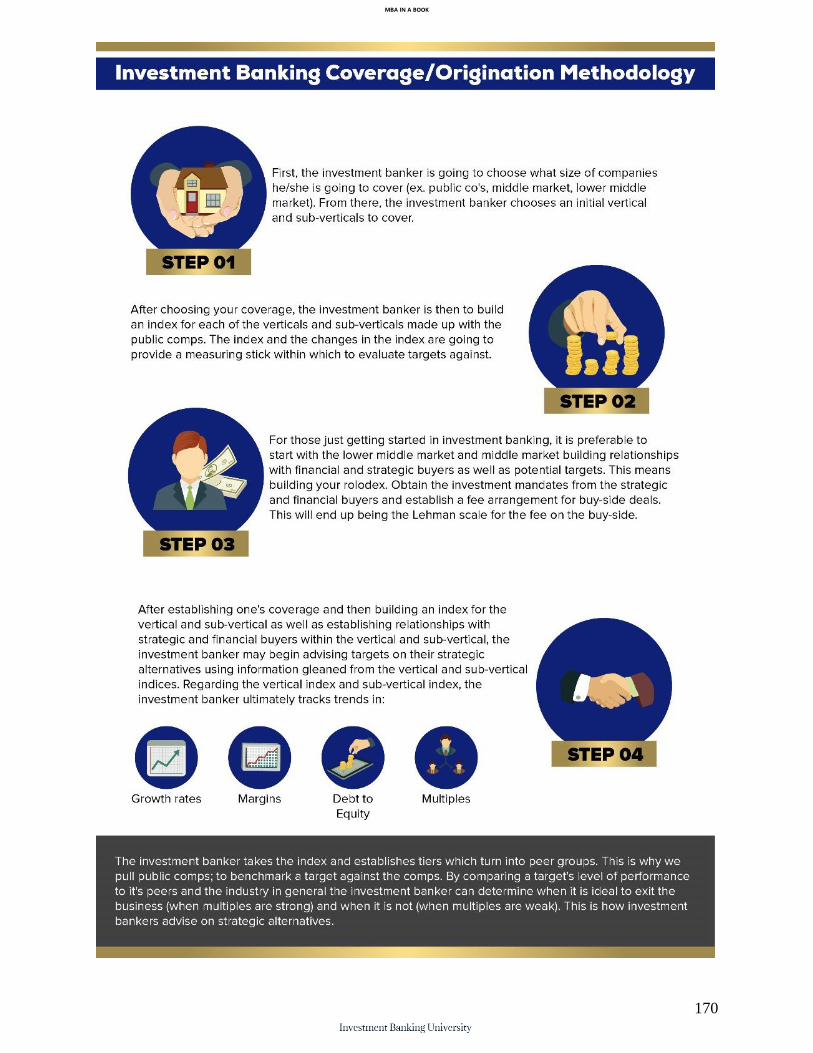
MBA IN A BOOK
170
MBA IN A BOOK
171
Chapter 39: Index Building & Benchmarking Regarding the vertical index and sub-vertical index, the investment banker
ultimately tracks trends in:
Growth rates
Margins
Multiples
The investment banker takes the index and establishes tiers which turn into
peer groups. This is why we pull comps, to build an index and benchmark
against the comps.
The indexing and benchmarking that is done for a target company is going to
serve as the basis for advising on strategic alternatives.
One should build indexes at the vertical level, then sub-vertical level and
finally sub-vertical by product level.
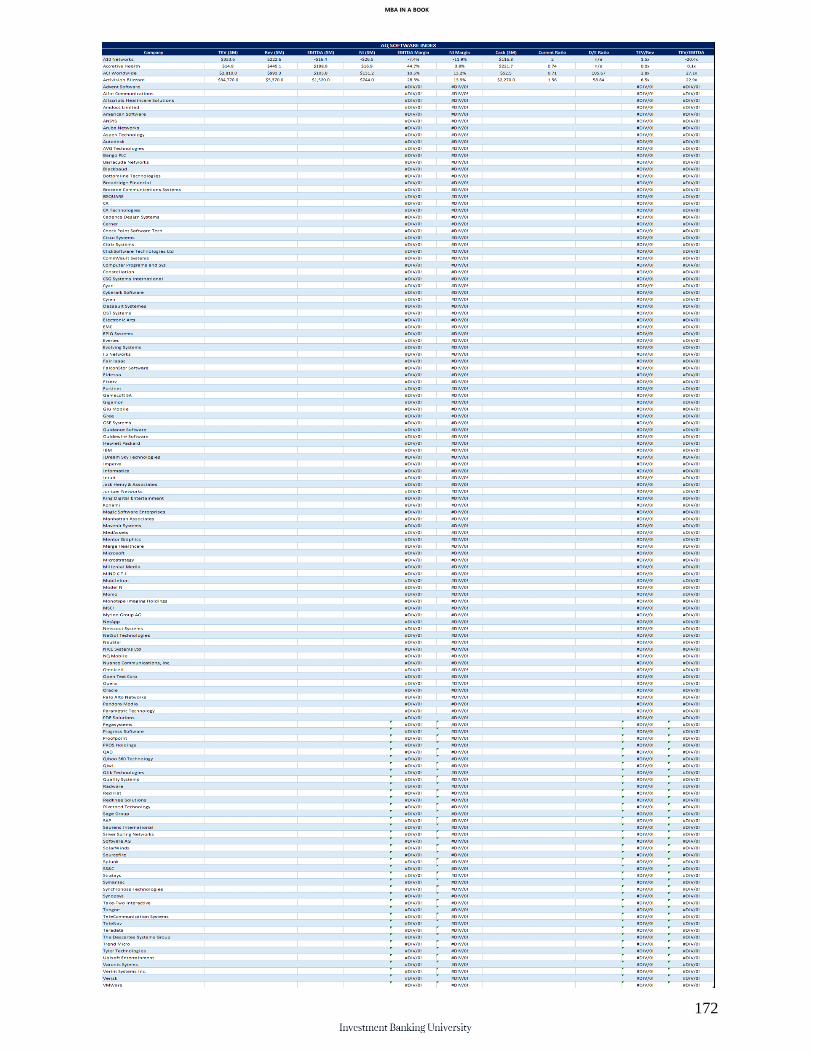
MBA IN A BOOK
172
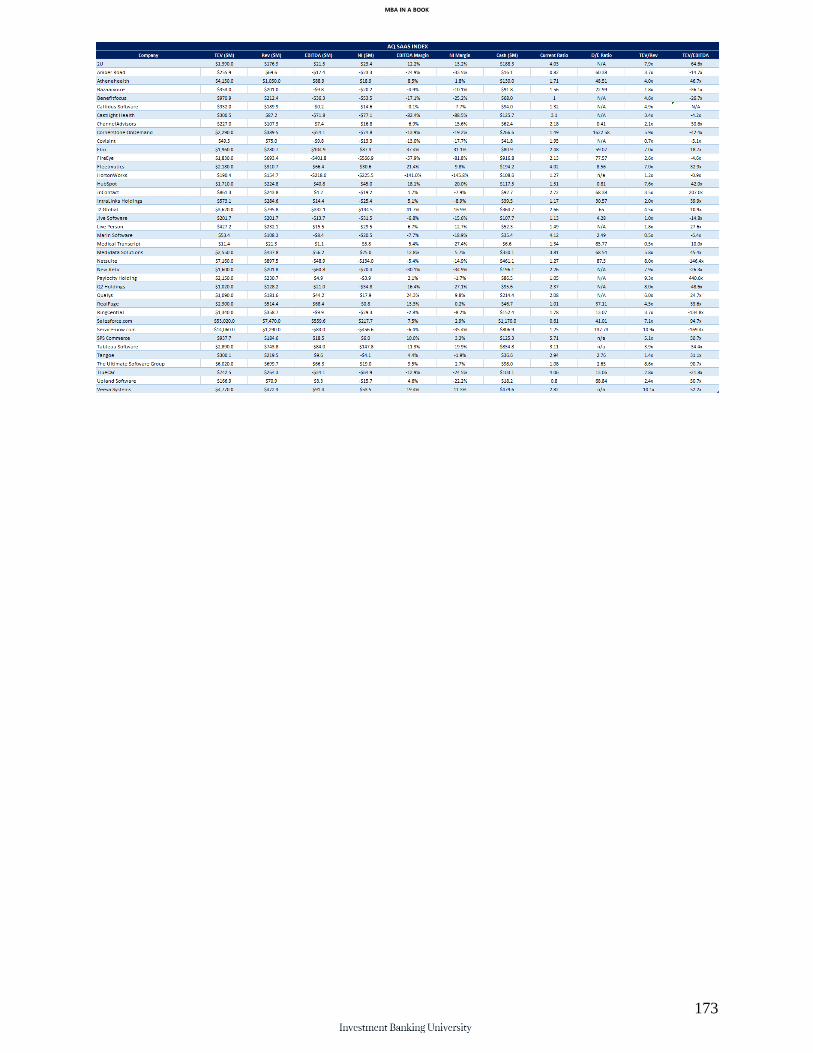
MBA IN A BOOK
173

MBA IN A BOOK
174
MBA IN A BOOK
175
Chapter 40: Financial Data Sources If you are at a larger investment bank, you will have various paid data
sources at your disposal. These include:
1. Bloomberg
2. CapitalIQ
3. FactSet
4. Mergr
For those that are not at a larger bank, one can use the free sources of
financial data including:
• Yahoo Finance
• Google Finance
Yahoo Finance and Google Finance get their EBITDA numbers from CapitalIQ
and their analyst EPS consensus estimates from there as well.
Investment banks typically do not want you to use the EBITDA from CapitalIQ,
Bloomberg, FactSet and would prefer that you spread the comps individually
to get to EBITDA.
We are ultimately using the financial data sources to build and maintain our
various indices associated with our coverage group.

MBA IN A BOOK
176
Chapter 41: Industry or Sector Newsletter When maintaining coverage of an industry or sector, one prepares a
newsletter to be send to prospective sell side clients in the industry or sector.
Investment bankers use the index information to create this newsletter. The
newsletter is about 2 to 6 pages.
For example, our AltQuest software industry coverage has produced the
following newsletter which is sent to potential targets:

MBA IN A BOOK
177
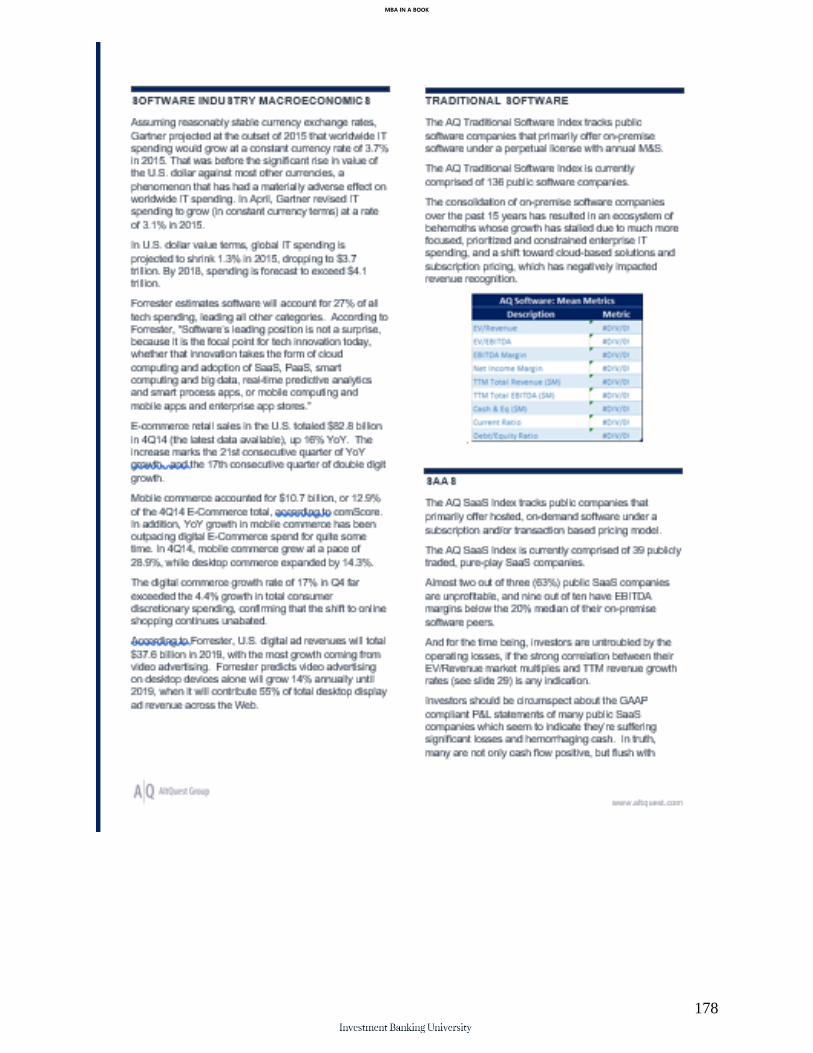
MBA IN A BOOK
178
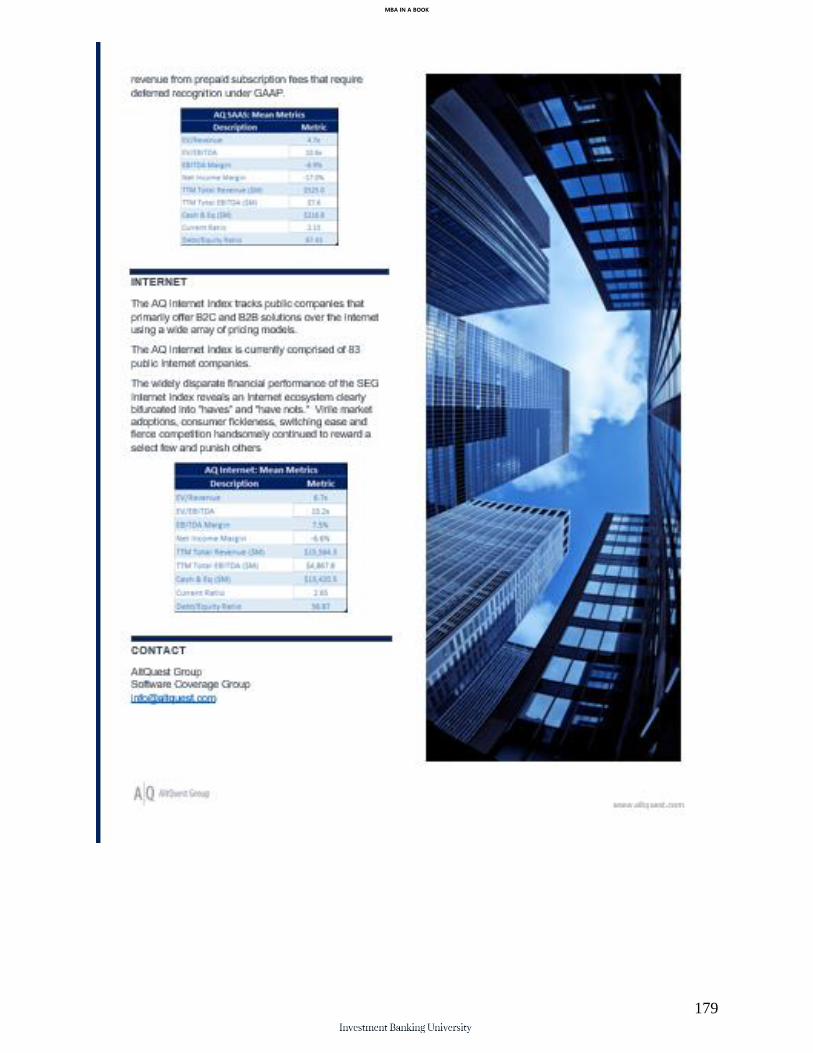
MBA IN A BOOK
179
MBA IN A BOOK
180
Chapter 42: Industry or Sector Report When maintaining coverage of an industry or sector, one prepares a report to
be send to prospective sell side clients in the industry or sector. Investment
bankers use the index information to create this report. The report goes more
in depth than the newsletter. The report can be about 15-20 pages.
For example, our AltQuest software industry coverage has produced the
following industry report which is sent to potential targets:
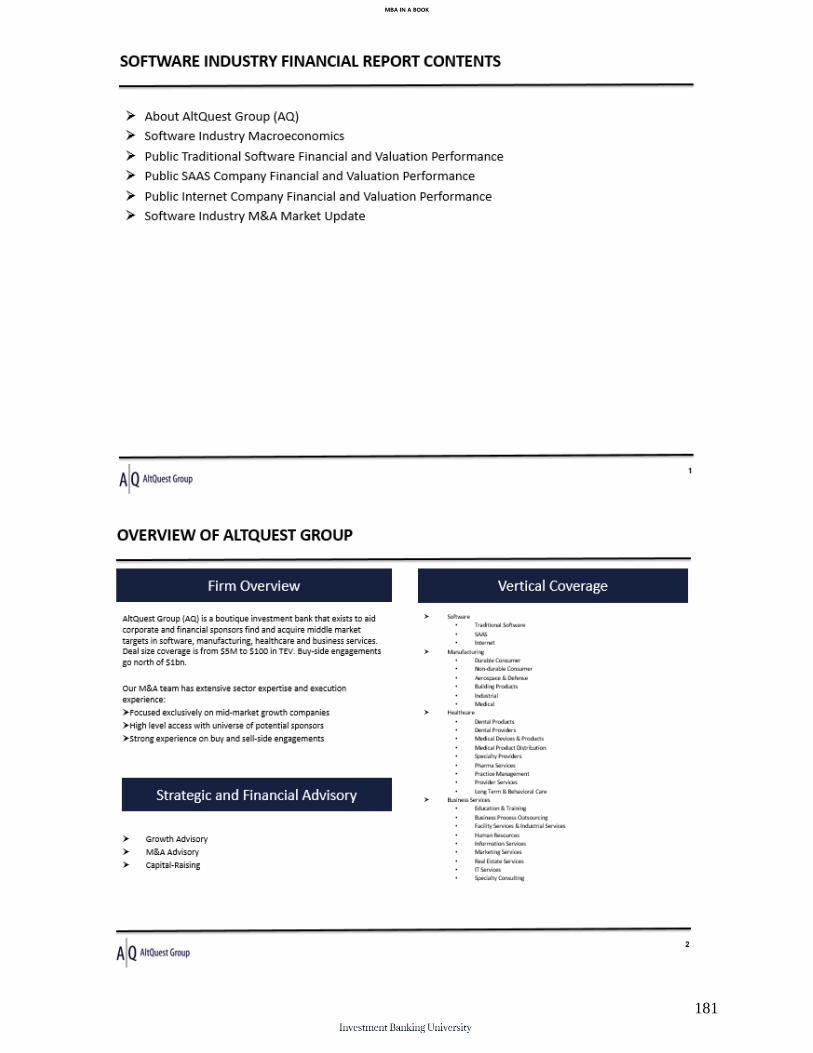
MBA IN A BOOK
181
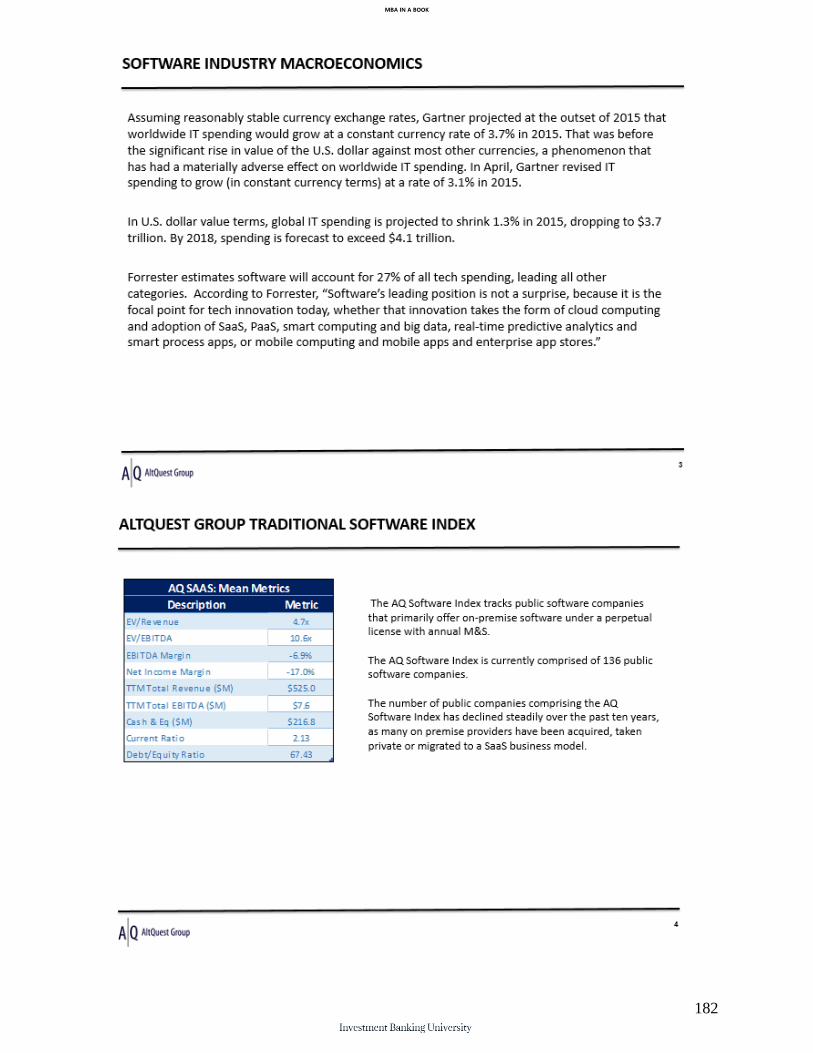
MBA IN A BOOK
182
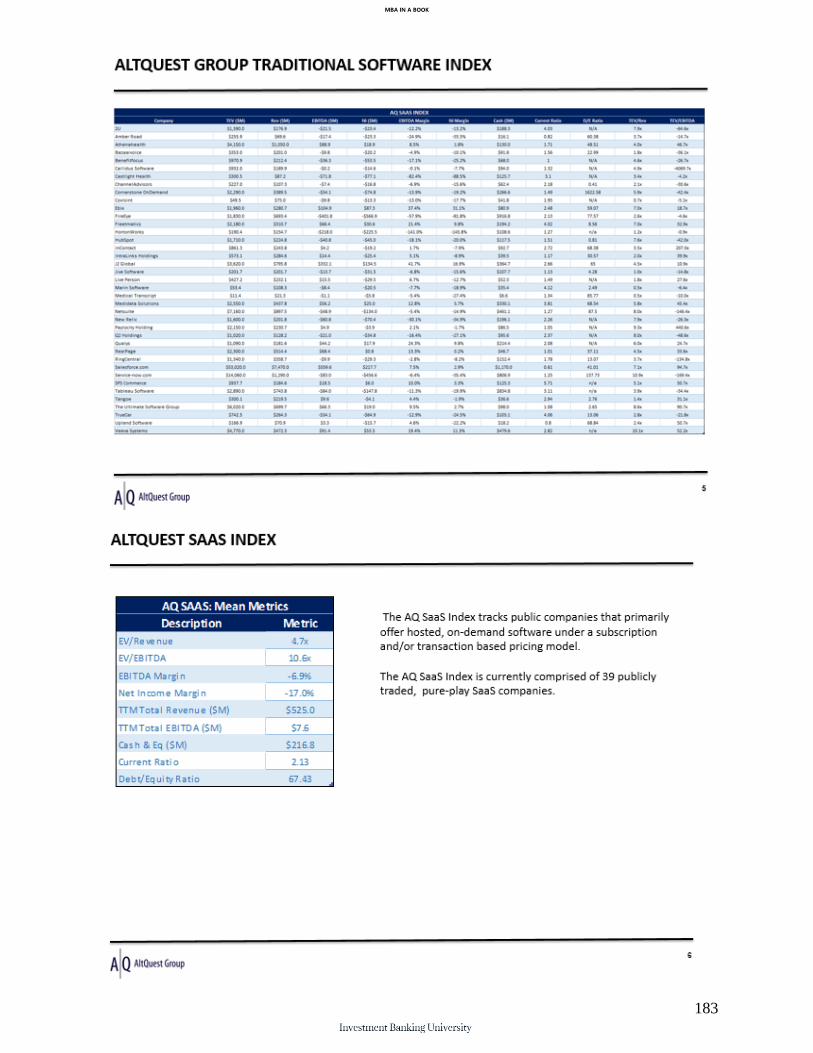
MBA IN A BOOK
183

MBA IN A BOOK
184
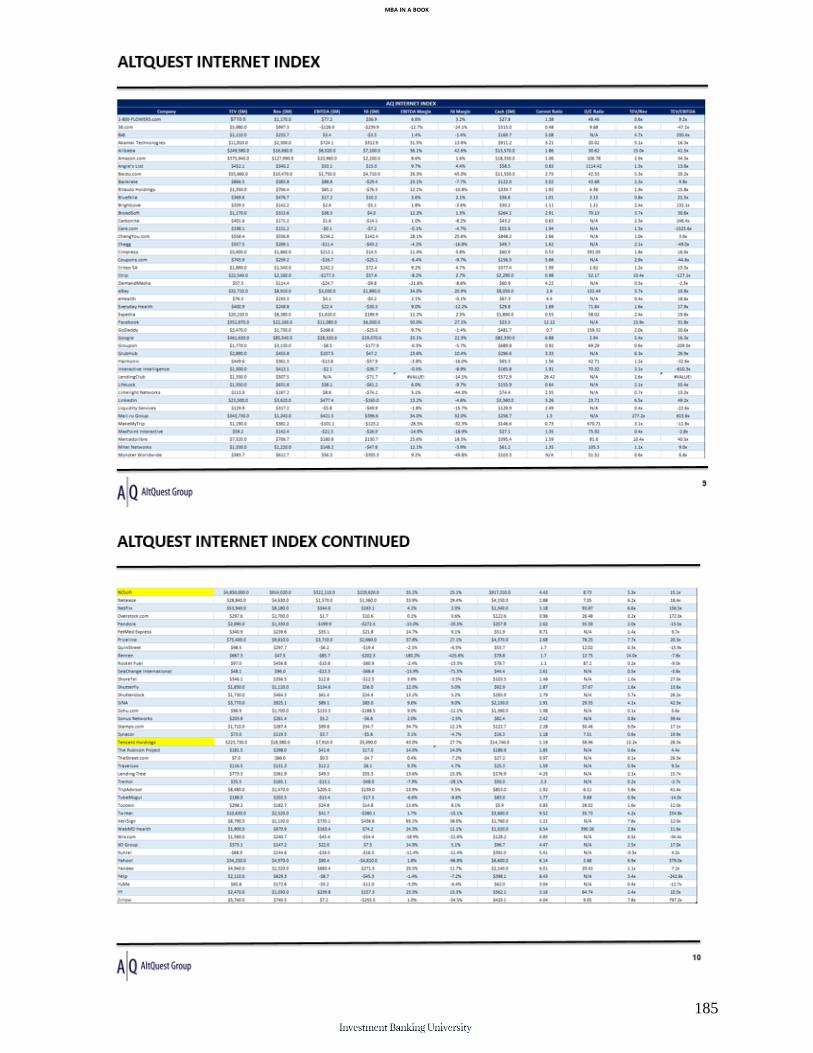
MBA IN A BOOK
185

MBA IN A BOOK
186

MBA IN A BOOK
187
Chapter 43: Pitch Book When we have built out our industry indices and began coverage, we can
begin to pitch our M&A services to particular businesses to win M&A
mandates. This means building a pitchbook for an individual target.
MBA IN A BOOK
188
Chapter 43: Rolodex Building As an investment banker it is important to establish relationships with the
strategics in your coverage group as well as relationships with targets and
their potential buyers. After building the index containing relevant strategics,
one should go to RocketReach.co and find the email addresses for each of the
CEOs, CFOs, and/or corporate M&A department head for the potential
acquirer.
An example of a vertical specific rolodex would be the following:

MBA IN A BOOK
189

MBA IN A BOOK
190
Chapter 44: Industry & State Level Coverage When building out your coverage for your investment bank, if your coverage
begins at $5M revenues on up in manufacturing, then there should be about
1,500 firms per state. AltQuest Group’s coverage includes California, Texas,
New York where we give periodic updates to our coverage companies on the
M&A marketplace including multiples, margins and M&A volume.
MBA IN A BOOK
191
Part V:
M&A Origination Methodology
The following methodology describes the primary work of the investment banker,
origination. The methodology arose through the work of Michael Herlache in his
M&A career and the lack of content about the actual work of senior M&A
professionals. There is plenty of knowledge around the technical support work of
investment bankers including financial modeling and valuation, but there are no
current texts on origination, let alone a methodology.
MBA IN A BOOK
192
Chapter 45:
M&A Origination Methodology
Step 1a: Determine Coverage Industries & Sub-Sectors Step 1b: Build Industry and Sub-Sector Index Step 2: Database Utilization & Emails Collected The following email is used after pulling a county list from infousa.com or screening in Salesgenie and screening for revenue size ($2.5M +) and contact person (owner, CEO, President). Starting from the end of the database (Z), go through each account in the database and determine the business owner’s primary email address either from the database itself or by going to the website and acquiring the email address. Once 30 to 50 emails are obtained in one day, the process of emailing begins with the best practice below. The response rate to the emails should be approximately 3%. Step 3: Email Inquiry John, It's a pleasure. I work with AltQuest Group right here in Fort Lauderdale. Would you be willing to take an offer on your business from a private equity group? Please let me know.
MBA IN A BOOK
193
Best, Michael Step 4: Offer & Price Inquiry After receiving initial response, you will then message them that you will email them when you have the offers and ask for the price of the business. The following is the email that should be sent: John, Alright. I'll notify you when I receive the offers. What is your expectation regarding the price of your business? Best, Michael Step 5: Phone Call Request (by Sellers) or Meeting Request After requesting price, some sellers will request a phone call and provide their contact information. If the seller provides price information, they reply with the following email: John, Alright. Best, Michael Step 6: Phone Call or Meeting Phone call or meetingl: During the phone call you will introduce yourself and state that you work on behalf of private equity firms in locating quality cash flowing companies and that is how you found their company. From there you will state that you want to get an initial understanding as to the price of the business. After the price of the business is found, ask how the business performed last year (revenue and net income). The following is your outline for the phone call: Price: Revenue:
MBA IN A BOOK
194
Net Income: ***If meeting, they may have their financials on hand to view and you view them. You can ask to keep a copy to aid in recasting.
Step 7: Fee Agreement John, After sharing with our buyer the information from our call, they are interested. Even though we do not have an agreement in place, we would still like to connect you with our buyer. Do you accept our 6% success fee? We only earn our fee when our buyer purchases your company. Please let me know. Best, Michael After we send, Would you be willing to take an offer on your business from a PE buyer, we speak with our buyer and then get back to the seller the next week with this email to get a fee agreement in place. Step 8: Add Backs Calculated and Teaser Created After the meeting, you now have the financials or financial data needed to do add backs to get to an owner’s benefit or EBITDA number. From here you can input the recasted financials into the teaser and then complete the teaser based upon the general information (usually from the website and meeting conversation) of the business Step 9: Marketplace Then we put the opportunity on BizBuySell and find a strategic buyer ideally and at least a financial buyer Step 10: NDAs Signed with Buyers
MBA IN A BOOK
195
Once inquiries are received from buyers from the M&A marketplaces, you will send NDAs to the buyers which they will then sign and send back to you. Often times, this email will precede an NDA: Buyer Name, Sure. The company is Velocity Jets located in Fort Lauderdale, FL. The website is www.VelocityJets.com. If the company seems like a fit, we can sign an NDA and I will send you their financials. Velocity Jets’ range of services for Charter Jet Flights includes private jet membership, aircraft sales, and management and worldwide aircraft charter. Our team ensures premium service from experienced industry specialists customized to fit your individual aviation needs. Velocity Jets does not own or operate any aircraft, which enables us to recommend the best aircraft available each and every time. We take great pride in providing the best value by identifying the best aircraft for every mission. All operators utilized are FAA Part 135 operators required to adhere to safety requirements set forth by Argus/US and Wyvern, the two leading 3rd party air safety auditing firms in the country. Providing the safest and most experienced aircraft and flight crews at the best rates is what sets Velocity Jets apart from the rest. Please let me know. Best, Michael Step 11a: Teaser with Name Given to Buyer Once the NDA is received, you can give the buyer the name of the business on the teaser and request an IOI from the buyer after reviewing the teaser and summary financials. The following is the email to accompany the teaser:
MBA IN A BOOK
196
Buyer, After reviewing the teaser and summary financials, please submit your initial indication of interest (IOI) and we will set up a buyer/seller meeting. Best, Michael Step 11b: Teaser with Name Given to Buyer Often times a call will be requested by the buyer. On the phone the M&A professional finds out the following, taking notes on the call: Industry interest: Questions (that the buyer has): Multiples that buyer is seeing or that they typically do: Step 12: Connect the Buyer and Seller for a Call Then we arrange a phone call to take place between buyer and seller PE Buyer, We are waiting on updated financials right now. Let’s set up a call between yourself and the owner so that he can answer any of your questions. Does a call later this week work for you? Please let me know. Best, Michael Step 13: Financials, Adjusted EBITDA, & IOI Then we get financials from seller to buyer and then we get IOI. After reviewing the financials and the first buyer/seller meeting,
MBA IN A BOOK
197
you ask for the IOI with price and terms. IOI turns into agreed deal and they write purchase agreement with lawyers. Step 14: IOI from Buyer After reviewing the teaser and summary financials, the buyer will notify you that they are interested in purchasing the company (IOI). Step 15: Buyer Seller Meeting After submitting the IOI, you will arrange an in person meeting with the seller which is called the buyer seller meeting. If the buyer is unavailable due to distance or timing, a phone call can be set up. Step 16: Purchase Agreement Given to Seller After the buyer seller meeting, you prompt the buyer to submit a purchase agreement and then give this purchase agreement to the seller. Step 17: Signed Purchase Agreement with Different Terms After the seller reviews the purchase agreement they will either sign the contract or counter with different terms. They are to sign the contract with the contingencies written into the contract. Step 18: Enter Due Diligence After receiving the counter, the buyer can sign the agreement with makes for a legally binding purchase agreement contingent to the items that will now be explored during the due diligence period. As items are explored, the buyer signs off that the items are no longer in question one by one. Step 19: Complete Due Diligence After all the items in the due diligence list are completed, due diligence is now completed and the closing can be scheduled. The documents are sent to the closing agent with instructions as to the M&A fee as well. Step 20: Closing & Flow of Funds After the both the buyer and seller sign at the closing, the checks are cut and you receive your M&A fee and bring it to your bank or

MBA IN A BOOK
198
have the fee wired to AltQuest’s account. Make sure that your firm is on the Flow of Funds document to ensure that you get paid.
MBA IN A BOOK
199
Part VI:
Mandate/Target Matching Methodology
MBA IN A BOOK
200
Chapter 46:
Mandate/Target Matching Methodology After determining one’s coverage and then initiating coverage in the form of index-building, it is important for the investment banker to then begin matching investment mandate’s of strategic and financial buyers to targets within the investment banker’s coverage. The Mandate/Target Matching Methodology is the following:
1. Build relationships with strategic and financial buyers in a given industry sector
or subsector (Use Mergr.com as a database within which to understand investment mandates and contact information)
2. Indicate your interest in sourcing deals on their behalf and obtain their investment mandate. This will usually be detailed in a one-page teaser or presentation that they will send to you
3. Screen for companies that match the mandate(s) in Salesgenie and obtain CEO/owner emails and phone numbers
4. Begin emailing and calling CEO/owners and soliciting interest in taking an offer on their business from a financial or strategic buyer
5. Structure as a sell-side engagement or a buy-side engagement depending on CEO/owner’s level of interest in selling
6. Collect historical financial data for the last three years 7. Introduce the financial and/or strategic buyer to the opportunity with the
summary financial information and have them sign an NDA 8. Have a call with the financial and/or strategic buyer and then make the formal
introduction to the CEO/owner and have a buyer/seller meeting

MBA IN A BOOK
201
MBA IN A BOOK
202
Part VII:
M&A Fee Methodology
It is important for the investment banker to have a strong understanding of fees so that the In the lower middle market to middle market, fees usually are the following: 6% for <$5M TEV 5% for $5M-$7M TEV 4% for $7M - $10M TEV 3% for >$10M TEV As you move higher than $2M in EBITDA, the Lehman Scale appears and this is the preferred method for pricing the fee.
MBA IN A BOOK
203
Chapter 47:
M&A Success Fee In the lower middle market to middle market, most investment bankers work on a success fee basis meaning that they only receive compensation on a deal when it actually goes through and closes.
MBA IN A BOOK
204
Chapter 48:
M&A Engagement Letter In order to get paid, investment bankers have to land the engagement. Once the fee is agreed upon, the investment banker puts in writing the fee in something called an engagement letter. The AltQuest Group engagement letter looks like the following:

MBA IN A BOOK
205
MBA IN A BOOK
206
Part VIII:
Buyer List Methodology
After landing the M&A engagement, the investment banker will need to build a
buyer list and then begin outreach to the buyer list.
MBA IN A BOOK
207
Chapter 49:
Buyer List Methodology In order to build a buyer list, the investment banker uses a database service such
as Mergr.com to pull a list of likely strategic and financial buyers along with
contact information in order to run the M&A process and build a market for
control of the perpetuity.

MBA IN A BOOK
208
Chapter 50:
Buyer List Outreach After finalizing the buyer list from the database, the investment banker can then
began contacting each prospective buyer in the list. Contacts should be to the
corporate M&A representative for large corporations or CEOs and owners for lower
middle market companies.

MBA IN A BOOK
209
Part IX: Deal Structuring After matching a financial or strategic buyer’s mandate with a target, landing the M&A engagement and building & executing on a buyer list, it is up to the investment banker to work with the buyer and seller to structure a deal. Deal structures initially involve a rough range of valuation to make sure that both parties are in the sphere of reasonability. Reasonable deals typically look like the following: 4x <$1M EBITDA 5x ~$1M EBITDA 6x $1M - $2M EBITDA 7x >$2M EBITDA From there we should get an understanding of whether this is: 1. Going to be a majority or minority ownership deal 2. Whether the owner plans on staying as a CEO after the transaction or whether
there is existing management in place 3. Owner financing is available 4. Earn outs
MBA IN A BOOK
210
Chapter 51:
Deal Structuring After matching a financial or strategic buyer’s mandate with a target, it is up to the investment banker to work with the buyer and seller to structure a deal. Deal structures can be along the following lines: I. Asset Sale vs. Stock Sale II. Majority vs. Minority III. Cash vs. Stock vs. Cash & Stock IV. Seller financing V. Earn out VI. Seller stays on as management vs. consulting agreement for shorter term
MBA IN A BOOK
211
Chapter 52:
Asset Sale vs. Stock Sale An asset sale in M&A does not mean distressed but rather is where a buyer acquires the assets of a company rather than the stock. In a stock sale, the depreciation schedule is transferred to the new buyer. Purchase Price Allocation The purchase price allocation forms points of negotiation where hard assets are stepped up to the purchase price.

MBA IN A BOOK
212
Part X: M&A Process When the owner of a perpetuity has decided to grow inorganically or exit the perpetuity, the M&A process must be executed/run.
MBA IN A BOOK
213
Chapter 53:
M&A Process From Origination to M&A Execution Once the investment banker has originated 8 to 10 multimillion dollar listings, one should transition from origination to M&A execution process creating a shortlist for each deal (10 in the shortlist). The investment banker should concurrently prepare the marketing package which includes the teaser and the executive summary. Once the teaser is finished, the investment banker should begin emailing the shortlist with the teaser. From this shortlist, a percentage will reply seeking additional information on the target. NDAs should be sent out and after being signed, the executive summary should be sent to the shortlist member. After the executive summary is sent, a percentage will decide to request a buyer/seller meeting. After the buyer/seller meeting, a percentage will decide to make an offer. Building the Buyer Shortlist The shortlist should include strategic and financial buyers and the investment banker should screen each that make it onto the shortlist for financial capacity to pay. The investment banker should use Salesgenie to pull the geographic competitors (geography screen with SIC code screen) and have 10 strategics. The investment banker should use the massinvestor database to determine which 10 financials to include in shortlist: Strategic Competitors - synergies Indirect Competitor Financial Hybrid strategic – financial buyer with asset in the sector Pure financial
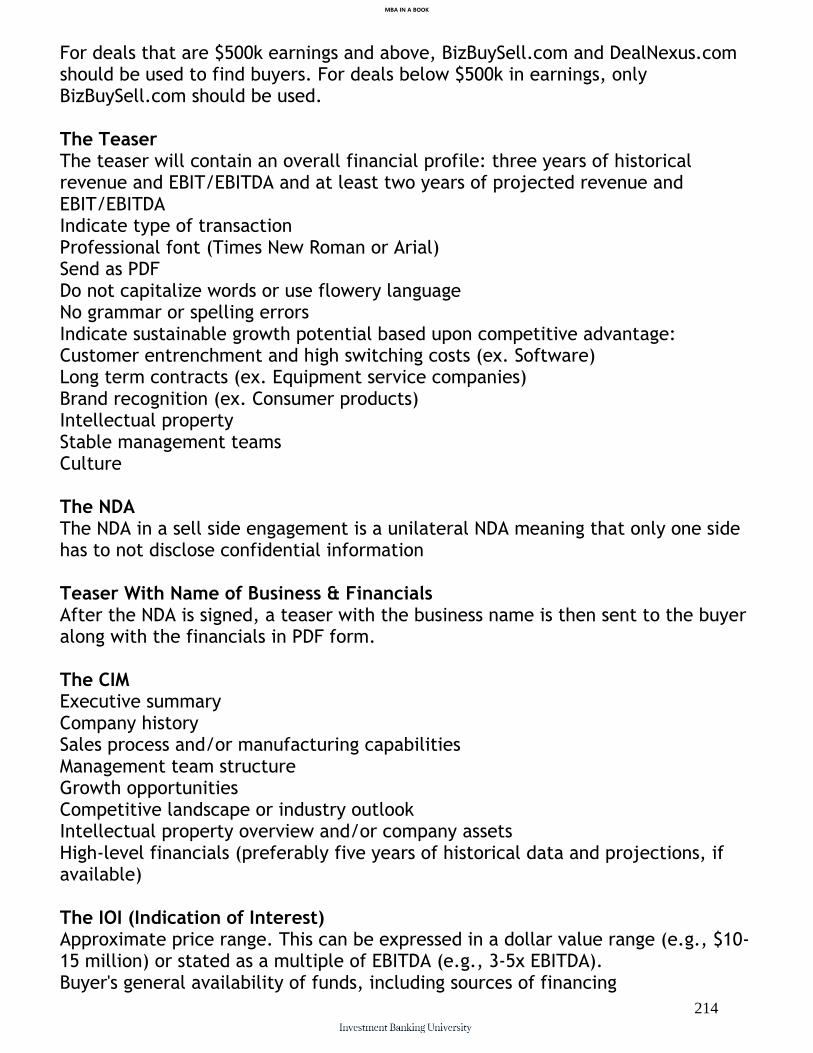
MBA IN A BOOK
214
For deals that are $500k earnings and above, BizBuySell.com and DealNexus.com should be used to find buyers. For deals below $500k in earnings, only BizBuySell.com should be used. The Teaser The teaser will contain an overall financial profile: three years of historical revenue and EBIT/EBITDA and at least two years of projected revenue and EBIT/EBITDA Indicate type of transaction Professional font (Times New Roman or Arial) Send as PDF Do not capitalize words or use flowery language No grammar or spelling errors Indicate sustainable growth potential based upon competitive advantage: Customer entrenchment and high switching costs (ex. Software) Long term contracts (ex. Equipment service companies) Brand recognition (ex. Consumer products) Intellectual property Stable management teams Culture The NDA The NDA in a sell side engagement is a unilateral NDA meaning that only one side has to not disclose confidential information Teaser With Name of Business & Financials After the NDA is signed, a teaser with the business name is then sent to the buyer along with the financials in PDF form. The CIM Executive summary Company history Sales process and/or manufacturing capabilities Management team structure Growth opportunities Competitive landscape or industry outlook Intellectual property overview and/or company assets High-level financials (preferably five years of historical data and projections, if available) The IOI (Indication of Interest) Approximate price range. This can be expressed in a dollar value range (e.g., $10-15 million) or stated as a multiple of EBITDA (e.g., 3-5x EBITDA). Buyer's general availability of funds, including sources of financing
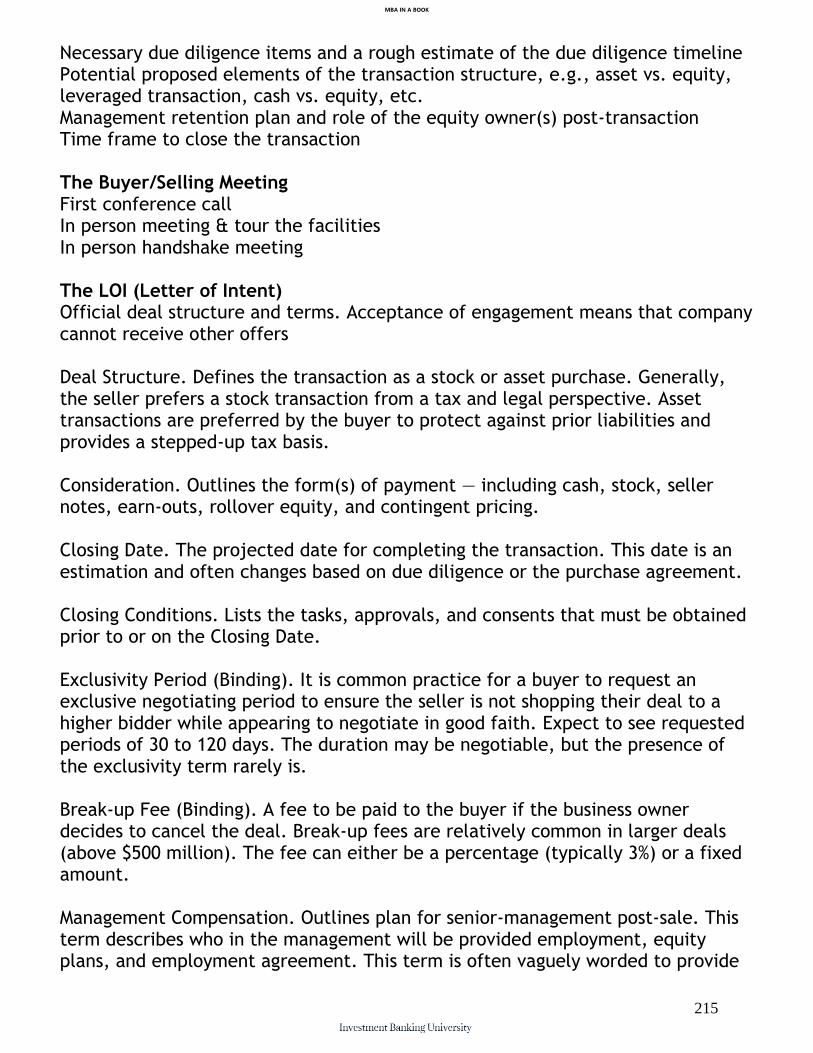
MBA IN A BOOK
215
Necessary due diligence items and a rough estimate of the due diligence timeline Potential proposed elements of the transaction structure, e.g., asset vs. equity, leveraged transaction, cash vs. equity, etc. Management retention plan and role of the equity owner(s) post-transaction Time frame to close the transaction The Buyer/Selling Meeting First conference call In person meeting & tour the facilities In person handshake meeting The LOI (Letter of Intent) Official deal structure and terms. Acceptance of engagement means that company cannot receive other offers Deal Structure. Defines the transaction as a stock or asset purchase. Generally, the seller prefers a stock transaction from a tax and legal perspective. Asset transactions are preferred by the buyer to protect against prior liabilities and provides a stepped-up tax basis. Consideration. Outlines the form(s) of payment — including cash, stock, seller notes, earn-outs, rollover equity, and contingent pricing. Closing Date. The projected date for completing the transaction. This date is an estimation and often changes based on due diligence or the purchase agreement. Closing Conditions. Lists the tasks, approvals, and consents that must be obtained prior to or on the Closing Date. Exclusivity Period (Binding). It is common practice for a buyer to request an exclusive negotiating period to ensure the seller is not shopping their deal to a higher bidder while appearing to negotiate in good faith. Expect to see requested periods of 30 to 120 days. The duration may be negotiable, but the presence of the exclusivity term rarely is. Break-up Fee (Binding). A fee to be paid to the buyer if the business owner decides to cancel the deal. Break-up fees are relatively common in larger deals (above $500 million). The fee can either be a percentage (typically 3%) or a fixed amount. Management Compensation. Outlines plan for senior-management post-sale. This term describes who in the management will be provided employment, equity plans, and employment agreement. This term is often vaguely worded to provide

MBA IN A BOOK
216
the buyer with latitude since they may not be prepared to make commitments to senior management. Due Diligence. Describes the buyer’s due diligence requirements, including time frame and access. Confidentiality (Binding). Although both parties have probably signed a confidentiality agreement at this point, this additional term ensures all discussions regarding the transaction are confidential. Approvals. Lists any approvals needed by the buyer (e.g., board of directors) or seller (e.g., regulatory agencies, customers) to complete the transaction. Escrow. Provides the summary terms of the buyer's expected escrow terms for holding back some percentage of the purchase price to cover future payments for past liabilities. The escrow is typically highly negotiable and often excluded from the LOI and presented for the first time in the purchase agreement. Representations and Warranties. This clause will include indemnifications in the purchase agreement. It is best practice to include any terms that may be contentious or non-standard. Due Diligence Financial books and records Incorporation documents Employee benefits, policies and compliance issues Internal systems and procedures Customer contracts Intellectual property Condition of assets Any key area of concern identified while negotiating the letter of intent Digital deal rooms are now used (ex. Firmex and V-rooms). Due Diligence is usually 60 to 90 days The Purchase Agreement Incorporates all terms of the LOI and is written to address issues discovered in due diligence. The agreement will lay out a structure to handle this (a hold back account, deductions from future payments, price adjustment, etc.) Pitchbook Table of Contents (exploring strategic alternatives to win a mandate): I. Executive summary II. Industry specific market update (discuss control premiums and multiples)

MBA IN A BOOK
217
III. Review of company’s strategic priorities IV. Potential strategic targets
a. Vertical I b. Vertical II c. Vertical III
Sell side after winning the mandate: I. Discuss and demonstrate knowledge of buyer universe (strategic vs.
financial) II. Discuss valuation range (“I believe that you can get $_____, providing that
these things hold true”) III. Process and timing IV. Tax consequences V. What is going to happen to key management and employees
Confidential Information Memorandum (CIM) Table of Contents: I. Executive summary II. Key investment considerations III. Growth opportunities IV. Industry overview V. Company overview
a. Overview b. Products and services c. Sales and marketing d. Operations e. Organization
VI. Financial overview Confidentiality – Discuss in terms of project name, never mention name of company. “No comment” and refer press to PR department. M&A Banker’s Role: M&A banker is hired to run a process: 1. Defining exit options and strategies (4 types: auction process, controlled sale,
targeted high level solicitation, closed negotiation) 2. Valuation 3. Recast financials 4. Presentation and packaging 5. Buyer qualifications 6. Marketing 7. Management coaching 8. Due diligence facilitation (data room) 9. Price and contract negotiation From 100 buyer universe, narrow it down to 20 to 30 target buyers
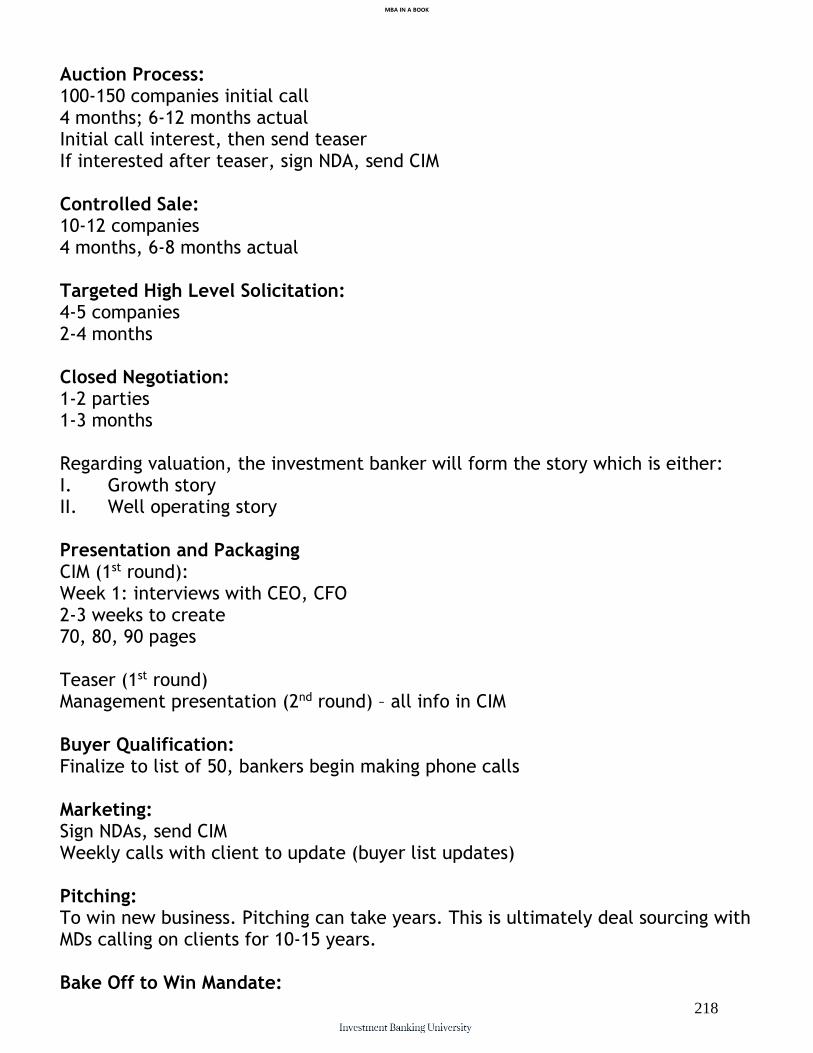
MBA IN A BOOK
218
Auction Process: 100-150 companies initial call 4 months; 6-12 months actual Initial call interest, then send teaser If interested after teaser, sign NDA, send CIM Controlled Sale: 10-12 companies 4 months, 6-8 months actual Targeted High Level Solicitation: 4-5 companies 2-4 months Closed Negotiation: 1-2 parties 1-3 months Regarding valuation, the investment banker will form the story which is either: I. Growth story II. Well operating story Presentation and Packaging CIM (1st round): Week 1: interviews with CEO, CFO 2-3 weeks to create 70, 80, 90 pages Teaser (1st round) Management presentation (2nd round) – all info in CIM Buyer Qualification: Finalize to list of 50, bankers begin making phone calls Marketing: Sign NDAs, send CIM Weekly calls with client to update (buyer list updates) Pitching: To win new business. Pitching can take years. This is ultimately deal sourcing with MDs calling on clients for 10-15 years. Bake Off to Win Mandate:
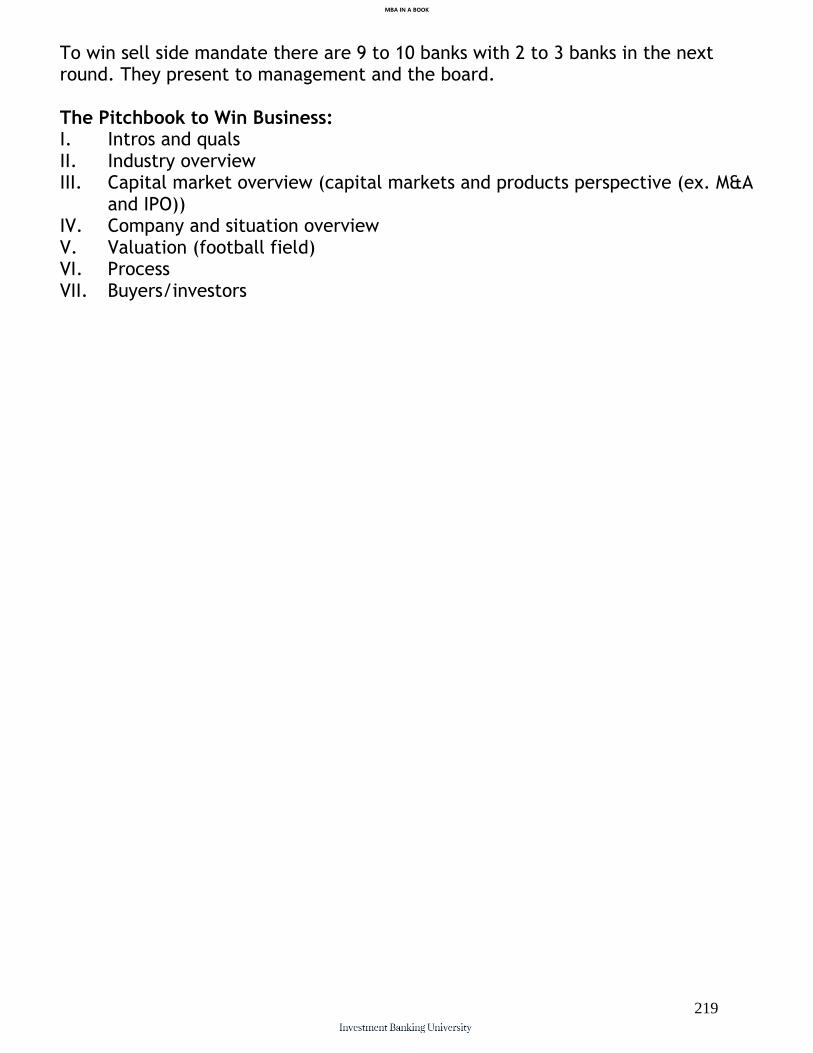
MBA IN A BOOK
219
To win sell side mandate there are 9 to 10 banks with 2 to 3 banks in the next round. They present to management and the board. The Pitchbook to Win Business: I. Intros and quals II. Industry overview III. Capital market overview (capital markets and products perspective (ex. M&A
and IPO)) IV. Company and situation overview V. Valuation (football field) VI. Process VII. Buyers/investors
MBA IN A BOOK
220
MBA IN A BOOK
221
MBA IN A BOOK
222

MBA IN A BOOK
223
Chapter 54:
Dealing with Sellers Most sellers that are interested in having a discussion are 1 to 5 years away
from actually selling. They either are waiting for a strategic buyer or simply
need to grow a few more years to hit a target valuation to be in line with the
lower middle market/middle market valuation spectrum:
$500k to <$1m is 4x
$1m is 5x
$1m to $2m is 6x
>$2m is 7x
Since sellers are likely a few years away even if you get a fee agreement in
place, getting questions answered and a buyer/seller call will take time.
Sometimes a year. Patience is the key here as m&a operates on an entirely
different timeline that the rest of business. A business owner will sell his
business once in a lifetime so 3 to 5 years is about the standard for an exit
once he responds that he would be willing to take an offer on his business
MBA IN A BOOK
224
Chapter 55:
Dealing with Buyers When waiting for financials from the seller, go for a buyer/seller call in the
interim to move the process forward. If the buyer wants to wait for financials,
then request that the buyer write out their questions of the seller in an email
and then forward these questions to the seller. This should set up the next
step which is the buyer/seller call. After which financials will be more
forthcoming. In fact, it is better to not even ask for financials from the seller
until after having the buyer/seller call. Business owners feel more
comfortable handing over financials to individuals that they have actually
spoken to. If the buyer is only concerned with the numbers, the questions can
be regarding top line and ebitda for last three years; this will serve as the
questions which will then set up the call.
Qualifying Buyers
When buyers inquire through BizBuySell/BizQuest often times they only
appear as individual buyers which typically only pay 3x to 4x EBITDA. Since
our LMM/MM Valuation Guide will generally require a higher multiple, it is
important to screen out these individuals by saying the following:
“Sure, I’d be happy to. Would you be buying the company individually or on
behalf of a corporation”
Since most sellers do not have to sell, they are willing to wait for the right
strategic buyer to purchase their company in line with the LMM/MM Valuation
Guide.
MBA IN A BOOK
225
Part XI: Investment Bank Management Since the M&A market is so fragmented in the middle market, it may become necessary for the investment banker to run his own M&A practice.
MBA IN A BOOK
226
Chapter 56:
How to Build a Boutique Investment Bank At Investment Banking University, we are often asked , "How to build a boutique investment bank?", so we created a methodology for doing so consistent with that which built AltQuest Group (www.AltQuest.com), the middle market boutique investment bank. This methodology is known as the Boutique Investment Bank Methodology which goes as follows:
1. Decide on IB product (M&A, capital-raising, growth advisory) 2. Decide on size of market to cover (public co's, middle market, lower middle
market) 3. Decide on industry coverage (AltQuest's coverage is broken down between
Healthcare, Manufacturing, Software, and Business Services) 4. Break down industry into sub-verticals to cover 5. Build indices for industry and sub-verticals made up of public co's 6. Utilize Coverage & Origination Methodology to advise targets on strategic
alternatives 7. Utilize Mandate/Target Matching Methodology to match strategic and
financial buyers' mandates to targets 8. Gather financials, recast & IB deliverables (adjusted EBITDA, valuation,
teaser, CIM, management presentation) 9. Offer analysis 10. Purchase agreement drafting/structuring 11. Due diligence data room 12. Closing & flow of funds
Decide on the industry/industries that you will cover, read/research the value themes/players/multiples in the industry on the following levels: 1. Large cap 2. Mid cap 3. Small cap
MBA IN A BOOK
227
4. Middle market 5. Lower middle market Pick an initial vertical and sub-vertical to cover. With AltQuest Group, our initial coverage groups were the following: 1. Manufacturing 2. Software 3. Business Services 4. Healthcare After choosing your coverage, the investment banker is then to build an index for each of the verticals and sub-verticals made up with the public comps. The AltQuest Group coverage is broken down in the following manner: 1. Manufacturing
a. Durable consumer b. Non-durable consumer c. Aerospace & defense d. Building products e. Industrial f. Medical
2. Software a. Traditional software b. SAAS c. Internet
3. Business Services a. Education & Training b. Business Process Outsourcing c. Facility Services and Industrial Services d. Human Resources e. Information Services f. Marketing Services g. Real Estate Services h. IT Services i. Specialty Consulting
4. Healthcare a. Dental Product b. Dental Providers c. Medical Devices & Products d. Medical Product Distribution e. Specialty Providers f. Pharma Services g. Practice Management
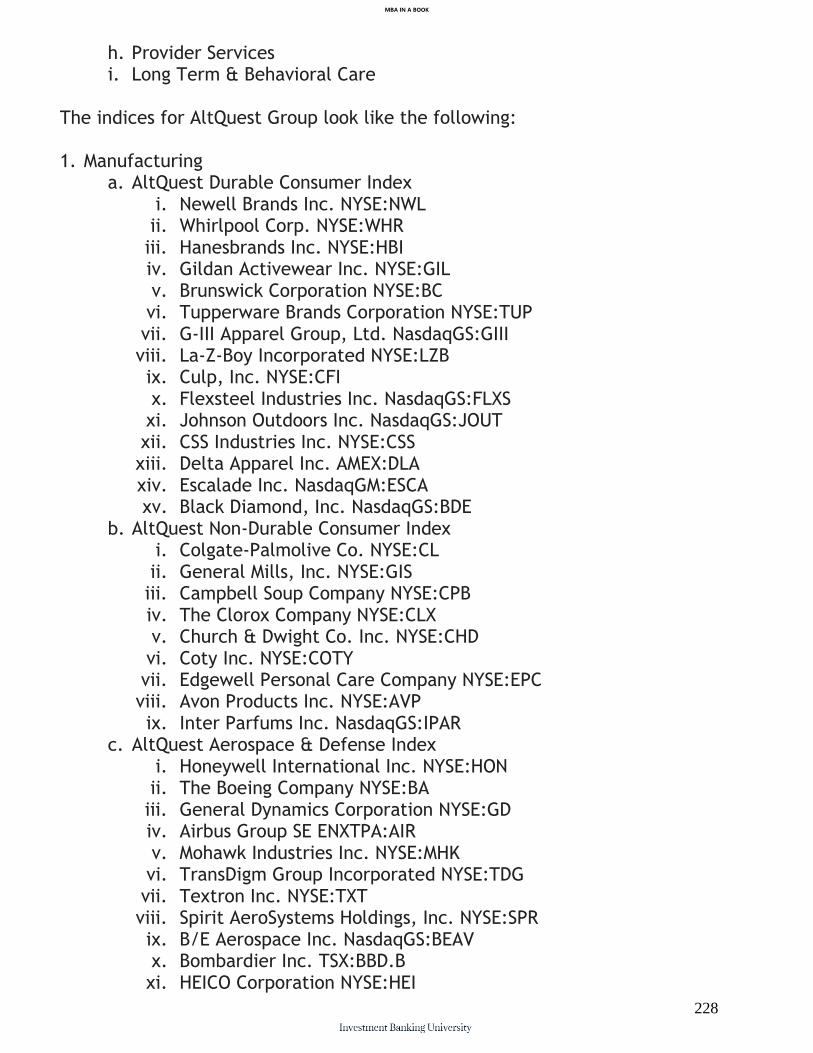
MBA IN A BOOK
228
h. Provider Services i. Long Term & Behavioral Care
The indices for AltQuest Group look like the following: 1. Manufacturing
a. AltQuest Durable Consumer Index i. Newell Brands Inc. NYSE:NWL ii. Whirlpool Corp. NYSE:WHR iii. Hanesbrands Inc. NYSE:HBI iv. Gildan Activewear Inc. NYSE:GIL v. Brunswick Corporation NYSE:BC vi. Tupperware Brands Corporation NYSE:TUP vii. G-III Apparel Group, Ltd. NasdaqGS:GIII viii. La-Z-Boy Incorporated NYSE:LZB ix. Culp, Inc. NYSE:CFI x. Flexsteel Industries Inc. NasdaqGS:FLXS xi. Johnson Outdoors Inc. NasdaqGS:JOUT xii. CSS Industries Inc. NYSE:CSS xiii. Delta Apparel Inc. AMEX:DLA xiv. Escalade Inc. NasdaqGM:ESCA xv. Black Diamond, Inc. NasdaqGS:BDE
b. AltQuest Non-Durable Consumer Index i. Colgate-Palmolive Co. NYSE:CL ii. General Mills, Inc. NYSE:GIS iii. Campbell Soup Company NYSE:CPB iv. The Clorox Company NYSE:CLX v. Church & Dwight Co. Inc. NYSE:CHD vi. Coty Inc. NYSE:COTY vii. Edgewell Personal Care Company NYSE:EPC viii. Avon Products Inc. NYSE:AVP ix. Inter Parfums Inc. NasdaqGS:IPAR
c. AltQuest Aerospace & Defense Index i. Honeywell International Inc. NYSE:HON ii. The Boeing Company NYSE:BA iii. General Dynamics Corporation NYSE:GD iv. Airbus Group SE ENXTPA:AIR v. Mohawk Industries Inc. NYSE:MHK vi. TransDigm Group Incorporated NYSE:TDG vii. Textron Inc. NYSE:TXT viii. Spirit AeroSystems Holdings, Inc. NYSE:SPR ix. B/E Aerospace Inc. NasdaqGS:BEAV x. Bombardier Inc. TSX:BBD.B xi. HEICO Corporation NYSE:HEI
MBA IN A BOOK
229
xii. Curtiss-Wright Corporation NYSE:CW xiii. Esterline Technologies Corp. NYSE:ESL xiv. Triumph Group, Inc. NYSE:TGI xv. RBC Bearings Inc. NasdaqGS:ROLL xvi. Aerojet Rocketdyne Holdings, Inc. NYSE:AJRD xvii. Ducommun Inc. NYSE:DCO
d. AltQuest Building Products Index i. Mohawk Industries Inc. NYSE:MHK ii. USG Corporation NYSE:USG iii. Armstrong World Industries, Inc. NYSE:AWI iv. Advanced Drainage Systems, Inc. NYSE:WMS v. Apogee Enterprises, Inc. NasdaqGS:APOG vi. Builders FirstSource, Inc. NasdaqGS:BLDR vii. American Woodmark Corp. NasdaqGS:AMWD viii. Gibraltar Industries, Inc. NasdaqGS:ROCK ix. Continental Building Products, Inc. NYSE:CBPX x. Insteel Industries Inc. NasdaqGS:IIIN xi. Armstrong Flooring, Inc. NYSE:AFI
e. AltQuest Industrial Index i. United Technologies Corporation NYSE:UTX ii. Illinois Tool Works Inc. NYSE:ITW iii. Eaton Corporation plc NYSE:ETN iv. Ingersoll-Rand Plc NYSE:IR v. Parker-Hannifin Corporation NYSE:PH vi. Rockwell Automation Inc. NYSE:ROK vii. Crane Co. NYSE:CR viii. Hubbell Inc. NYSE:HUBB ix. Colfax Corporation NYSE:CFX x. Barnes Group Inc. NYSE:B xi. Actuant Corporation NYSE:ATU xii. Albany International Corp. NYSE:AIN xiii. EnPro Industries, Inc. NYSE:NPO xiv. Chart Industries Inc. NasdaqGS:GTLS xv. Columbus McKinnon Corporation NasdaqGS:CMCO
f. AltQuest Medical Index i. Medtronic plc NYSE:MDT ii. DENTSPLY SIRONA Inc. NasdaqGS:XRAY iii. Hologic Inc. NasdaqGS:HOLX iv. Abaxis, Inc. NasdaqGS:ABAX v. Analogic Corporation NasdaqGS:ALOG vi. Integer Holdings Corporation NYSE:ITGR vii. AngioDynamics Inc. NasdaqGS:ANGO viii. Misonix, Inc. NasdaqGM:MSON ix. Amedica Corporation NasdaqCM:AMDA
MBA IN A BOOK
230
x. Allied Healthcare Products Inc. NasdaqCM:AHPI 2. Software
a. AltQuest Traditional Software Index b. AltQuest SAAS Index
i. 2U TWOU NasdaqGS ii. Amber Road AMBR NYSE iii. Athenahealth ATHN NasdaqGS iv. Bazaarvoice BV NasdaqGS v. Benefitfocus BNFT NasdaqGS vi. Callidus Software CALD NasdaqGM vii. Castlight Health CSLT NYSE viii. ChannelAdvisors ECOM NYSE ix. Cornerstone OnDemand CSOD NasdaqGS x. Covisint COVS NasdaqGS xi. Ebix EBIX NasdaqGS xii. FireEye FEYE NasdaqGS xiii. Fleetmatics FLTX NYSE xiv. HortonWorks HDP NasdaqGS xv. HubSpot HUBS NYSE xvi. inContact SAAS NasdaqCM xvii. IntraLinks Holdings IL NYSE xviii. J2 Global JCOM NasdaqGS xix. Jive Software JIVE Nasdaq xx. Live Person LPSN NasdaqGS xxi. Marin Software MRIN NYSE xxii. Medical Transcript MTBC NasdaqCM xxiii. Medidata Solutions MDSO Nasdaq xxiv. Netsuite N NYSE xxv. New Relic NEWR NYSE xxvi. Paylocity Holding PCTY NasdaqGS xxvii. Q2 Holdings QTWO NYSE xxviii. Qualys QLYS NasdaqGS xxix. RealPage RP Nasdaq xxx. RingCentral RNG NYSE xxxi. Salesforce.com CRM NYSE xxxii. Service-now.com NOW NYSE xxxiii. SPS Commerce SPSC NasdaqGS xxxiv. Tableau Software DATA NYSE xxxv. Tangoe TNGO NasdaqGS xxxvi. The Ultimate Software Group ULTI NasdaqGS xxxvii. TrueCar TRUE NasdaqGS xxxviii. Upland Software UPLD NasdaqGM xxxix. Veeva Systems VEEV NYSE
c. AltQuest Internet Index

MBA IN A BOOK
231
i. 1-800-FLOWERS.com FLWS NasdaqGS ii. 58.com WUBA NYSE iii. 8x8 EGHT NasdaqGS iv. Akamai Technologies AKAM NasdaqGS v. Alibaba BABA NYSE vi. Amazon.com AMZN NasdaqGS vii. Angie's List ANGI NasdaqGS viii. Baidu.com BIDU NasdaqGS ix. Bankrate RATE NYSE x. Bitauto Holdings BITA NYSE xi. BlueNile NILE NasdaqGS xii. Brightcove BCOV NasdaqGS xiii. BroadSoft BSFT NasdaqGS xiv. Carbonite CARB NasdaqGS xv. Care.com CRCM NYSE xvi. ChangYou.com CYOU NasdaqGS xvii. Chegg CHGG NYSE xviii. Cimpress CMPR NasdaqGS xix. Coupons.com QUOT NYSE xx. Criteo SA CRTO NasdaqGS xxi. Ctrip CTRP NasdaqGS xxii. DemandMedia DMD NYSE xxiii. eBay EBAY NasdaqGS xxiv. eHealth EHTH NasdaqGS xxv. Everyday Health EVDY NYSE xxvi. Expedia EXPE NasdaqGS xxvii. Facebook FB NasdaqGS xxviii. GoDaddy GDDY NYSE xxix. Google GOOG NasdaqGS xxx. Groupon GRPN NasdaqGS xxxi. GrubHub GRUB NYSE xxxii. Harmonic HLIT NasdaqGS xxxiii. Interactive Intelligence ININ NasdaqGS xxxiv. LendingClub LC NYSE xxxv. LifeLock LOCK NYSE xxxvi. Limelight Networks LLNW NasdaqGS xxxvii. LinkedIn LNKD NYSE xxxviii. Liquidity Services LQDT NasdaqGS xxxix. Mail.ru Group 61HE.L LSE
xl. MakeMyTrip MMYT NasdaqGS xli. MaxPoint Interactive MXPT NasdaqGM xlii. Mercadolibre MELI NasdaqGS xliii. Mitel Networks MITL NasdaqGS xliv. Monster Worldwide MWW NYSE
MBA IN A BOOK
232
xlv. NCSoft 036570.KS KSE xlvi. Netease NTES NasdaqGS xlvii. Netflix NFLX NasdaqGS xlviii. Overstock.com OSTK NasdaqGS xlix. Pandora P NYSE
l. PetMed Express PETS NasdaqGS li. Priceline PCLN NasdaqGS lii. QuinStreet QNST NasdaqGS liii. Renren RENN NYSE liv. Rocket Fuel FUEL NasdaqGS lv. SeaChange International SEAC NasdaqGS lvi. ShoreTel SHOR NasdaqGS lvii. Shutterfly SFLY NasdaqGS lviii. Shutterstock SSTK NYSE lix. SINA SINA NasdaqGS lx. Sohu.com SOHU lxi. Sonus Networks SONS NasdaqGS lxii. Stamps.com STMP NasdaqGS lxiii. Synacor SYNC NasdaqGS lxiv. Tencent Holdings NNN1.F lxv. The Rubicon Project RUBI NYSE lxvi. TheStreet.com TST NasdaqGM lxvii. Travelzoo TZOO NasdaqGS lxviii. Lending Tree TREE NasdaqGS lxix. Tremor TRMR NYSE lxx. TripAdvisor TRIP NasdaqGS lxxi. TubeMogul TUBE NasdaqGS lxxii. Tucows TCX NasdaqCM lxxiii. Twitter TWTR NYSE lxxiv. VeriSign VRSN NasdaqGS lxxv. WebMD Health WBMD NasdaqGS lxxvi. Wix.com WIX NasdaqGS lxxvii. XO Group XOXO NYSE lxxviii. Xunlei XNET NasdaqGS lxxix. Yahoo! YHOO NasdaqGS lxxx. Yandex YNDX NasdaqGS lxxxi. Yelp YELP NYSE lxxxii. YuMe YUME NYSE lxxxiii. YY YY NasdaqGS lxxxiv. Zillow Z NasdaqGS
3. Business Services a. AltQuest Education & Training Index
i. Graham Holdings Company NYSE:GHC ii. GP Strategies Corp. NYSE:GPX

MBA IN A BOOK
233
iii. Pearson plc LSE:PSON iv. John Wiley & Sons Inc. NYSE:JW.A v. Capella Education Co. NasdaqGS:CPLA vi. Bridgepoint Education, Inc. NYSE:BPI vii. Strayer Education Inc. NasdaqGS:STRA viii. K12, Inc. NYSE:LRN ix. DeVry Education Group Inc. NYSE:DV x. Career Education Corp. NasdaqGS:CECO
b. AltQuest Business Process Outsourcing Index i. Wipro Ltd. BSE:507685 ii. Cognizant Technology Solutions Corporation NasdaqGS:CTSH iii. Sykes Enterprises, Incorporated NasdaqGS: SYKE iv. Convergys Corporation NYSE: CVG v. West Corporation NasdaqGS:WSTC vi. TeleTech Holdings Inc. NasdaqGS:TTEC vii. Virtusa Corporation NasdaqGS:VRTU viii. Unisys Corporation NYSE:UIS
c. AltQuest Facility Services and Industrial Services Index i. Cintas Corporation NasdaqGS:CTAS ii. ABM Industries Incorporated NYSE:ABM iii. SP Plus Corporation NasdaqGS:SP iv. Aramark NYSE:ARMK v. Iron Mountain Incorporated NYSE:IRM vi. UniFirst Corp. NYSE:UNF vii. FirstService Corporation TSX:FSV viii. Waste Management, Inc. NYSE:WM ix. Republic Services, Inc. NYSE:RSG x. Waste Connections US, Inc. NYSE:WCN xi. Stericycle, Inc. NasdaqGS:SRCL xii. US Ecology, Inc. NasdaqGS:ECOL xiii. Casella Waste Systems Inc. NasdaqGS:CWS xiv. Covanta Holding Corporation NYSE:CVA xv. Clean Harbors, Inc. NYSE:CLH xvi. United Rentals, Inc. NYSE:URI xvii. H&E Equipment Services Inc. NasdaqGS:HEES xviii. CECO Environmental Corp. NasdaqGS:CECE xix. Team, Inc. NYSE:TISI
d. AltQuest Human Resources Index i. Robert Half International Inc. NYSE:RHI ii. ManpowerGroup Inc. NYSE:MAN iii. WageWorks, Inc. NYSE:WAGE iv. On Assignment Inc. NYSE:ASGN v. 51job Inc. NasdaqGS:JOBS vi. Insperity, Inc. NYSE:NSP
MBA IN A BOOK
234
vii. TriNet Group, Inc. NYSE:TNET viii. Korn/Ferry International NYSE:KFY ix. TrueBlue, Inc. NYSE:TBI x. Kelly Services, Inc. NasdaqGS:KELY.A xi. Kforce Inc. NasdaqGS:KFRC xii. Automatic Data Processing, Inc. NasdaqGS:ADP xiii. Heidrick & Struggles International Inc. NasdaqGS:HSII
e. AltQuest Information Services Index i. Thomson Reuters Corporation TSX:TRI ii. Acxiom Corporation NasdaqGS:ACXM iii. Gartner Inc. NYSE:IT iv. Alliance Data Systems Corporation NYSE:ADS v. The Dun & Bradstreet Corporation NYSE:DNB vi. comScore, Inc. NasdaqGS:SCOR vii. Fair Isaac Corporation NYSE:FICO viii. Experian plc LSE:EXPN ix. Equifax Inc. NYSE:EFX x. The Advisory Board Company NasdaqGS:ABC xi. Verisk Analytics, Inc. NasdaqGS:VRSK xii. CoreLogic, Inc. NYSE:CLGX xiii. CoStar Group Inc. NasdaqGS:CSGP xiv. FactSet Research Systems Inc. NYSE:FDS xv. Moody's Corporation NYSE:MCO xvi. Forrester Research Inc. NasdaqGS:FORR xvii. IHS Markit Ltd. NasdaqGS:INFO
f. AltQuest Marketing Services Index i. WPP plc LSE:WPP ii. Omnicom Group Inc. NYSE:OMC iii. Publicis Groupe SA ENXTPA:PUB iv. The Interpublic Group of Companies, Inc. NYSE:IPG v. MDC Partners Inc. NasdaqGS:MDCA vi. InnerWorkings Inc. NasdaqGS:INWK vii. Ipsos SA ENXTPA:IPS viii. UBM plc LSE:UBM
g. AltQuest Real Estate Services Index i. CBRE Group, Inc. NYSE:CBG ii. CoStar Group Inc. NAsdaqGS: CSGP iii. Jones Lang LaSalle Incorporated NYSE:JLL iv. Realogy Holdings Corp. NYSE:RLGY v. SouFun Holdings Ltd. NYSE: SFUN vi. NM Kennedy-Wilson Holdings, Inc. NYSE:KW vii. E-House (China) Holdings Limited NYSE:EJ viii. RE/MAX Holdings, Inc. NYSE:RMAX ix. Altisource Portfolio Solutions S.A. NasdaqGS:ASPS
MBA IN A BOOK
235
h. AltQuest IT Services Index i. International Business Machines Corporation NYSE:IBM ii. Accenture plc NYSE:ACN iii. Cognizant Technology Solutions Corporation NasdaqGS:CTSH iv. CGI Group Inc. TSX:GIB.A v. Booz Allen Hamilton Holding Corporation NYSE:BAH vi. Leidos Holdings, Inc. NYSE:LDOS vii. Teradata Corporation NYSE:TDC viii. EPAM Systems, Inc. NYSE:EPAM ix. Interxion Holding NV NYSE:INXN x. CACI International Inc. NYSE:CACI xi. ManTech International Corporation NasdaqGS:MAN xii. Virtusa Corporation NasdaqGS:VRTU xiii. The Hackett Group, Inc. NasdaqGS:HCKT xiv. Unisys Corporation NYSE:UIS xv. ServiceSource International, Inc. NasdaqGS:SREV
i. AltQuest Specialty Consulting Index i. CEB Inc. NYSE:CEB ii. FTI Consulting, Inc. NYSE:FCN iii. Exponent Inc. NasdaqGS:EXPO iv. The Advisory Board Company NasdaqGS:ABC v. Huron Consulting Group Inc. NasdaqGS:HUR vi. ICF International Inc. NasdaqGS:ICFI vii. Navigant Consulting Inc. NYSE:NCI viii. Resources Connection, Inc. NasdaqGS:RECN ix. CBIZ, Inc. NYSE:CBZ
4. Healthcare a. AltQuest Dental Product Index
i. Zimmer Biomet Holdings, Inc. NYSE:ZBH ii. DENTSPLY SIRONA Inc. NasdaqGS:XRAY iii. Henry Schein, Inc. NasdaqGS:HSIC iv. Align Technology Inc. NasdaqGS:ALGN v. Patterson Companies, Inc. NasdaqGS:PDCO vi. Cantel Medical Corp. NYSE:CMN vii. BIOLASE, Inc. NasdaqCM:BIOL viii. Milestone Scientific Inc. AMEX:MLSS ix. Pro-Dex Inc. NasdaqCM:PDEX
b. AltQuest Dental Providers Index i. Birner Dental Management Service OTCPK:BDMS
c. AltQuest Medical Devices & Products Index i. Medtronic plc NYSE:MDT ii. Abbott Laboratories NYSE:ABT iii. Stryker Corporation NYSE:SYK iv. Becton, Dickinson and Company NYSE:BDX

MBA IN A BOOK
236
v. Boston Scientific Corporation NYSE:BSX vi. Baxter International Inc. NYSE:BAX vii. Intuitive Surgical, Inc. NasdaqGS:ISRG viii. Zimmer Biomet Holdings, Inc. NYSE:ZBH ix. St. Jude Medical Inc. NYSE:STJ x. Edwards Lifesciences Corp. NYSE:EW xi. CR Bard Inc. NYSE:BCR xii. ABIOMED, Inc. NasdaqGS:ABMD xiii. Integra LifeSciences Holdings Corporation NasdaqGS:IART xiv. Wright Medical Group N.V. NasdaqGS:WMGI xv. Johnson & Johnson NYSE:JNJ
d. AltQuest Medical Product Distribution Index i. Danaher Corp. NYSE:DHR ii. Stryker Corporation NYSE:SYK iii. McKesson Corporation NYSE:MCK iv. Cardinal Health, Inc. NYSE:CAH v. AmerisourceBergen Corporation NYSE:ABC vi. Henry Schein, Inc. NasdaqGS:HSIC vii. Patterson Companies, Inc. NasdaqGS:PDCO viii. Owens & Minor Inc. NYSE:OMI ix. PharMerica Corporation NYSE:PMC x. Aceto Corp. NASDAQGS:ACET
e. AltQuest Specialty Providers Index i. Fresenius Medical Care AG & Co… NYSE:FMS ii. DaVita HealthCare Partners Inc. NYSE:DVA iii. MEDNAX, Inc. NYSE:MD iv. AmSurg Corp. NasdaqGS:AMSG v. HEALTHSOUTH Corp. NYSE:HLS vi. Surgical Care Affiliates, Inc. NasdaqGS:SCAI vii. American Renal Associates Holdings, NYSE:ARA viii. Adeptus Health Inc. NYSE:ADPT ix. LHC Group, Inc. NasdaqGS:LHCG x. AAC Holdings, Inc. NYSE:AAC
f. AltQuest Pharma Services Index i. CVS Health Corporation NYSE:CVS ii. Express Scripts Holding Company NASDAQGS:ESRX iii. Perrigo Company plc NYSE:PRGO iv. Allscripts Healthcare Solutions, Inc. NasdaqGS:MDRX v. Magellan Health, Inc. NasdaqGS:MGLN
g. AltQuest Practice Management Index i. WellCare Health Plans, Inc. NYSE:WCG ii. HealthEquity, Inc. NasdaqGS:HQY iii. Team Health Holdings, Inc. NYSE:TMH
h. AltQuest Provider Services Index
MBA IN A BOOK
237
i. Cerner Corporation NasdaqGS:CERN ii. Healthcare Services Group Inc. NasdaqGS:HCSG iii. HMS Holdings Corp. NasdaqGS:HMSY iv. The Advisory Board Company NasdaqGS:ABCO v. Omnicell, Inc. NasdaqGS:OMCL vi. Evolent Health, Inc. NYSE:EVH vii. Providence Service Corp. NasdaqGS:PRSC
i. AltQuest Long Term & Behavioral Care Index i. National HealthCare Corporation AMEX:NHC ii. The Ensign Group, Inc. NasdaqGS:ENSG iii. Civitas Solutions, Inc. NYSE:CIVI iv. Acadia Healthcare Company, Inc. NasdaqGS:ACHC v. SunLink Health Systems Inc. AMEX:SSY vi. AAC Holdings, Inc. NYSE:AAC
The investment banker then spreads each public comp and the financial data feeds into the median and average for the vertical and sub-vertical which ultimately ends up in the research (industry report, newsletter), pitchbooks, and CIMs of the investment bank. For investment banks with an equity research department, financial statement models will be built for each public comp that is being covered and consensus EPS data taken from research reports will be used to establish the value of the public comp. The investment banker ultimately uses the vertical index and sub-vertical index to perform proprietary research and develop industry reports and newsletters which will aid in coverage and ultimately origination. The research, which we will go into greater detail on later in the book focuses on vertical and sub-vertical trends in margins, multiples, and M&A. After establishing one's coverage and then building an index for the vertical and sub-vertical as well as establishing relationships with strategic and financial buyers within the vertical and sub-vertical, the investment banker may begin advising targets on their strategic alternatives using information gleaned from the vertical and sub-vertical indices. Regarding the vertical index and sub-vertical index, the investment banker ultimately tracks trends in: Growth rates Margins Debt to Equity Multiples

MBA IN A BOOK
238
The investment banker takes the index and establishes tiers which turn into peer groups. This is why we pull public comps; to benchmark a target against the comps. By comparing a target's level of performance to it's peers and the industry in general the investment banker can determine when it is ideal to exit the business (when multiples are strong) and when it is not (when multiples are weak). This is how investment bankers advise on strategic alternatives. How to Advise on Strategic Alternatives? After establishing one's coverage and then building an index for the vertical and sub-vertical as well as establishing relationships with strategic and financial buyers within the vertical and sub-vertical, the investment banker may begin advising targets on their strategic alternatives using information gleaned from the vertical and sub-vertical indices. Regarding the vertical index and sub-vertical index, the investment banker ultimately tracks trends in: Growth rates Margins Debt to Equity Multiples The investment banker takes the index and establishes tiers which turn into peer groups. This is why we pull public comps; to benchmark a target against the comps. By comparing a target's level of performance to it's peers and the industry in general the investment banker can determine when it is ideal to exit the business (when multiples are strong) and when it is not (when multiples are weak). This is how investment bankers advise on strategic alternatives.
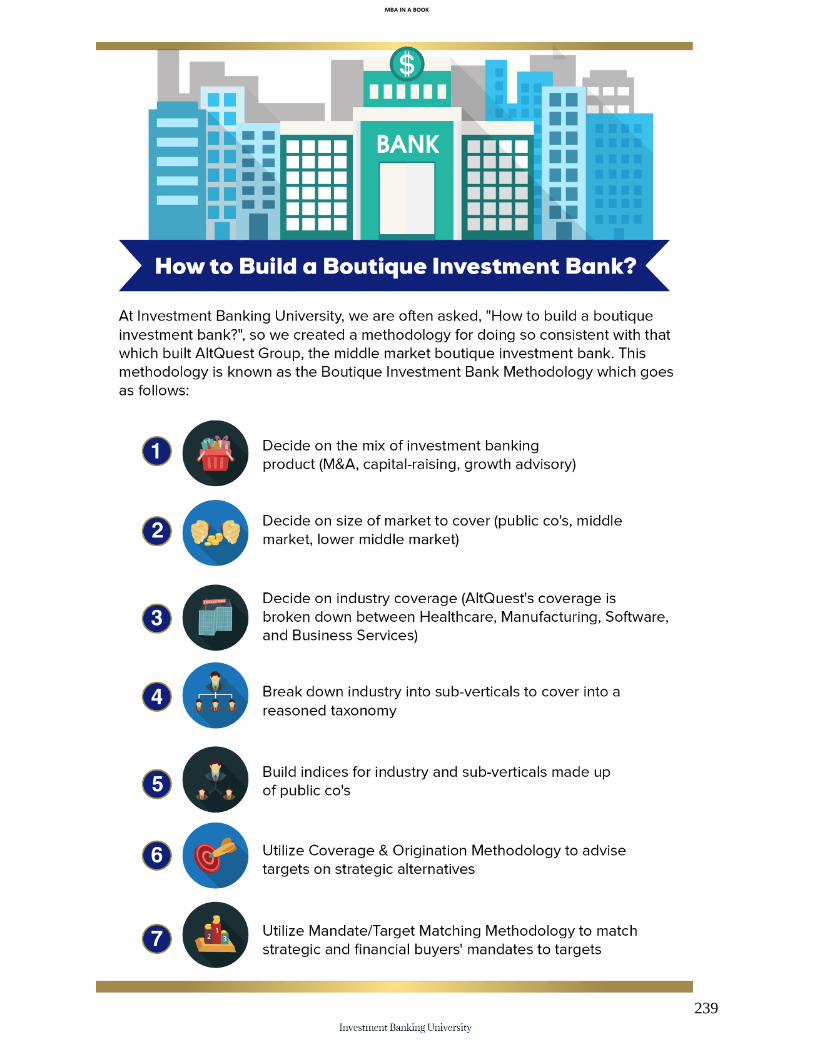
MBA IN A BOOK
239
MBA IN A BOOK
240
Chapter 57:
Running the Boutique Investment Bank
In building AltQuest’s initial book of business, we sent over 2,000 emails to our initial coverage group, industrials/manufacturers. The response rate was approximately 2%. Of those that responded approximately 50% were interested in seller and 50% were interested in taking an offer on their business. Of those that were interested in selling their business, approximately 50% accepted our fee agreement. When first starting the M&A firm, majority of time should be spent originating sell side mandates. Once the investment banker gets to 20 sell side mandates, one can ease up on origination and transfer those responsibilities to analysts and associates hired as interns which then turn into full time analysts/associates. This means that all of the investment banker’s time will now be spent in M&A execution with sell-side pitches from time to time when the analyst/associate originates an opportunity. Good analysts and associates will originate 2 to 3 sell-side pitch opportunities per week so the investment banker will stay busy on the phone with these CEOs/Founders/Partners. Realistically it will take a year to a year and a half to close your first deal if you are just starting out in M&A. If you have been in M&A and have a book of business, the timeframe shortens to the typical time it takes to close a deal which is shown below. It is important for the M&A professional to plan for this extended time frame and not to get discouraged when deals blow up, get delayed, or change. All deals associated with an actual perpetuity close, it is just a matter of time.
MBA IN A BOOK
241
Building an Investment Banking Practice: It will take a year of pulling emails with coverage, emailing everyday getting 2% response rate, and landing engagements to get to 20 M&A engagements. Year 1 & 2 is spent in data mining and emailing (coverage capability) as well as building out the analyst and associate team to do the same coverage. Year 3 is focused on qualifying buyers, buyer seller meetings and closing deals. AltQuest's coverage is manufacturing, healthcare, business services, and software in Texas, Florida, New York, and California.
MBA IN A BOOK
242
Part XII: Investment Banking Deliverables Investment banking requires a certain set of deliverables from coverage, to origination through sell side representation.

MBA IN A BOOK
243
Chapter 58:
Investment Banking Deliverables Investment banking deliverables include the following in order from left to right:
I. Pitchbook (origination) – the pitchbook is a piece of marketing material that aids the investment banker in winning an M&A mandate. The pitchbook goes through and analyzes multiples in the given industry as well as likely buyers in the industry.
II. Adjusted EBITDA – adjusted EBITDA is the proxy for cash flow that we are using to determine the valuation of the perpetuity.
III. Valuation – valuation is the value of the company that the investment banker uses to price the company in the perpetuity marketplace
IV. Teaser & CIM (sell side mandate) V. LOI VI. Purchase Agreement VII. Due Diligence VIII. Financial Statements from Target Company

MBA IN A BOOK
244
Chapter 58:
Pitchbook As mentioned earlier, the pitchbook is an origination document meant to win
sell side business for the investment bank.
MBA IN A BOOK
245
Chapter 59: Adjusted EBITDA After receiving the financials for the target, the investment banker must
calculate adjusted EBITDA. EBITDA and Total Owners Benefits (TOB) are
proxies for cash flow but not true cash flow of the business as there will be
CAPEX and working capital deducted to get to true cash flow. Total Owners
Benefit adds back taxes, interest, depreciation and owners benefit.
The calculation for EBITDA looks like the following:
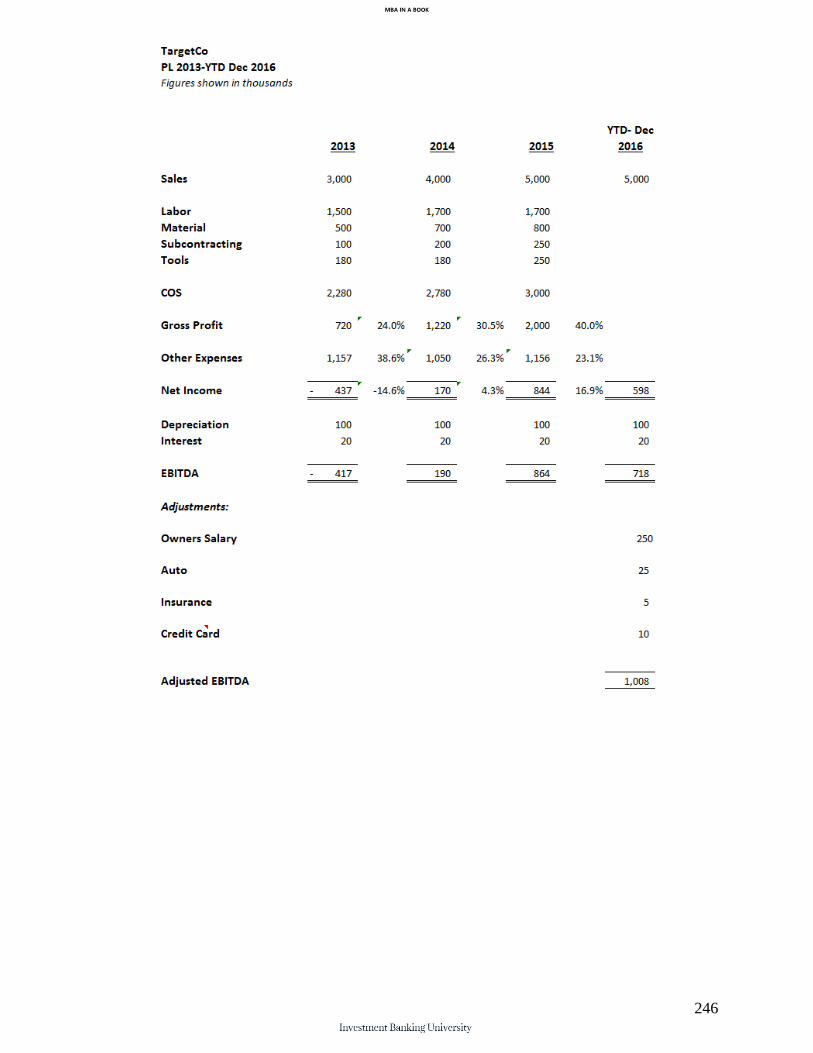
MBA IN A BOOK
246
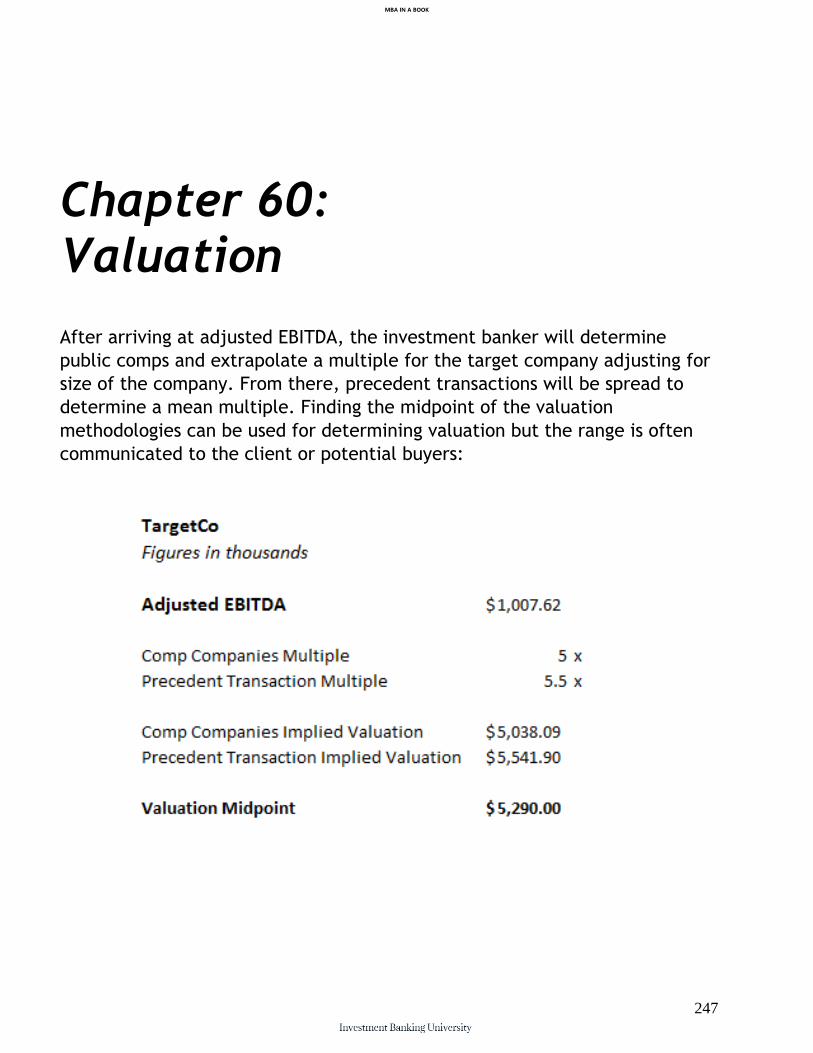
MBA IN A BOOK
247
Chapter 60: Valuation After arriving at adjusted EBITDA, the investment banker will determine
public comps and extrapolate a multiple for the target company adjusting for
size of the company. From there, precedent transactions will be spread to
determine a mean multiple. Finding the midpoint of the valuation
methodologies can be used for determining valuation but the range is often
communicated to the client or potential buyers:

MBA IN A BOOK
248
Chapter 61: Teaser After finding adjusted EBITDA and determining valuation, the investment
banker can build the marketing material for the target company which
includes a teaser and a CIM. The teaser can be broken down in the following
manner:
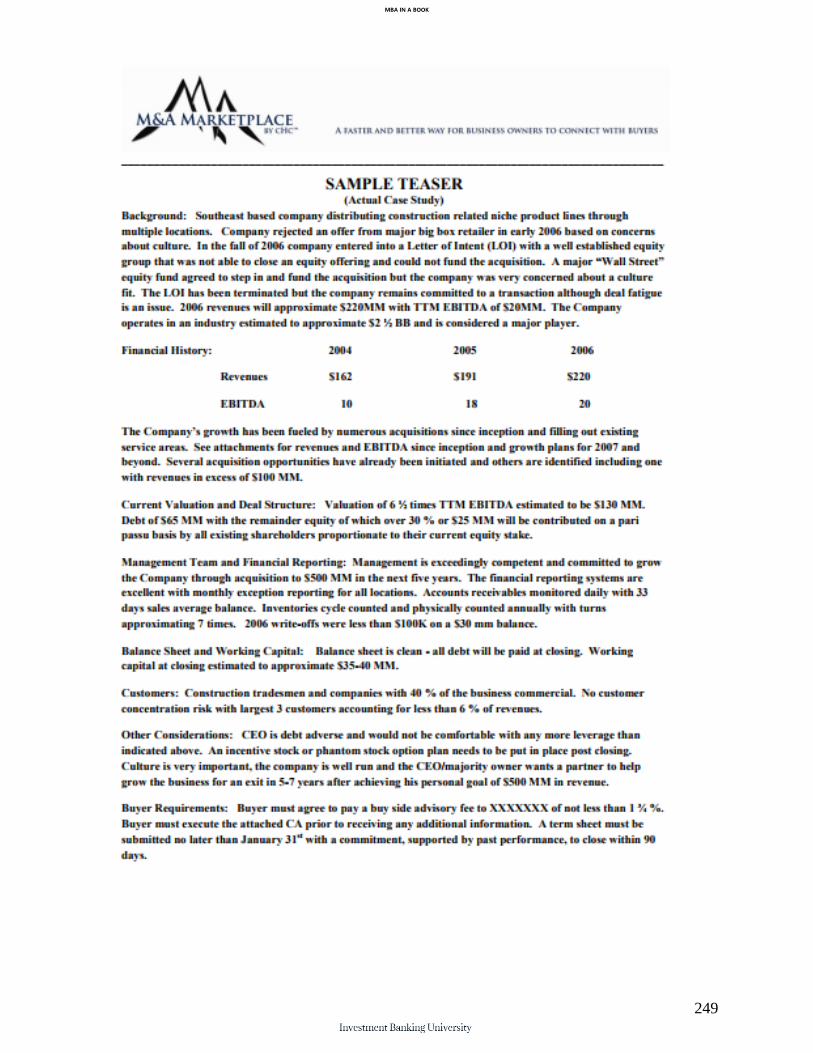
MBA IN A BOOK
249

MBA IN A BOOK
250

MBA IN A BOOK
251
Chapter 62: CIM (Confidential Information Memorandum) After creating the teaser, the investment banker goes into greater detail in a
marketing document called a CIM. This document is distributed to buyers
after the teaser and is for the serious buyers to do an in depth analysis of the
target.
The CIM is the primary marketing document associated with sell side M&A.
The document is filled with information on the target company including
products/services, financials and markets. The teaser comes before the CIM
and the NDA must be signed in order to get the CIM.
The typical breakdown of a CIM goes along the following lines:
1) Overview and Key Investment Highlights
2) Products and Services
3) Market
4) Sales & Marketing
5) Management Team
6) Financial Results and Projections
7) Appendices
MBA IN A BOOK
252

MBA IN A BOOK
253
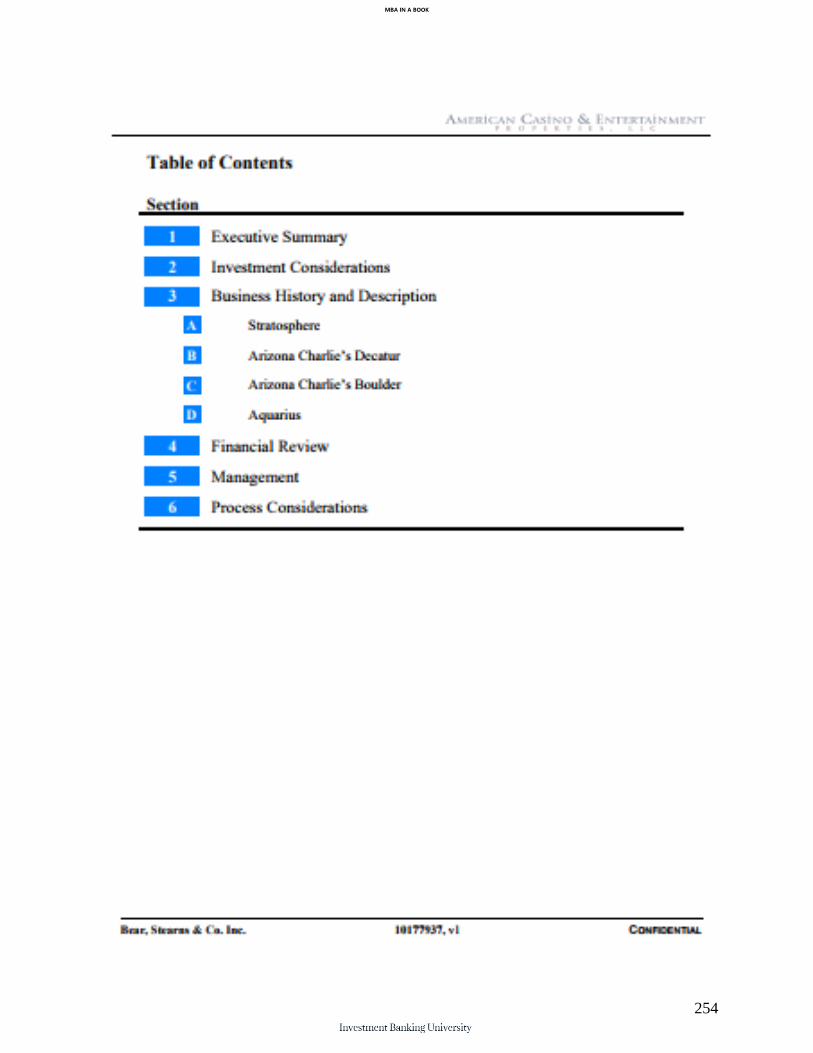
MBA IN A BOOK
254
MBA IN A BOOK
255
Chapter 63: Letter of Intent (LOI) The LOI is non-binding except for a few terms: Non-disclosure No shop clause LOI states terms of what the deal will look like and then allows the buyer time to verify the information presented and creates a roadmap for attorneys to craft the final purchase agreement. Price and structure should be settled in the LOI without negotiation left afterwards. Details should include: a. Seller note b. Earn out c. Compensation agreement for seller if staying on d. Status of net working capital items e. New ownership cap table is seller is retaining ownership
MBA IN A BOOK
256
Chapter 64: Purchase Agreement After the strategic or financial buyer decides to draft an LOI and proceed with
an acquisition of a given target, the purchase agreement will need to be
drafted. In the LMM, the investment banker may draft the agreement
himself/herself, but as transactions get larger, M&A attorneys will be involved
and take the lead with the creation of the purchase agreement. The
investment banker will stay actively involved in the drafting of the
agreement.
While due diligence is going on, attorneys take boilerplate purchase
agreement and modify them to include items of the LOI.
Once due diligence is complete, the purchase agreement should be done for
closing.
MBA IN A BOOK
257
Chapter 65: Due Diligence LOI to accept price and terms. Due diligence is open book time where buyer investigates the business to see if it is how the seller represented it. SMB due diligence: Standard asset purchase agreement is provided by M&A professional and contingencies for due diligence placed in the contract. A buyer agrees to purchase the company provided the conditions are met. Due diligence items are checked off in writing as they are dealt with and a binding contract is remaining so you are ready to close. Ex. The “book check” is done by the buyer or CPA You can use Dropbox or Google Docs LMM and MM Due Diligence: Begins with IOI or non-binding LOI. The definitive purchase agreement is not created until after due diligence. Use V-rooms or Firmex Usually takes 60-90 days The definitive purchase agreement is written to address issues discovered in due diligence, otherwise is boilerplate.

MBA IN A BOOK
258
Chapter 66: Minimum Financials to Do a Deal The minimum amount of financials to get a deal done is the following:
2. Last three years P&L
3. Year To date (YTD) P&L
4. Last Twelve Months (LTM) adjusted EBITDA to price an offer
This should be easy to get if the owner has QuickBooks Or Another Accounting
Software.

MBA IN A BOOK
259
BUY-SIDE
For those that have already built perpetuities and their representation, there is another category known as the buy-side. The buy-side is made up of financial (private equity) and strategic buyers (corporate).

MBA IN A BOOK
260
Part I:
How to Buy a Perpetuity?
On the buy-side, we are concerned with the purchasing of perpetuities.
MBA IN A BOOK
261
Chapter 67:
The Principle of Investing
The principle of investing is to only invest in perpetuities or in risk free
assets. The key is to determine whether the company/opportunity is a
perpetuity or not. We are going to employ financial statement modeling and
valuation to make this determination. Financial statement modeling begins
with the building of the operating model of the company.
After determining whether the company/opportunity is a perpetuity, strategic
and financial buyers attempt to maximize the difference between NPV (as
measured by DCF) of the company/opportunity and the contributed capital to
acquire the opportunity. The difference between these two is the real wealth
transfer from the seller to the buyer in today’s dollars. For example, if the
NPV (i.e. intrinsic value) of a company is $100M based upon a DCF and the
acquirer actually purchases the asset for $75M, the acquirer has received a
transfer of wealth from the seller to the buyer in the amount of $25M in
today’s dollars. This is the game of buying perpetuities.
Wealth Increase in Today’s Dollars From Opportunity/Company (Margin
of Safety) = DCF NPV – Contributed Capital
One can further maximize their returns by employing leverage in the form of
OPM (other people’s money). Ideally, the financial or strategic buyer would
continue to make such acquisitions using separate entities (i.e. SPVs) allowing
them to use debt financing for each as well as public equity/LP capital.

MBA IN A BOOK
262
MBA IN A BOOK
263
Chapter 68:
How to Become the Next Warren Buffett
In order to become the next Warren Buffett, you should first understand the
nature of the perpetuity, which is the basis for finance and his approach.
Finance is the set of concepts, methodologies, and optimization models
associated with the perpetuity. The perpetuity can be modeled with the
following formula:
Perpetuity value = CF / r
Where CF represents the benefit stream associated with the perpetuity and r
represents the discount rate associated with the perpetuity’s risk of receiving
the benefit stream.
All finance content can be broken down in relation to the perpetuity, namely:
Build-side – the building of perpetuities (entrepreneurs, corporations)
Sell-side – the selling of perpetuities (investment bankers, Wall Street)
MBA IN A BOOK
264
Buy-side – the buying of perpetuities (private equity, corporate M&A)
The principle of investing (and Buffett's approach) is to only invest in
perpetuities or in risk free assets. The key is to determine whether the
company/opportunity is a perpetuity or not. We are going to employ financial
statement modeling and valuation to make this determination. Financial
statement modeling begins with the building of the operating model of the
company.
Warren Buffett often speaks of a margin of safety. After determining whether
the company/opportunity is a perpetuity, strategic and financial buyers
attempt to maximize the difference between NPV (as measured by DCF) of
the company/opportunity and the contributed capital to acquire the
opportunity. The difference between these two is the real wealth transfer
from the seller to the buyer in today’s dollars. For example, if the NPV (i.e.
intrinsic value) of a company is $100M based upon a DCF and the acquirer
actually purchases the asset for $75M, the acquirer has received a transfer of
wealth from the seller to the buyer in the amount of $25M in today’s dollars.
This is the game of buying perpetuities.
Wealth Increase in Today’s Dollars From Opportunity/Company (Margin of
Safety) = DCF NPV – Contributed Capital
So we are either going to purchase perpetuities or not invest (i.e. risk free
assets). The larger the perpetuity the better. Characteristics of a perpetuity
include:
Low CAPEX as a % of EBITDA
Predictable if not recurring revenue model
Low levels of customer concentration
MBA IN A BOOK
265
In terms of capital, you are going to want to have 'evergreen' sources of
capital, which means that there is no required timeline on the return of
capital. This is different than traditional private equity where LPs expect a
return of their original contributions in ~ 7 years. This forces GPs to sell their
portfolio companies in ~5 years from acquisition. Taking the evergreen or
Buffett approach allows one to accumulate the wealth associated with the
cash flows in the terminal value (of a DCF) and to use the aggregate cash
flows to purchase additional perpetuities. This is what built Berkshire
Hathaway.
Ultimately, you are going to want to either build a perpetuity yourself or start
a private equity search fund and acquire a small perpetuity and then scale up
from there to larger perpetuities. Using one perpetuity to purchase additional
perpetuities is what made Warren Buffett what he is today.
MBA IN A BOOK
266
Chapter 69:
The Operating Model
We are going to start with the operating model previously built (integrated financial statement model). From here we are going to build on a transaction (ex. LBO, Merger, ECM, DCM).

MBA IN A BOOK
267
Chapter 70:
Financial Buyer aka Private Equity There are over 4,000 financial buyers in the world. They command over $2 trillion in capital and are broken down into the following categories: Leveraged buyout Growth Mezzanine While each of these private equity firms have different hurdle rates, each perform an LBO analysis to determine whether or not to purchase a perpetuity. There are two types of private equity plays: 1. Platform – standalone company that is the basis for a strategy including
consolidation 2. Add on – additional company acquired that is “bolted” onto an existing
platform Private equity firms have 7 to 8 years to invest and get returns and be done with the fund. They have a 2% management fee generally. They are targeting 20% to 25% and think in terms of spread over treasuries. IRR is the name of the game which the main drivers of returns being; acquisition price, amount of debt raised, and future operating performance (model projections). There is an aspect of buy low, sell high regarding multiples (ex. 11x entry and 13x exit). You can use the following as a general rule of thumb for a private equity group: 15% IRR don’t do the deal 25% IRR do the deal 30% IRR, you must do the deal

MBA IN A BOOK
268
Regarding ideal private equity targets, the private equity firm will specialize in a few sectors and does not want a lot of discretionary CAPEX. They will however do maintenance CAPEX. They will look to rework AR and AP contracts. Furthermore, after an acquisition, the PE group will look to pay debt down as fast as possible. They ideally want dividend recaps (add additional cash and then pay self a dividend after paying back additional debt). The PE firm when considering an investment will run multiple cases to determine what case to bid on. They will do sensitivity tables as well. The PE group will work with LevFin, SLF & DCM within a given investment bank with SLF syndicating the loans and then selling the paper. The IB charges a financing fee, advisory fee, and syndication fee.
MBA IN A BOOK
269
Chapter 70:
Leveraged Buyout (LBO) Modeling
Leveraged Buyout (LBO) Analysis: 1. Locate financial information 2. Build the operating model 3. Input transaction structure 4. Complete LBO model with new structure 5. Run the LBO analysis Notes: Banks want 20% to 30% for financial sponsor. This depends on the industry; 50% necessary for technology company. Bank looks at leverage ratios and interest coverage to determine which covenants to put in place. Construction of LBO Model Purchase price and considerations Sources and uses Cap structure alternatives (sources) Integrate proforma BS into operating model (change in debt level and intangibles) IS, BS, and SCF projections integration IRR analysis for FS and hybrid debt lender (to find what is EBITDA, how much is cash and how much is debt Sensitivity tables Credit ratios PIK allows you to get more leverage
MBA IN A BOOK
270
LBO model is an M&A & DCM transaction in one EBITDA multiple determined from midpoint of the football field Transaction fees: Financing fees – SLF & DCM IB fees – M&A Legal – Lawyer Other fees Leverage is spoken in terms of x leverage which means x EBITDA SLF & DCM go through cases of operating model to find optimal tranche of debt to provide highest leverage to the FS but can still be sold in the marketplace Proforma is AS IF after the transaction. Adjustments (changes) -> Proforma (after changes) Retained earnings: Old RE gets wiped out and new RE starts negative due to financing fees. Assumptions for projects: Operating model start with base case without transaction Sponsor upside case Sponsor downside case Each case underneath line item in Assumptions tab Use choose function to choose case Key question: Is capital structure correct to allow you to pay down amortized debt and other tranches of debt? Look at net cash flow being generated and then determine if unsecured needs to be PIK (if not enough net CF, then need PIK) Talk to credit officer to get to capital structure that is optimal Need to do accounting quality of earnings analysis to get to true EBITDA? Financial sponsors want to see sensitivity table with highlighted options that make sense. Sensitize entry multiple and exit multiple for IRR. Reverse LBO: If I have a hurdle rate of x%, what is the max price I can pay for the asset? Also get an implied entry multiple.
MBA IN A BOOK
271
PE transaction rationale: Offense (growth) vs. defense (protecting territory aka maintain margins) Credit officer meeting: 25-30 page deck Industry Sponsor thesis 1 sheet summary of relevant financial statistics (one for each capital structure) How quickly do you draw on revolver? Do not want to draw on revolver too quickly Credit officer looks at BS/CF statistics, leverage ratios, and interest coverage statistics Want to see debt ratios steadily going down; want a few turns of the company being delivered How quickly does this company get delivered? PE work: 10, 20, 30 CIMs (confidential information memorandums) per month. PE interview: Interview 1 – Experience Interview 2 – You have 2 hrs to build an LBO model and tell me whether or not to invest

MBA IN A BOOK
272
Chapter 71:
Strategic Buyer aka Corporation There are over 3,000 strategic buyers in the world. While each of these strategic buyers have different hurdle rates, each perform a merger analysis to determine whether or not to purchase a perpetuity.
MBA IN A BOOK
273
Chapter 71:
Merger Modeling Merger Analysis: 1. Locate financial information 2. Build the standalone operating model for target & acquirer 3. Input transaction structure 4. Complete merger model with new structure 5. Run the merger consequences analysis (accretion/dilution, balance sheet
effects, contribution analysis) Notes: Merger Modeling 2 operating models put together with synergies Don’t want to give away more than 50% of your synergies in your bid Accretion (EPS goes up with combined company)/dilution merger model to see impact of acquisition on acquirer’s EPS Offensive play vs. defensive play (protecting your market or size) Dilution is proforma decrease in EPS. What causes dilution? Buyer with higher PE multiple than target, then accretive as the target is less expensive. If target has PE that is higher than the acquirer, always dilutive. If premium paid causes PE of target to be higher, then dilutive. Accretion/dilution always forward looking as it takes years to get synergies
MBA IN A BOOK
274
Proforma ownership structure want to control 50.1% of company Pretax synergies required to break even: How much synergies does acquirer need to have for the transaction to be accretive: ((Proforma EPS – Acquirer EPS) x proforma shares outstanding) / (1 – tax rate)) We then take this number as a % of revenue or EBITDA of combined company Know where your stock’s value is going: If undervalued, then don’t use stock If overvalued, then use stock to fund the transaction Collars: When announce transaction, establish exchange ratio as the stock price will move so have either: A. Fixed value collar – favors target B. Fixed share collar – favors acquirer Sensitivity tables are used to help structure deals and in negotiations Surviving entity (acquirer)
MBA IN A BOOK
275
Chapter 72:
Perpetuity Science & Portfolio Theory One should not diversify away from perpetuities but rather concentrate wealth In them. Diversification is not to be among asset classes but among perpetuities; asset classes that are not perpetuities in nature are commodities and thus not actually investments. Perpetuities are investments, commodities are not.
MBA IN A BOOK
276
Chapter 73:
How to Start a LMM Search Fund For those just getting started in private equity and are looking to buy a perpetuity, it is advisable to begin in the LMM with TEVs south of $25M. There are fund sponsors dedicated to working with PE search funds. They partner with operators that have access to perpetuities being sold by owners. The typical structure to this process is to meet with the fund sponsor and demonstrate the capabilities and plan for taking a perpetuity to the next phase. An example of this would be taking a job shop and turning it into a perpetuity or taking a perpetuity and turning it into a growing perpetuity. One should be intimately familiar with Perpetuity Science and have participated on at least one side of the perpetuity with a track record. The real key is access to a quality perpetuity where the principle of investing can be applied. The search fund does not commit capital directly but instead forms an agreement that capital will be supplied providing that a target meets hurdle criterion set forth by the fund sponsor. It is the LMM PE search fund’s responsibility to find the target and negotiate with the owner.
MBA IN A BOOK
277
CASES
For those that have already built perpetuities and their representation, there is another category known as the buy-side. The buy-side is made up of financial (private equity) and strategic buyers (corporate).

MBA IN A BOOK
278
BUILD-SIDE CASES
Sell side cases involve the lower middle market/middle market boutique investment bank, AltQuest Group. Learn more at www.AltQuest.com.

MBA IN A BOOK
279
Chapter 74:
AltQuest Group
The principle of

MBA IN A BOOK
280
SELL SIDE CASES
Sell side cases involve the lower middle market/middle market boutique investment bank, AltQuest Group. Learn more at www.AltQuest.com.

MBA IN A BOOK
281
Chapter 75:
Weiser Engineering
The principle of investing is to only invest in perpetuities or in risk free
assets. The key is to determine whether the company/opportunity is a
perpetuity or not. We are going to employ financial statement modeling and
valuation to make this determination. Financial statement modeling begins
with the building of the operating model of the company.
MBA IN A BOOK
282
Chapter 76:
Sigma Solve
The principle of investing is to only invest in perpetuities or in risk free
assets. The key is to determine whether the company/opportunity is a
perpetuity or not. We are going to employ financial statement modeling and
valuation to make this determination. Financial statement modeling begins
with the building of the operating model of the company.
MBA IN A BOOK
283
Chapter 77:
TrueVision
The principle of investing is to only invest in perpetuities or in risk free
assets. The key is to determine whether the company/opportunity is a
perpetuity or not. We are going to employ financial statement modeling and
valuation to make this determination. Financial statement modeling begins
with the building of the operating model of the company.
MBA IN A BOOK
284
Chapter 78:
Weiser Engineering
The principle of investing is to only invest in perpetuities or in risk free
assets. The key is to determine whether the company/opportunity is a
perpetuity or not. We are going to employ financial statement modeling and
valuation to make this determination. Financial statement modeling begins
with the building of the operating model of the company.

MBA IN A BOOK
285
Chapter 79:
Toledo Jet
The principle of investing is to only invest in perpetuities or in risk free
assets. The key is to determine whether the company/opportunity is a
perpetuity or not. We are going to employ financial statement modeling and
valuation to make this determination. Financial statement modeling begins
with the building of the operating model of the company.

MBA IN A BOOK
286
BUY SIDE CASES
Cases covering the buy side include