Embed Size (px)
Citation preview

Network Business Model Evolution An investigation of the impact of current trends on DNSP business model planning
Report January 23rd, 2015

Copyright © 2014 Accenture. All rights reserved. Accenture Confidential Information. 2
Table of Contents
1. Project Intent and Background
2. Summary of Findings
3. Business Model Framework
4. Case Study Summaries
5. Jurisdictional Reviews
6. Appendix • Case Studies
• Market Summaries

Copyright © 2014 Accenture. All rights reserved. Accenture Confidential Information. 3
Background
Utilities are facing a continually changing environment: • Renewables are increasingly political, with many jurisdictions
(such as Germany, California and Denmark) intervening in the utilities industry to set targets for renewables.
• High electricity prices in countries such as Australia, Sweden and Germany are dampening customer demand.
• Regulatory bodies such as the Hawaiian Commission are rejecting proposals for investment in infrastructure if unable to demonstrate efficient expenditure /alignment to customers needs.
• Increasing subsidies are now available for renewable energy e.g. Germany’s subsidies cost approx. €20billion p.a. These subsidies have led to an increase in costs to the distributors, who must integrate DERs, thus the network charges have also increased.
• Increased environmental awareness has led to greater consumer interest in renewables as well as a tightening of renewables and CO2 reduction targets.
• Consumers want greater personalisation of energy services. There is increasing demand for a broader range of products and offerings that can be tailored to an individuals needs. These demands require greater access to data, increased energy mix, and greater interaction with customers.
• New energy technology breakthroughs are gradually reducing the cost of PV, storage and smart meters.
Current Issues
The pace and depth of these changes varies according to geography: • Countries are progressing at different speeds with
renewables adoption often impacted by customer attitudes and local pricing pressures.
• Policies differ in pressure they apply to distributors concerning customer choice in energy mix and integration of Distributed Energy Resources (DERs) into the grid.
• Geographical location can influence DERs takeup such as PV in Hawaii, wind in Netherlands, wave/tidal in the UK. Also results in variation of ownership e.g. 75% of solar in the U.S. is owned by 3rd parties.
• Competition from new entrants (such as Vandebron) more likely in deregulated markets such as Netherlands.
Complicating Factors
1
Which utilities globally are experiencing similar issues to the Australian utilities industry? What can Australian utilities learn from the responses of international utilities?
Key Questions
2
3
Distributors are constrained by the nature of the traditional network business environment from responding effectively: • Regulated returns model favour heavy infrastructure
investment in a traditional grid with limited incentive to adopt or integrate renewables.
• Risk aversion to deploying new technology in untested markets.
• Grid technology does not allow for active management. • Partnerships for technology / scale not part of historical
business models.

Copyright © 2014 Accenture. All rights reserved. Accenture Confidential Information. 4
Table of Contents
1. Project Intent and Background
2. Summary of Findings
3. Business Model Framework
4. Case Study Summaries
5. Jurisdictional Reviews
6. Appendix • Case Studies
• Market Summaries
Copyright © 2014 Accenture. All rights reserved. Accenture Confidential Information. 5
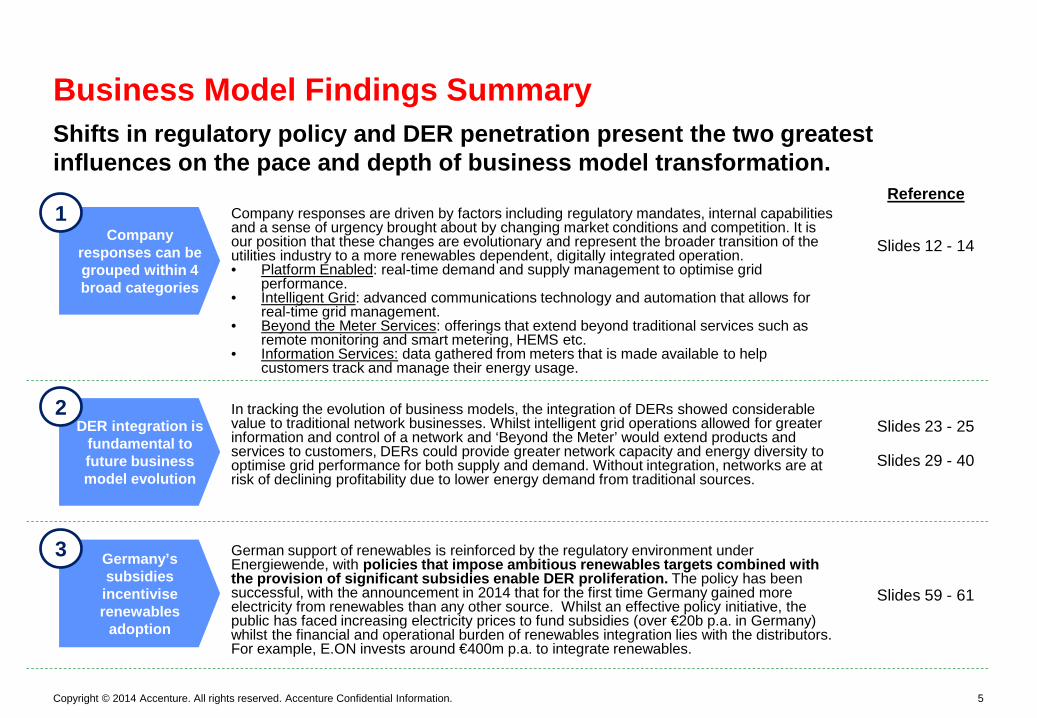
Shifts in regulatory policy and DER penetration present the two greatest influences on the pace and depth of business model transformation.
Business Model Findings Summary
Company responses are driven by factors including regulatory mandates, internal capabilities and a sense of urgency brought about by changing market conditions and competition. It is our position that these changes are evolutionary and represent the broader transition of the utilities industry to a more renewables dependent, digitally integrated operation. • Platform Enabled: real-time demand and supply management to optimise grid
performance. • Intelligent Grid: advanced communications technology and automation that allows for
real-time grid management. • Beyond the Meter Services: offerings that extend beyond traditional services such as
remote monitoring and smart metering, HEMS etc. • Information Services: data gathered from meters that is made available to help
customers track and manage their energy usage.
Company responses can be grouped within 4 broad categories
1
DER integration is fundamental to future business model evolution
2 In tracking the evolution of business models, the integration of DERs showed considerable value to traditional network businesses. Whilst intelligent grid operations allowed for greater information and control of a network and ‘Beyond the Meter’ would extend products and services to customers, DERs could provide greater network capacity and energy diversity to optimise grid performance for both supply and demand. Without integration, networks are at risk of declining profitability due to lower energy demand from traditional sources.
German support of renewables is reinforced by the regulatory environment under Energiewende, with policies that impose ambitious renewables targets combined with the provision of significant subsidies enable DER proliferation. The policy has been successful, with the announcement in 2014 that for the first time Germany gained more electricity from renewables than any other source. Whilst an effective policy initiative, the public has faced increasing electricity prices to fund subsidies (over €20b p.a. in Germany) whilst the financial and operational burden of renewables integration lies with the distributors. For example, E.ON invests around €400m p.a. to integrate renewables.
Germany’s subsidies incentivise renewables
adoption
3
Reference
Slides 12 - 14
Slides 23 - 25
Slides 29 - 40
Slides 59 - 61
Copyright © 2014 Accenture. All rights reserved. Accenture Confidential Information. 6
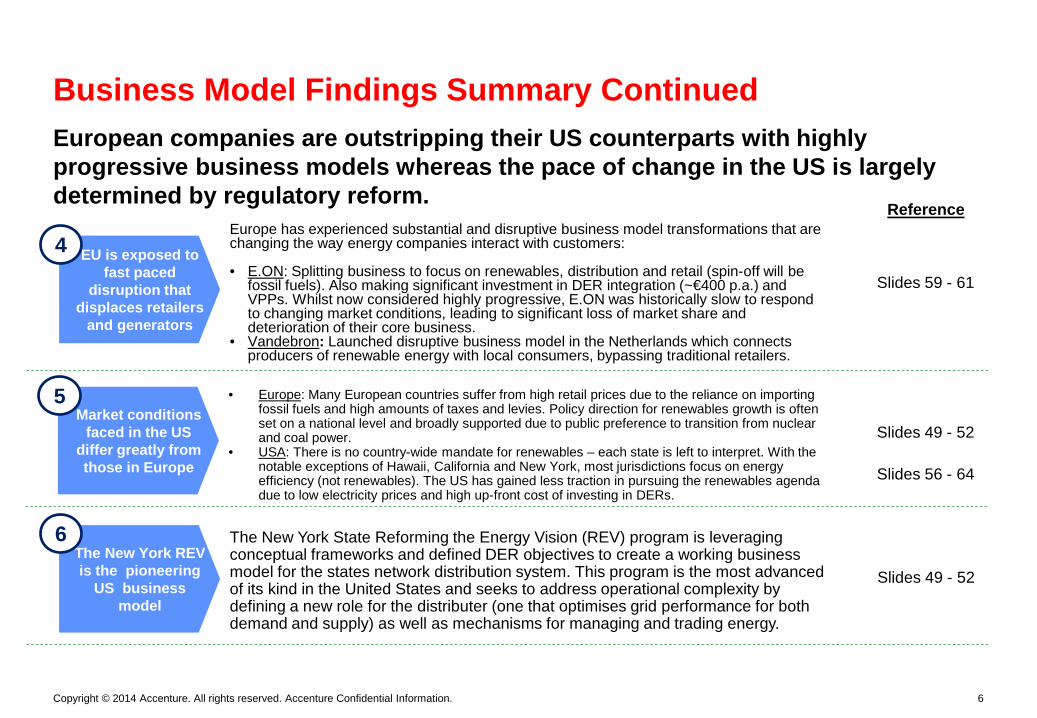
European companies are outstripping their US counterparts with highly progressive business models whereas the pace of change in the US is largely determined by regulatory reform.
Business Model Findings Summary Continued
Europe has experienced substantial and disruptive business model transformations that are changing the way energy companies interact with customers: • E.ON: Splitting business to focus on renewables, distribution and retail (spin-off will be
fossil fuels). Also making significant investment in DER integration (~€400 p.a.) and VPPs. Whilst now considered highly progressive, E.ON was historically slow to respond to changing market conditions, leading to significant loss of market share and deterioration of their core business.
• Vandebron: Launched disruptive business model in the Netherlands which connects producers of renewable energy with local consumers, bypassing traditional retailers.
EU is exposed to fast paced
disruption that displaces retailers
and generators
4
Market conditions faced in the US
differ greatly from those in Europe
5 • Europe: Many European countries suffer from high retail prices due to the reliance on importing fossil fuels and high amounts of taxes and levies. Policy direction for renewables growth is often set on a national level and broadly supported due to public preference to transition from nuclear and coal power.
• USA: There is no country-wide mandate for renewables – each state is left to interpret. With the notable exceptions of Hawaii, California and New York, most jurisdictions focus on energy efficiency (not renewables). The US has gained less traction in pursuing the renewables agenda due to low electricity prices and high up-front cost of investing in DERs.
The New York REV is the pioneering
US business model
6 The New York State Reforming the Energy Vision (REV) program is leveraging conceptual frameworks and defined DER objectives to create a working business model for the states network distribution system. This program is the most advanced of its kind in the United States and seeks to address operational complexity by defining a new role for the distributer (one that optimises grid performance for both demand and supply) as well as mechanisms for managing and trading energy.
Reference
Slides 59 - 61
Slides 49 - 52
Slides 56 - 64
Slides 49 - 52

Copyright © 2014 Accenture. All rights reserved. Accenture Confidential Information. 7
Favourable conditions for the testing and deployment of DERs is predicated on factors such as the price of electricity and the utilisation of partnerships.
Business Model Findings Summary Continued
High electricity prices create
opportunity for market entry by
DERs
7 Australia as well as Germany and Denmark suffer from some of the highest electricity prices in the world. These markets can be seen as highly attractive geographies to launch new DER products and services compared to the US as the premium demanded for new energy technology is likely to be more competitive in locations where traditional grid connections are expensive.
Distributors are yet to derive value from renewables
investments
8 Many distributors are yet to operationalise their initiatives through large scale deployment of DERs and supporting improvements to grid technology. This indicates that few networks can claim to be able to optimise their grid (manage energy mix, reduce peak demand at key locations, conduct preventative maintenance, high reliability) and have access to real-time data. The most progressive are Vattenfall, E.ON, Alliander in Europe and PG&E and ConEd in US. These companies are actively pursuing DER integration into their traditional grid.
Partnerships spread risk of
investment whilst leveraging best-in-class capabilities
9 Globally, utility companies have invested in partnerships that bring either technical expertise, brand recognition (leaders in technology, renewables or other related field) or other specific capabilities that are currently lacking within their teams. For example, PG&E has a partnership with BMW, Honda and IBM around electric vehicle technology whilst Alliander runs numerous technology pilots simultaneously through its network of partners.
Geography, policies & cost of
technology influence selection of DER technology
Adoption of renewables is due to a range of factors including policy incentives/subsidies, geography and climate as well as cost of technology. For example, Australia’s climate is well suited to solar as well as being the focus of government subsidies. The UK focuses on hydropower whilst Denmark has a significant wind energy base. The take up of Virtual Power Plants in Germany is due to the nature of German renewable sources of wind and solar. These non-dispatchable sources require a VPP to store the energy and dispatch when needed into the grid.
10
Reference
Slides 59 - 61
Slides 59 - 64
Slides 29 - 32
Slides 37- 40
Slides 37- 64
Copyright © 2014 Accenture. All rights reserved. Accenture Confidential Information. 8
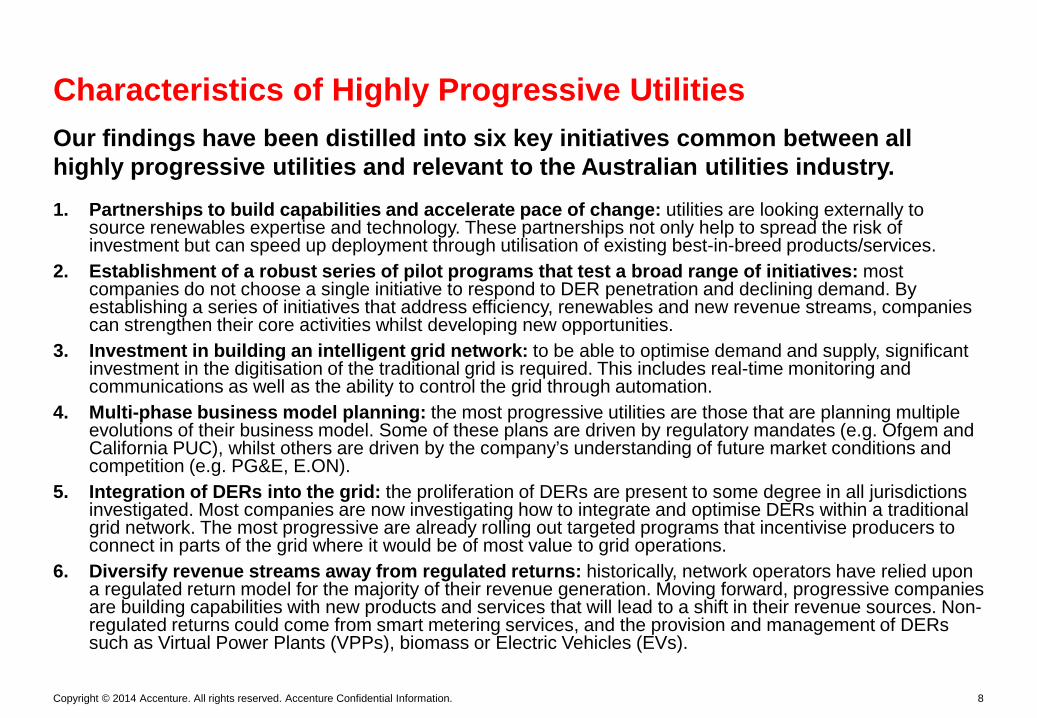
Our findings have been distilled into six key initiatives common between all highly progressive utilities and relevant to the Australian utilities industry.
Characteristics of Highly Progressive Utilities
1. Partnerships to build capabilities and accelerate pace of change: utilities are looking externally to source renewables expertise and technology. These partnerships not only help to spread the risk of investment but can speed up deployment through utilisation of existing best-in-breed products/services.
2. Establishment of a robust series of pilot programs that test a broad range of initiatives: most companies do not choose a single initiative to respond to DER penetration and declining demand. By establishing a series of initiatives that address efficiency, renewables and new revenue streams, companies can strengthen their core activities whilst developing new opportunities.
3. Investment in building an intelligent grid network: to be able to optimise demand and supply, significant investment in the digitisation of the traditional grid is required. This includes real-time monitoring and communications as well as the ability to control the grid through automation.
4. Multi-phase business model planning: the most progressive utilities are those that are planning multiple evolutions of their business model. Some of these plans are driven by regulatory mandates (e.g. Ofgem and California PUC), whilst others are driven by the company’s understanding of future market conditions and competition (e.g. PG&E, E.ON).
5. Integration of DERs into the grid: the proliferation of DERs are present to some degree in all jurisdictions investigated. Most companies are now investigating how to integrate and optimise DERs within a traditional grid network. The most progressive are already rolling out targeted programs that incentivise producers to connect in parts of the grid where it would be of most value to grid operations.
6. Diversify revenue streams away from regulated returns: historically, network operators have relied upon a regulated return model for the majority of their revenue generation. Moving forward, progressive companies are building capabilities with new products and services that will lead to a shift in their revenue sources. Non-regulated returns could come from smart metering services, and the provision and management of DERs such as Virtual Power Plants (VPPs), biomass or Electric Vehicles (EVs).

Copyright © 2014 Accenture. All rights reserved. Accenture Confidential Information. 9
Lessons learned from global distributors are instructive for the Australian context. Of particular relevance are the establishment of partnerships as well as active participation in policy and renewables technology development.
Lessons for Australian Network Operators
• Partnerships – Scan for potential partners: Australian network operators would benefit from sourcing technology partners who are more
experienced in network data analytics as well as developing, deploying and integrating distributed energy resources and technologies. PG&E have built partnerships with IBM, Honda and BMW to pursue electric vehicle technology whilst Alliander and Siemens have signed a agreement to encourage smart grid innovation.
• Planning – Develop a Pricing Strategy: A clear pricing strategy not only complements future renewables products and service lines but also
can help to identify locational (customer) sensitivity to incentives. This strategy development can help to determine favourable pricing structures that can be advocated for in policy forums.
– Restructure Planning Process: Australian distributors have a five year planning and investment cycle which has the potential to limit focus more towards traditional grid enhancements. This has the potential to put them at risk from more nimble entrants and disrupt the industry mid-cycle. Global examples of slow response by network operators cause significant financial and market share losses. Planning should take a longer view and seriously consider potential regulatory changes including asset write-downs. Planning should be focussed on a future state that is characterised by intelligent networks, integrated DERs and increased diversity of revenue from new products and services.
• Customer – Understand the Maturity of the DER Market to Align Incentives: To build an initial base of DER penetration, tariffs such as the FiT
can be effective. FiTs provide incentives for adoption due to significant price differential between the traditional grid consumer connection and producer-consumer (prosumer). As DER take up increases and enabling technologies (such as battery storage) become more economically viable, a reduced FiT may actually incentivize prosumers to use their own power instead of feeding the grid.
– Customer Focused Distributor: The distributors engineering mindset is being replaced by a customer focus. This focus is shifting the emphasis from traditional grid optimization to meeting the energy need of a customer, covering not only energy source but products and services.

Copyright © 2014 Accenture. All rights reserved. Accenture Confidential Information. 10
Lessons for Australian Network Operators
• Policy – Be an active participant in policy forums: Policy responses that focus on protecting the regulated
asset base will provide only short term relief for distributors. Distributers should take a more active role in encouraging openness of participation in energy market products and services. PG&E for example have been supportive of community solar legislature as well as tariff reform.
– Learn from First Movers: In Europe, E.ON, Vattenfall and Alliander are pushing the envelope in the advancement of DER technology and adoption under their highly progressive business models. Con Edison will aim to offset $1 billion in investments by deploying a $200 million program that leverages microgrid technology, battery storage and demand management.
• IT/OT Investment – Invest in building an intelligent grid: Future business model iterations and related revenue
opportunities are dependent upon an interconnected, data-rich environment. From early stage trials by PG&E to the large scale pilots run by Vattenfall and Alliander, investing in an intelligent grid not only enables a robust grid but supports the integration of DERs and Beyond the Meter products and services.
• Competition / Disruptors – Prepare for and Anticipate Competition: Small and nimble entrants can create a disruptive influence
on distributors by impacting location-based demand and supply of the grid. Distributors must not only be vigilant in identifying these competitors but also ensure their own competitiveness through targeted development of new products and services.

Copyright © 2014 Accenture. All rights reserved. Accenture Confidential Information. 11
Table of Contents
1. Project Intent and Background
2. Summary of Findings
3. Business Model Framework
4. Case Study Summaries
5. Jurisdictional Reviews
6. Appendix • Case Studies
• Market Summaries
Copyright © 2014 Accenture. All rights reserved. Accenture Confidential Information. 12
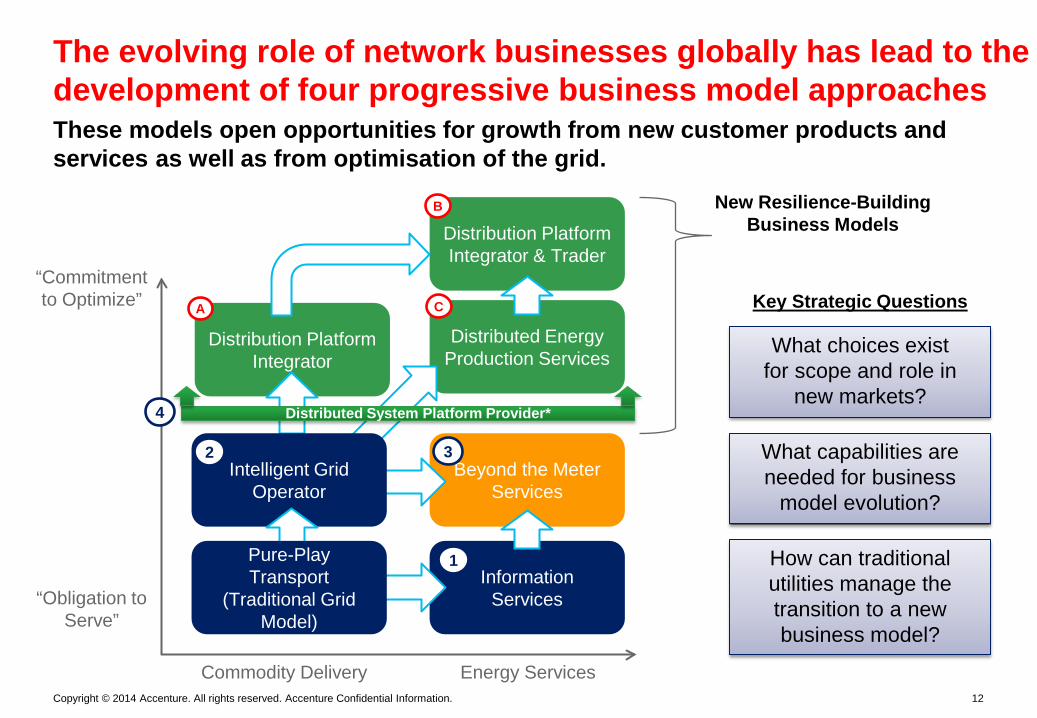
These models open opportunities for growth from new customer products and services as well as from optimisation of the grid.
The evolving role of network businesses globally has lead to the development of four progressive business model approaches
What choices exist for scope and role in
new markets?
What capabilities are needed for business
model evolution?
How can traditional utilities manage the transition to a new business model?
Key Strategic Questions
Beyond the Meter Services
Distribution Platform Integrator
Energy Services
“Obligation to Serve”
“Commitment to Optimize”
Commodity Delivery
Distributed Energy Production Services
Information Services
Intelligent Grid Operator
Pure-Play Transport
(Traditional Grid Model)
Distribution Platform Integrator & Trader
New Resilience-Building Business Models
Distributed System Platform Provider*
1
2 3
4
A
B
C
Copyright © 2014 Accenture. All rights reserved. Accenture Confidential Information. 13
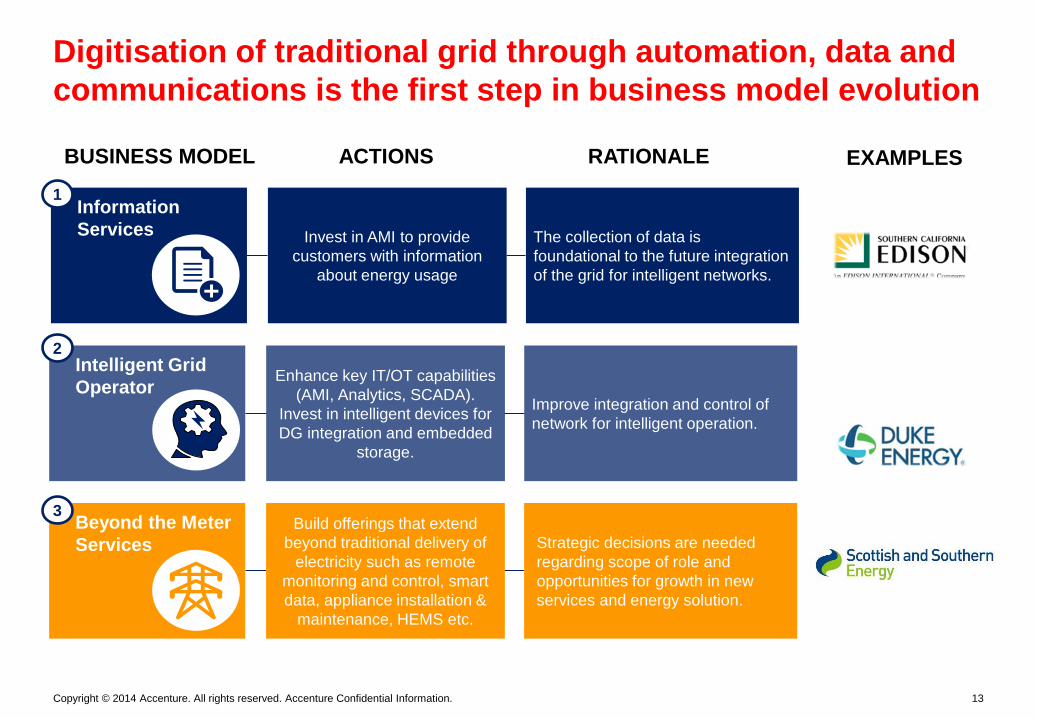
Information Services
Digitisation of traditional grid through automation, data and communications is the first step in business model evolution
BUSINESS MODEL ACTIONS RATIONALE
The collection of data is foundational to the future integration of the grid for intelligent networks.
Invest in AMI to provide customers with information
about energy usage
EXAMPLES 1
Improve integration and control of network for intelligent operation.
Intelligent Grid Operator Enhance key IT/OT capabilities
(AMI, Analytics, SCADA). Invest in intelligent devices for DG integration and embedded
storage.
2
Strategic decisions are needed regarding scope of role and opportunities for growth in new services and energy solution.
Beyond the Meter Services
Build offerings that extend beyond traditional delivery of
electricity such as remote monitoring and control, smart data, appliance installation &
maintenance, HEMS etc.
3

Copyright © 2014 Accenture. All rights reserved. Accenture Confidential Information. 14
Progressive utilities are forging ahead in defining the pace and depth of platform business model evolution
To move beyond an intelligent grid, a platform integrator needs to be able to make decisions on demand and supply in real-time to optimise whole-of-grid performance.
Extend key platforms: Advanced DMS, MDM, OMS.
Further penetration of grid automation and sensing with
real-time decision engines and control optimization. DERs fully
integrated into grid.
BUSINESS MODEL ACTIONS
Strategic decisions needed for scope of role and opportunities for additional growth in new services and energy solution.
RATIONALE
Distributed Platform Integrator
Distributed Energy Production Services
Significant investment needs to be made not only in trading system but also to develop and test pricing strategies with targeted customers.
Distributed Platform Integrator & Trader
Dynamic integration with demand drivers (e.g., demand response, dynamic tariffs) to enable transactions between producers and consumers of
energy.
Extend services to include the provision of DERs such as solar PV, battery storage through direct leasing or
partnership arrangements.
NY State REV
EXAMPLES
Trade Only – Limited Infras.
A
B
C
4

Copyright © 2014 Accenture. All rights reserved. Accenture Confidential Information. 15
The ENA workshop output is aligned to elements of the business model framework that focus on the grid optimization and the diversification of energy services.
ENA Workshop and Business Model Framework Comparison
Business Model Description (provided by ENA) Interpretation Framework Alignment
Distribution System Operator (DSO)
• Derived from New York’s Reforming the Energy Vision proposals for restructuring the electricity market
• According to NY REV definitions, the DSO is actually a regulatory role that, in the case of New York State, is independent of distributors and would not own any physical assets.
• This could be modified to the Australian context however we advise the DSP/DSPP* is a more relevant and thought-provoking option for ENA discussion.
Commercial Services
• Energy Service Company model
• Based on the workshop description, estimate alignment to the ‘Beyond the Meter’ business model.
Limited Service/Thin pipe model
• Analogy of water system: use limited access supported by water tanks and on-site re-cycling for non-potable water use
• Estimate that this is a customer segment i.e. prosumers who possess battery storage but require the back-up reliability of the grid.
N/A
Distributed Energy Resources (DER) / Microgrids facilitator
• Enables flexibility for network utilisation of variable, economic and appropriate solution to provision of service e.g. rural/remote; urban; CBD; new estate; high density; industrial; commercial, etc. Mix of customer gen. and network to achieve reliable supply .
• There are two points here: 1) IT/OT integration of DERs/Microgrids and 2) provision as a new product or service to customers.
• 1) Integration of DERs/Microgrids is an activity conducted under the Platform business models thus not a separate business model.
• 2) DER/Microgrid offerings are examples of moving beyond traditional supply of energy to offer customers new products and services. New offerings can be delivered through future business models (e.g. Beyond the Meter and Platform models) therefore is not a separate business model.
*For futher information, please refer to section 51-52 in the deck.

Copyright © 2014 Accenture. All rights reserved. Accenture Confidential Information. 16
Beyond the Meter and Platform Business Models offer opportunities to diversify revenue streams by creating new consumer products and services.
Business Model Framework: Revenue Opportunities
• Value case driven business model: provision of energy usage information to customers via web portal or other channel allows for greater data transparency and may add to consumer ‘stickiness’.
Information Services
1
Intelligent Grid Operator
2
Beyond the Meter Services
3
Distributed Platform Integrator
Distributed Energy Production Services
Distributed Platform Integrator & Trader
A
B
C
• Value case driven business model: initiatives in automation, sensing and control optimization can generate savings by lowering cost of operations and maintenance and offset/delay capital investment.
• Revenue diversification: generate revenue through provision of products such as smart devices (e.g. Nest) and services such as home automation systems, demand response programs, data analysis, auditing and security.
• Revenue diversification: delay or offset capital investment by managing grid supply and demand from an aggregation of multiple energy sources (including DERs).
• Revenue diversification: revenue generated through delivery of DERs as well as facilitation of a marketplace open to all energy participants to buy and sell offerings as well as trade supply and demand.
• Revenue diversification: revenue generated through delivery of Beyond the Meter products and services as well as facilitation of a marketplace open to all energy participants to buy and sell offerings.

Copyright © 2014 Accenture. All rights reserved. Accenture Confidential Information. 17
Strongly influenced by the regulatory environment, distribution companies employ a broad business model approach that extends existing capabilities, builds new partnerships and cultivates new technology.
Business Model Framework: Key Insights
• Low risk/investment requirement as focused on data acquisition from existing network. Companies likely to include services in broader, more comprehensive approach.
Information Services
1
Intelligent Grid Operator
2
Beyond the Meter Services
3
Distributed Platform Integrator
Distributed Energy Production Services
Distributed Platform Integrator & Trader
A
B
C
• PG&E have been investing in grid optimization for over 7 years whilst SSE, E.ON focus on pilot programs. Common initiatives include: real time monitoring, active switching, operational control/curtailment of DG, locational signaling*.
• Initiatives include PV installation, energy management devices such as Nest, remote monitoring and energy efficiency services. For example, PG&E have a partnership with BMW where they will control the charging of their EVs.
• No distributors have operationalized a platform business model. Con Edison recently received approval to launch the Brooklyn-Queens Demand Management program that seeks to optimize the grid through microgrids, solar, battery storage and energy efficiency initiatives.
• Trading platforms exist only in small geographic areas and are not open to all energy participants. Vandebron (Netherlands) is a platform operated by a third party that does not own any physical energy assets. Reposit Power (Australia) have begun a pilot that proposes consumers can buy and sell DG into the grid.
• While no platform exists at this stage, Vattenfall has committed to supporting the decentralisation of energy distribution. To this end, the company provides the following services to customers: CHP, VPP, solar installation and remote monitoring.
*Source: Accenture Research ‘The Digitally Enabled Grid 2’ Dec 2014

Copyright © 2014 Accenture. All rights reserved. Accenture Confidential Information. 18
The evolution of the regulatory compact should allow for active dialogue with the regulator – enabling utilities to protect earnings whilst shaping migration to a new model.
Business Model Framework: Regulatory Responses
New tariffs and policies for DG
(0 to 3 years)
Distribution communities (2 to 5 years)
Platform distribution
provider (3-10 years)
• Negotiation of support for DG integration (e.g., connection charges, feed-in tariffs, policies, locational signals)
• Time-based tariffs, especially in competitive markets (e.g., time of use, PEV charging) and more dynamic demand response practices
• Trials of creative tariffs (e.g., free weekends, flat rates, bundles)
• Pilots of distribution communities where new model can be tested to refine operational and regulatory rules
• Selective deployment and measurement of impact of new technologies with customers and in distribution grid
• Refinement of capabilities and platforms to run under new model
• Roll-out technology in the distribution grid and market needed to support adoption of new technologies
• Scale of interconnection between the wholesale and retail market
• Transitioning of role of utility and compensation model from obligation to serve to network optimization
• Reduction in cost impact of distributed generation integration
• Selection of technologies to be adopted
• Creation of market places for customers to acquire technologies
• Ability to understand the capabilities needed under new model
• Clear business value drivers
• Lower cost to serve
KEY PLATFORMS/CAPABILITIES OUTCOMES

Copyright © 2014 Accenture. All rights reserved. Accenture Confidential Information. 19
Business Model Framework: Strategic Capabilities Overview
Intelligent Network Operations
Industry & Partnership Management
Market & Commercial Intelligence
Performance Management
• Ensuring technical infrastructure and operational capabilities (IT/OT) to monitor, control and support the management of demand and supply to the grid in near-real time.
• Advanced market and network analytics to identify trends / behaviours.
• Identify partners who will provide either a) required platform infrastructure such as meter data providers, or b) additional value-add to the platform through new products or services
• Develop regulatory approaches to optimise preferred outcomes
• Understand the pricing elasticity of prosumers on the buy and sell-side of the platform
• Setting the pricing mechanisms and supply incentives
• Develop capabilities to interact with trading markets
• Develop competitor analysis and market play capabilities
• Aligning initiatives to the strategic and financial objectives of the business.
• Establish measurable performance factors to quantify contribution to strategic direction.
• Develop performance metrics for personnel.
To deliver the Business Model changes and operational improvements, five strategic capabilities are required for success
Customer Interaction / Marketing
• Attracting and retaining platform participants.
• Development and marketing of a portfolio of products and services.
• Management of communication channels.
• Develop platform brand image and awareness.
1 3 2 4 5

Copyright © 2014 Accenture. All rights reserved. Accenture Confidential Information. 20
To enable the delivery of energy products and services, distributors will need to enhance capabilities that create a connected, controllable, data driven grid.
Beyond the Meter Capabilities
Communications Smart Meter Smart Grid Home Automation
• Underlying communications to support Smart technology
• Ability to remotely read the data contained in a smart meter
• Metering devices which provide TOU pricing information
• Ability to collect, store and report residential energy use information at near real-time intervals
• Installation of a series of sensors to monitor network parameters
• Ability to control system devices remotely (e.g., automated switching)
• Utilize sensing and control info to switch power to different feeders to reduce system losses
• Aggregation of demand to reduce peak load and help balance the system more efficiently
• Ability to control in-home appliances to switch off high-load components during periods of high demand
1 3 2 4

Copyright © 2014 Accenture. All rights reserved. Accenture Confidential Information. 21
The case studies highlighted common themes between responses by utilities to the market and regulatory environment.
New Operating Principles for Progressive Business Models
• Being able to integrate all types of generation. • Enabling consumers to provide services back to the grid. • Offering enhanced or optional services, such as microgrid services
and other DER support services. • Being agnostic about supply. • Facilitating a retail market for consumers and third-party providers to
buy and sell services.
Foundational operating principles for the traditional grid model
Maintaining a safe and
reliable grid
Increasing grid efficiency
Optimizing asset
utilisation
Support / implement
public policies
Highly reliable & resilient
energy services
Identify most cost-effective
ways of achieving outcomes
Future Business Model Progressive
principles:

Copyright © 2014 Accenture. All rights reserved. Accenture Confidential Information. 22
Table of Contents
1. Project Intent and Background
2. Summary of Findings
3. Business Model Framework
4. Case Study Summaries
5. Jurisdictional Reviews
6. Appendix • Case Studies
• Market Summaries

Copyright © 2014 Accenture. All rights reserved. Accenture Confidential Information. 23
Case Study Assessment A qualitative analysis was conducted on all case studies to determine whether the initiatives pursued by these companies were progressive enough to meet the expectations of both the market and regulatory bodies.
The USA has done significant work in defining strategic imperatives for future business models however most initiatives remain within the pilot stage of deployment.
Case Studies Overview: USA
Ability to Meet Regulatory and Market Expectations for Business Model Evolution:
Transition to an Intelligent Grid Operator
• Improving distributed intelligence and interoperability through communications infrastructure, smart metering and battery storage.
Duke Energy
Building a “Grid of Things” • Early adopter of smart grid
technology; pursuing early stage DER integration with PV and battery storage as well as IT /OT enhancements to build intelligent grid.
Brooklyn/ Queens Demand Management Program
• BQDM will pilot a number of initiatives including microgrids, solar, battery storage and energy efficiency.
• Anticipating strong regulatory changes due to NY REV.
PG&E
Con Edison
Limited
Progressive
Highly Progressive
Relevant to Australian utilities

Copyright © 2014 Accenture. All rights reserved. Accenture Confidential Information. 24
Europe is the global leader for the deployment of DERs into the grid as well as enabling initiatives such as renewables portfolio growth and digitising the grid.
Case Studies Overview: Europe & Australia
Digitally Enabled Renewables Distribution
• Portfolio of pilots to develop Smart Grids, Virtual Power Plants (VPP) and CHP.
• Stablising core through financial restructure and sale of coal business.
Vattenfall
Digital Grid Management for Distributed Generation
• Using partnerships to help launch multiple pilot projects (EVs, digital grid mgmt.) simultaneously and share financial risk.
Alliander
Growth of Renewables Products & Services
• Splitting business to focus on renewables, distribution and retail (spin-off will be fossil fuels).
• Significant investment in DER integration ~€400 p.a. and VPPs.
E.ON
Development of a Renewables Portfolio
• Substantial portfolio of wind, wave and tidal power. Pilot phase for microgrids, batteries and smart grid technology.
• Has missed carbon reduction targets set by Ofgem.
Scottish & Southern Energy

Copyright © 2014 Accenture. All rights reserved. Accenture Confidential Information. 25
The following case studies are instructional as examples of industry participants who are having a disruptive impact on the business models and profitability of traditional grid operators.
3rd Party Offerings Impacting Distributers
Peer-to-peer Platform Service • Launched disruptive business
model in the Netherlands which connects producers of renewable energy with local consumers, bypassing traditional retailers.
Vandebron Trading & Control for Grid-Tied Electricity Storage
• Launched late 2014 in Canberra. • Uses grid-tied solar storage
located on residential premises to monitor and trade power back into the network.
Reposit Power

Copyright © 2014 Accenture. All rights reserved. Accenture Confidential Information. 26
Policy is shifting to advocate for greater renewables investment and integration. Most distributors investigated are matching the pace of change mandated by their regulatory environments.
How Responsive are DNSPs to Change?
Company Regulatory Change Business Model Response PG&E HIGH HIGH SDG&E HIGH HIGH Duke LOW LOW Con Edison HIGH MED-HIGH Vattenfall HIGH HIGH Alliander HIGH HIGH E.ON MED HIGH SSE MED LOW
EUR
OPE
U
SA

Copyright © 2014 Accenture. All rights reserved. Accenture Confidential Information. 27
Duke Energy is exploring how to enhance capabilities in smart grid whilst identifying and developing selected DER technologies.
Duke Energy
• A leading energy company in the United States, supplying energy to more than 7.2 million customers. Customers are located in Ohio, the Carolinas, Kentucky, Florida and Indiana.
• Duke Energy provides generation, transmission and distribution operations (over 400,000 km of lines), and other energy services in the Americas – including a portfolio of renewable energy assets.
Company Overview
Drivers for Change • Technological evolution will threaten Duke’s traditional business
model, in particular due to growth of solar + storage, EVs, fuel cells and energy efficiency.
• The most imminent threats will come from improvements in Energy Efficiency technologies that could cut peak capacity, and the rapid growth of solar PV + storage.
• In 2014, South Carolina passed the Distributed Energy Resource Program Act to provide producers and consumers of electricity with more choices and moves solar power forward in the state^.
• Both federal and state incentives across multiple jurisdictions are helping drive down cost of solar PVs.
Plans & Actions • Duke is predominantly a pure-play “Grid Manager” but is
moving toward becoming an “Intelligent Grid Operator” by investments in intelligent network and AMI infrastructure.
• Assess potential investment opportunities in “beyond the meter” products and services with EVs, solar and storage, fuel cells, energy efficiency and demand response.
^ Source: Solar Power at a Glance, duke-energy.com/solar
Progress • Key initiatives focus on increasing capital investment in
renewables, IT/OT grid capabilities and investigation of fuel cell leasing models.
• Outcomes delivered so far include a commitment to ~$2b spend on renewables generation projects over the next 4 years and the rollout of standardised IT/OT platform. Fuel cells determined to provide limited value in s/term.
• Investment in renewables requires significant investment both in the asset acquisition as well as ongoing integration efforts. Distributors must take this into consideration for both short and long term budgeting.
• An intelligent grid is required to support renewables and generate value for a distributor. Digitising a grid must be thus planned in parallell with any DER integration targets.
Implications for Australia
Energy Services
“Commitment to Optimize”

Copyright © 2014 Accenture. All rights reserved. Accenture Confidential Information. 28
Summary for Duke Energy 28
Renewables Activity Accelerates but Not Strategic Focus • Duke investigated opportunities related to diversifying revenue streams and investing in renewable technology. This
led them to focus on acquiring solar power assets however their portfolio remains mostly fossil fuels. Duke has yet to see much of an impact from DER and likely won’t for some time due to their electricity prices are generally quite low.
Long Term Approach to Digitising the Grid • Duke is pursuing greater information and control over its network through improving distributed intelligence and
interoperability. These initiatives commenced in 2007 as part of a long term plan to improve the operational performance, improve security, manage data and reduce costs.
Pursuing Strategy of Power Purchase Agreements (PPAs) • Duke is not only building a number of PV plants but also signed a number of PPAs with a total of eight solar projects
that together have a capacity of 278 MW. These agreements provide certainty of demand whilst investing in a capital intensive asset.
Duke Actively Participates in Policy Discussions • Duke has submitted requests to change legislation that would cut revenues paid to independent solar providers. This
request was opposed by the solar industry, stating these changes would hinder solar development. Duke has also requested reduction of net metering for solar which is seen to erode the traditional utilities business model.
Source: Accenture Research

Copyright © 2014 Accenture. All rights reserved. Accenture Confidential Information. 29
Vattenfall is embarking upon a repositioning of its business in Europe to focus on the generation and distribution of renewables.
Vattenfall
• 100% Swedish state-owned with operations in Sweden, Germany, the Netherlands, Denmark, Finland, France and the UK. Net sales: SEK 171.7 billion (167.3)
• Vattenfall works throughout the value chain including operations in generation and sales across all markets as well as offering distribution services in Germany and Sweden.
• Vattenfall’s operations produce electricity and heat from wind power, nuclear power, natural gas, biomass, coal power and hydro power.
• Purchased 49% of Nuon in 2009 and has taken over operative control. Over the next five years will complete full ownership
Company Overview
Drivers for Change • Weak demand, a surplus of generation capacity and historically
low wholesale prices. • Increasing political pressure to shift business towards the
development of renewables and away from coal and gas (Vattenfall has profitable lignite and nuclear operations).
• Aggressive targeted reductions in CO2 emissions. • October 2014 announcement of $3.13b impairment loss (includes
Nuon writedowns). • 1 out of 7 household in the Netherlands will have PV by 2020. • With the current low price of electricity, construction of new
generation capacity in Northern Europe is uneconomic without subsidies or other support systems^.
• Committed to becoming a ‘smart energy enabler’ as the key strategic focus area.
• Developing smart grid capability to support decentralisation of energy distribution.
^ Source: Vattenfall 2013 Sustainability Report
Plans & Actions
Progress • Key initiatives are focused on the development of new products
and services, financial restructuring and piloting smart grid technology.
• Outcomes delivered so far include the development of a range of offering including appliance remote control and solar installation to CHP and VPPs. Vattenfall has also exited coal operations and non-core markets and is currently on track to achieve cost reduction targets. Active partner in Smart Grid Gotland.
• Partnerships with technology and renewables specialists are necessary to develop and test innovative renewables technologies at scale.
• Investment in strengthening the core business can free up resources (people and capital) to support new revenue streams.
Implications for Australia
Energy Services
“Commitment to Optimize”

Copyright © 2014 Accenture. All rights reserved. Accenture Confidential Information. 30
Summary for Vattenfall 30
Strategic Direction • The Vattenfall planned approach hedges risk in developing a portfolio of products and services that increase
revenues in the current business model as well as strengthening sustainability through diversified revenue streams in the future.
“Refresh the core” • With a directive to focus the portfolio on renewable energy, Vattenfall made key decisions to reduce its international
footprint as well as sell the profitable coal business. This strategy will allow them to focus resources towards supporting the platform and the renewables that power it.
Escalation of Political Risk • Vattenfall considers politicial risk now has a greater impact than market risk on the performance and ultimate success
of utilities. This is due to signifcant impact on subsidies to support the investment and takeup of renewables technologies by distributors.
Development of Virtual Power Plant (VPP) Offering • The VPP not only supports the objectives of Energiewende but helps to manage grid fluctuations, store and optimise
capacity usage as well as integrate renewables efficiently into the grid.

Copyright © 2014 Accenture. All rights reserved. Accenture Confidential Information. 31
Alliander is pursuing a dual strategy of digitising the network whilst building capabilities in distributed generation.
Alliander
• Alliander is a government owned Distribution System Operator (DSO) and the largest grid company in the Netherlands. The company services 2.1 m gas and 2.9 m electricity connections. ~5,000 FTE employees with yearly grid investments of around €0.6 billion.
• Regulatory changes lead to unbundling of Nuon (production & supply) and Alliander (grid - formerly Continuon) in 2009. Alliander has 3 business units: Liander (regulated services), Liandon (engineering services e.g. maintenance for the national grid) and Endinet (small regional grid in South Netherlands).
• Operates ~84.000 km of distribution grid. Transports 32 GWh electricity generating €1.4b revenues.
Company Overview
Drivers for Change • The energy market in Europe is unbundling, there is a clear
separation between transport- & distribution companies (regulated) versus energy generation & -supply companies (liberalized).
• Challenges to address in evolving business – data management: digitization of the network and increasing
dependence of data – lack of technical skills: growing shortage of educated
technicians – changing competencies: new skills are required in Alliander
employees to support the energy transition – power outage duration: the Dutch regulator sets targets and
factors that influence the amount of fee a network distributor can requrest from its customers. The regulator also sets targets for power outages (this could be an issue if transitioning towards a more unreliable mix of energy).
• The ambition is to develop a ‘best in class’ smart energy network in order to fully facilitate the energy transition – as part of a roadmap to a more sustainable energy system.
• Moving from digitising networks to digital grid management – to enable standardised central control and optimise distributed generation.
Plans & Actions
Progress • Key initiatives are focused on digital grid management, electric
transportation and distributed generation. Alliander has also set up a deregulated new business to cover the shortfall in grid revenue.
• Outcomes delivered so far include investments in automation and smart metering at the household and substation level. Multiple partnerships seek to improve technology and infrastructure for EVs whilst a comprehensive program of pilots are testing solar, CHP and microgrids.
• Partnerships with technology and renewables specialists are necessary to develop and test innovative renewables technologies at scale.
• Digital initiatives have focused on addressing and improving different sections of the network (e.g. households as well as substations) .
Implications for Australia
Sources: Accenture Research.
Energy Services
“Commitment to Optimize”

Copyright © 2014 Accenture. All rights reserved. Accenture Confidential Information. 32
Summary for Alliander
Strategic Partnerships to Capture Opportunities • Partnerships have helped Alliander to launch multiple pilot projects simultaneously and spread financial risk between
partners. By leveraging skill sets of market leading products and technologies (such as Siemens) to invest in opportunities greater than an individual companies capabilities.
Pursuit of Unregulated Revenue • Reorganization of Alliander into three main subsidiaries has enabled the business to pursue regulated (distribution,
maintenance, metering) and un-regulated (commercial engineering) revenue. EV, DG and intelligent grid are being pursued through initiatives such as i-Net, Infostroom Smart Meters, and SA Liander.
More than Just a Utilities Company • Alliander now prides itself on being not only a utilities company but also a data company – one that is managing huge
amounts of data. This is due to the increased deployment of sensors throughout its network to monitor operations in real-time as well as optimize energy transmission, integrate renewables and manage dynamic assets.
Positioning as Market Leader • A broad range of pilots are currently under management including EV, CHP, and microgrids. Due to substantial
investments (with partners) in renewables technology R&D, Alliander is now considered a market leader for distributed generation in the Netherlands. This competitive positioning enables greater market share for these targeted areas.

Copyright © 2014 Accenture. All rights reserved. Accenture Confidential Information. 33
E.ON is on an aggressive program to recover their core business whilst embracing renewables.
E.ON
• E.ON is one of the world's largest investor-owned power and gas companies with facilities across Europe, Russia, and US.
• Over 62,000 employees. Over EUR122.5 billion in sales in 2013. • Energy types: Biofuel, Wind, Solar, Hydro and conventional gen. in
gas, oil, coal and nuclear. Other Services: Sales (~24m customers) and Distributed Energy, Heat and Innovative Energy Solutions.
• Distribution (`17m customers) in Germany, Sweden, Hungary, Romania, Czech R., Slovakia and Spain. Growth distr. in Turkey.
Company Overview
Drivers for Change • Steep increases in consumer prices as well as increasing
investment needs to upgrade / maintain the distribution network. • Utility shareholders have low or negative growth expectations . • Regulatory shifts in Europe accelerating strong renewables growth
in Europe. €4.5bn in impairment charges due to reduced demand. • Increasing deployment of smart technologies. • Presence in multiple jurisdictions leads to wide variety of customer
behaviour, competition and regulatory environments. • E.ON, announced plans to split itself in two: 1) One entity to cover
conventional generation and mid- and upstream businesses, 2) ‘New E.ON’ will retain its renewables, distribution and retail units, with the last two activities accounting for over 80% of projected earnings. The restructure is due to be completed by H2 2016^
Sources: E.ON’s Historic Split; E.ON invests in Windpower
• Two focus areas: 1) Continuously deliver and improve on top performance and 2) Contribute to Fair Regulatory Networks.
• EON is developing its capability to deploy Virtual Power Plants that can utilitise traditional grid and DERs. In the future, EON seeks to offer services that go further than the current balancing of energy services.
Plans & Actions
Progress • Key initiatives are focused on restructuring of investments away
from fossil fuels, renewables integration and VPPs. The company also split the business to focus on renewables, distribution and retail. 30GW of current connected renewables capacity in E.ON networks to double by 2025.
• Outcomes delivered so far include the operation of 10GW of renewable energy including large hydro. Also investing heavily in integrating renewables into grid at cost of ~€300m p.a.(increasing over time). Limited deployment of VPP.
• Investment in renewables requires significant investment both in the asset acquisition as well as ongoing integration efforts. Distributors must take this into consideration for both short and long term budgeting.
• An intelligent grid is required to support renewables and generate value for a distributor. Digitising a grid must be thus planned in parallell with any DER integration targets.
Implications for Australia
Energy Services
“Commitment to Optimize”
Copyright © 2014 Accenture. All rights reserved. Accenture Confidential Information. 34
Summary for E.ON
A Strong Core is Essential • E.ON initiated a program of restructuring, cost cutting and efficiency to reinforce core business. Whilst renewables
growth has gone some way to rebuild earnings, damage to existing core caused long term destabilisation to profitability. For example, unprofitable power plants have led to shutdowns/ mothballings – undermining grid stability.
Growing Renewables Requires Significant Investment • E.ON spends over 300 million euros per year (and expected to continue to rise into the near future) to integrate
renewables into their existing global generation and distribution network.
Diversifying Portfolio with Virtual Power Plants • Virtual Power Plants enable E.ON to offer specialised solutions to help customers optimise their energy usage as well
as take advantage of a variety of distributed energy resources. The offering not only helps to optimise load in various parts of the network but delivers additional financial gains to the customer, encouraging loyalty to the distributor.
Commitment to Renewables through New Business • E.ON has just announced it will split its business into one focused on conventional generation / upstream and another
business focused on renewables, distribution and retail. This portfolio of services (including Home Services) will provide a clear direction for the business to invest in renewables (especially wind and solar).

Copyright © 2014 Accenture. All rights reserved. Accenture Confidential Information. 35
Aligning to New York REV, Con Edison launched a program that seeks to optimise traditional grids with batteries, PV and energy efficiency.
Con Edison
• Consolidated Edison is a regulated utility, provides transmission and distribution services in New York City (except for small area in Queens), and most of Westchester County.
• Con Edison is a subsidiary of Consolidated Edison, Inc., one of the nation’s largest investor-owned energy companies, with ~$12 billion in annual revenues and $40 billion in assets.
• ConEd's competitive energy businesses include the operation of unregulated generation, electricity and fuel trading, and retail services. Over 6 million customers served through regulated business.
Company Overview
Drivers for Change • NYC REV has proposed a DSPP to help transition away from
reliance on fossil fuels whilst optimising grid performance. • Utilities are projected to experience weak or negative electric
demand growth in coming years as a tepid economy and energy efficiency dampen demand^.
• Con Ed estimates power demand will outstrip supply in parts of Brooklyn and Queens by 2018*.
• Government aims to get 30 percent of the power grid from renewables by 2015**.
• Policy changes have decoupled regulatory returns from energy sales, rewarding distributors who support customers to be energy efficient, not just focus on growing load. ^Source: UBS Con Edison Report November 2014, *Source: State Embraces Brooklyn
Energy Overhaul, Dec 2014, **Source: Ambitious State Renewables Plan
• Con Edison is launching the Brooklyn/ Queens Demand Management Program (BQDM) to demonstrate how traditional grids can be optimised through battery power/ microgrids, solar panels and increased energy efficiency.
Plans & Actions
Progress • Key initiatives are focused on the BQDM as well as building
conceptual models for rate structures/pricing strategies, microgrids and intelligent grid communications.
• Outcomes delivered so far include the approval to proceed with BQDM which is hoping to not only reduce demand by 41MW but also offset the need for $1b capital upgrades by investing $200m.
• Aligning pilot projects to domestic policy goals can enable greater government support either through subsidies or granting project approvals.
• If planned correctly, a pilot project can not only test the operationalisation of new technology but also help to achieve returns the same as a fully deployed initiative.
Implications for Australia
Energy Services
“Commitment to Optimize”

Copyright © 2014 Accenture. All rights reserved. Accenture Confidential Information. 36
Summary for Con Edison
Regulatory Reforms on the Horizon • While the NYC REV is currently in the conceptual planning stage, the reforms are a continuation of the policies
pursued by New York government to encourage utilities to transition from fossil fuels to renewable energy.
Pilot Program Success will Define Future Initiatives • The Brooklyn / Queens Demand Management Program (BQDM) will pilot a number of initiatives including microgrids,
solar, battery storage and energy efficiency. The outcome of these trials will be used to inform and direct energy strategy for the rest of the state.
PV Presents an Opportunity as well as Challenge • Con Ed Solutions offers the installation and management of PV for commercial and industrial customers. These
offerings help provide greater capacity to the traditional grid instead of upgrading existing infrastructure. Solar power is however cheaper for residents than traditional electricity, with some estimates of a 14% reduction in ConEd revenue.
Tariff and Rate Structure Still Being Defined • The complexity of the BQDM will impact the tariffs paid by consumers. ConEdison has been requested by the Public
Service Commission to submit proposed tariff revisions regarding apportioning BQDM Program costs to the New York Power Authority delivery rate classes.

Copyright © 2014 Accenture. All rights reserved. Accenture Confidential Information. 37
PG&E has responded to policy driven renewables adoption by establishing a ‘Grid of Things’ supported by solar and EVs.
PG&E
• Pacific Gas & Electric, which provides electric/gas transmission and distribution services, electricity generation, procurement, transmission and natural gas.
• One of the largest combination natural gas and electric utilities in the US. Based in San Francisco, the company is a subsidiary of PG&E Corporation, a publically traded company.
• T&D serves 5.2 million electric and 4.4 million gas customers in central and northern California, covering an area of ~70,000 square miles. Operates gen. fleet of ~10,100 MW, consisting of hydro and nuclear power.
Company Overview
Drivers for Change • California is taking an aggressive approach to increasing
renewable energy footprint as well as having utilities participate in growing EV and Distributed Resources plans and investments.
• Increased adoption / consumer interest in Solar Power. Neutral-negative demand growth in electricity driven by weak economy and energy efficiency initiatives.
• In 2010 California legislature passed motion AB 2514, requiring utilities to meet the goal of 1.3 gigawatts by 2022*. Also by mid-2015 investor owned utilities in the state will have a Distributed Resources Plan^ (AB327).
• Under Californias renewables law, PG&E will be required to procure a portion of 600 MW of solar PV required by government.
• Policy changes have decoupled regulatory returns from energy sales, rewarding distributors who support customers to be energy efficient, not just focus on growing load.
• Development of a “Grid of Things” i.e. software and hardware infrastructure that seamlessly integrates with traditional poles and wires network as well as DERs and mobile consumer technology.
• PG&E is an early adopter of smart grid technology with dedicated lab for testing smart grid technologies such as smart meter system, SCADA system and communication systems.
^Source: PG&E Green Options *Source: SCE / PG&E Release First Storage Requests
Plans & Actions
Progress • Key initiatives are focused on community solar programs, energy
storage and ‘Grid of Things’ initiatives. • Outcomes delivered so far include successfully drawing 22.5% of
power from renewable resources in 2013 and on track to meet 2020 goals. RFPs have been released to the market for battery storage and multiple partnerships are being developed with BMW, Honda and IBM to progress electric vehicle charging technology.
• Partnerships with technology and renewables specialists are necessary to develop and test innovative renewables technologies at scale.
Implications for Australia
Energy Services
“Commitment to Optimize”

Copyright © 2014 Accenture. All rights reserved. Accenture Confidential Information. 38
Summary for PG&E
Regulatory Pressure Driving Change • Laws in California have forced utilities companies to adopt a renewables agenda at perhaps a more aggressive rate
than consumer sentiment (due to low electricity prices). Companies will be required to develop clearer strategies and initiatives to be able to adequately respond to the mandated Distributed Resources Plans.
Limited Large Scale DER Initiatives • PG&E is pursuing a ‘Grid of Things’ approach, one that addresses both IT/OT enhancements as well as DERs
integration (PV, battery storage). As many initiatives are still in their infancy (conceptual stage), it will be some time before the successful adoption of such programs can be assessed.
Strategic Partnerships for Electric Vehicle Technology • PG&E has been cultivating multiple partnerships with technology specialists in electric vehicles. This includes an
initiative with BMW whereby PG&E will have direct control over when owners can charge their vehicles to avoid peak demand periods. Partnerships with IBM and Honda are investigating EV charging technology and infrastructure.
Smart Grid Lab is a Long Term Investment in Improving the Grid • PG&E has had a long term investment in researching, testing and deploying new technologies into the grid via their
Smart Grid Lab. To date, the lab has focused on energy efficiency and data gathering efforts but has now opened up to battery storage trials.

Copyright © 2014 Accenture. All rights reserved. Accenture Confidential Information. 39
SSE is pursuing small scale trials of smart grid technology whilst supporting a growing portfolio of renewable energy.
Scottish and Southern Energy
• SSE is involved in the generation, transmission, distribution and supply of electricity, in the production, storage, distribution and supply of gas and in other energy related services throughout Great Britain and Ireland.
• As a privately owned company, SSE is the leading generator of electricity from renewables across the UK and Ireland.
• Renewables portfolio includes: 1,150MW conventional hydro, 940MW onshore wind, 355MW offshore wind, 300MW pumped storage, and 38MW dedicated biomass.
• The electricity networks transmit and distribute electricity to around 3.7 million premises.
Company Overview
Drivers for Change • Ofgem (Office of Gas and Electricity Markets) has initiated a
number of regulatory changes to support renewables integration: – Renewables Obligation (RO) in 2002 to provide incentives for
the deployment of large-scale renewable electricity in the UK^. – Mandate to roll out more than nine million smart meters by
2019*. – Unveiled a £17bn plan to upgrade the UK's electricity networks
and connect small scale renewable energy projects to the grid. – Secured £28m payment from Drax as a result of the company's
failure to meet the domestic energy efficiency upgrade targets (carbon reduction) it was set under the Community Energy Saving Programme (CESP)**.
• Committed to trials of smart grid technologies and battery storage whilst managing a portfolio of renewables (mostly wind).
^ Source: Increasing the Use of Low-Carbon Technologies; *Source: SSE Selects Accenture for Major Transformation Project; **Source: Ofgem Unveils Green Grid Plans
Plans & Actions
Progress • Key initiatives are focused on wind power (though being scaled
back), and a comprehensive program of pilots for DERs. Committed to delivering outcomes aligned to RIIO objectives: Cost efficiency, Reliability and availability, Customer service, Connections, Safety and environment.
• Outcomes delivered so far include Orkney Smart Grid Trials, Smart Storage Heating Trials and NaS Battery Pilot Project. Energy strategy not yet in place. Planning a potential £48m in savings from innovation in response to RIIO.
• Political uncertainty can destabilize expansion of renewables by removing financial incentives and/or disrupting approvals processes.
Implications for Australia
Energy Services
“Commitment to Optimize”

Copyright © 2014 Accenture. All rights reserved. Accenture Confidential Information. 40
Summary for Scottish and Southern Energy (SSE)
Financial Penalties Apply for Non-Compliance • Ofgem has begun issuing significant fines to those companies that do not meet their efficiency (carbon reduction)
targets. SSE is now under investigation for similar under performance. Advancing the rollout of DERs and smart grid initiatives could potentially offset future fines.
Limited Large Scale DER Initiatives • Most DER initiatives remain in pilot phase such as microgrids, storage and smart grid technology. SSE would gain
significant advantages by combining existing renewables capacity (wind, wave, tidal) with large scale deployment of these initiatives.
Policy Uncertainty Impacts Projects • SSE has recently announced it would be pulling out of a major wind farm project in the UK and scaling back
investment in wind (onshore and offshore). This development prompted the trade association RenewablesUK to state that numerous other projects are in danger of mothballing due to policy uncertainty.
Focus on Delivering RIIO Targets • SSE has committed to delivering improved outcomes in customer service, efficiency, reliability and safety for the
community and environment as mandated under the Ofgem RIIO policy. These outcomes will impact up to approximately 20% of their EBITA annually so will be an ongoing company priority to make sure they are met.

Copyright © 2014 Accenture. All rights reserved. Accenture Confidential Information. 41
Summary for Reposit Power
Financial Incentives for Early Adopters • Reposit Power supports the customer by identifying the optimal times to be feeding power back into the grid from their
PV or battery storage, thus gaining maximum financial returns from their energy production.
Scale and Pace to be Determined • Reposit Power posses a business model which has not yet been tested at scale and deployed into the Australian
utilities marketplace. Network operators are yet to construct a strategic response to this new entrant who has already piloted in Canberra (initially 6 energy storage and trading systems).
A New Business Model for Australia
• Reposit Power launched a business model that uses grid-tied solar storage located on residential premises to monitor and trade power back into the network. It is proposed that customers will benefit from greater independence from grid pricing and control of energy flow.
3rd Party Offerings
Potential Impacts to Load Profile • Reposit Power will be operating to maximise returns for the customer by buying and selling energy in the market.
These fluctuations could present challenges to the distributors by controlling the load profile on certain parts of the grid.

Copyright © 2014 Accenture. All rights reserved. Accenture Confidential Information. 42
Vandebron has created a disruptive platform offering for the Netherlands energy consumer by facilitating direct transactions with producers.
Vandebron
• Vandebron (means "from the source") is a private company founded in 2013 in the Netherlands. Vandebron established an online retail platform to directly connect energy producers (non-trad. generators) with consumers.
• Financial support from Rabobank, Delft Technical University, University of Wageningen and the WWF.
• Vandebrons platform offers a variety of energy options to consumers including wind, solar, biofuel and gas (gas is supplied by Groningen but is 100% CO2 offset).
Company Overview
Drivers for Change • Electricity prices for consumers are among the highest in the world. • Producers of renewables likewise do not have any power in
negotiating prices with traditional utilities companies. • Growth in customer interest in renewables and climate change,
leading to increased adoption of solar and wind technology. • The electricity industry in the Netherlands is deregulated, reducing
barriers to entry by new participants. • There is potential for Holland’s independent producers to generate
enough power for up to 1 million customers.
• Vandebron does not own any assets in the generation or distribution of energy.
• Vandebron therefore relies on the integration of DERs by the traditional network utilities to support the trading of energy on the platform.
3rd Party Offerings
Progress • Key initiatives are focused on increasing the producer and
consumer base in the Netherlands as well as develop plans for international expansion.
• Outcomes delivered so far include servicing over 12,000 customers with an aim to grow to 30,000 by the end of 2014. There are also currently 12 producers on the Vandebron platform generate enough excess energy to power an estimated 20,000 households.
• Whilst it is still early days in assessing the impact of competition for distributors, 3rd party participants are able to quickly enter and gain some market share in the energy market. These entrants can provide energy products, services and trading platforms as they are not subject to the same regulatory controls as network operators.
Implications for Australia
Plans & Actions

Copyright © 2014 Accenture. All rights reserved. Accenture Confidential Information. 43
Summary for Vandebron 43
Disruptive Force in Netherlands Energy Market • Vandebron has disrupted the utilities industry by bypassing the retailers to offer a transaction relationship directly
with the customer. This causes issues for the network distributers as Vandebron is not interested in optimising the grid that supports the platform.
Low Barriers to Entry • Vandebron’s participation in the energy market has a low invesment threshold as there is no ownership of assets
(network distribution or AMI/controls) and limited amount of capital required to build and manage the virtual platform.
How to ‘Become Relevant in Peoples Lives’ ( i.e. incentives to participate)
• DER producers are incentivised to participate by allowing independence in determining price instead of accepting what is offered by the traditional utilities. Consumers are encouraged to participate through pricing, autonomy to choose their energy mix and access to a community of like-minded energy users.
A New Business Model • Launched a virtual retail platform that enables direct transactions between consumers and producers of renewable
energy. Platform participants pay a monthly fee to access the website and can then choose energy options based around location, energy type and cost (as set by producers).
3rd Party Offerings

Copyright © 2014 Accenture. All rights reserved. Accenture Confidential Information. 44
As barriers to increased DER penetration subside (e.g. cost, competition, HEMs) grid operators will be faced with a number of potential strategic responses to remain competitive.
Response Options to DER Penetration 44
Issue Commonly Pursued Solutions 1) Cut costs through efficient management of the
grid • Increase asset utilisation by encouraging
customers to site DER at ‘optimal’ locations for system
• Encourage connection of all devices, especially at non-peak times
2) Keep customers connected to the grid
• Provide value based interactions among prosumers for the express goal of providing incentives to remain connected
3) Tariff changes
• Transition from volume-based revenue to capacity-based revenue
• Incorporate fixed charges
4) Find new revenue streams • New offerings / services
*Source: Accenture 2014 Digitally Enabled Grid Research 2.0. ^Source: Edison Electric Institute, “Disruptive Challenges: Financial Implications and Strategic Responses to a Changing Retail Electric Business,” 2013
DISRUPTIVE FORCES
Technology innovation and
market competition
Lost revenues Rate increases
Improved payback on energy
technologies
Increased distributed energy
and energy efficiency
deployment
Increasing energy efficiency and
distributed energy technology demand
DEMAND REDUCTION
LOWER TECHNOLOGY COSTS
ENERGY BILL INCREASES
BEHAVIOURAL CHANGE
IMPROVING MARKET ATTRACTIVENESS
MARKET DEVELOPMENT
RATE CASE TRIGGERED

Copyright © 2014 Accenture. All rights reserved. Accenture Confidential Information. 45
DER Integration Responses Commonly Pursued Solutions Examples
Cut costs through efficient management of the grid
• E.ON restructuring has led to the generation of nearly €20b in sales of assets so far (mostly power plant sales),
• Vattenfall reduced costs by over €300m, mainly through lower costs for operations and maintenance. This was unfortunately not enough to offset the impairment losses amounting to approximately €3b due to lower demand for conventional generation.
Keep customers connected to the grid
• Alliander has positioned themselves as a market leader in electric vehicle charging and infrastructure with their business line Allego which installs and manages charging infrastructure for electric vehicles (EV).
• Establishment of Home Energy Services business line within SSE, E.ON, and PG&E. Con Edison relies on rebates for energy efficient practices (disposal of old fridges, purchase of energy efficient appliances, thermostats etc).
Tariff changes
• New York already uses standby rates for those customers that have self-generation (i.e. DERs) but need the reliability of a back-up grid connection. Due to technology and cost impact of New York REV, it is likely these rates will have to change to ensure non-participants will not be disadvantaged whilst remaining an economically viable option for DER owners.
• Approximately 40 percent of PG&E’s residential solar customers and nearly all of its non-residential solar customers are on TOU rates combined with net metering.
• Con Edisons BQDM project will employ new surcharges to cover the cost of the program with a cap of USD$200m enforced by the regulator. Customers will benefit from the deferred infrastructure cost (estimated at USD$1b) so will also need to pay for a portion of the BQDM program.
• The Dutch utility sector changed all the distribution networks tariff to “capacity based” (kW) instead of the traditional energy (kWh) based tariff. These changes were driven by the desire to make the networks independent of the impacts of energy efficient and self-generation by prosumers, to simplify the B2B billing between networks and power retailers.
Find new revenue streams
• Alliander with EV technology, PG&E with solar offerings, VPP with Alliander and E.ON, E.ON repositioning the business to focus on renewables growth.
Sources: Accenture Research.

Copyright © 2014 Accenture. All rights reserved. Accenture Confidential Information. 46
Table of Contents
1. Project Intent and Background
2. Summary of Findings
3. Business Model Framework
4. Case Study Summaries
5. Jurisdictional Reviews
6. Appendix • Case Studies
• Market Summaries

Copyright © 2014 Accenture. All rights reserved. Accenture Confidential Information. 47
Globally there is a spectrum of regulatory responses to local market conditions from energy efficiency, renewables investment to mandated DER integration.
Comparable Markets Investigated
47
California • Aggressive push by state to rely on renewable sources of
energy, while pushing for DR solutions to aid grid mgmt.
• PSC requested long-term plans (CA 327) next year from DSO’s on how they will become ‘network platforms’. Debate on utility ownership of DER & EV charging stations.
Hawaii
• Strong recommendations put forward by PUC to move HECO (major energy distributer) towards an integrator and operator of the grid to leverage high renewables penetration.
United Kingdom: • Renewables targets and feed-in tariffs have driven
the DER market
• Retail suppliers own customer relationship, and Distribution Network Operators are largely confined to grid operations
• RIIO regulations switching revenue mechanisms to long-term planning with incentives if key milestones are met.
Australia: • Nationwide mandate to increase renewable
energy production and high DER penetration
• DSO’s increasingly seeking to keep customers on the grid through added value distribution market operator role, as defined by the Power of Choice regulations. Renewables driven by RET.
Germany: • Explosive growth in rooftop solar due to feed-in
tariff subsidies (‘Energiewende’)
• Retail suppliers own customer relationship, and Distribution Network Operators are largely confined to grid operations
• Limited regulatory protection or support for new distribution revenue model.
New York: • Progressive Governor and regulators created the REV
model as an initiative to ensure that NY improves resiliency and empowers customers with more choices
• Vision for DSO’s to become the ‘network platform’ creating a market for DER
• Shifting to long-term planning for DSO’s and debate over utility ownership of DER and role of retailers

Copyright © 2014 Accenture. All rights reserved. Accenture Confidential Information. 48
Multiple jurisdictions are driving policies that require a redefinition of the traditional network business model to address the increased complexity of future grid operations.
Jurisdiction Overview 48
Australia California New York Hawaii UK Germany
AEMC Power of Choice, AER Determinations
AB 327- The Distribution Resources
Plan
Reforming the Energy Vision’
(REV)
‘Inclinations on Future of Hawaii's Electric Utilities’
Ofgem RIIO
‘Energiewende’
• Progress towards a more customer-engaged, two-way grid model
• Shift investment from traditional grid enhancements to DER integration
• Designed to create dynamic, competitive energy markets that bring DERs to the forefront
• Reduce dependence on fossil fuels by building comprehensive portfolio of renewables.
• Long-term investment in IT/OT to support DER integration. Includes data management, communications infrastructure, smart metering etc.
• What will the new revenue model and ratemaking structure look like? How can the network provider continue to make money with declining load?
• Will distribution service providers be able to invest directly in distributed energy resources?
• Distribution service provider to act as a ‘market operator’ managing demand/supply on distribution grid and coordinating with wholesale market (includes new DER entrants and prosumers).
• Overhaul of traditional pricing structures to address different consumer needs based on location, timing, financial incentives and energy mix.
Policy Objectives Key Components
Unaddressed Questions & Considerations
Infrastructure
Participants
Pricing
Drivers for Change
• Who will own the data? Who will have access to customer data? • What is the role of retailer versus the distribution service operator? • Who will own the infrastructure e.g. microgrids, batteries? • How will utilities partner with the private sector to enable the
integration of DERs?

Copyright © 2014 Accenture. All rights reserved. Accenture Confidential Information. 49
Summary for New York State 49
Energy Efficiency Poses the Largest Threat to Industry The most imminent threats come from improvements in Energy Efficiency technologies – not commodity prices –
poised to cut Duke’s peak capacity by 5% by 2025, and the rapidly growing Solar PV Storage community.
DER Technology Remains in its Infancy EV penetration likely to be slow because of low turnover of U.S. fleet, providing marginal benefits to utilities through
incremental consumption. Fuel Cells also remain in their infancy. Any major breakthroughs for these technologies and others will rapidly change the pace of adoption and accelerate the impact for networks.
Policies (such as New York REV) will have Major Impact • The proposed introduction of a platform provider as the key enabler of market participation and innovation for the
utilities industry will transform the way the grid is managed and capital is invested for future energy needs.
Transaction Model Evolution
New York already employs standby rates for prosumers who need the reliability of a back-up grid connection. Due to technology and cost impact of New York REV, it is likely these rates will have to change to ensure non-participants will not be disadvantaged whilst remaining an economically viable option for DER owners.

Copyright © 2014 Accenture. All rights reserved. Accenture Confidential Information. 50
New York: Key Drivers • DER Development
– Rising electricity costs (second highest in the country), extreme weather events like super storm Sandy with prolonged outages and environmental concerns are driving interest in modernizing the grid to improve reliability and resiliency.
– Bulk power system is oversized to meet the demand of the few hours of peak demand every year. – Eliminate peak by identifying economic applications of storage and moving towards time-based rates. – T&D system has annual losses of nearly 9%. – No adequate storage for electricity. – The cost for power delivery is 4.5 times higher than the commodity, and utilities have a 57% capacity
utilization rate. With no change, New York would require $30B in investments over the next decade*.
• Policies & Regulations – Renewable portfolio standards, federal Investment Tax Credit, and local performance-based incentives are
growing the DER market, particularly solar. – Progressive Governor, legislative body and regulators in the state are pushing the REV model to ensure that
NY enables and brings to market DER and clean energy solutions.
• Weather Events – Super Storms such as that experienced in 2012 with Hurricane Sandy, have driven concerns to maintain
business /operational continuity in the grid and improve resiliency of critical facilities.
*Source: “NY Energy Czar Sheds More Light on ‘Restructuring 2.0.” Colin Sullivan. E&E Publishing. May 23, 2014. Accenture Research. ^Source: Slow Going for State Renewables Plan, Dec 2014

Copyright © 2014 Accenture. All rights reserved. Accenture Confidential Information. 51
The REV program focuses on shifting utility regulation to meet the needs of a more distributed, consumer-focused energy system.
New York Reforming the Vision (REV) Program Overview
• Distributed Resource programs (at distribution level) • Performance-based rate incentives; primarily negative
adjustments for failure to meet min service thresholds • Customer-sited generation Interconnection standards • Energy Efficiency programs • Customer-sited clean energy programs • Advanced energy technology R&D programs • Green Bank financing advanced energy projects • Implementation of statutory net metering requirements • Standby rates, time of use rates and gas delivery rates
for customers with distributed generation.
Source: Reforming the Energy Vision. NYS Department of Public Service. April, 2014.
Key Objectives • Increasing customer knowledge and providing
tools that support effective management of their total energy bill
• Market animation and leverage of ratepayer contributions
• System-wide efficiency • Fuel and resource diversity • System reliability & resiliency
Program Vision A "customer-oriented regulatory reform“ with market
and incentive structures to empower customers to participate in the market and optimize their energy use.
Not intended to replace central generation – rather complement it with efficient DER deployment.
Core vision: a Distributed System Platform (DSP) that enables market-based deployment of DERs.
• Central to REV is the Distributed System Platform Provider (DSPP), which enables and facilitates a modern, interconnected, flexible grid giving rise to new products, services and business models.
1
2 Leverage Existing New York Utility Distributed Energy Resources (DER) Initiatives
Establish a Distributed System Platform Provider
Outcomes

Copyright © 2014 Accenture. All rights reserved. Accenture Confidential Information. 52
To deliver on the New York REV, a Distributed System Platform Provider (DSPP) has been proposed as the vehicle to manage the platform for grid optimisation.
New York REV: Proposed Operating Structure
The NYC utilities platform is designed to integrate, manage and coordinate DERs across the grid to manage load, optimise system operations and enable distributed generation.
DSP operated by Distributed System Platform Provider (DSPP) to manage bids from a range of DER providers and optimise dispatch of DERs into system.
As an active operator, the platform provider will act as a balancing authority to forecast load and dispatch resources in real time. The goal is therefore to create a more efficient system load profile (i.e. reduce peak loads).
Distributed System Platform
(DSP)
Distributed Energy
Resources (DER)
Customers
• Access to customers • Demand information • Incentives for supply
• Single user interface for energy options
• Forecast, load & dispatch • Incentives for usage
• Bid / supply information
• Tariff / service fee • Demand information
DSPP
Sources: Utilities Shift from Monopoly Model Source: Reinventing the Utility
Operating Principles Responsibilities of DSPP Manage the Grid Actively coordinate customer activities
so the utility’s service area as a whole places more efficient demands on bulk system.
Create New Markets for Value-Added Energy Products & Services: Enable behind-the-meter resource providers to monetize products and services that will provide value to utility system and customers.
Introduce New Offerings: Introduce new markets and products at distribution level that yield further benefits to customers.
Manage Customer Data Access & Privacy: Resolve privacy and ownership issues related to customer data.

Copyright © 2014 Accenture. All rights reserved. Accenture Confidential Information. 53
Summary for the United Kingdom 53
Limited Pressure from Regulators for Distributors to be Aggressive in Pursuing DERs
• Ofgem focuses on controlling pricing through RIIO, carbon reduction and supporting renewables under the Renewables Obligation scheme. Main incentive for renewables investment/integration is most likely to avoid fines incurred by failing to meet carbon reduction targets however this is a risky strategy as distributors will be exposed if pace of DER adoption intensifies.
DER Adoption Uncertainty Affects Network Planning • Debate about how aggressively distributors should invest in DERs given uncertain trajectory of DER take up by
consumers. This led many distributors to focus instead on efficiency improvements and CO2 reduction initiatives. SSE overestimated take-up of DERs which required reset forecasts whilst E.ON reduced its scale of renewables investment.
Capacity Issues Due to Changing Policy Landscape • UK faces power capacity issues due the shut down a number of ageing and polluting stations. E.ON will shut one gas-
fired power station and expects to reduce output at three others despite warnings from UK National Grid of a capacity crunch and potential blackouts. New plants have been slow to start operating due to the overhaul of energy policy.
Potential Upside in Outlook for HEMS Growth • Significant opportunities identified in integrating energy commodity with energy services as retail platform for growth.
UK home energy services market is substantial and is forecast for steady growth to reach a value of approximately £9bn by 2015.

Copyright © 2014 Accenture. All rights reserved. Accenture Confidential Information. 54
United Kingdom: Key Drivers • Policies & Regulations
– The RIIO Framework was developed to set price controls for network companies to oversee price increases from utilities associated with the future upgrades required to the existing network infrastructure. RIIO also seeks to incentivise network companies to plan for long term efficiency and to connect low carbon technology
– The overall market structure prevents distribution network operators from entering into DER and other customer engagement/ energy management solutions. Electricity Suppliers typically play this role.
– Ofgem has stated that the role of Distribution Network Operator (DNO) is to locally balance demand and supply on their networks.
– Distribution Service Operators (DSO) are not responsible for ownership and operation of AMI and cannot develop services around these solutions as a result.
– Innovation Funding from the Low Carbon Networks Fund and the Innovation Funding Incentive have pushed DNO’s to set up trials and pilots on managing DER on their systems.
– Incentives on CSAT and efficiency related to new DER connections has increased focus by DNO’s. – Ofgem has recently calculated the cost of ‘rewiring’ the network at ~£50 billion. This would enable greater
flexibility in the grid, allow integration of renewables and improve energy efficiency across the grid. • DER Development
– Renewables obligation and feed-in tariff are driving market growth in renewable DER. • Customers
– Regulation as well as a general lack of trust has led to customers to buy energy from non energy companies such as M&S Energy and Sainsbury Energy.
– Most major UK utilities (including E.ON and SSE) offer customers rewards/incentives for loyalty either through partnering with existing programs or creating their own. Customers expect loyalty rewards – rather than providing a competitive advantage, mimicking other loyalty programs has simply created a competitive stalemate*. *Source: “Customer Retention through Loyalty Management”, Cognizant
Technology Solutions, June 2010

Copyright © 2014 Accenture. All rights reserved. Accenture Confidential Information. 55
The Revenue, Incentives, Innovation, Outputs (RIIO) framework sets price controls for distribution network operators (DNO’s) companies from April 2015 to March 2023.
United Kingdom: RIIO Policy Summary
Recognizing the significant investments required to maintain a reliable and secure network with changes in demand and generation/ DER in a low carbon future, Ofgem has developed a long-term performance-based model for setting DNO price controls. The RIIO policy is an acronym for:
• Incentives to drive the innovation needed to deliver a sustainable energy network that offers value for money to existing and future consumers
• Established the Low Carbon Network Fund for innovation initiatives. Now moving to a competition to fund innovation across T&D (up to 180M pounds available)
• Ofgem sets outputs for safety, environmental impact, reliability, CSAT, DER connections, and stakeholder engagement, for DNOs to provide a better service for connecting customers, including distribution connected generation customers.
Incentives exist for: • Environmental Impact:
reduce system losses, carbon footprint, reporting on environmental impact.
• Social: improve info on customers connected to the system and improve assistance provided; enable energy solutions for vulnerable households
• Connections: CSAT and average time for connections
• Reliability: interruption incentive scheme (IIS), network resilience
Source: Ofgem Strategy Decision for the RIIO-ED1 Electricity Distribution Price Control
INCENTIVES INNOVATION OUTPUTS REVENUE
For an average DNO, both the rewards for good performance and the total value of penalties could be up to around 300M pounds over the RIIO-ED1 period starts April 1, 2015. Ofgem will approve revenues for the 14 distribution network operators over an 8 year period through 2023.

Copyright © 2014 Accenture. All rights reserved. Accenture Confidential Information. 56
Summary for California 56
Government Policy Mandates Clear Distributed Resources Planning • California is taking an assertive approach to increasing renewable energy footprint by having utilities address growth in
DERs. Companies need to be able to demonstrate clearly how they will build a two-way, customer engaged grid model. This includes how to integrate grid-edge systems such as PV, and distributed energy storage.
Limited Direction for Energy Efficiency Technologies Government policy has minimal impact on Energy Efficiency technologies beyond eliminating inefficient products
from the marketplace; a faster pace in innovation, coupled with low switching costs, would dramatically accelerate adoption.
Ambitious Targets for 2030 California has just announced an update to their 2030 target to 50% renewables. This makes their target the most
aggressive state in the US (passing previous leader Hawaii which is targeting 40%). Legislation has also been enacted to support new technologies such as energy storage.
Program to Overhaul State Electricity Industry California has one of the most aggressive infrastructure spending programs in the nation, with major commitments
planned for demand-side management, T&D, and generation. Companies such as PG&E will be highly influenced by their plans.

Copyright © 2014 Accenture. All rights reserved. Accenture Confidential Information. 57
California: Key Drivers • Policies & Regulations
– The Public Utilities Commission (PUC) has pushed to move the state towards a more network oriented grid model.
– Monetary savings to Ratepayers (Distribution Resource Plan). – PUC has requested long-term plans (AB 327) next year from DSO’s on how they will become ‘network
platforms’.
• DER Development – Debate on utility ownership of DER & EV charging stations. – High level of growth in EV market, requiring greater EV infrastructure.
– Requirement to maintain adequate level of electric grid capacity to meet the needs of all customers while minimizing cost and environmental impact.
– Continued focus on microgrids, ranging from campus-wide microgrids and miliitary installations in San Diego, to federal and state-funded projects testing new combinations of solar, storage, energy management and power electronics.
– California’s utilities have deployed millions of smart meters, and are starting to create the distributed energy resource management systems to manage the rising amount of electricity being generated on the edge of the state's grid.
• Emerging Customer Offerings – Growing demand for customer centric solutions such as Green Button and HAN which help customers
manage their energy usage using real time data.
Source: Accenture Research.

Copyright © 2014 Accenture. All rights reserved. Accenture Confidential Information. 58
California: Relevant Policies / Legislation Policy Description
Renewable Portfolio Standard
Goal to increase renewable energy resources to 33% of total procurement by 2020; 12,000 MW of DG to be part of the 20,000-plus MW of renewable capacity the state’s utilities have been ordered to put in place by 2020.
The Distribution Resources Plan – AB-327
Generate a Distribution Resources Plan by July 1, 2015 to shift towards a more customer oriented networked grid model. Manage and optimize the distributed resources (ex. Renewable generation, energy storage, EV’s).
EV Charging Infrastructure
Ruling on allowing investor owned utilities to invest in EV infrastructure. Proposal has yet to be approved by the state, decision to come in a few weeks.
California Public Utilities Commission – Renewables Reforms
Multiple Reforms have been Implemented: • Requirement that California’s big three investor-owned utilities to add 1.3 gigawatts of energy storage to
their grids by decade’s end. • Passage of AB 327 – designed to update the electricity rate structure as well as ensure net metering
initiatives continue into the next decade. There is also a push to mandate “smart inverter” features for its solar installations, and the host of electricity tariff, solar net metering and distribution grid planning.
• Assembly Bill 2514: Mandated for the statewide energy storage to enable a “market transformation” for new technologies such as batteries, energy storage and capture-and-release technology.
AB1150 Self-Generation Incentive
In 2011, California Senate Bill 412 modified the primary purpose of SGIP from peak load reduction to greenhouse gas emissions reductions and subsequently, modified the program's incentive eligibility criteria to support technologies that achieve GHG reductions. Eligible technologies include wind turbines, pressure reduction turbines, fuel cells, advanced energy storage, waste heat capture and combined heat and power internal combustion engines, microturbines and gas turbines.
Source: http://www.cpuc.ca.gov/PUC/energy/Distribution_Resources_Plan.htm http://www.greentechmedia.com/articles/read/california-utilities-are-back-in-the-ev-charging-game. https://energycenter.org/programs/self-generation-incentive-program/background Accenture Research.

Copyright © 2014 Accenture. All rights reserved. Accenture Confidential Information. 59
Summary for Germany 59
‘Energiewende’ Continues to Influence the Energy Landscape in Germany • Shifts in the regulatory environment greatly impacted traditional utilities network providers by decreasing demand for
conventional energy whilst increasing pressure to maintain a large network. The premature shutdown of nuclear facilities have also left Germany without a strong back up supply of power.
Consumer Attitudes Key to Acceleration • The German government underestimated the consumer appetite for change, leaving them unprepared for the massive
injection of electricity supply into the network. Feed-in-tariffs were very effective in encouraging investment in renewables however the burden is on the network providers to support capacity.
Storage Presents Significant Hurdle to Future Growth • There is limited investment in storage capacity which could more effectively store excess energy generated from
renewable sources (especially solar) for peak times when the grid could put it to best use.
Virtual Power Plants Support Energy Transition • Renewables integration is subject to increasing volatility in the reliability of supply. The Virtual Power Plants seeks to
manage this issue (particularly for commercial/industrial) by aggregating excess renewables supply as well as optimising fossil fuel generation to manage load for the network.

Copyright © 2014 Accenture. All rights reserved. Accenture Confidential Information. 60
Germany: Key Drivers • Policies & Regulations
– Introduction of Energiewende – a policy approach developed by the German government to accelerate energy transition from fossil fuels to renewables
– Due to market structure, customer engagement by DSO’s is limited. – Perceived risk regarding disaster management and storage for nuclear energy. – State preference to reducing Germany’s dependence on imports for conventional energy (as opposed to
renewables, which are locally produced). – Main priority for DSO is to ensure that the grid is efficient and dependable.
• DER Development – Heightened public awareness of the role fossil fuels play in contributing to climate change. Scarcity of
resources leading to increasingly expensive fossil-fuel energy based system. – Smart home solutions are mostly pilot projects taken on by big retailers.(RWE, E.ON). – Home energy management market is relatively small in Germany. – High growth in DER (solar) is driven by in part by feed-in-tariffs. – Decrease in reliance from traditional energy sources (Nuclear, Fossil Fuel). – Increase production from renewable sources, to reduce negative environmental impact.

Copyright © 2014 Accenture. All rights reserved. Accenture Confidential Information. 61
Germany/Europe: Relevant Policies/Legislation Policy Description European Smart Meter Initiative
By 2020, at least 72% of European consumers should be equipped with smart meters, allowing for real time pricing in accordance with demand response programs
Distributed Generation
Germany permits DNO’s (Distributed Network Operators) to charge distributed generation customers for ”contributions to connection and construction costs”. This allows the operator to spread/share the construction cost with the customer.
German Smart Meter Initiative
Smart Meters must be installed in all new buildings or buildings undergoing renovation. Customers consuming over 6000 kWh per year are required to also have a smart meter installed. (Nationwide rollout is not scheduled)
Smart Grid Initiative Wildpoldsried has enabled a smart grid to help optimize and manage its various sources of renewable energy (wind turbines, biogas plants, solar thermal systems)
Green Energy Policy The German government is committed to cutting CO2 emissions by 40% thru 2020. Norwegian state power company will expand its investment in renewables to $8b globally.
Energiewende – Energy Transformation
Terminology used to describe the transition by Germany to an energy portfolio dominated by renewable energy, energy efficiency and sustainable development. Legislated in 2000, Energiewende has two key targets: 1) Electricity supply will consist of at least 80 percent share of renewable energies by 2050 and 2) Reduce energy consumption by 10 percent by 2020 and 25 percent by 2050 compared to 2008 levels. • Renewable Energy Act: Specifies that renewables have priority on the grid and that investors in
renewables must receive sufficient compensation to provide a return on their investment irrespective of electricity prices on the power exchange.
• Cogeneration Act: To achieve 25% of power from cogeneration units, the Act will pay bonuses for cogeneration relative to system size irrespective of the feedstock.
• Nuclear phase-out, Emissions Trading System, Environmental Taxation • Renewable Energy Heating Act and Market Incentive Program (MAP), Act on Accelerating Grid
Expansion Source: Accenture Research.

Copyright © 2014 Accenture. All rights reserved. Accenture Confidential Information. 62
Summary for Hawaii
A Clear Direction has Been Set for Utilities • The Public Utilities Commission recommended that the Hawaiian Energy Corporation focus on becoming an efficient
integrator of distributed resources and operational systems on the distribution system – strongly leveraging renewables.
High Cost of Electricity • The Hawaiian commercial environment is supportive of renewables adoption due to reliance on fossil fuels for oil-fired
generation which is required to be imported to the island at high cost. These high cost inputs translate into some of the highest retail prices in all of the United States but have also made wind and solar power more cost competitive.
Market Conducive to Renewables R&D • In Hawaii, each island is its own independent power grid, with no interconnection and no backup. Hawaii is also
supportive of energy R&D with incentives and support offered to companies that wish to test and deploy new technologies in a representative market.
Government Led Programs Encourage DER Penetration • Hawaiian government not only encourages DER penetration through R&D support but has also initiated its own
projects like the Hawaii Department of Education’s Ka Hei program, which involves plans to construct 100 MW of solar PV at Hawaiian schools, partially in microgrids.

Copyright © 2014 Accenture. All rights reserved. Accenture Confidential Information. 63
Hawaii: Key Drivers • DER Development
– Petroleum-fired power plants supply the majority of Hawaii's electricity generation. Six main islands are not connected, thus are required to be energy independent.
– Solar-plus-storage reached grid parity for commercial class and is nearing such a point for residential customers. Strong anticipation of early adoption of other distributed resources as new technologies enter the marketplace.
– Circuits on Hawaiian Electric distribution grids reach levels of rooftop PV capacity that are 120% or more of the circuit's daytime minimum load. There is now a backlog of PV applications due to passing this threshold, as an interconnection study may be required before the new PV system can be approved.
• Policies & Regulations – In Hawaii, the Public Utilities Commission rejected HECO’s Integrated Resource Planning Report (IRP) in May 2014. Reasons
given included a lack of strategic focus and proposed capital expenditures were of questionable long term value. – Public Utilities Commission published "Inclinations on the Future of Hawaii's Electric Utilities” with the following
recommendations for HECO: • Become the facilitator, integrator and operator of a grid with high penetrations of utility-scale renewables and distributed energy resources; Integrate
large quantities of utility-scale, lower cost renewables/ Distributed Resources (DR); Be a system integrator and aggregator of data; Modernise generation system to integrate high penetration of renewables; Achieve maximum operational efficiencies in existing power plants; Integrate smart grid technology (storage, electric vehicles, and meters) into the operating system; Advance electricity rate structures through dynamic pricing, incentives, capacity and time of use options
• Emerging Customer Offerings – NextEra Energy Inc., North America’s largest generator of wind and solar power, will take over HECO in what the company
sees as a proving ground for its push into green energy^. – Groups such as Energy Excelerator have been developed from the Hawaii Renewable Energy Development Venture to enable
start-ups to test and deploy new energy technologies to market. – Approximately 12% of the population of Oahu have solar, compared to the rest of the U.S. with ~0.5%. The average capacity
of residential net-metered PV systems in Hawaii has also been increasing as larger and more efficient PV systems are installed.
– Hawaiian Electric has recently proposed to the commission to raise allowable PV penetration threshold from 120% to 250% of a circuit's daytime minimum load. This change would be accompanied by a decrease in the amount received by new net-metered PV customers for the excess electricity they send back to the grid.
^Source: NextEra buys Hawaiis Biggest Utility; Hawaiis Grid to Accept Solar

Copyright © 2014 Accenture. All rights reserved. Accenture Confidential Information. 64
Hawaii: Relevant Policies / Legislation Policy Description
Hawaii Clean Energy Initiative
A goal to use renewable resources such as wind, sun, ocean, geothermal, and bioenergy to supply 70 percent or more of Hawaii's energy needs by 2030 and to reduce the state's dependence on imported oil.
House Bill 2502 Allows solar energy facilities to be located on less-productive agricultural lands.
House Bill 3179 Makes it easier for biofuel producers to lease state lands.
SB 2034, SB 3190, and HB 2168
Authorize special purpose revenue bonds to help finance a 2.7-megawatt wave energy facility off the coast of Maui, a solar energy facility on Oahu, and hydrogen generation and conversion facilities at the Natural Energy Laboratory of Hawaii Authority, located on the island of Hawaii.
Senate Bill 644
Prohibits the issuing of building permits for new homes without solar water heaters as of 2010. The bill excludes homes located in areas with poor solar energy resources, homes using other renewable energy sources, and homes employing on-demand gas-fired water heaters. The bill also eliminates solar thermal energy tax credits for those homes.
Senate Bill 988 Allows the Hawaii Public Utility Commission to establish a rebate for solar photovoltaic electric systems
HB 2550 Encourages net metering for residential and small commercial customers
HB 2863
Provides streamlined permitting for new renewable energy facilities of at least 200 megawatts in capacity. HB 2505 creates a full-time renewable energy facilitator to help the state expedite those permits, while a third bill, HB 2261, will provide loans of up to $1.5 million and up to 85% of the cost of renewable energy projects at farms and aquaculture facilities.
Source: Accenture Research.

Copyright © 2014 Accenture. All rights reserved. Accenture Confidential Information. 65
Initiatives to Modernise the Grid: Other Jurisdictions
© 2014 Accenture. All rights reserved.
State Program/Key Aspects Scope Stakeholders Timeline
Grid Modernization Plan
Utilities required to: submit a 10-yr plan to reduce the effects of outages, optimize demand, integrate distributed resources, and improve workforce and asset management. Also must include a 5-yr short-term AMI investment plan. Three other specific topics in separate proceedings will be addressed: time varying rates; cyber security, privacy, and access to meter data; and electric vehicles
• AMI • DG • Variable rates • Security • EV
• MDPU • National Grid • Northeast Utilities • Unitil
Early 2015 • MDPU
• article
Energy Infrastructure Modernization Act (EIMA)
Regulatory reform enacted by IL state legislature in 2011 authorizing ComEd to implement a 10-yr, $2.6 bil investment program to:
• Create performance-based formula rates • Provide for infrastructure modernization • Drive smart grid investment
• AMI • ICC • ComEd • AmerenIL
2011-2017
• article
The e21 Initiative, formed by the Great Plains Institute, brings together Xcel Energy, Minnesota Power, George Washington University Law School, the Center for Energy and Environment and regulatory observers to proactively address the "changing nature of the electric energy system."
• EE • Renewables • DG
• Great Plains Institute
• Xcel • Minnesota Power • George Washington
Univ. • CEE
• E21
• article
MA
IL
MN

66 Copyright © 2014 Accenture. All rights reserved. Accenture Confidential Information.
Appendix

Copyright © 2014 Accenture. All rights reserved. Accenture Confidential Information. 67
Virtual Power Plants
*Non-exhaustive list Source: Accenture Research; Siemens VPP
WHAT: Virtual Power Plant (VPP) refers to a cluster of small-scale generators such as wind generators, photovoltaic plants, biomass facilities, and combined heat and power (CHP) plants that are integrated through advanced software to collectively act like a single large power plant, thus avoiding the fluctuations that characterize individual renewable power facilities.
How Does it Work?
• Manages a network of generators including photovoltaic, biomass, combined heat and power (CHP) plants and wind generators as well as traditional fossil fuel based generation.
• Processes weather bulletins, the latest power prices, and consumer demand in order to produce hourly forecasts and operating schedules for the virtual facility’s constituent generators.
• Advanced metering and computerized control are used to monitor and respond to fluctuations in the network load.
Illustration: A Virtual Power Plant aggregates energy sources to operate as a single power plant.
Participating Distributors*
• E.ON • Vattenfall • RWE (~80MW capacity) • Alliander (Liander)
Technology Providers*
• Siemens • Bosch • Next Kraftwerke

Copyright © 2014 Accenture. All rights reserved. Accenture Confidential Information. 68
Virtual Power Plants Continued What are the Benefits?
• Revenue generated from spare heat and power capacity that would normally be wasted.
• Reduced equipment and maintenance costs. • Real-time optimisation of energy resources enables
flexibility of both supply and demand. • Can segment customers by energy type or geography to
improve forecasts and operational decision making. • Minimize wear and tear on systems by reducing on/off
cycles and ramping rates. • Add wind and solar generation without compromising
power quality and reliability.
How do VPPs Generate Revenue?
• Commercial/ Industrial: distributor sells the power for the plant operators either on an exchange (such as the European Energy Exchange) or on the spot market for balancing energy, where higher prices are paid for power that’s available at short notice.
• Individual generators, which may be too small to trade can receive a premium on the normal feed-in tariff per kilowatt hour.
*Non-exhaustive list Source: Accenture Research; Siemens VPP, Navigant Research
How Does a Virtual Power Plant Differ from a Microgrid?
• Can be grid-tied or off-grid • Typically require some level of storage • Dependent upon hardware innovations such as inverters • Typically only tap resources at the retail distribution level • Can “island” themselves from the larger utility grid • Still face regulatory hurdles
• Always grid-tied • May or may not feature storage • Software dependent) • Can also create a bridge to wholesale markets • Cannot “island” themselves from the larger grid • Can be implemented under current regulatory structures
and tariffs
VPP Microgrid
VS.

Copyright © 2014 Accenture. All rights reserved. Accenture Confidential Information. 69
Microgrids
*Non-exhaustive list Source: Accenture Research, GTM Research; Navigant Research
WHAT: an independently operable part of the distribution network, including distributed energy sources, loads and network assets, that is controlled within clearly defined geographical boundaries and can operate in grid-connected or islanded mode. Utility distribution microgrids are expected to reach nearly $6 billion in annual revenue by 2023.
Benefits Participating Distributors*
• San Diego Gas & Electric • Duke Energy • E.ON • Con Edison • Vattenfall • RWE
How Does it Work?
• Reduced power and heat consumption. • Cost savings from improved maintenance. • Increased network reliability. • Strategic deployment in congested area. • Local DERs replace new distribution line.
• A combination of several networks and generation assets. • The networks include power and heat distribution
infrastructure, as well as the communication network necessary to transmit control signals to manage loads and generators downstream of the point of common coupling.
• Proximity of generators and loads, optimization strategies through microgrid controllers, and islanding capabilities, as well as coordination of energy and heat use.
Technology Providers*
• General Electric • ABB • Siemens • Lockheed Martin, • Honeywell • Boeing
How do Microgrids Generate Revenue?
• Microgrids can strengthen the network at the local level, deferring larger investments in grid upgrades (e.g. distribution lines and/or substations).
• Revenue from demand response and capacity guarantees. • The microgrid may also act as a customer of the grid, buying
power from the grid when its own generators are down for repair or when grid prices are more favorable than self-supply.
• Cost avoidance of peak demand charges, outage cost, fuel costs.

Copyright © 2014 Accenture. All rights reserved. Accenture Confidential Information. 70
Despite the considerable technical complexity of microgrid deployment, the top six barriers to proliferation are regulatory in nature.
Market Barriers to Microgrid Proliferation
Utility franchise rights Threat of being subject to
public utility regulation Insufficient definition of
interconnection possibilities
• Prospect of being treated as a traditional utility make is more difficult to achieve economic viability.
• The safety implications of intentional microgrid islanding remain controversial.
• The need for development of customised interconnection techniques is a substantial market barrier.
• Selling power to third parties via new distribution lines infringes on utility franchise rights.
Unresolved issues around distribution network costs
Lack of microgrid financing modes and performance metrics
Absence of scalable prototype and all in one deployments
• High upfront costs constrain third-party interest in micro grids.
• Lack of performance metrics.
• Most deployments are highly customised and installed. incrementally. Lack of utility leadership and turnkey providers.
• Distribution network upgrades. • Lack of clarity around standby
charges.
1 2 3
6 5 4
Source: GTM Research