Embed Size (px)
Citation preview

Kim Hyun-Min
‘New Normal’ Emerges From Chinese Bubble
Tecnon OrbiChem Marketing Seminar at APIC 2015
Seoul, 7 May 2015

• Review of Chinese Economic Background
• Bubbles in the Polyester Chain
• Bubbles in Other Sectors
� Caprolactam
� Acetic Acid
� 2-EH
� Acrylic Acid
• ‘New Normal’ in China’s Economy
• ‘New Normal’ in the Polyester Chain
• Conclusions
Source: Tecnon OrbiChem
APIC 2015
AGENDA

• Central Government Stimulus Package
Huge spending in 2009-2010 as it sought to boost flagging economic growth• Local Government
To meet GDP targets, raised revenue by selling land for petrochemical projects• Real Estate
Losses from projects could be covered by high real estate appreciation
APIC 2015
THE START OF THE BUBBLE IN CHINA

0.0
2.0
4.0
6.0
8.0
10.0
12.0
1997 1999 2001 2003 2005 2007 2009 2011 2013 2015 2017
Paraxylene
PET Resin
PTA
Source: Tecnon OrbiChem
APIC 2015
CHINESE POLYESTER CHAIN CAPACITY BUBBLES
Annual Capacity Addition (Million Metric Tons)

China PTA Imports(1,000 Metric Tons)
From 2009 2014% Change’14 /‘09
South Korea
3,215 699 -78
Taiwan 1,907 73 -96
Others 1,134 391 -65
Total 6,256 1,163 -81
China Must Export PTA?(1,000 Metric Tons)
0
2000
4000
6000
8000
2009 2010 2011 2012 2013 2014
Import
Export
463 in 2014
APIC 2015
CHINA PTA IMPORTS & EXPORTS
Source: Tecnon OrbiChem

-5.0
0.0
5.0
10.0
15.0
0
10
20
30
40
50
2006 2008 2010 2012 2014
Growth Rate
Capacity increased by 71.4% from 2009 to 2015
(Million Metric Tons) (% Y-o-Y)
Source: Tecnon OrbiChem
MillionMetric Tons
20092015(est.)
2019(est.)
World 27.5 41.3 53.3
China 17.4 29.6 42.2
China % of World Total
63% 71% 79%
APIC 2015
CHINESE POLYESTER FIBRE CAPACITY (VIRGIN)& PRODUCTION
PRODUCTIONCAPACITY

APIC 2015 CHINA PET RESIN SUPPLY/DEMAND & EXPORTS
0
1
2
3
4
5
6
7
8
9
10
2006 2008 2010 2012 2014 2016
Export
Demand
Capacity
0
500
1000
1500
2000
2500
2006 2008 2010 2012 2014 2016
Korea
Taiwan
China
(Million Metric Tons)
2.7 Million Tons Surplus
(1,000 Metric Tons)
• China capacity grows from 3.3 to 9.4 million tons in 2016 (+180%)
• Total world capacity to reach 32 million tons by 2016
• Future growth projections have been lowered to between 4-5% per year
Source: Tecnon OrbiChem
SUPPLY & DEMAND EXPORTS

0
10
20
30
40
50
60
70
80
90
100
2009 2010 2011 2012 2013 2014 2015 2016 2017
2-Ethylhexanol
Acetic Acid
Acrylic Acid
Caprolactam
Capacity Additions (Y-o-Y%)
Source: Tecnon OrbiChem
APIC 2015
OTHER CHINESE CAPACITY BUBBLES

0
500
1,000
1,500
2,000
2,500
3,000
3,500
4,000
2005 2007 2009 2011 2013 2015 2017
Imports
Production
Consumption
Capacity
(1,000 Metric Tons)
APIC 2015
CHINA CAPROLACTAM SUPPLY & DEMAND
Source: Tecnon OrbiChem

0
2,000
4,000
6,000
8,000
10,000
12,000
2005 2007 2009 2011 2013 2015
(1,000 Metric Tons)
Production
Consumption
Capacity
Capacity increased by 111.6% from 2009 to 2015
APIC 2015
CHINA ACETIC ACID SUPPLY & DEMAND
Source: Tecnon OrbiChem

0
500
1,000
1,500
2,000
2,500
2011 2012 2013 2014 2015 2016 2017 2018
Production
Imports
Consumption
Capacity
(1,000 Metric Tons)
APIC 2015
CHINA 2-EH SUPPLY & DEMAND
Source: Tecnon OrbiChem

0
500
1,000
1,500
2,000
2,500
3,000
3,500
4,000
2008 2009 2010 2011 2012 2013 2014 2015 2016 2017 2018
Source: Tecnon OrbiChem
APIC 2015
CHINA ACRYLIC ACID SUPPLY & DEMAND
Consumption
Capacity
(1,000 Metric Tons)

• Shift from high-speed growth to medium-high growth
• Shift from quantity and speed to quality and efficiency
• Shift to an innovation-driven growth model.
• 2015 GDP growth target ‘approximately 7%’
APIC 2015
THE ‘NEW NORMAL’ IN CHINA’S ECONOMY
47
48
49
50
51
52
53
54
2011 2012 2013 2014 2015
NBS PMI HSBC PMI
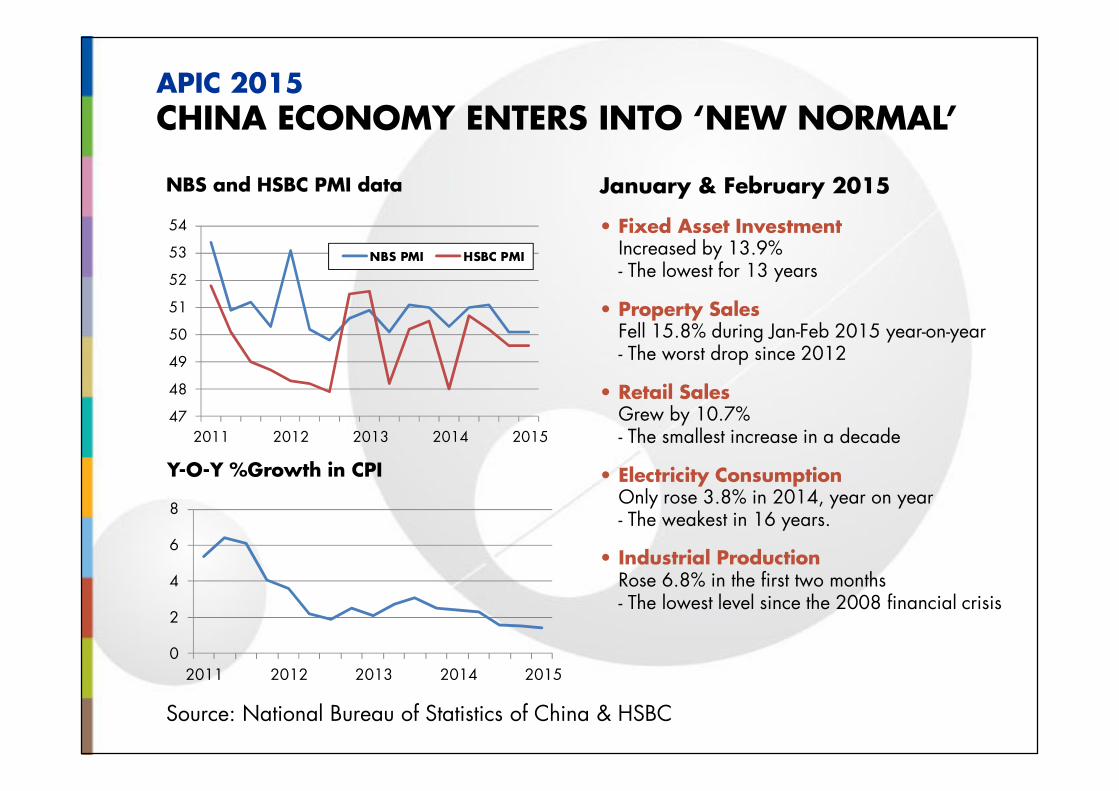
NBS and HSBC PMI data
0
2
4
6
8
2011 2012 2013 2014 2015
Source: National Bureau of Statistics of China & HSBC
• Fixed Asset InvestmentIncreased by 13.9%- The lowest for 13 years
• Property SalesFell 15.8% during Jan-Feb 2015 year-on-year- The worst drop since 2012
• Retail SalesGrew by 10.7%- The smallest increase in a decade
• Electricity ConsumptionOnly rose 3.8% in 2014, year on year- The weakest in 16 years.
• Industrial ProductionRose 6.8% in the first two months- The lowest level since the 2008 financial crisis
Y-O-Y %Growth in CPI
January & February 2015
APIC 2015
CHINA ECONOMY ENTERS INTO ‘NEW NORMAL’

(Y-o-Y % Growth)
0
5
10
15
20
25
30
2009 2010 2011 2012 2013 2014
Single MonthCumulative Value
CHINA SOFT DRINK PRODUCTION
0
5
10
15
20
25
30
0
20
40
60
80
100
120
140
160
180
200
2007 2008 2009 2010 2011 2012 2013 2014
APIC 2015
SLOW PACE OF DOWNSTREAM DOMESTIC GROWTH
Source: National Bureau of Statistics of China
CHINA RETAIL SALES OF GARMENTS, FOOTWEAR, HATS & KNITWEAR
(Y-o-Y % Growth)(Million Metric Tons)

(Million Metric Tons)
APIC 2015
CHINESE POLYESTER FIBRE OVERCAPACITY (Virgin)
Production
Capacity
Growth ratePolyester Filament
Production
Capacity
Growth ratePolyester Staple
(Y-o-Y %Growth)
• Polyester fibre capacity growth rate expect to maintain over 10% in 2015. However, polyester fibre production growth rate may drop to 4-5%
Source: Tecnon OrbiChem

ASIA PET RESIN MARGINS
-50
0
50
100
150
200
250
300
350
400
2004 2006 2008 2010 2012 2014
PET RESIN - RESTRUCTURING
USA
• DAK Americas (204 ktpa), Sep 2013
Europe
• Indorama (168 ktpa), UK, Dec 2013
Asia
• Japan Unipet (66 ktpa), Japan, Mar 2015
• Daehan Synthetic Fibre (60 ktpa), Korea, Dec 2013
China
• Nan Ya Plastic (150 ktpa) shut in 2012
• Zhuhai Yuhua (140 ktpa) produces alternative polymers
• Sinopec Shengzhiye (240 ktpa) shut in 2013
• Ningbo SK-Zhenbang (150 ktpa) shut in 2013
• Liaoyang Petrochemical (105 ktpa) shut in 2013
Source: Tecnon OrbiChem
APIC 2015
OVERCAPACITY & SLOW DEMAND DRAGPET RESIN BUSINESS DOWN
($/ton)

Company Capacity(ktpa)
China
PetroChina Liaoyang 870
Yangzi Petrochemical 730
Zhejiang Yisheng 650
Chongqing Pengwei 900
BP Zhuhai 600
Fujian Jialong 600
Xianglu Petrochemical 1,650
Yisheng Dahua 2,200
Zhejiang Yuandong 3,300
Total 11,500
Northeast Asia
SK Petrochemical 520
Lotte Chemical 400
CAPCO 1,320
Tuntex 440
Mizushima Aroma 250
Total 2,930
PTA PRODUCERS NOT OPERATING
0
10
20
30
40
50
60
70
80
90
0
100
200
300
2005 2007 2009 2011 2013 2015
Capacity PTA Margin
ASIA PTA CAPACITY &MARGIN 2005-2015($/ton)
APIC 2015
THE START OF PTA RE-BALANCING?
Source: Tecnon OrbiChem
(Million Metric Tons)

• Oversupply dominates Asian and world markets and is stressing global margins.
• China PTA industry rationalisation is expected to continue with PTA plants elsewhere in Asia under threat – as already seen in Taiwan and South Korea.
• With Zhejiang Yuandong announcing bankruptcy, it will be significant to see whether this is the start of real PTA industry rationalisation in China.
• However, the interdependence of PTA projects on each other and with local economies and banks risks the start of a ‘domino’ effect.
• Recent health and safety concerns related to paraxylene are a symptom of the problems that exist, but have the potential to become an issue in themselves
• The polyester market is still growing in China, but it is difficult to expect the speed of growth to be as fast as in the past.
• China’s economy has entered a ‘New Normal’. Economic growth has slowed and structural change is needed to overcome the legacy of past stimulus policies.
APIC 2015
CONCLUSIONS
Source: Tecnon OrbiChem

…..your source of expert chemical industry knowledge