Embed Size (px)
Citation preview

Project Management Institute - Central Indiana ChapterProject Management Conference
October 14, 2016
Dr. Mitchell Springer, PMP, SPHR
PM Education and Application –Life Challenges of the New Professional Working
Adult Millennial Learner, a Qualitative Perspective

2
PM is Both a Science and an Art Form
As a science – quantitative element– Expected to manage our project’s cost, schedule
and technical performance
As an art form – qualitative element– Expected to see the bigger picture– Expected to function as Business Development or
Marketing

3
Leading Indicators - Overview Who are the new PM students? Why are college costs so high? Increasing debt loads Moving back home
– Postponing marriage– Homes, cars, material possessions– Having children later in life
Making program/cost changes to remain competitive

4
Who Are the PM Students Veterans (Traditionalist) 1922-1945; 52 million people - those
born prior to WW II
Baby Boomers 1946-1964; 78.3 million people - those born during or after WW II and raised during a period of extreme optimism, opportunity and progress.
– Began turning 65 on January 1, 2011;• At a rate of 10,000/day; ~4M/yr for next 18 years
Generation Xers 1965-1980; 44 million people - came of age in the shadow of the boomers; children of Veterans or older Boomers or younger siblings
Generation Y (Millennials) 1981-2000; 69.7 million people -children of younger boomers; most loved
42%Reduction
Although US Census Bureau provides the basic information on live births and birth rates, aside from the Veteran and Boomer cohorts, it is not wholly agreed which years should be counted in post-Boomer groups
These are our students
5
Student Debt - 511% Since 2009

6
Increasing Debt Loads $37,172 average student debt (2016; up 6% from 2015) Student Debt almost tripled between 2004 and 2012 and stands over $1.3 trillion as of 2016
– 71% of 2012 students borrowed money– 70% Increase in the number of borrowers – 70% increase average balance per person– 43.3 million of 325 million Americans have student loan debt (2016)– Student loan delinquency rate of 11.6% (2016)– Average monthly student loan payment (for borrower aged 20 to 30 years): $351 (2016)
Reasons for the growth in borrowers and per-person debt: More people attend college and graduate school
– Parents take out student loans for their children – Students stay longer in college and more often attend graduate school – Lower repayment rates as borrowers delay payments through deferments and forbearances – Discharging student debt is very difficult and the balance stays with the borrower
Household Debt and Credit: Student Debt. Donghoon Lee

7
Student Debt to Other
Household Debt

8
Why Are College Costs So High?
No shortage of accusations (dating back 25 years)– Too many buildings– State funding has been reduced; causing increases in student tuition– Too many administrators– Spending too much on sports/football fields/arenas– Food is of too high of quality and costs too much to provide– Tenure practices (45+ years of lifetime employment)– Lack of accountability (most identified)
• Not a business – “but, doesn’t mean it can’t be run like a business…”
9
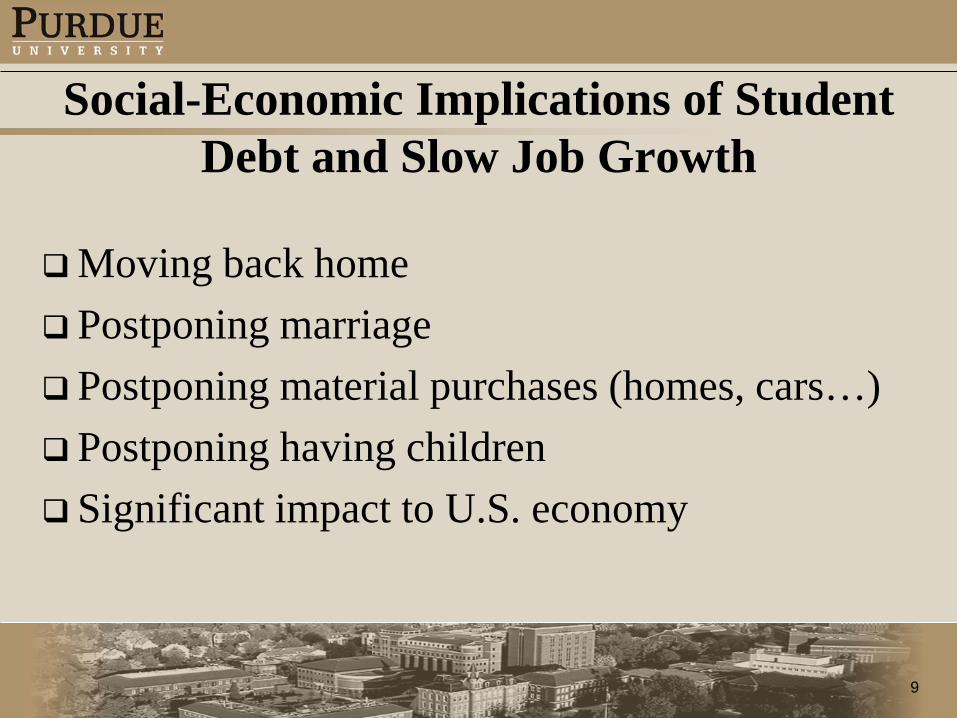
Social-Economic Implications of Student Debt and Slow Job Growth
Moving back home Postponing marriage Postponing material purchases (homes, cars…) Postponing having children Significant impact to U.S. economy

10
Moving Back Home
Difficult job market Slowly recovering economy 34% reported moving back home after
graduation in 2011 60% reported moving back home after
graduation in 2013 56% reported moving back home after
graduation in 2014
11
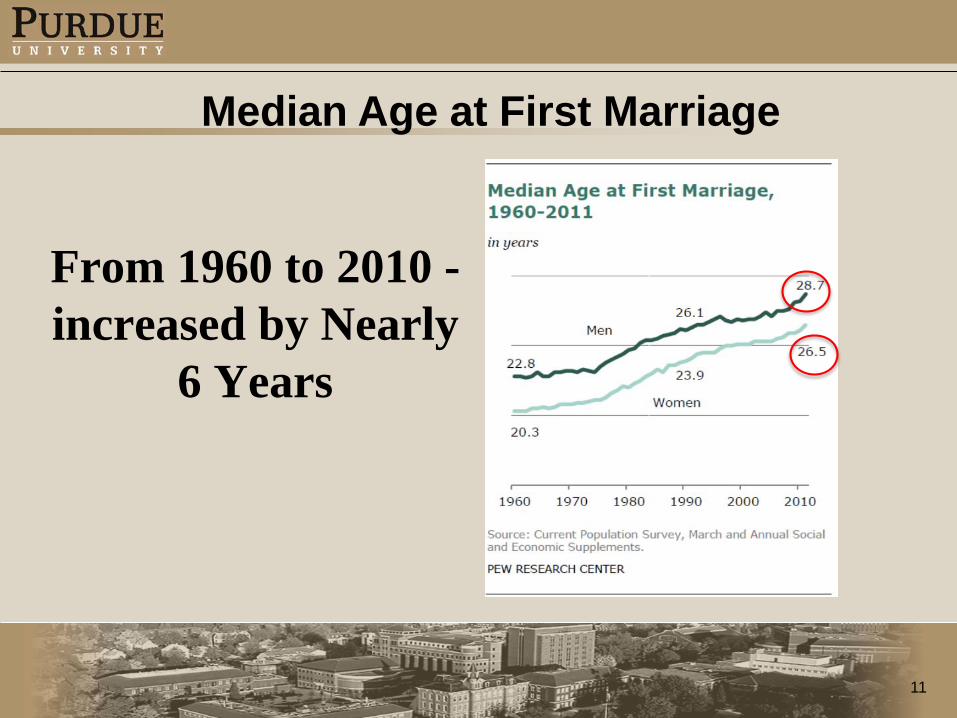
From 1960 to 2010 -increased by Nearly
6 Years
Median Age at First Marriage
12
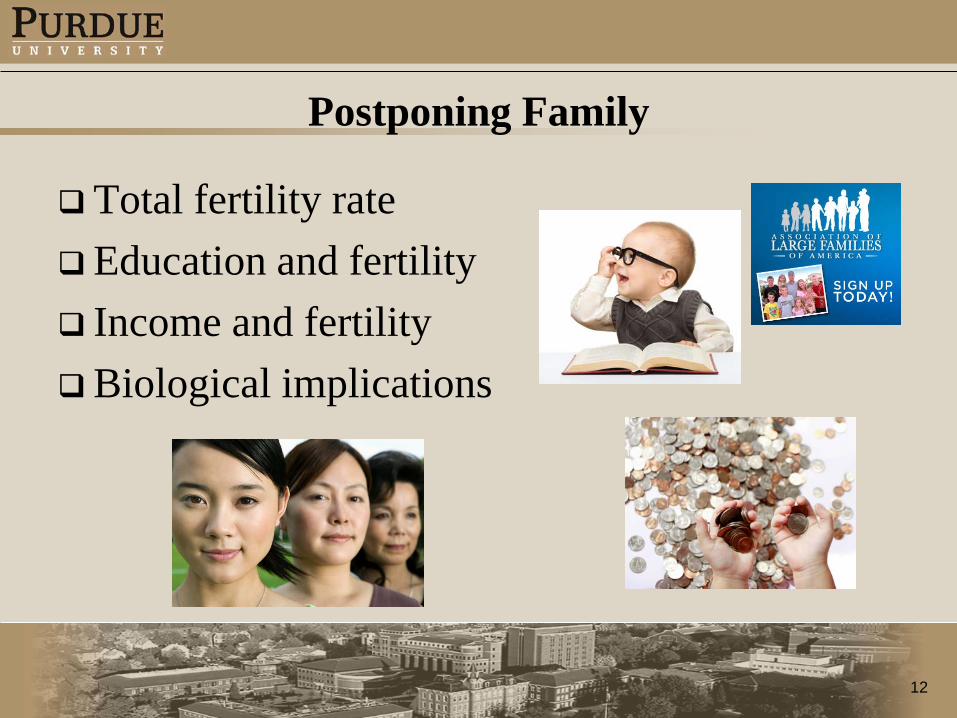
Postponing Family
Total fertility rateEducation and fertility Income and fertilityBiological implications

13
Total Fertility Rate
The number of babies the average woman would bear over the course of her life if she were to survive until the end of her reproductive years and age-specific birth rate were to remain constant
In order for a country to maintain a steady population, it needs a fertility rate of 2.1
The U.S. fertility rate currently sits at 1.93 Which means that the Japanese and Italians (with
fertility rates of about 1.4) are on the verge of downsizing their countries.
1979 world’s fertility rate was 6.0, today it’s 2.52Last, J. (2013). What to Expect When No One’s Expecting. New York, NY: Encounter Books
14
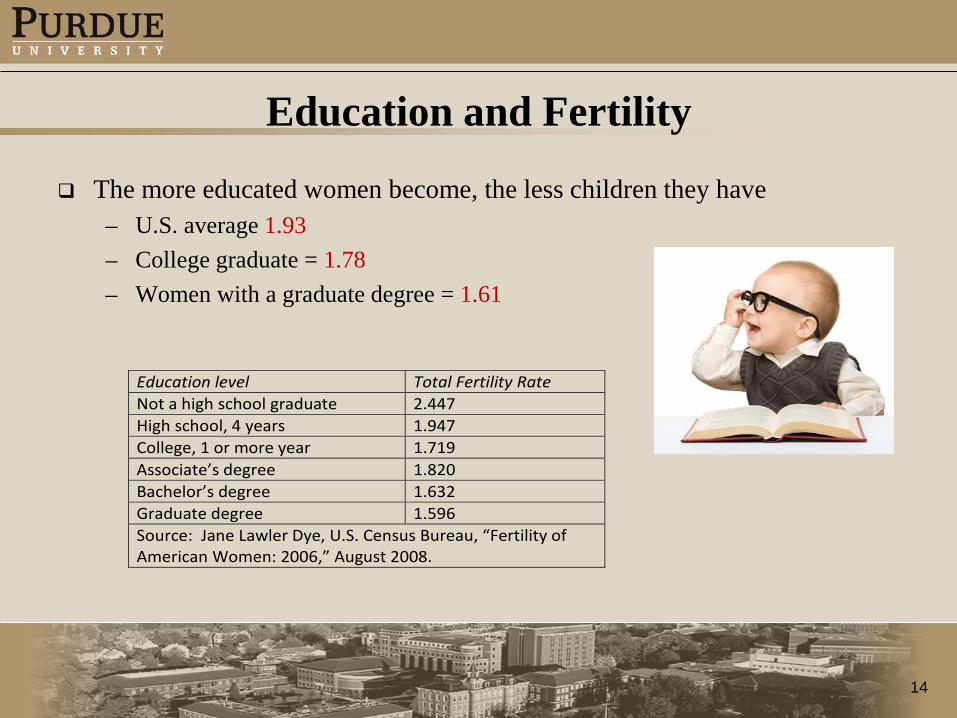
Education and Fertility
The more educated women become, the less children they have– U.S. average 1.93– College graduate = 1.78– Women with a graduate degree = 1.61
Education level Total Fertility Rate Not a high school graduate 2.447 High school, 4 years 1.947 College, 1 or more year 1.719 Associate’s degree 1.820 Bachelor’s degree 1.632 Graduate degree 1.596 Source: Jane Lawler Dye, U.S. Census Bureau, “Fertility of American Women: 2006,” August 2008.

15
Education and Delayed Family Formation
The drop in fertility among women with college and advanced degrees, then, is in large part a function of delayed family formation
Not just the length of education that diminishes fertility, or the careers the education makes possible, but the debt load the education incurs. Since 1987, when the Nellie Mae Corporation began keeping statistical track of student loans, the average student-loan burden on college graduates has almost quadrupled, from $7,500 to $29,900

16
Income and Fertility
As income rises fertility rate declines

17
It’s Also Biological Between the ages of 24 and 34, a woman’s chance of
becoming infertile increases from 3 percent to 8 percent. By 35, half of women trying to get pregnant over the course of 8 months will not succeed. After 35 it gets even more difficult. By age 39, a woman has a 15 percent chance of being unable to conceive at all. And by a woman’s 43birthday, her chances of getting pregnant are nearly zero.
All of which is why today, 1 out of every 100 babies born in the United States is created via In Vitro Fertilization

18
Median Age of First Time
Parents
Crossover

19
Climbing Over 30
Average Age of First Time Mothers

20
Postponing Material Purchases --Life Phases
U.S. Bureau of Labor StatisticsConsumer Expenditure Survey
Dent, H. The Demographic Cliff. New York, NY.: Penguin Group.(2014)
21
Median U.S. Age and It’s Implications
1950 – median age was 30 2000 – median age was 35 2050 – median age will be 40; which is the median age in
Florida today Labor shortages appear to be a reality Older people consume at lower rates
– Tax base declines as demands on government increase
“Significant innovations and big discoveries tend to be made between the ages of 30 and 50, with the peak of creativity coming somewhere between 35 and 40 years of age.” p. 101

22
Ratio of Workers to Retirees
“The Social Security Administration predicts that by 2034, the ratio of workers-to-retirees will fall to just 2.1 workers for every retiree as a result of (1) roughly 809 million Baby Boomers retiring and (2) the declining fertility rates having failed to
produce a proportionate number of new workers.” p. 108

23
Challenges (Making the Connections)
Slowly recovering economy Difficult job market High student debt Moving back home Delaying marriage, family and material possessions Impact on our employee population (movement to bigger
cities) Paying for additional schooling ???
– What do we have to do differently?