Embed Size (px)
Citation preview

Planning 2017: Decisions and Tools for Growth
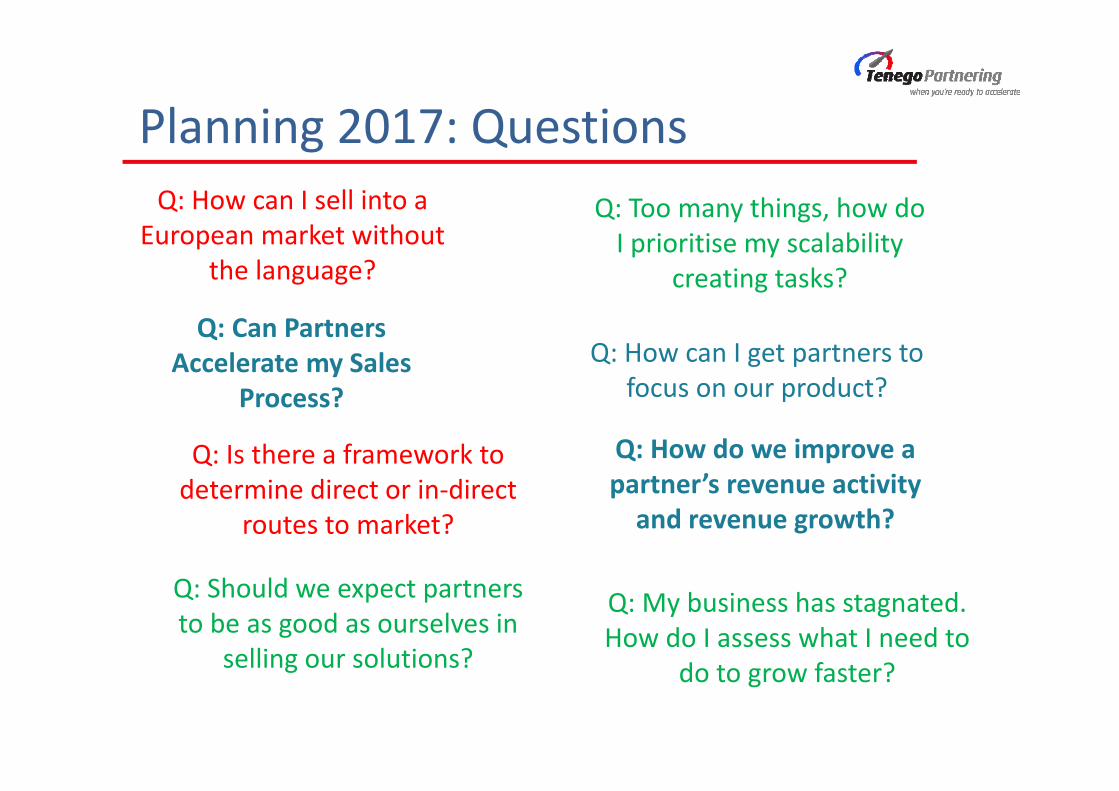
Planning 2017: Questions
Q: Can Partners Accelerate my Sales
Process?
Q: Is there a framework to determine direct or in‐direct
routes to market?
Q: How do we improve a partner’s revenue activity and revenue growth?
Q: Should we expect partners to be as good as ourselves in
selling our solutions?
Q: How can I get partners to focus on our product?
Q: How can I sell into a European market without
the language?
Q: My business has stagnated. How do I assess what I need to
do to grow faster?
Q: Too many things, how do I prioritise my scalability
creating tasks?

Welcome
If you have any questions, please interrupt…
Type into the Chat/Question screen
Donagh Kiernan, Founder and CEOTenego Partneringwww.tenegopartnering.comhttp://ie.linkedin.com/in/donaghkiernan
Donagh KiernanFounder and CEOTenego Partnering
27 years – Techie background Sales Channel, Direct Sales and ChannelSales Organisation Management.

Welcome
Our Panellists today:
Sandy MackenzieTenego UK South
Sandy has 25+ years of experience in international sales and general management for both established and early‐stage software companies.
Neil HoeyCEO, Tenego Ireland
18+ years of experience in sales operations and management, business alliances, channel recruitment and execution, sales strategy and SaaS
Juliano AllegriniHead of Marketing
20+ years experience in Marketing, CRM, Research and Business Developmentin Europe, USA and Latin America with companies such as EDS, Orange, PSA, LG Electronics.
Dimitris GeorgopoulosTenego Athens
20+ years C‐Level management in Banking and Solution Providers in various industriesStrong track record of performancein major Greek and multinational organisations. Co‐founder of “Rethink Business Lab”

Tenego: Services

Tenego Clients

Tenego’s Methodologies

Tenego’s Global Network• To date, executed projects across UK & Ireland, Across Europe, North America, Mexico & Latin America, Middle East, North Africa, India, China, South Asia…
• Growing Global Network of Tenego Offices with on the ground presence and in discussion in– Ireland (HQ), UK, Germany, Greece, Middle East– APAC, Canada, US East Coast, US West Coast …

Planning 2017: Decisions and Tools for Growth

What is your bottleneck of growth?

Lead Generation Qualification Sales /
ClosingDelivery Support
Direct Sales
Resellers…
Referrals
Strategic Partners / White Label / System Integrators …
Complementary Services
Your Business Engine
How Compelling is Your
Customer Value Proposition?
How Compelling is Your
Partner Value Proposition?

Sales Process ‐ Stage by Stage: Direct or Partners1) How can you achieve faster results, earlier revenue2) How can you reduce the costs at each stage3) What affects the overall Return on your Sales Investment?4) What does a Partner cost?5) What affects the risk of your Sales investments?
Your Sales Process: Direct & PartnersSales Process:
€51,332 €53,632Cost up each stage: €26,822 €30,904 €42,332 €48,332
€2,300
Costs of your Sales Activities (€):
Success Rate % (from prev stage):
Activity to win 1 deal:
Average cost at each stage (€):
€2,300
50%
5 2 1
14% 35% 35% 40%
€26,822 €4,082 €11,429 €6,000 €3,000
€92 €100 €800 €1,200 €1,500
292 41 14
EvaluationPropose / Close
Lead Generation
Qualified Leads
Presentation Demo

Be Clear on Your Customer
Bullseye Target
Customer
Who is the Key Buyer?
Target Customer: Sector, Size etc

Customer Type Evaluation
What is important to the Customer Type?
You bring the
Greatest Value
has the greatest
need
most immediate
need
will make decisions
faster
will see the benefit
sooner
will pay the most
Ranking
weighting (0 to 6) 4 3 4 3 2 1
Customer Type 1 3 3 3 33
Customer Type 2 6 0 6 6 66
Customer Type 3 6 6 6 6 6 6 102
Customer Type 4 6 6 6 66
Customer Type 5 5 5 4 4 52
Customer Type 6 3 3 3 33
Customer Type 7 3 3 3 3 3 42
Customer Type 8 0 0
Customer Type EvaluationWhat customer type:• do you bring the greatest value?• has the greatest need?• most immediate need?• will make decisions faster?• will see the benefit sooner?• will pay the most?


Market Selection2017 Market Selection and GTM Surveyhttp://www.tenegopartnering.com/survey/2017‐go‐to‐market

Partial Results – Europe
60%20%10%
• 60% of companies in Europe planned expansion within EMEA• 20% of companies in Europe planned expansion to Asia• 10% of companies in Europe planned expansion to North America

Partial Results – North America
40%40%20%
• 40% of companies in N. America planned expansion within N. America• 40% of companies in N. America planned expansion to Europe• 20% of companies in N. America planned expansion to Asia

Reasons on Selecting the Regions
Accessibility (Language, Maturity, Location,
Market Research, Market Size etc.)46%
Network of contacts (Prospects, Clients etc.)
29%
Perceived higher need/opportunities in the
market 25%

How to Expand?
Work with Partners in the target market
45%Validate
Opportunity in target market
first 15%
Hire in‐country sales people
15%
Hire local people with
focus on target market 15%
Other 10%

Demographic Indicators
Europe80%
North America10%
Asia5%
Middle East 5%
HQ Location
10 or less24%
11 to 5038%
51 to 20014%
201 to 500 5%
Over 50019%
Number of Employees

Conclusions ‐ Partial
• Main Focus is expansion within geographical regions, EMEA being the most predominant
• The historical growth links between Europe and North America remain present
• Accessibility playing a major part in the decision to select a target
• Partnering remains the principal choice when expanding.

Market Selection & PrioritisationLevellers 10,000,000 10,000,000 10,000 100 Weightings 10 10 20 ‐ 30 70
Minimum Conditions 8,000 14 3 1 http://www.ghttps://www.goog 1000
Markets (Europe) Region Population 2014Urban
Population 2014
GDP( million
US$) 2014
GDP per capita 2014
Credit Card Penetration % (fortuma)
2014
Total value of Retail Sales (YoY
in percent)
Consumer Spending Index
Competitor Count
Country Rank
Switzerland Western Europe 8,157,896 6,030,730 685,434 84,733 58.75 0.20 10.16 3 Switzerland 5.85 Norway Western Europe 5,091,924 4,083,119 500,103 97,363 112.00 0.00 6.61 1 Norway 4.62 United Kingdom Western Europe 63,489,234 50,802,810 2,941,886 45,603 23.55 6.50 6.49 11 United Kingdom 4.41 Germany Western Europe 82,652,256 61,437,197 3,852,556 47,627 119.75 3.40 4.62 4 Germany 4.18 France Western Europe 64,641,279 56,419,209 2,829,192 42,733 91.19 3.60 4.45 6 France 3.70 Austria CEE 8,526,429 5,824,085 436,344 51,127 34.00 1.60 5.87 2 Austria 3.46 Sweden Western Europe 9,631,261 8,249,625 570,591 58,887 97.72 3.70 5.14 2 Sweden 3.46 Denmark Western Europe 5,640,184 4,926,011 341,952 60,634 26.79 2.00 5.11 1 Denmark 3.21 Italy Western Europe 61,070,224 42,101,235 2,144,338 34,960 49.83 1.30 3.78 5 Italy 3.13 Finland Western Europe 5,443,497 4,576,718 270,674 49,541 79.63 ‐1.70 4.76 2 Finland 3.05 Ireland Western Europe 4,677,340 2,952,477 245,921 53,314 46.67 8.60 4.80 1 Ireland 3.02 Belgium Western Europe 11,144,420 10,874,010 533,383 47,517 39.09 0.40 4.69 2 Belgium 2.96 Netherlands Western Europe 16,802,463 14,161,696 869,508 51,590 35.71 4.30 4.17 5 Netherlands 2.86 Spain Western Europe 47,066,402 36,646,776 1,404,307 30,262 88.44 4.30 3.36 5 Spain 2.80 Russia CEE 142,467,651 105,911,587 1,860,598 12,736 17.20 ‐10.40 0.54 4 Russia 2.50 Montenegro Balkans 621,542 396,949 4,583 7,371 3.81 3.00 4.51 0 Montenegro 2.06 Portugal Western Europe 10,610,304 6,646,197 229,584 22,081 96.19 1.40 2.59 1 Portugal 1.85 Greece (home markBalkans 11,128,404 6,921,007 237,592 21,683 28.70 3.80 3.01 2 eece (home marke 1.84 Cyprus Balkans 1,153,058 819,828 23,226 27,194 62.50 4.00 2.21 2 Cyprus 1.53 Poland CEE 38,220,543 23,216,731 548,003 14,423 17.14 0.10 1.62 1 Poland 1.49 Turkey Balkans 75,837,020 56,235,478 799,535 10,530 67.99 ‐0.20 0.09 2 Turkey 1.47 Slovenia Balkans 2,075,592 1,034,487 49,416 23,963 11.11 ‐0.40 2.30 0 Slovenia 1.39 Czech Republic CEE 10,740,468 7,881,096 205,523 19,554 20.95 6.30 1.71 1 Czech Republic 1.23 Estonia FRS 1,283,771 894,636 25,905 19,720 29.17 9.00 1.83 0 Estonia 1.17 Slovakia CEE 5,454,154 2,979,250 98,000 18,047 11.11 3.00 1.80 0 Slovakia 1.14 Lithuania FRS 3,008,287 2,029,313 48,172 16,445 13.79 5.90 1.86 0 Lithuania 1.11 Latvia FRS 2,041,111 1,381,995 31,921 16,038 15.00 4.30 1.71 0 Latvia 1.03 Ukraine FRS 44,941,303 31,225,151 131,805 3,083 66.08 ‐16.30 0.13 1 Ukraine 0.93 Croatia Balkans 4,272,044 2,506,962 57,223 13,507 3.81 1.30 1.42 0 Croatia 0.87 Hungary CEE 9,933,173 7,036,844 137,104 13,903 13.13 5.10 1.15 2 Hungary 0.87 Bulgaria Balkans 7,167,998 5,357,789 55,735 7,713 13.89 ‐2.50 1.02 0 Bulgaria 0.69 Romania Balkans 21,640,168 11,449,200 199,044 9,997 11.00 10.90 0.32 1 Romania 0.62 Azerbaijan FRS 9,514,887 5,173,624 75,198 7,884 3.26 10.00 0.71 0 Azerbaijan 0.56 Serbia Balkans 9,468,378 5,436,059 43,866 6,153 8.45 2.30 0.63 0 Serbia 0.52 FYRO Macedonia Balkans 2,108,434 1,258,627 11,324 5,456 15.00 ‐1.00 0.78 0 FYRO Macedonia 0.48 Albania Balkans 3,185,413 1,800,743 13,370 4,619 17.86 3.83 0.66 1 Albania 0.44 Armenia FRS 2,983,990 1,917,546 10,882 3,620 13.89 0.10 0.57 0 Armenia 0.38
• Where is the greatest opportunity?
• What markets can you deliver into?
• What markets can you gain easiest access to?
• Using Market indicators to evaluate and prioritise

Company T
http://www.tenegopartnering.com/predictor/

The 5 Key FactorsThe Key Factors Affecting Your Pace of Growth through Sales Channels:1) Deal Size & Shape2) Sales Cycle Length3) Market Size/Conditions/Growth4) Number of Potential Partners5) Partner Deal Pace…

Accelerating Growth in 2017 • Bullseye Target Types – not everyone• Prepare for Scale ‐ Address the Bottlenecks in your Business Process
• Understand Your Market, from your customers’ point of view
• Determine your best route to market• Invest to suit the pace your business can grow• Seek/Demand Clarity in your planning, as far as practical.

Thank You, Questions?If you have any questions, please type into the
Chat/Question screen
Donagh KiernanFounder and CEOTenego Partnering
27 years – Techie backgroundSales Channel, Direct Sales and Sales Organisation Management.
Sandy MackenzieTenego UK South
Sandy has 25+ years of experience in international sales and general management for both established and early‐stage software companies.
Neil HoeyCEO, Tenego Ireland
18+ years of experience in sales operations and management, business alliances, channel recruitment and execution, sales strategy and SaaS
Juliano AllegriniHead of Marketing
20+ years experience in Marketing, CRM, Research and Business Developmentin Europe, USA and Latin America with companies such as EDS, Orange, PSA, LG Electronics.
Dimitris GeorgopoulosTenego Athens
20+ years C‐Level management in Banking and Solution Providers in various industriesStrong track record of performancein major Greek and multinational organisations. Co‐founder of “Rethink Business Lab”

www.tenegopartnering.com/resource
http://www.tenegopartnering.com/blog
Further content available online

Additional Webinars• Other webinars available in our Resource Page:
• Sales Partner Management for better Partner Engagement
• How to ensure Partner Fit. It's not as simple as it may seem.
• Meet Your Revenue Targets with Focused Sales Execution
• Finding Big Markets for Big Data & Data Analytics Solutions
• Business in Europe: Understanding the bigger opportunities
• Growing your Business in the UK
• Germany: Opportunities for Tech Companies
• Market Opportunities in Australia for Tech Companies
• How To Prevent The Mistakes in Sales Channel Development
• Learn How To Calculate Sales Commissions & Partner Negotiations
• And many more…
www.tenegopartnering.com/resource

Related Articles• Available in our Blog:
• 5 Points on Breaking Preconceived Notions with Just Enough Analysis
• Your Sales Focus? Quarter‐end Targets AND/OR Game Change Next Year?
• Compliance & Risks Named as One of the CIOReview's 20 Most Promising Compliance Solution Providers 2016
• One Engine, many speeds: Managing Direct Sales and Partners
• 5 Partner Management Styles ‐Which one are you?
• Diagnose your Current Sales Channels ‐ Partner Fit Evaluation
• Partner Fit ‐ Not as easy as it initially seems. Do your homework!
• New Suits, New Market Entry and Sales Channel Partners ‐ Seek Good Fit
• The Importance of Partner Fit
• And many more…
www.tenegopartnering.com/blog

Build & Manage Sales
Direct and Channels
Executive Hands‐on
Your Alliances Team
Software Business Experts
Practical
Results Focussed
CONTACT DETAILS:Tenego PartneringIreland (HQ), UK, Germany, Greece, Australia, Toronto, Dubai…
Web: www.tenegopartnering.comEmail: [email protected]
![[Webinar] Utilizing device specific intelligence to make smart merchandising decisions this holiday season](https://img.pdfslide.net/doc/110x75/588608111a28ab0a3f8b6d53/webinar-utilizing-device-specific-intelligence-to-make-smart-merchandising.jpg)