Embed Size (px)
Citation preview

Mid-America Restaurant ExpoGreater Columbus Convention Center
400 N. High Street, Columbus, OH 4321501/30/2017 | 9:30 a.m. | C-172
k l h f d & C O O d ® l S k & h
Request this speaker today! | 614.558.2239 | [email protected]
Presenter: Mark Kelnhofer, MBA, President & CEO, Return On Ingredients®, International Speaker & Author© 2017 Restaurant Institute LLC | Prerequisite: Course# RI-1001: The Art of Recipe Writing
P.O. Box 2387, Westerville, Ohio 43086 -2387 | 614.558.2239www.RestaurantInstitute.com | @RestaurantInst | [email protected]
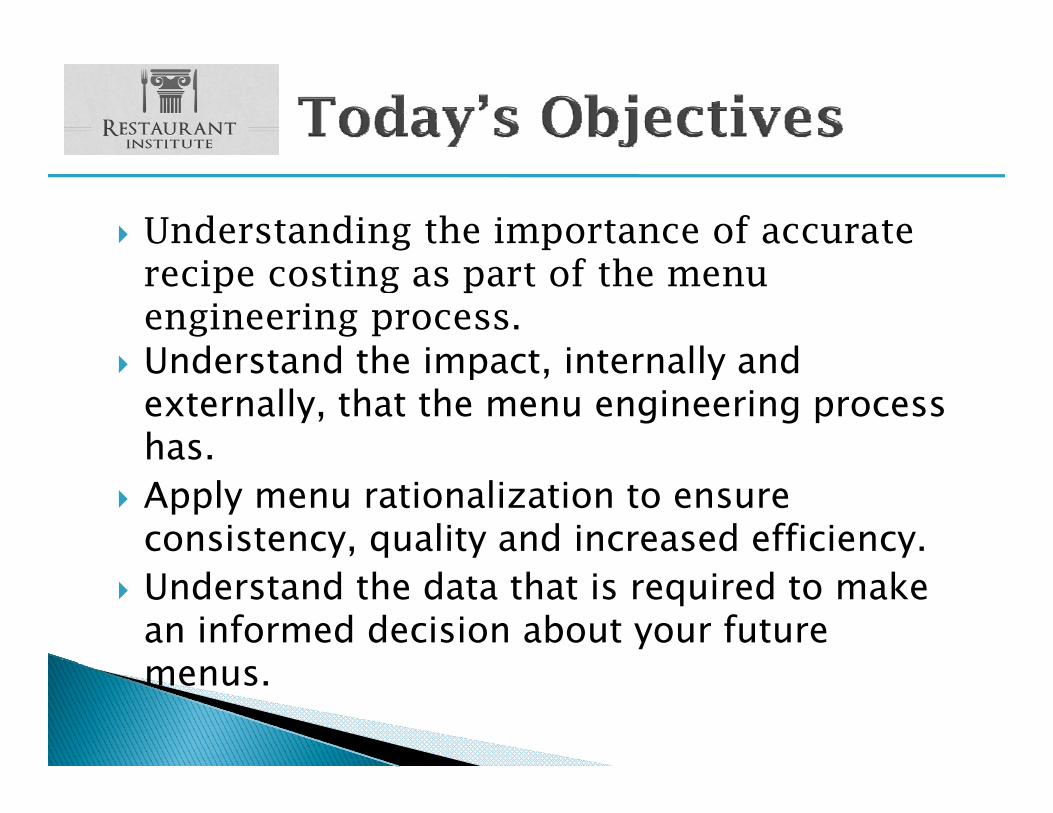
Understanding the importance of accurate recipe costing as part of the menu engineering process.
Understand the impact internally and Understand the impact, internally and externally, that the menu engineering process has.has.
Apply menu rationalization to ensure consistency, quality and increased efficiency.
Understand the data that is required to make an informed decision about your future menus.
s
+
Cu
linam
ber
sary
Arh
e N
um
rtsTh
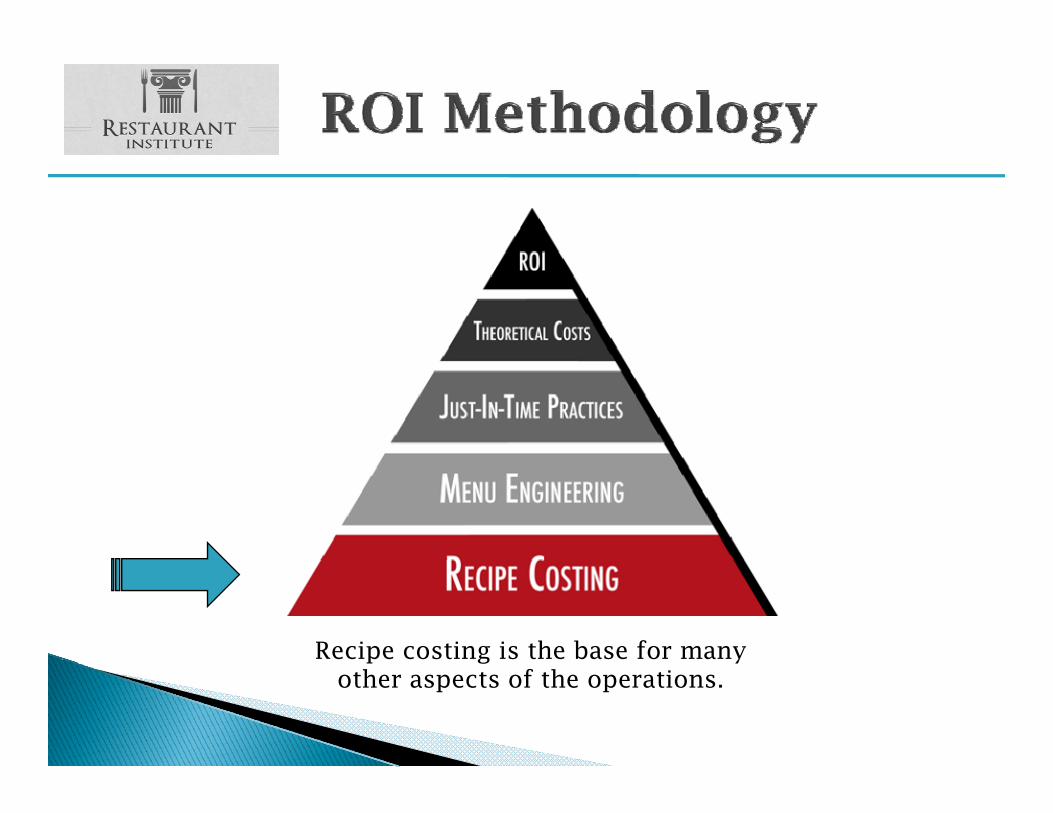
Recipe costing is the base for manyp g yother aspects of the operations.
Recipe Documentation
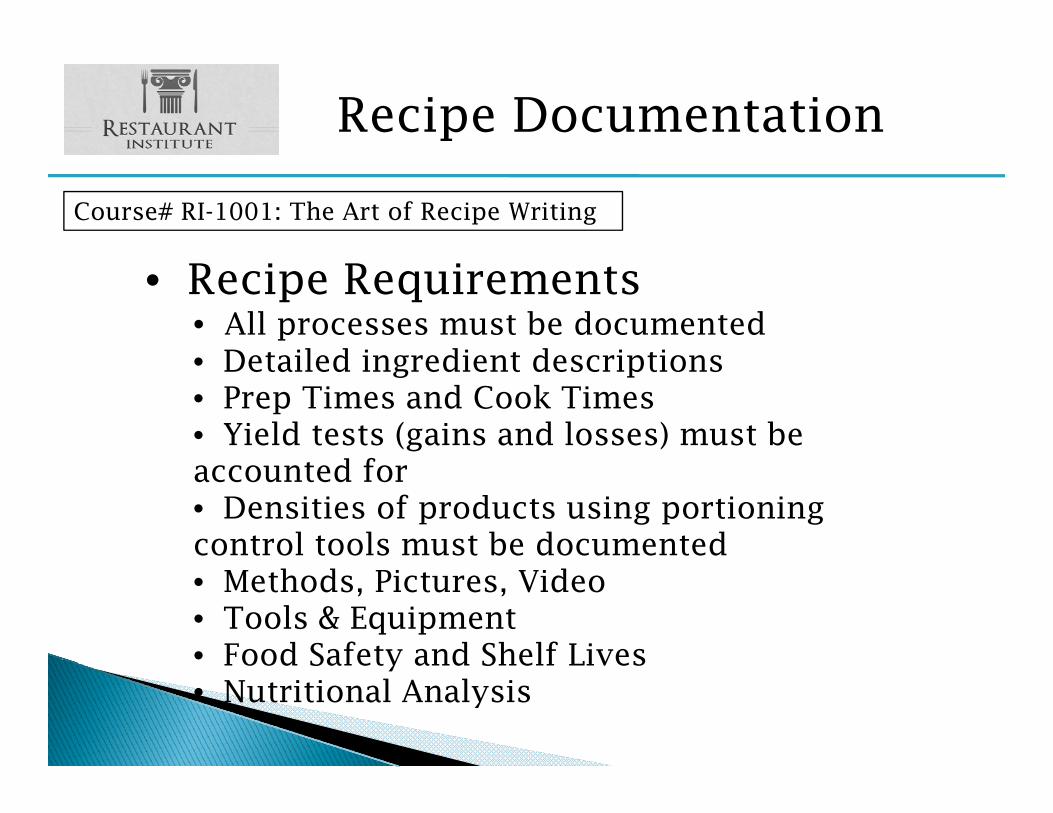
Course# RI-1001: The Art of Recipe Writing
• Recipe Requirements• All processes must be documented
Detailed ingredient descriptions• Detailed ingredient descriptions• Prep Times and Cook Times• Yield tests (gains and losses) must be
faccounted for • Densities of products using portioning control tools must be documented• Methods, Pictures, Video• Tools & Equipment• Food Safety and Shelf LivesFood Safety and Shelf Lives• Nutritional Analysis
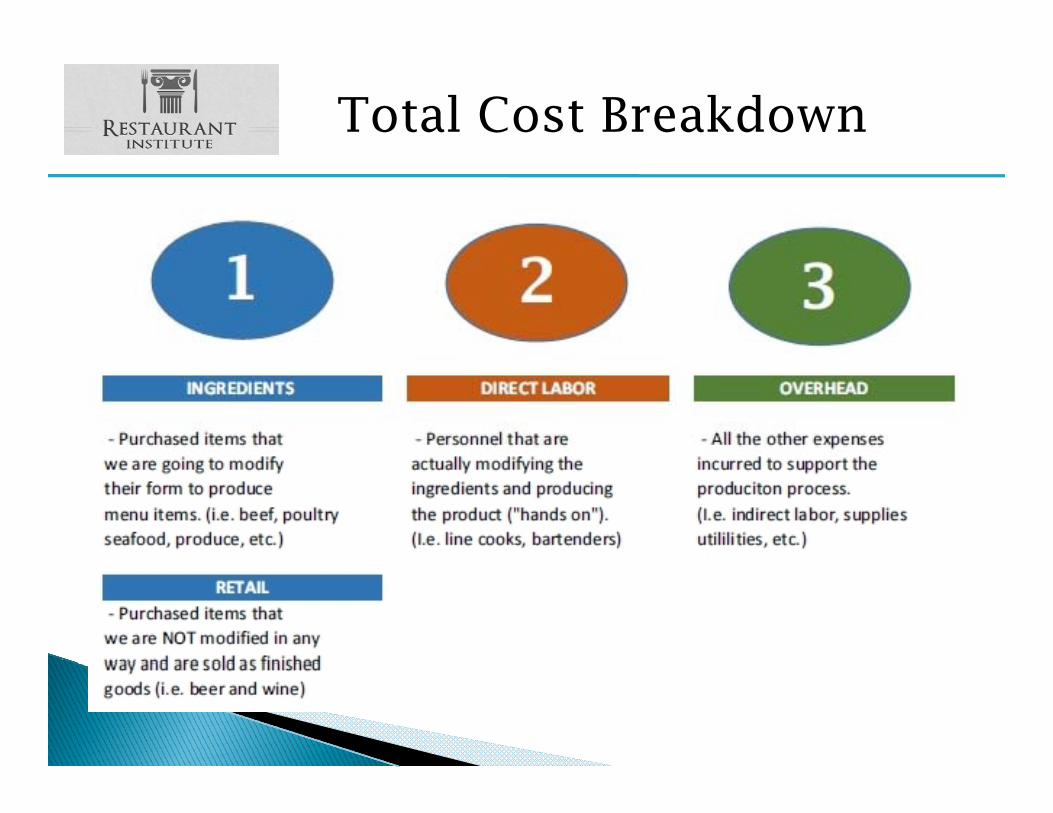
Total Cost Breakdown
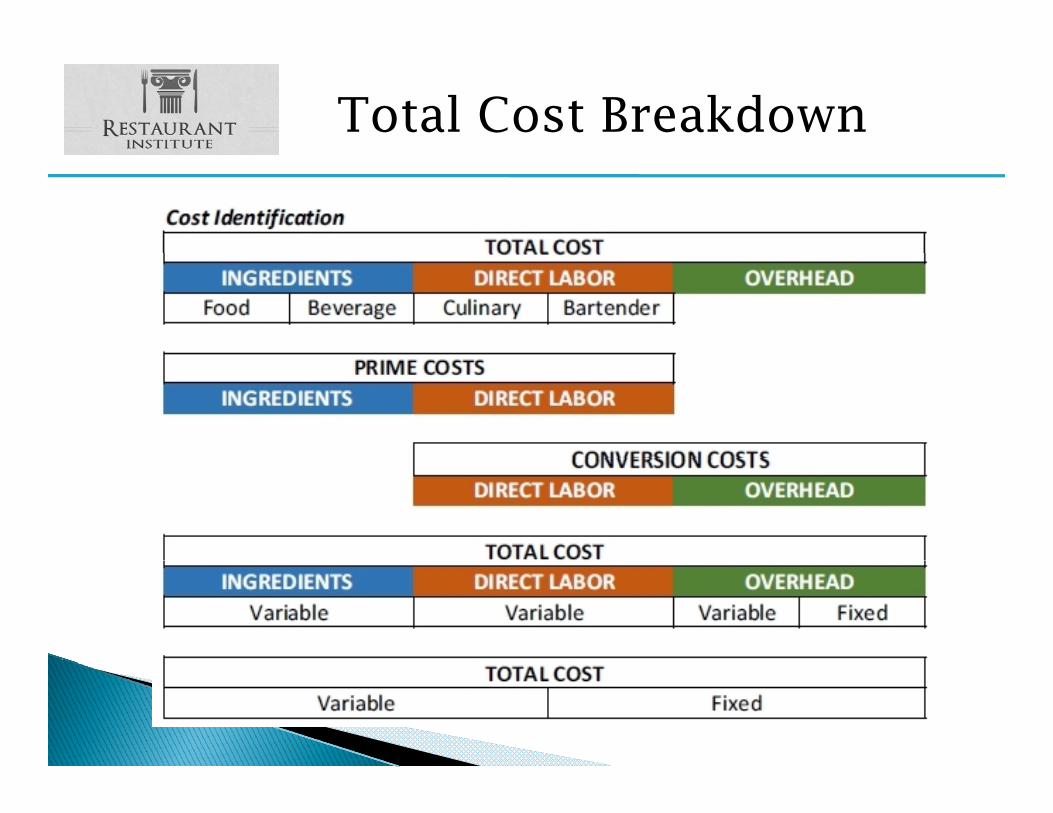
Total Cost Breakdown
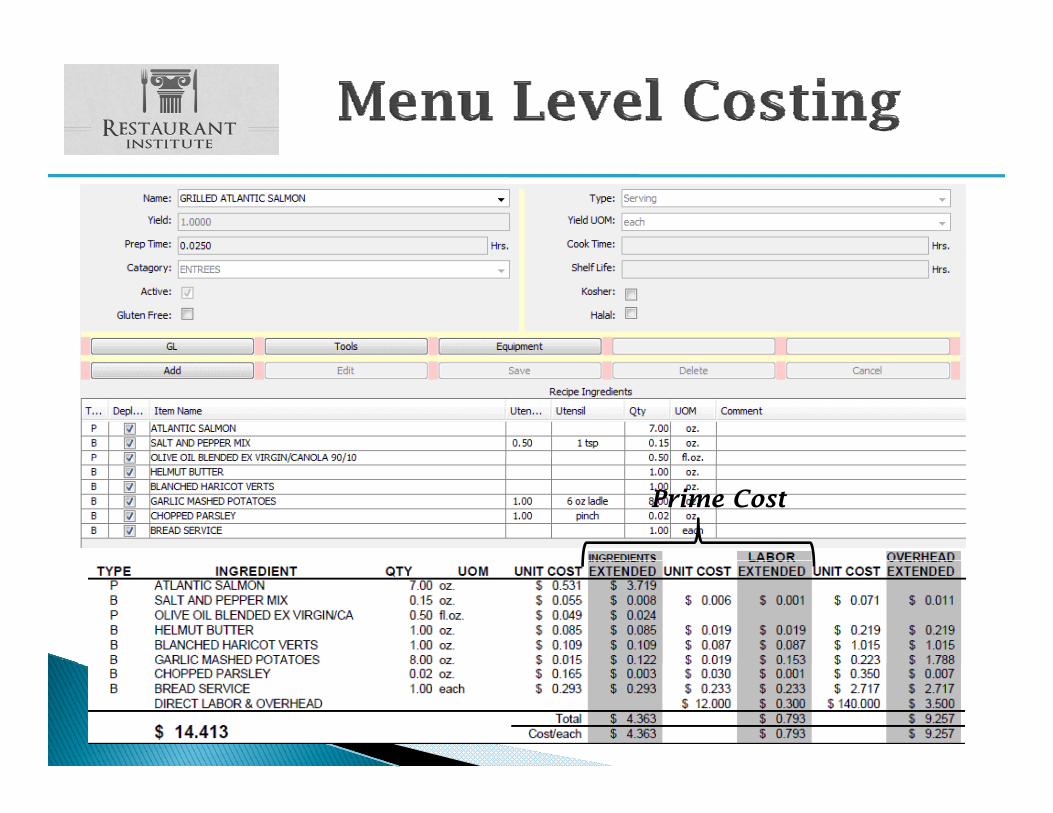
Prime Cost
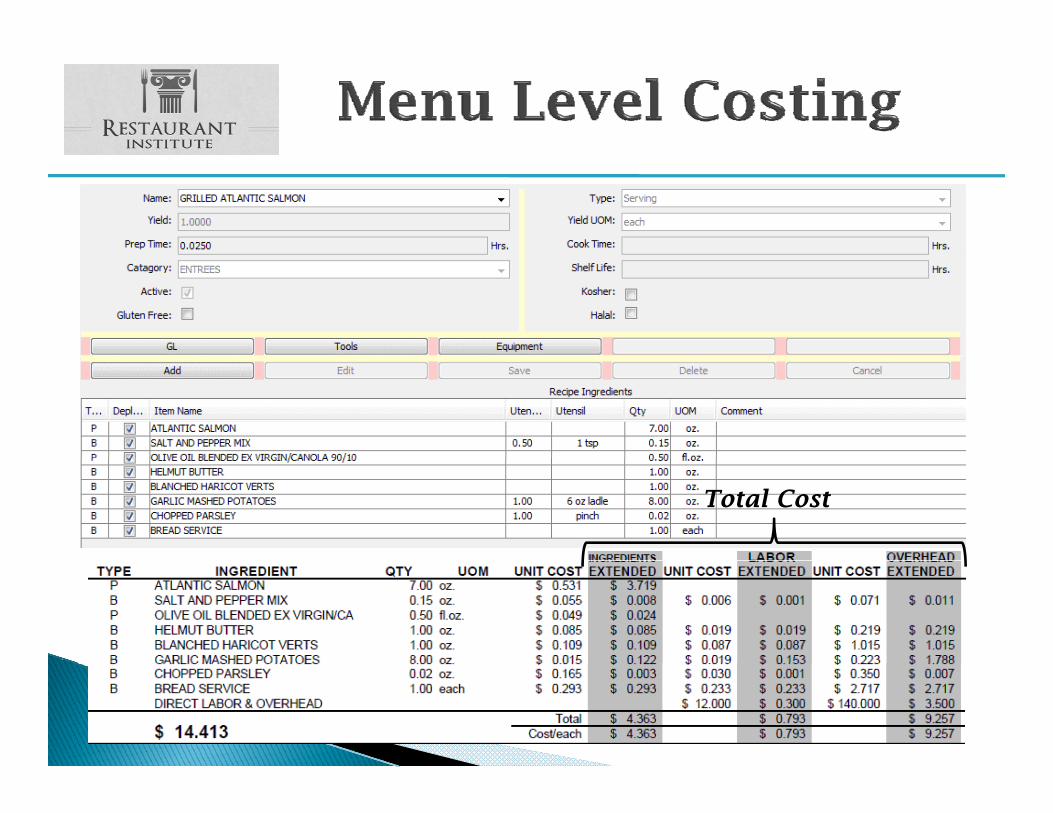
Total Cost
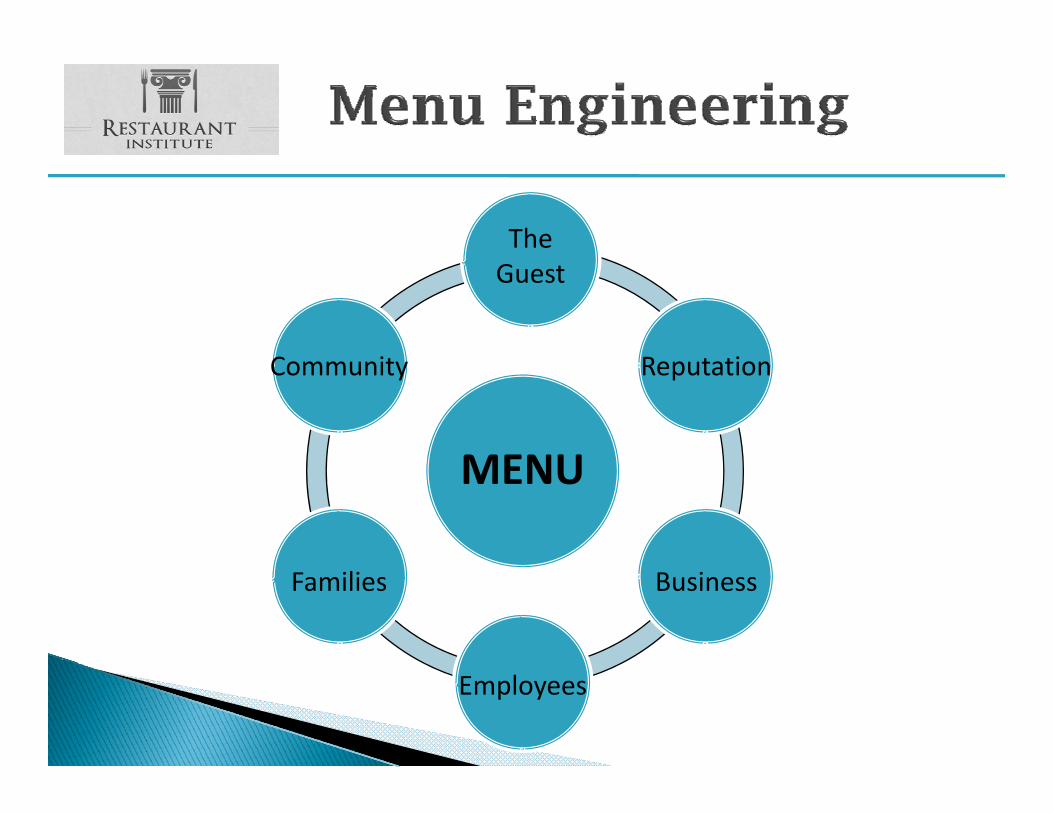
The Guest
MENU
ReputationCommunity
MENU
BusinessFamilies
Employees
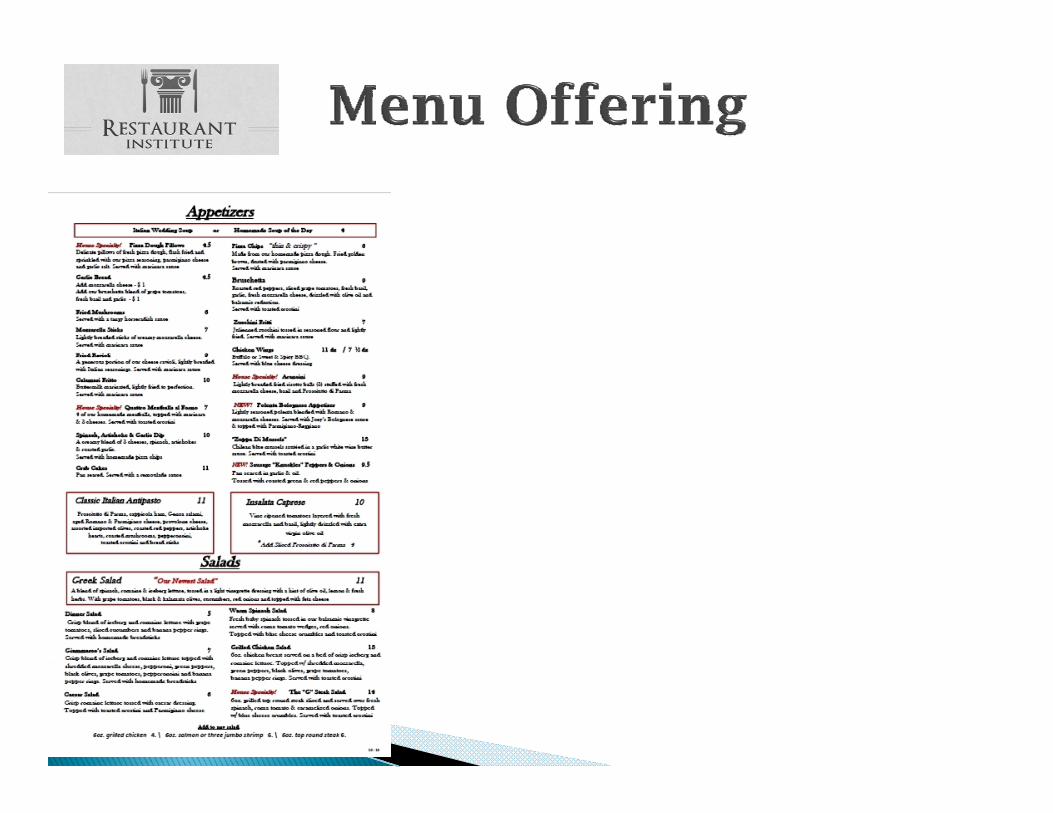
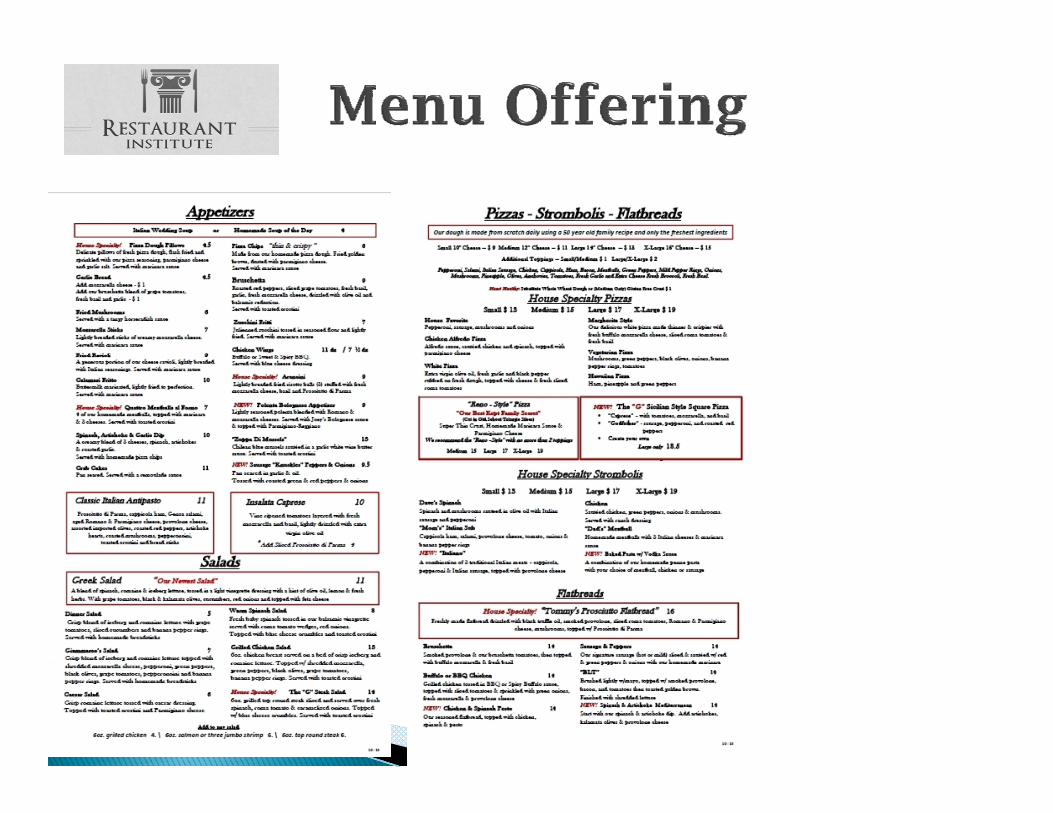
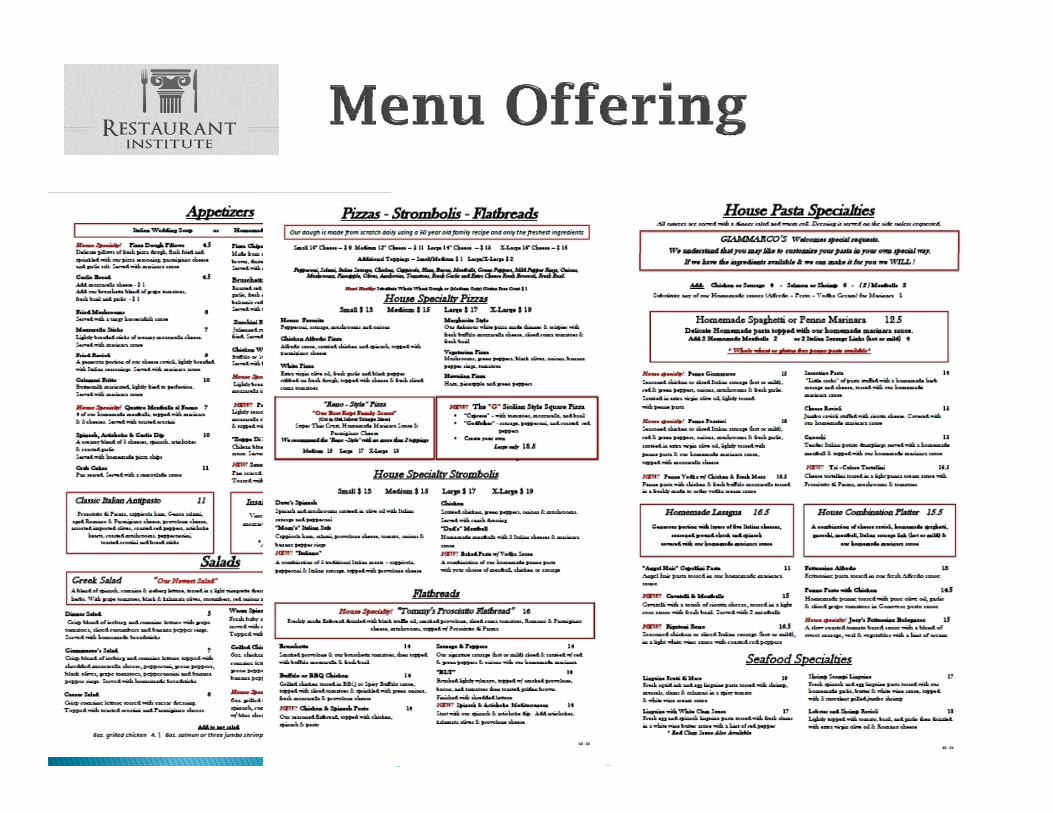

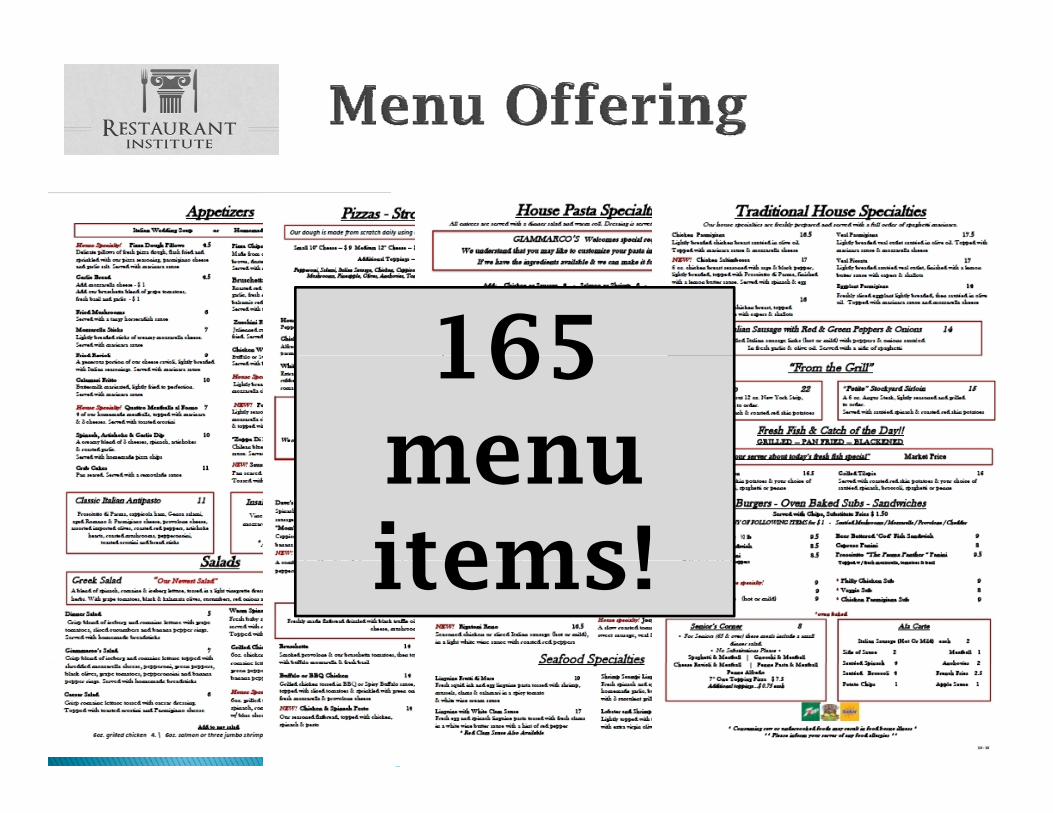
165 165 menu menu items!items!
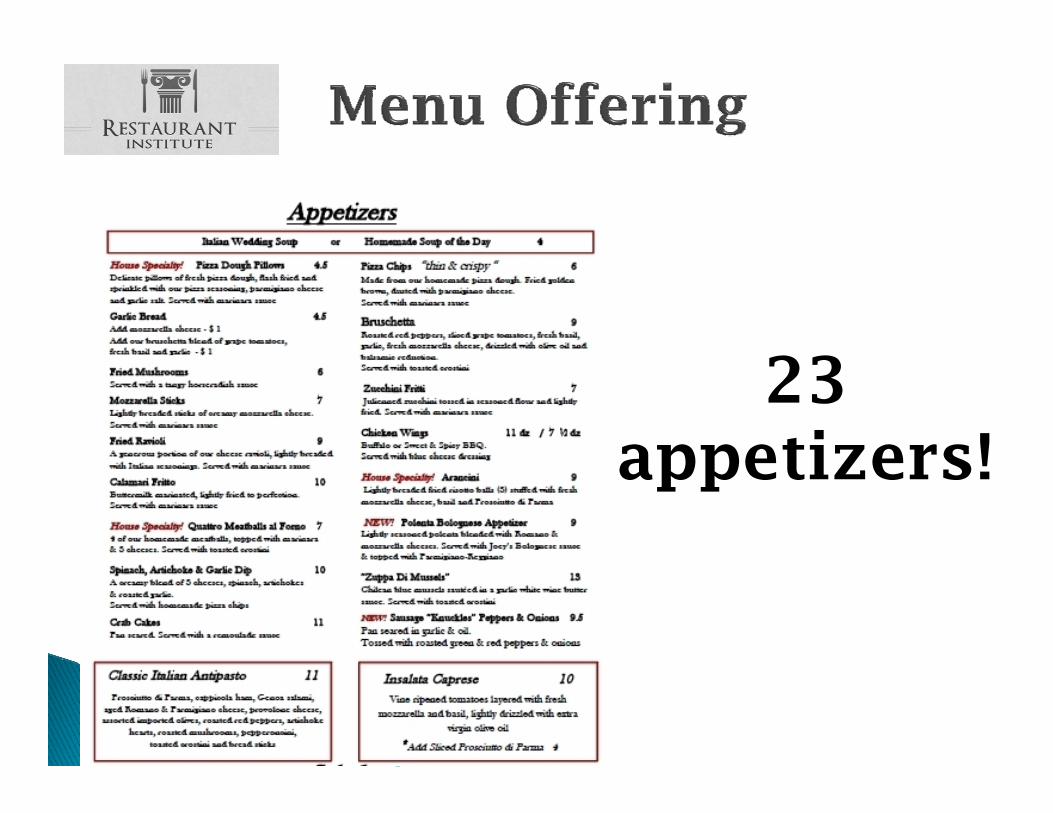
2323appetizers!appetizers!
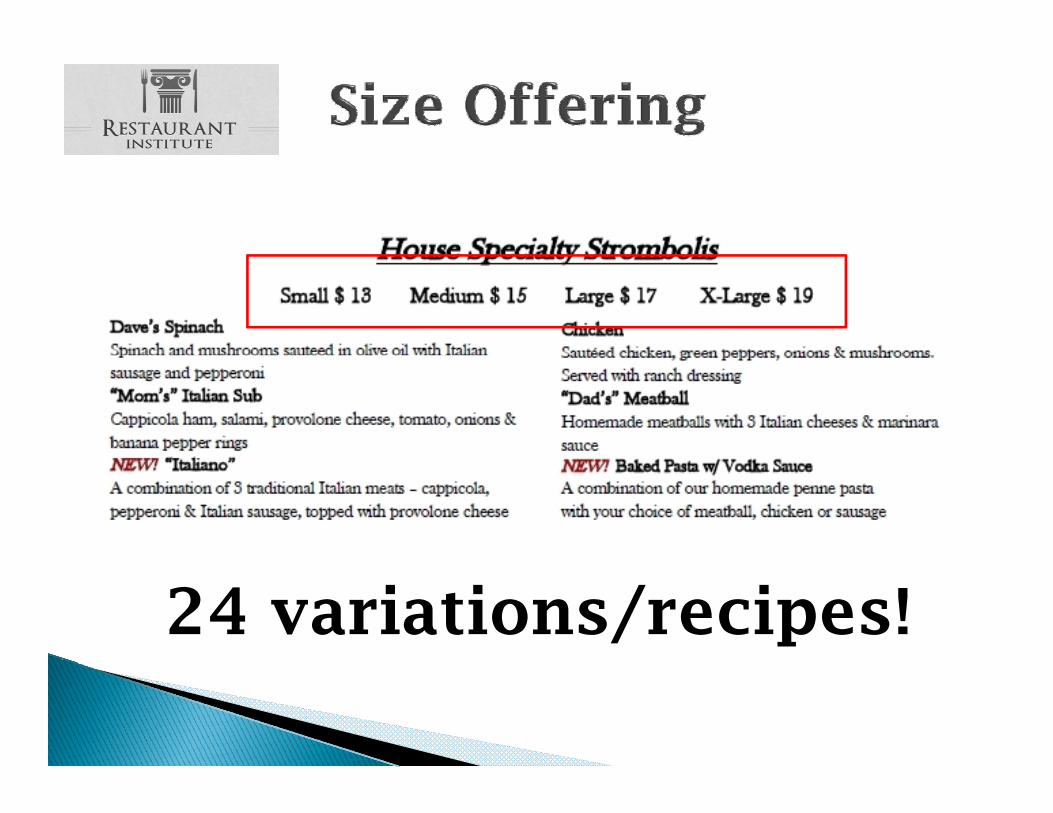
24 variations/recipes!
M R i li iMenu Rationalization
Th i f i lifi d The creation of a simplified menu for the sake of e u fo t e sa e of
operational efficiency and guest satisfactionguest satisfaction.
Source: Managing Service in Food and Beverage Operations, Fourth Edition,by Ronald F. Cichy, Ph.D., NCE, CHA and Philip J. Hickey, Jr.,
ISBN-13: 978-0133097269
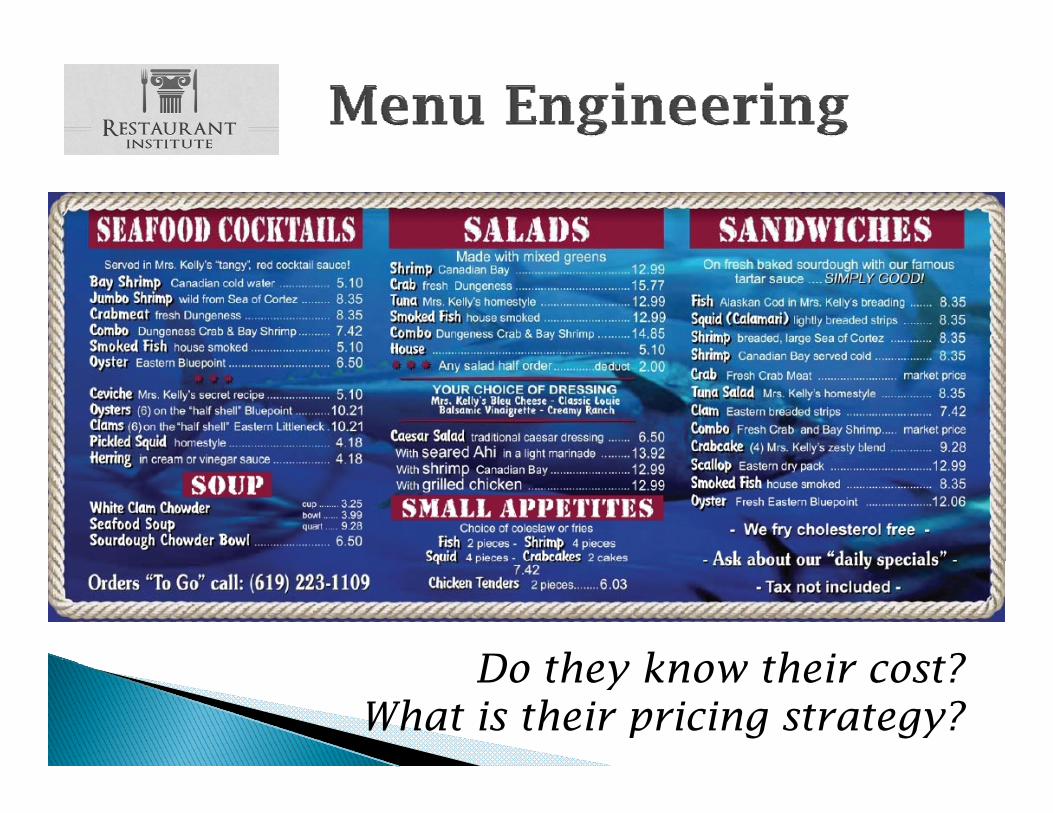
Do they know their cost? Do they know their cost? What is their pricing strategy?
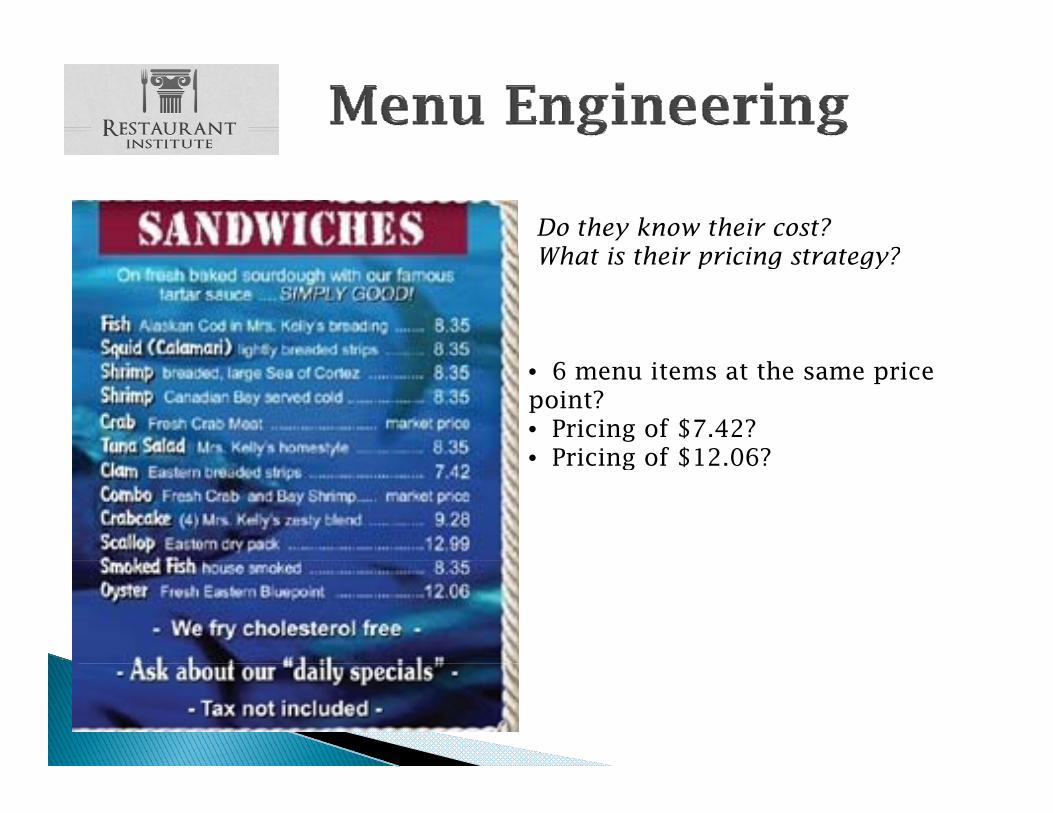
Do they know their cost? What is their pricing strategy?What is their pricing strategy?
• 6 menu items at the same price point?• Pricing of $7.42?• Pricing of $12 06?• Pricing of $12.06?
Question of the DayH i t ti lHow many intentional
not for profit restaurants not-for-profit restaurants do you know?do you know?
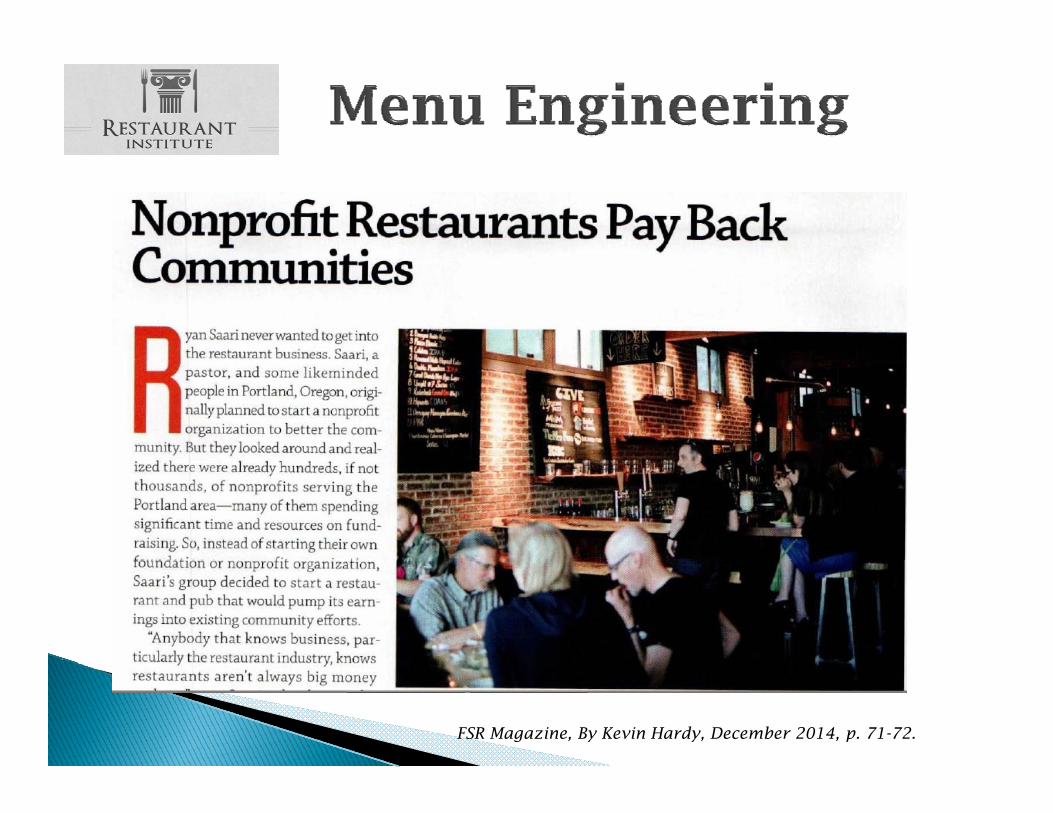
FSR Magazine, By Kevin Hardy, December 2014, p. 71-72.
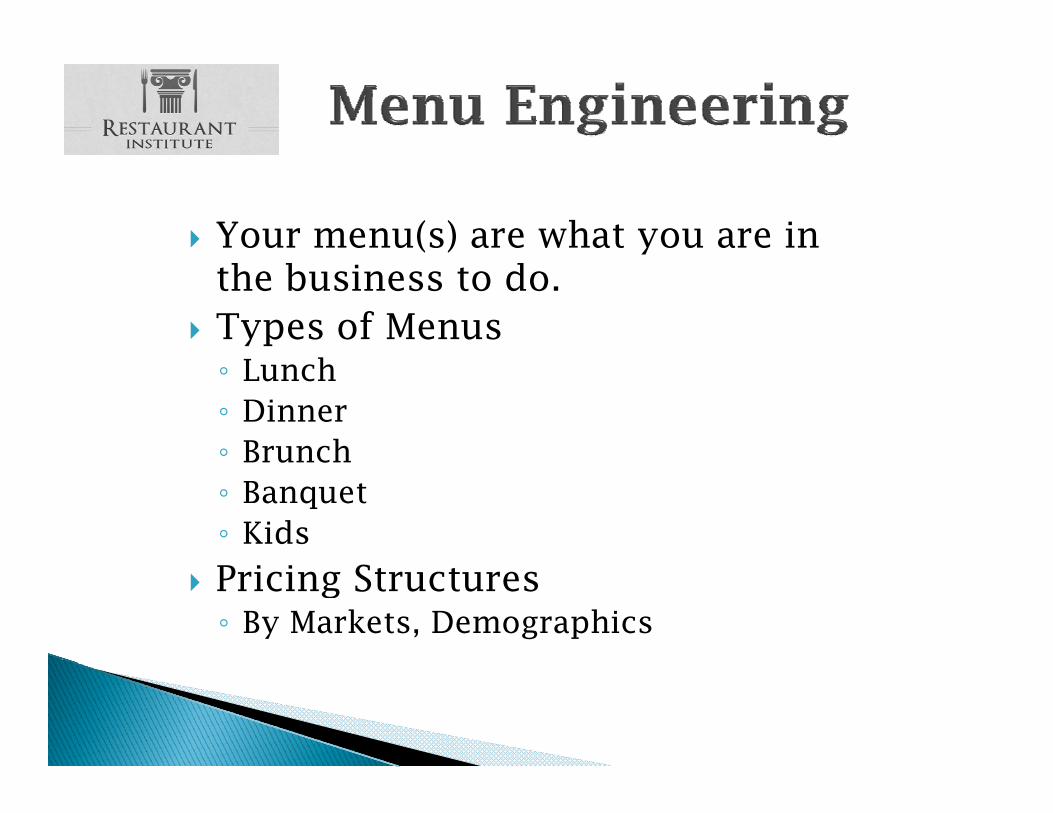
Your menu(s) are what you are in ythe business to do.
Types of Menus◦ Lunch◦ Dinner◦ BrunchBrunch◦ Banquet◦ Kids
Pricing Structures◦ By Markets, Demographics
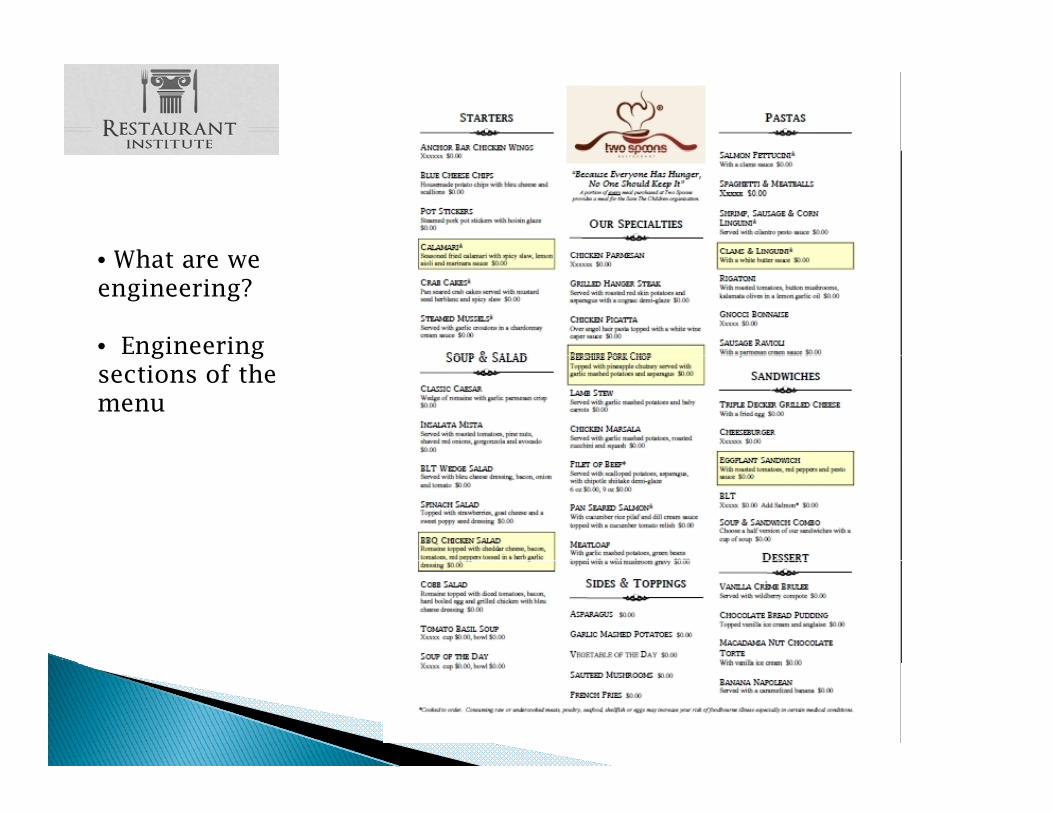
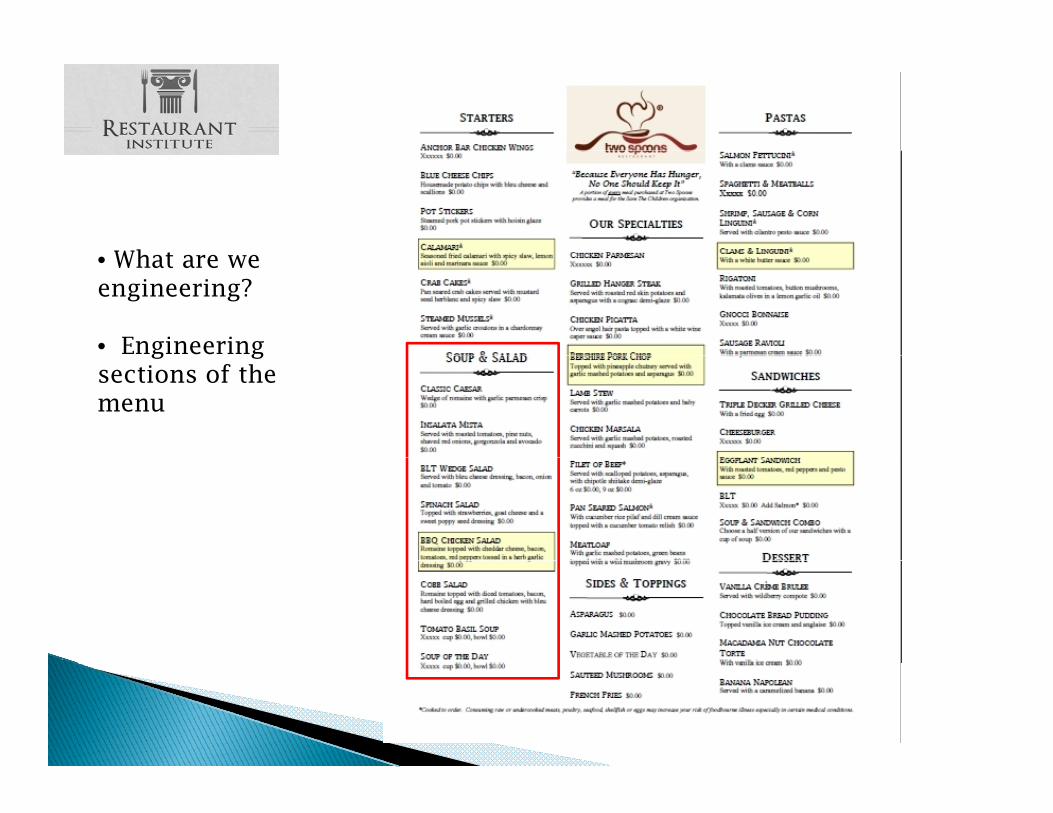
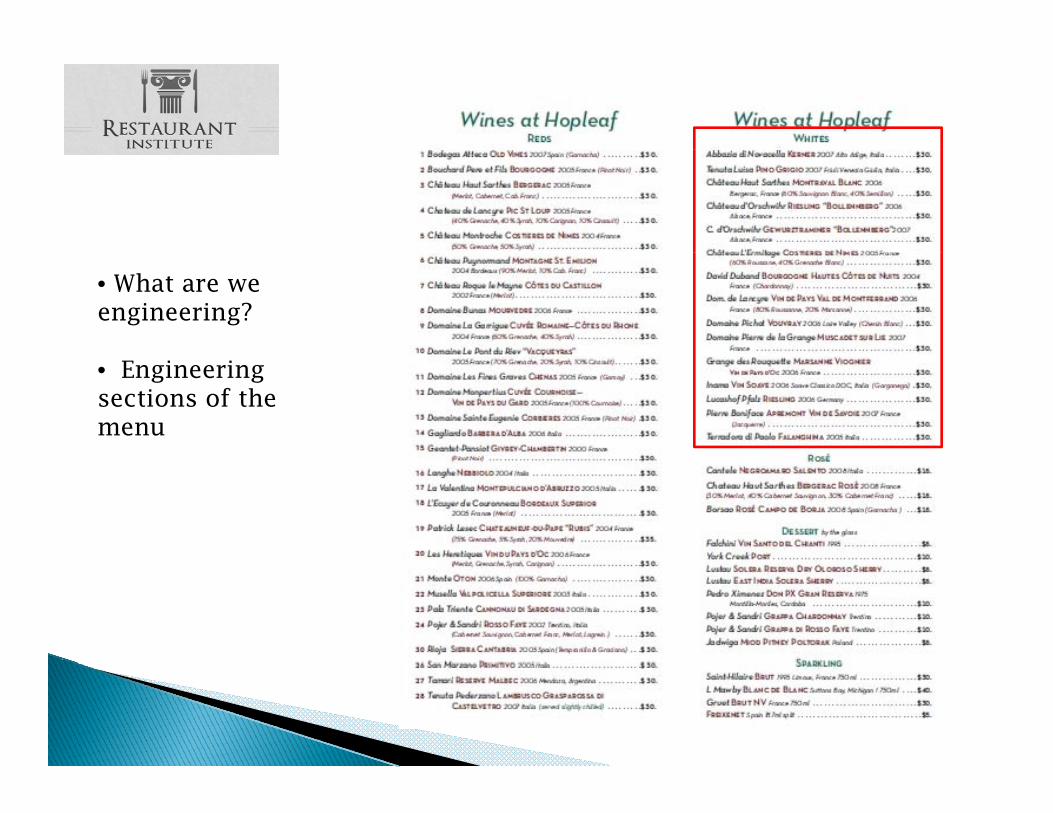
Wh t • What are we engineering?
• Engineering g gsections of the menu

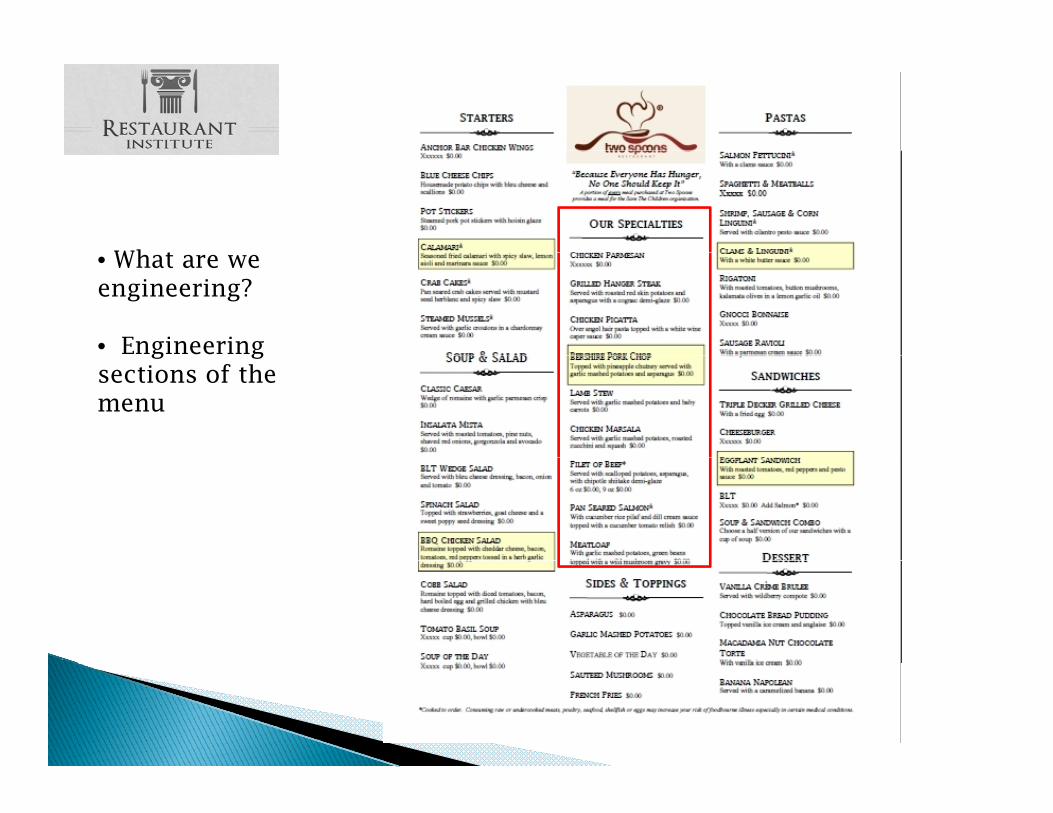
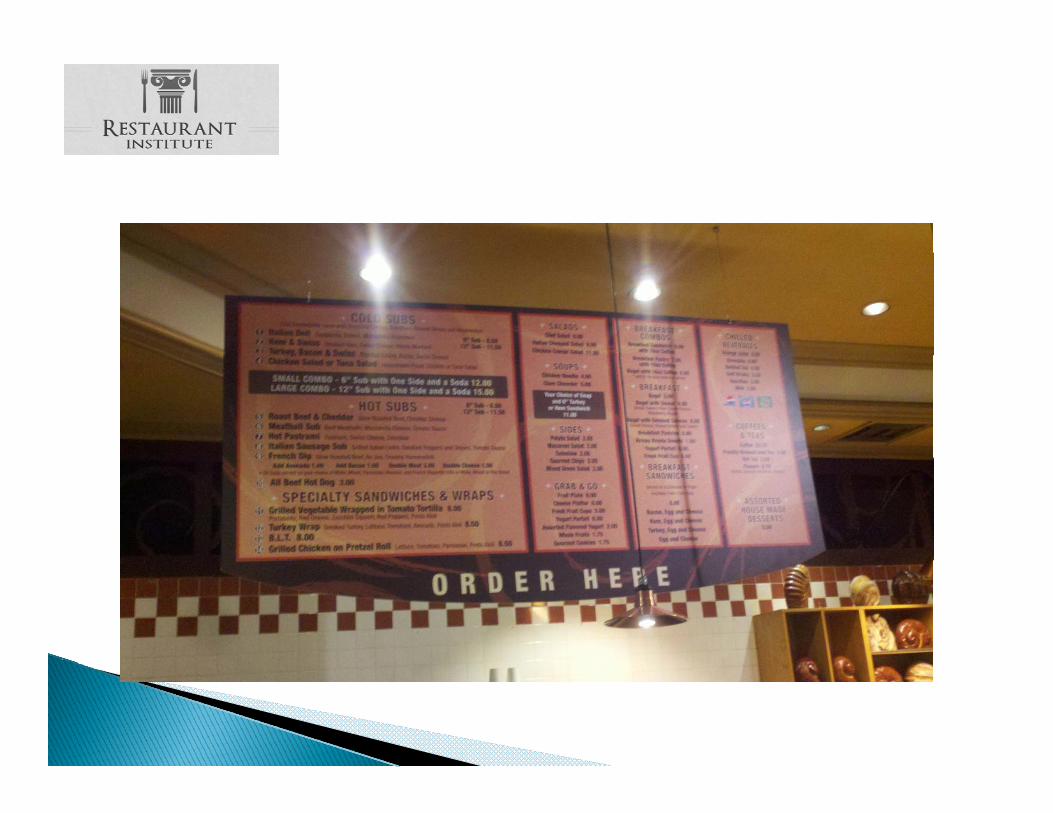
Wh t • What are we engineering?
• Engineering g gsections of the menu
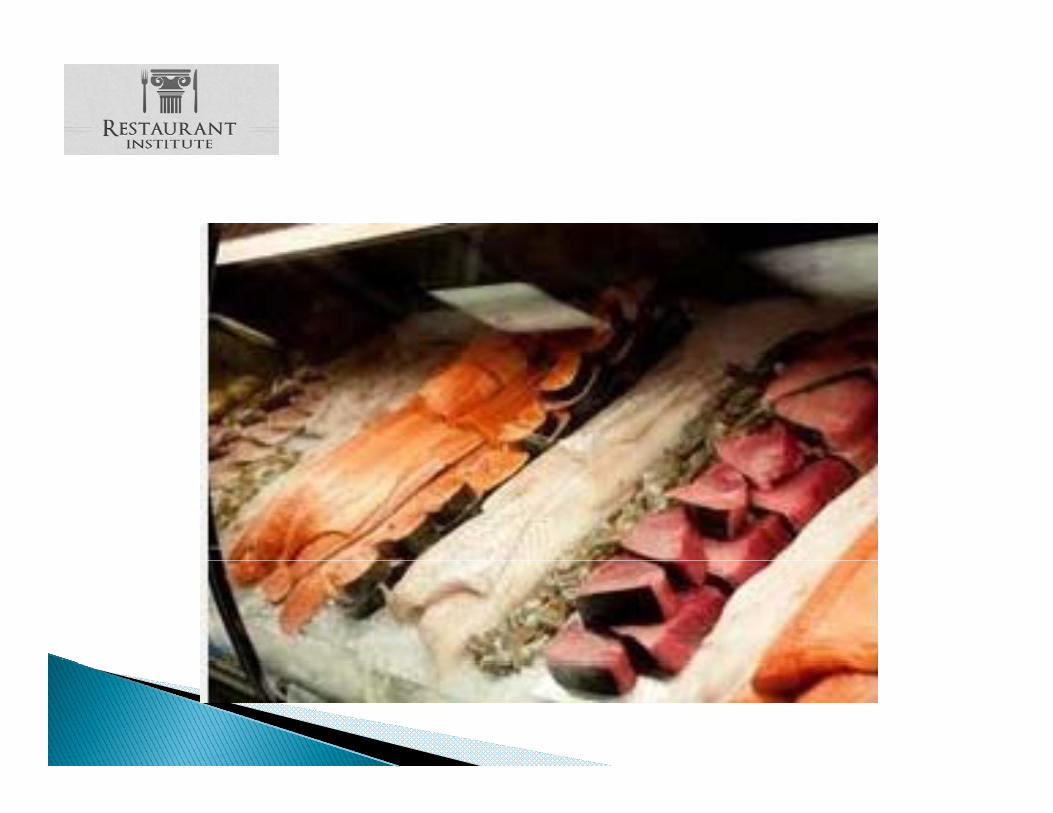
Wh t • What are we engineering?
• Engineering g gsections of the menu
Wh t • What are we engineering?
• Engineering g gsections of the menu
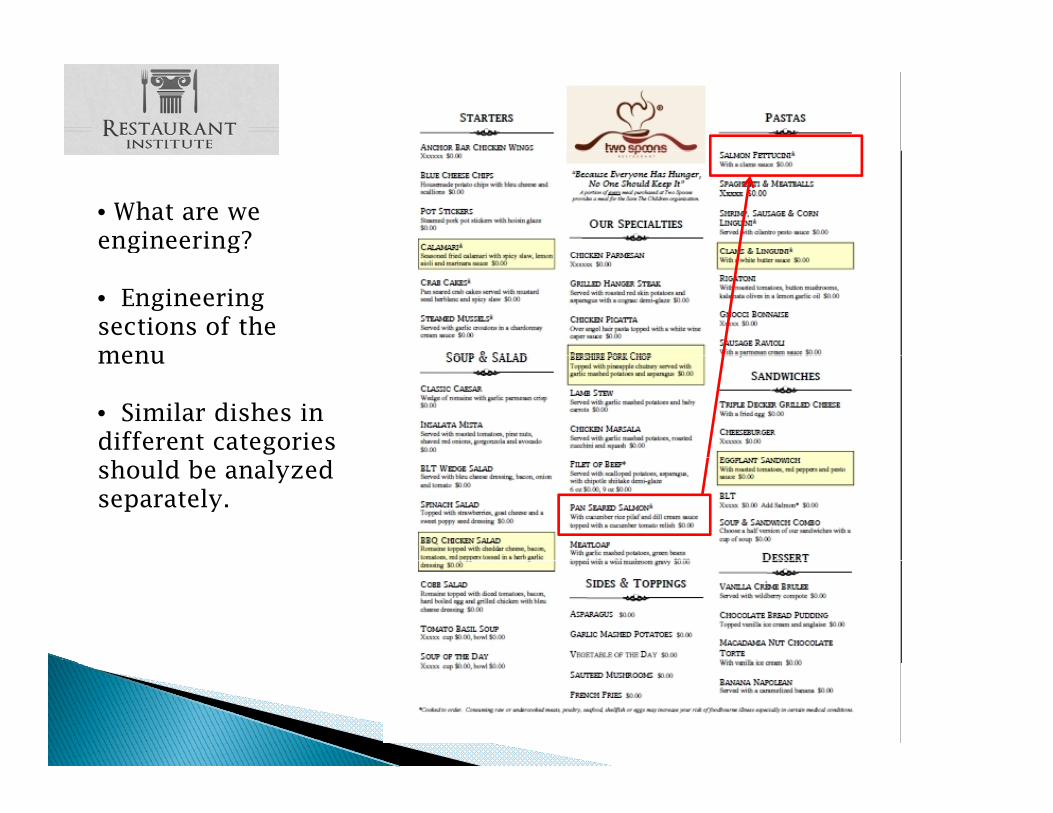
• What are we engineering?g g
• Engineering sections of the menumenu
• Similar dishes in different categories should be analyzed separately.
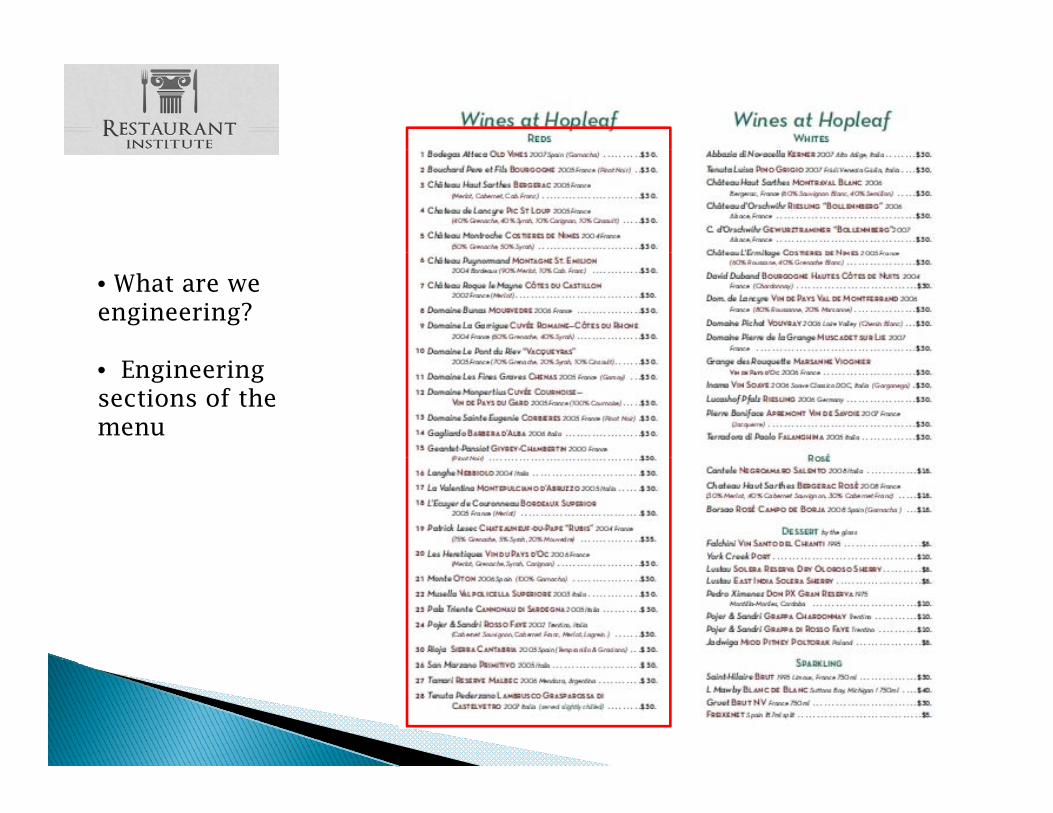
• What are we engineering?
• Engineering sections of the menu
• What are we engineering?
• Engineering sections of the menu
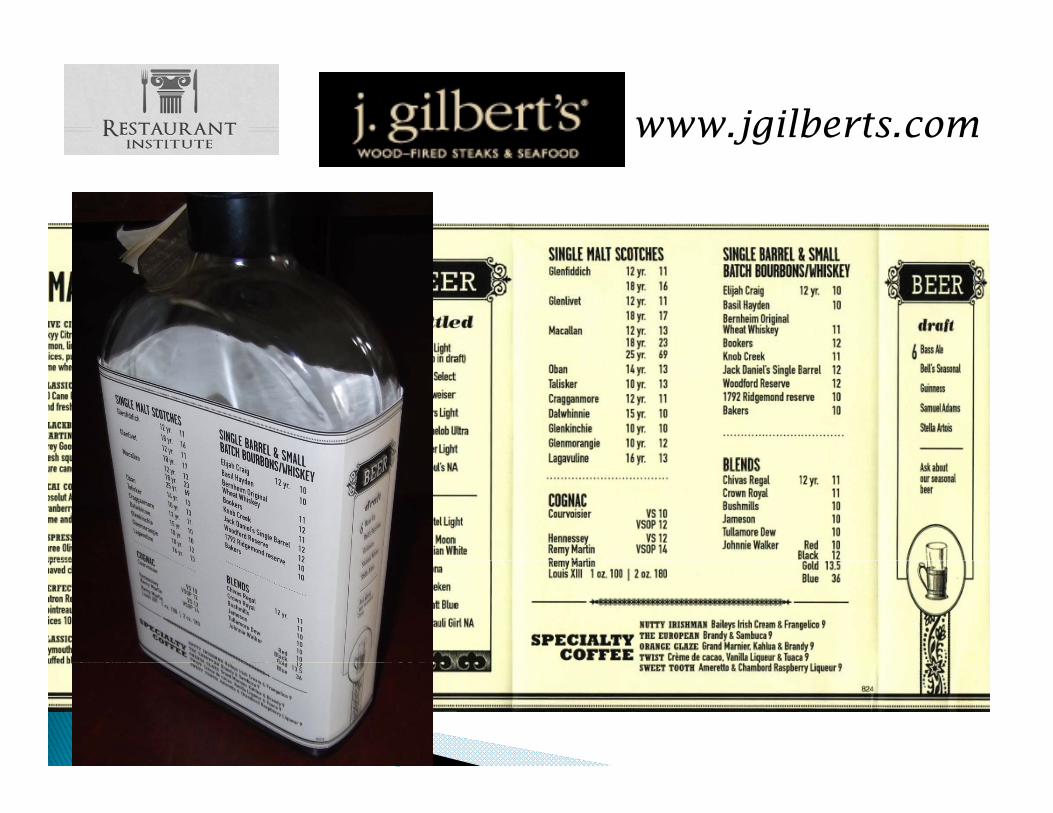
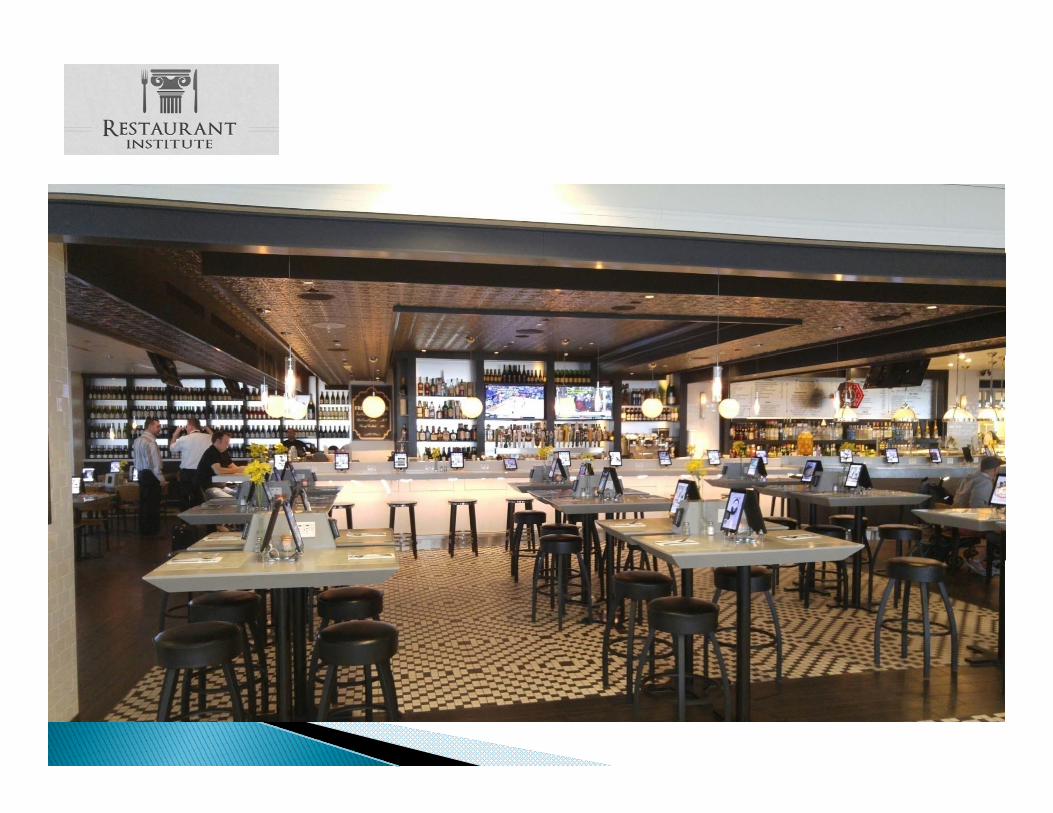
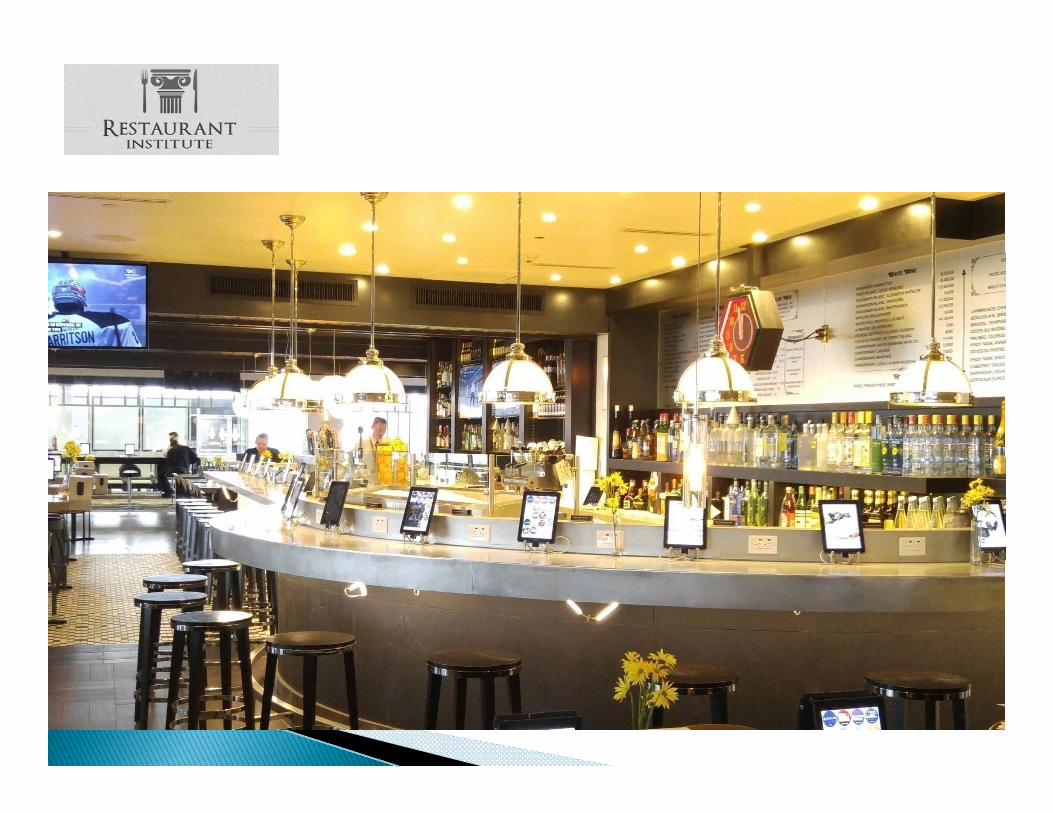
www.jgilberts.com
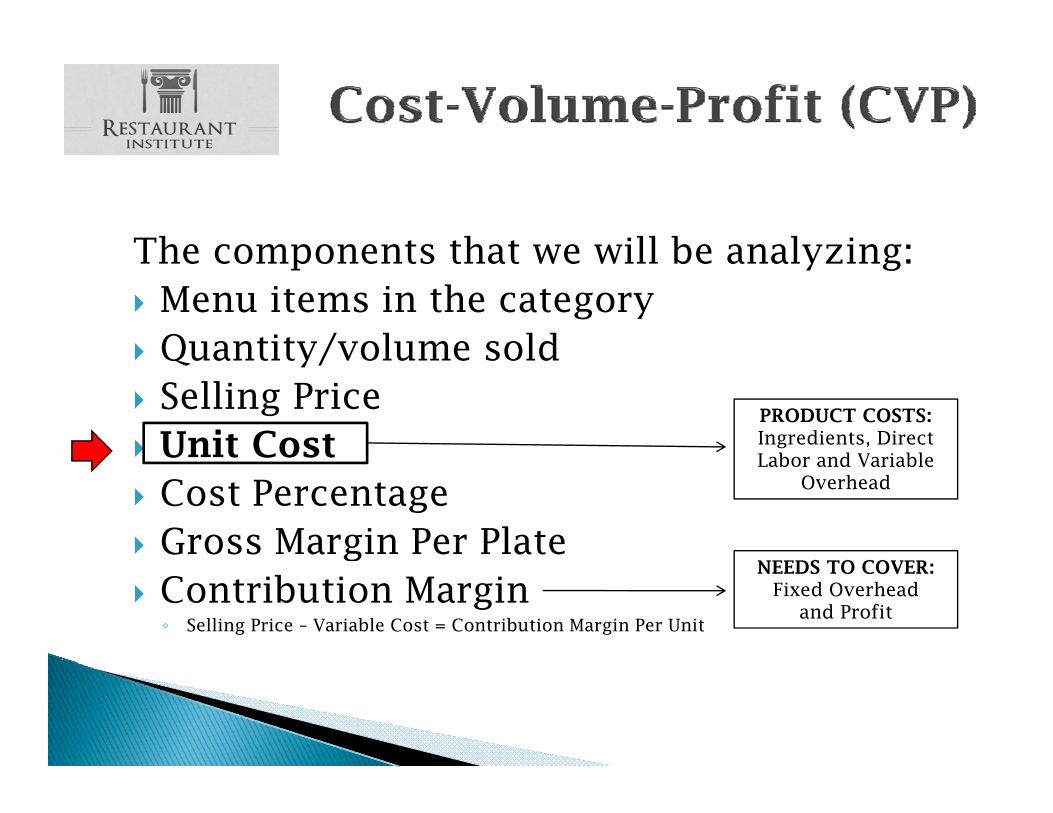
The components that we will be analyzing:The components that we will be analyzing: Menu items in the category Quantity/volume sold Quantity/volume sold Selling Price Unit Cost
PRODUCT COSTS:Ingredients, Direct Labor and Variable
Cost Percentage Gross Margin Per Plate
Labor and Variable Overhead
NEEDS TO COVERg
Contribution Margin◦ Selling Price – Variable Cost = Contribution Margin Per Unit
NEEDS TO COVER:Fixed Overhead
and Profit
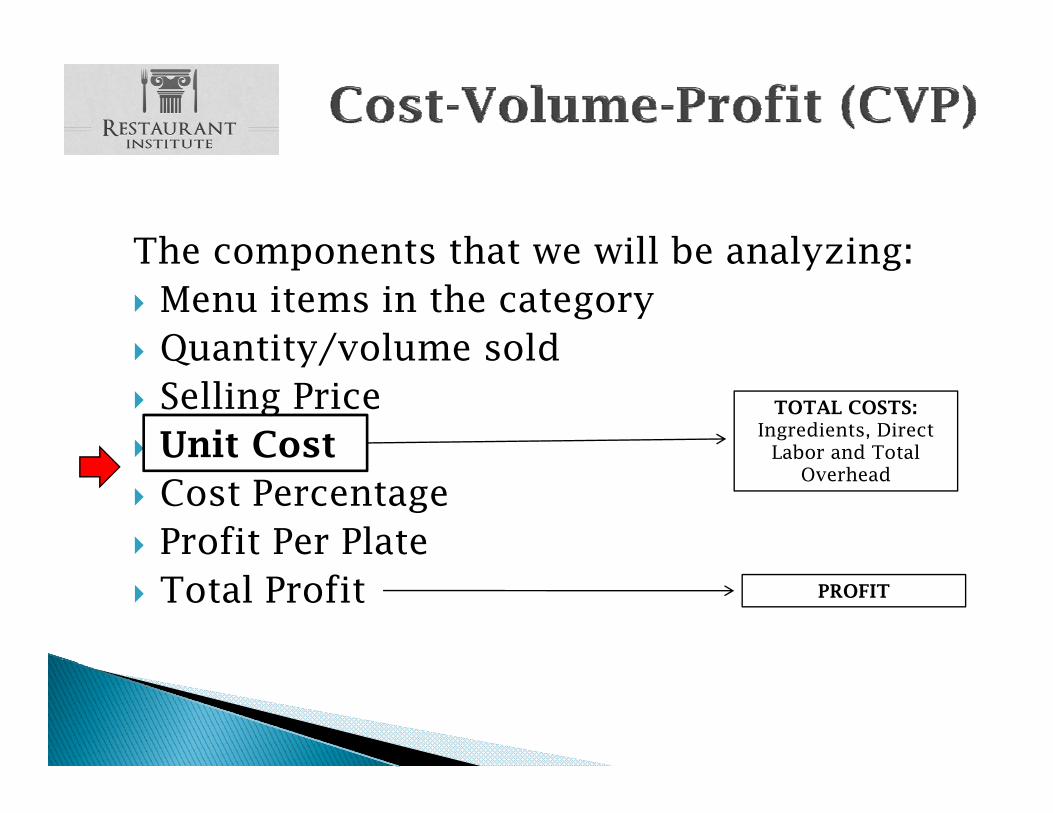
The components that we will be analyzing:The components that we will be analyzing: Menu items in the category Quantity/volume sold Quantity/volume sold Selling Price Unit Cost
TOTAL COSTS:Ingredients, Direct
Labor and Total
Cost Percentage Profit Per Plate
Labor and Total Overhead
Total Profit PROFIT

“You cannot place You cannot place percents in your percents in your
pocket!”pocket!
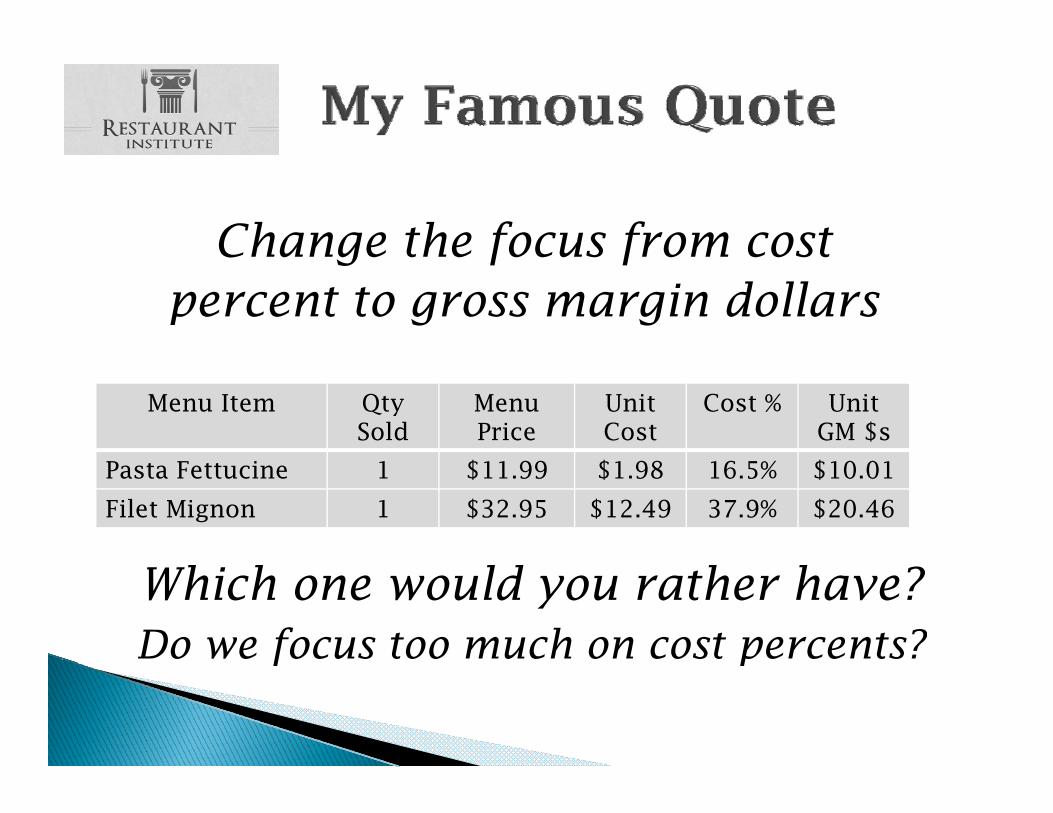
Change the focus from cost Change the focus from cost percent to gross margin dollars
Menu Item Qty Sold
MenuPrice
Unit Cost
Cost % UnitGM $s
Pasta Fettucine 1 $11.99 $1.98 16.5% $10.01
Filet Mignon 1 $32.95 $12.49 37.9% $20.46
Which one would you rather have?Do we focus too much on cost percents?f p
Items that are sold at a loss that Items that are sold at a loss that will result in other menu items
being sold at a profit.g p f
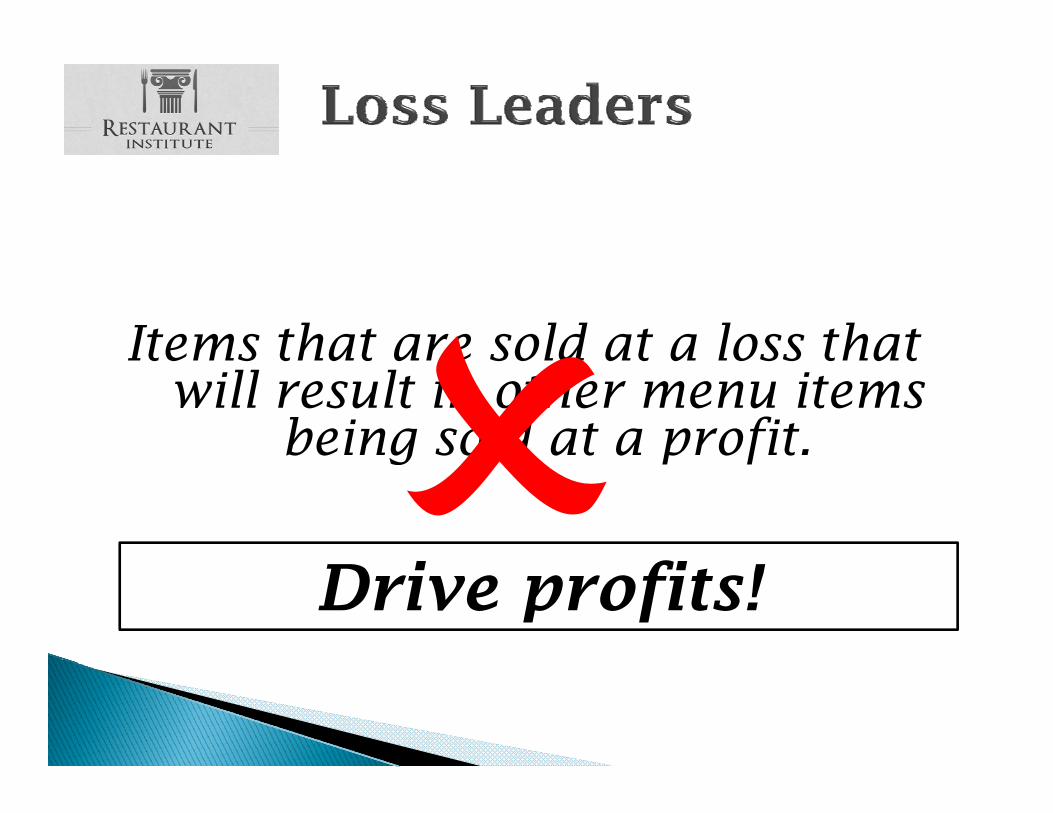
Items that are sold at a loss that Items that are sold at a loss that will result in other menu items
being sold at a profit.g p f
fDrive profits!
%
ty I
nd
ex
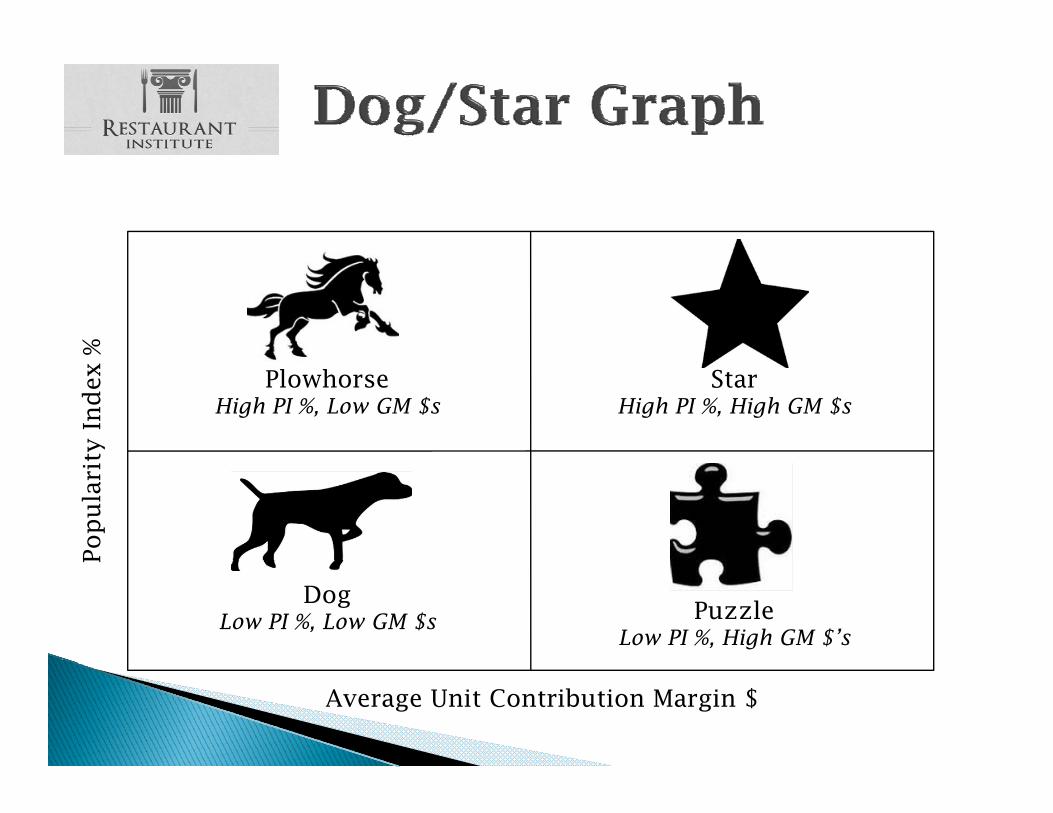
StarHigh PI %, High GM $s
PlowhorseHigh PI %, Low GM $s
Pop
ula
rit
P
PuzzleLow PI %, High GM $’s
DogLow PI %, Low GM $s
Average Unit Contribution Margin $
%
ty I
nd
ex
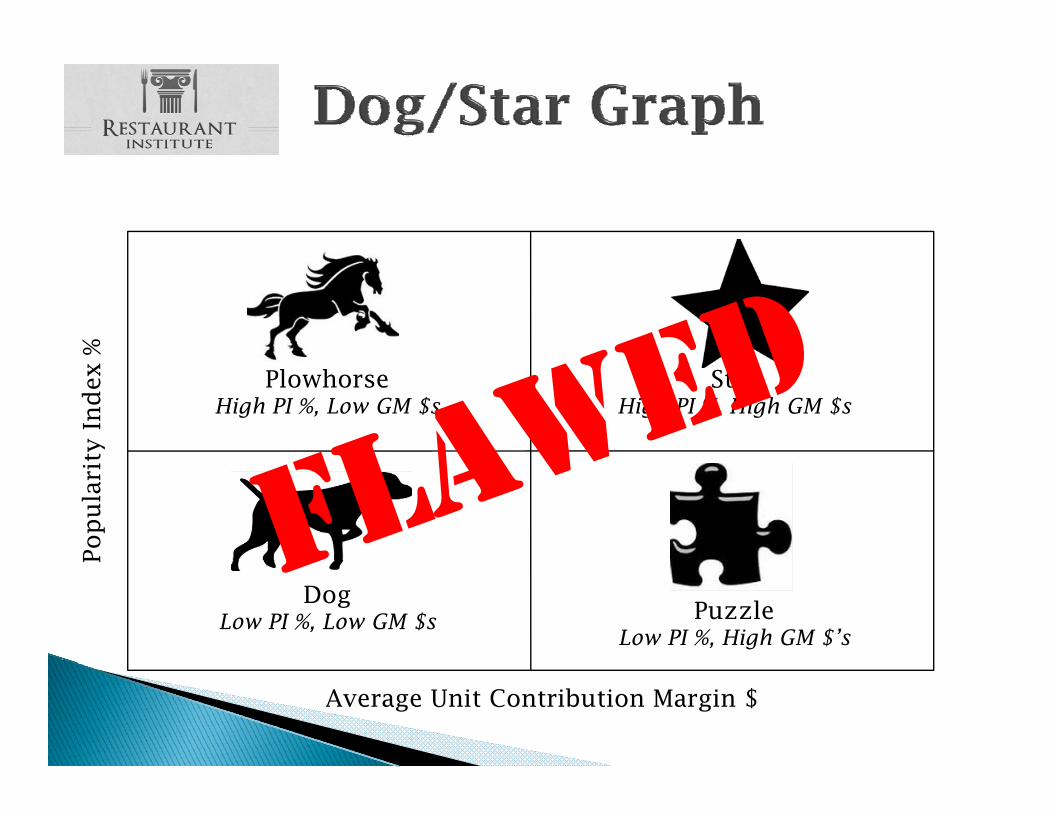
StarHigh PI %, High GM $s
PlowhorseHigh PI %, Low GM $s
Pop
ula
rit
P
PuzzleLow PI %, High GM $’s
DogLow PI %, Low GM $s
Average Unit Contribution Margin $
Flaw #1Flaw #1Traditional Dog/Star reports only
analyze entrees onlyanalyze entrees only.
Flaw #1Traditional Dog/Star reports only
analyze entrees only.Fl #2Flaw #2
The calculation looks as unitcontribution margin as a basecontribution margin as a base.
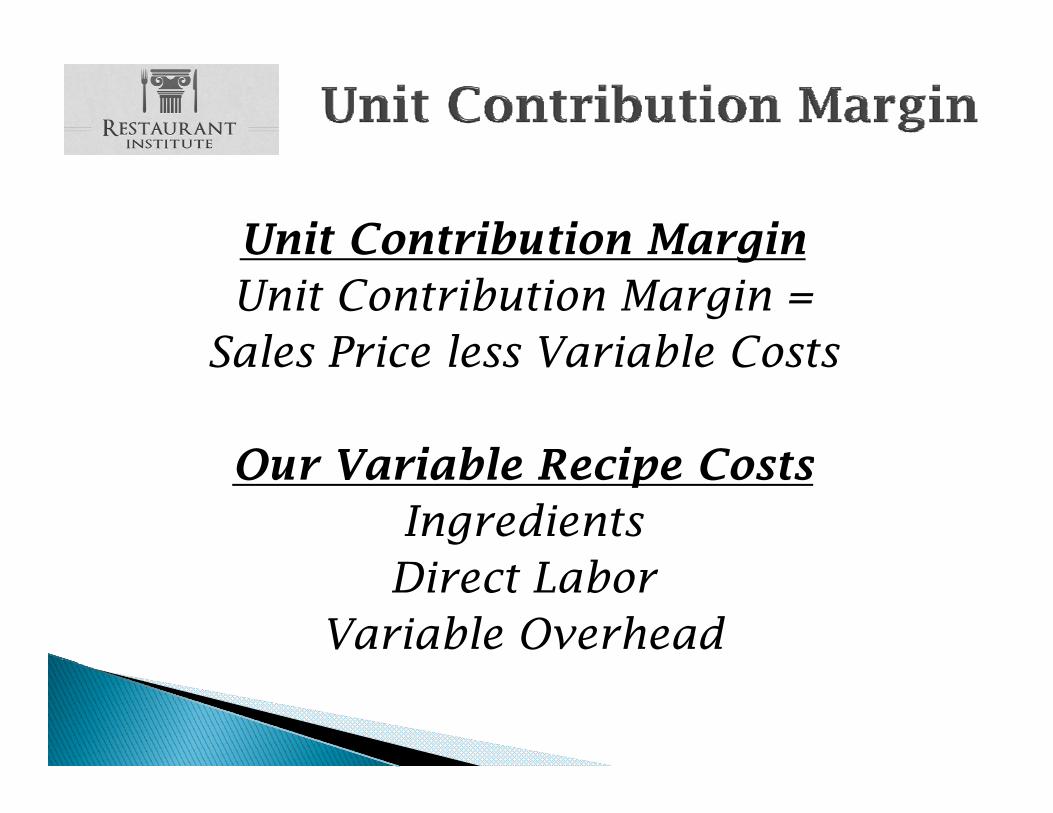
Unit Contribution MarginUnit Contribution MarginUnit Contribution Margin =
Sales Price less Variable CostsSales Price less Variable Costs
Our Variable Recipe CostsOur Variable Recipe CostsIngredients
bDirect LaborVariable Overhead
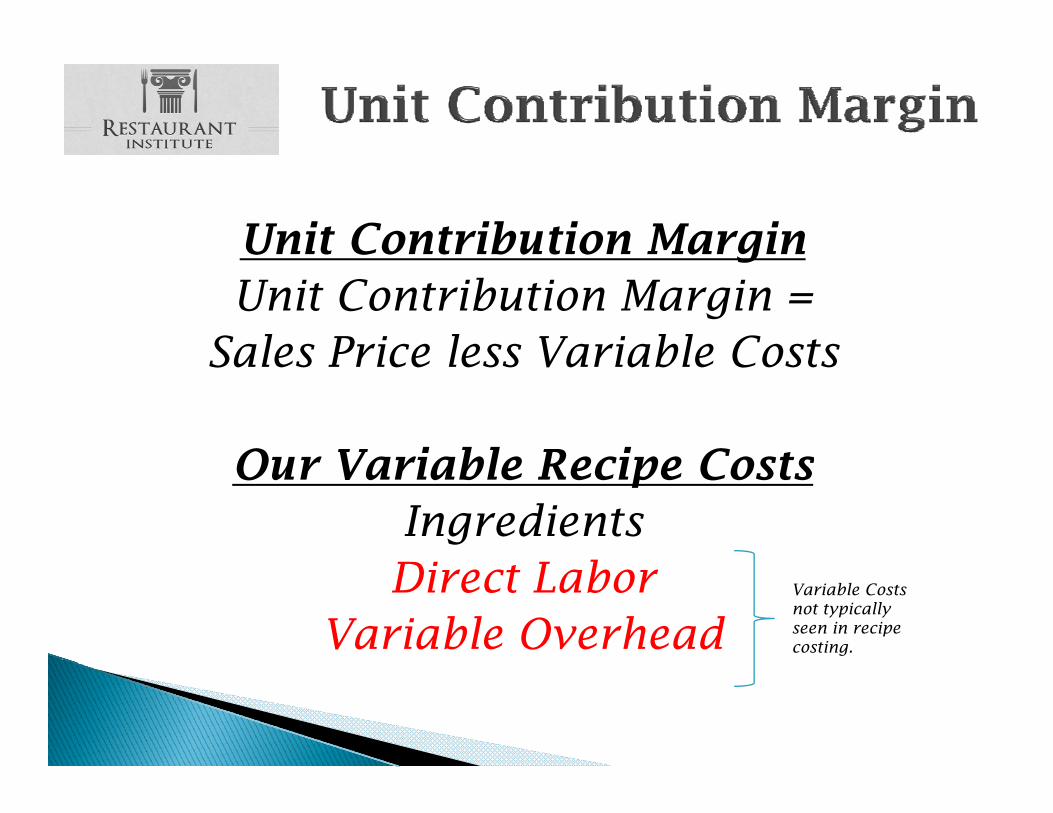
Unit Contribution MarginUnit Contribution MarginUnit Contribution Margin =
Sales Price less Variable CostsSales Price less Variable Costs
Our Variable Recipe CostsOur Variable Recipe CostsIngredients
bDirect LaborVariable Overhead
Variable Costs not typically seen in recipe costing.
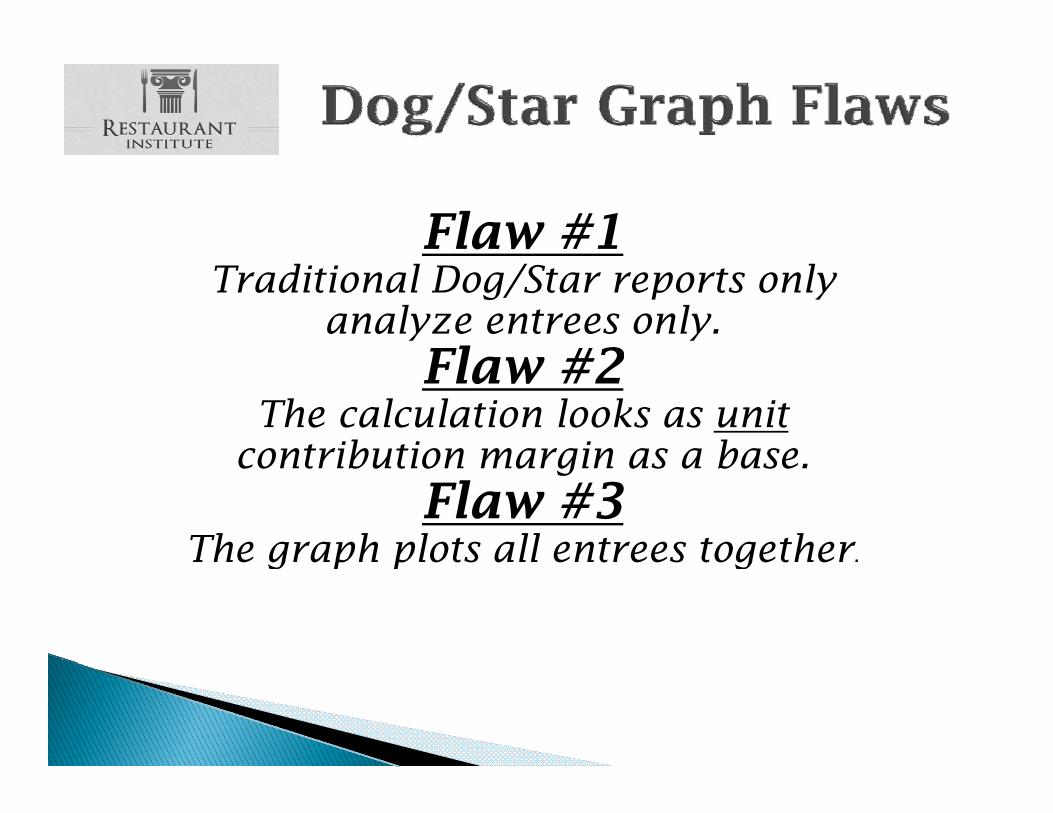
Flaw #1Traditional Dog/Star reports only
analyze entrees only.Fl #2Flaw #2
The calculation looks as unitcontribution margin as a basecontribution margin as a base.
Flaw #3The graph plots all entrees together.The graph plots all entrees together.
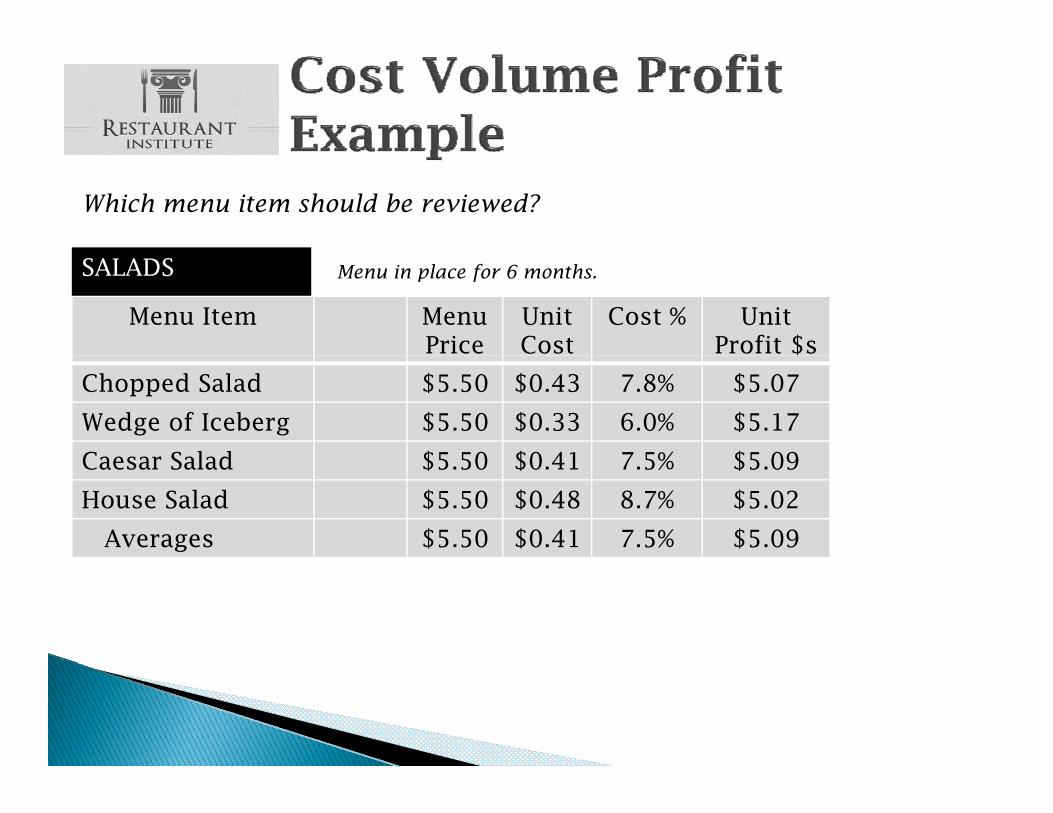
Which menu item should be reviewed?
Menu Item MenuPrice
Unit Cost
Cost % UnitProfit $s
SALADS Menu in place for 6 months.
Chopped Salad $5.50 $0.43 7.8% $5.07
Wedge of Iceberg $5.50 $0.33 6.0% $5.17
Caesar Salad $5 50 $0 41 7 5% $5 09Caesar Salad $5.50 $0.41 7.5% $5.09
House Salad $5.50 $0.48 8.7% $5.02
Averages $5.50 $0.41 7.5% $5.09
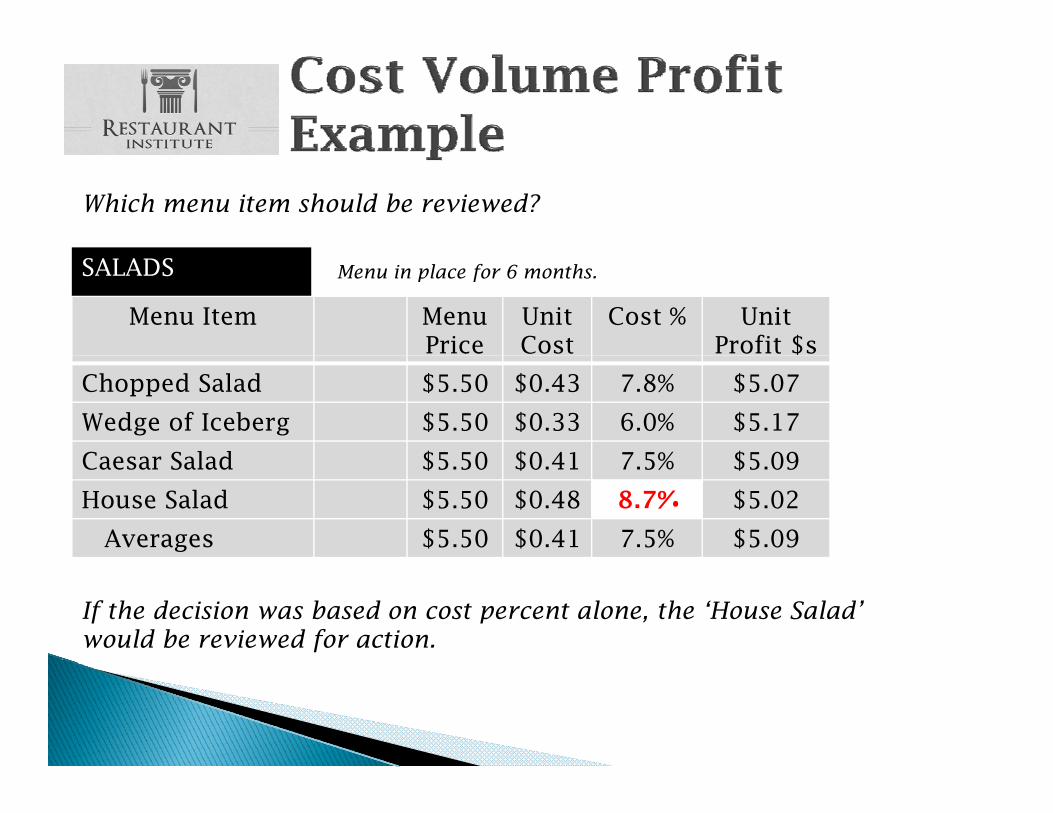
Which menu item should be reviewed?
Menu Item Menu Price
Unit Cost
Cost % UnitProfit $s
SALADS Menu in place for 6 months.
Chopped Salad $5.50 $0.43 7.8% $5.07
Wedge of Iceberg $5.50 $0.33 6.0% $5.17
Caesar Salad $5 50 $0 41 7 5% $5 09Caesar Salad $5.50 $0.41 7.5% $5.09
House Salad $5.50 $0.48 8.7% $5.02
Averages $5.50 $0.41 7.5% $5.09
If the decision was based on cost percent alone, the ‘House Salad’ would be reviewed for action.
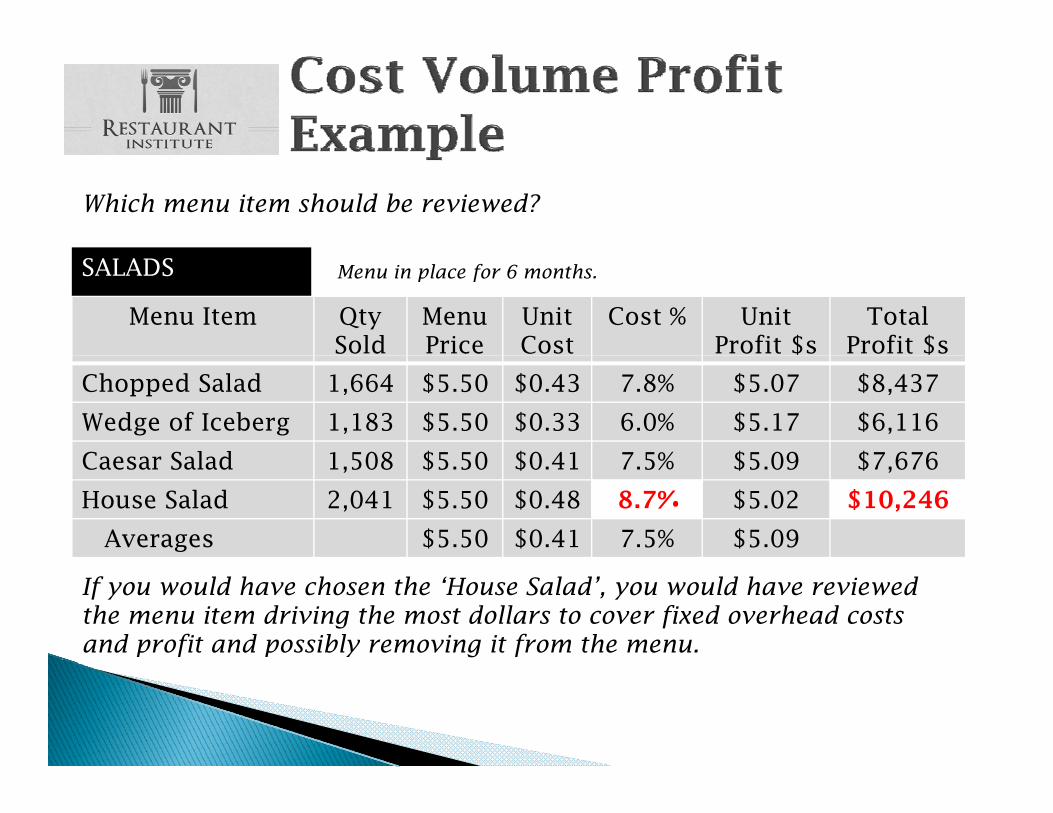
Which menu item should be reviewed?
Menu Item Qty Sold
Menu Price
Unit Cost
Cost % UnitProfit $s
Total Profit $s
SALADS Menu in place for 6 months.
Chopped Salad 1,664 $5.50 $0.43 7.8% $5.07 $8,437
Wedge of Iceberg 1,183 $5.50 $0.33 6.0% $5.17 $6,116
Caesar Salad 1 508 $5 50 $0 41 7 5% $5 09 $7 676Caesar Salad 1,508 $5.50 $0.41 7.5% $5.09 $7,676
House Salad 2,041 $5.50 $0.48 8.7% $5.02 $10,246
Averages $5.50 $0.41 7.5% $5.09
If you would have chosen the ‘House Salad’, you would have reviewed the menu item driving the most dollars to cover fixed overhead costs and profit and possibly removing it from the menu.
Which menu item should be reviewed?
Menu Item Qty Sold
Menu Price
Unit Cost
Cost % UnitProfit
Total Profit $s
GM MM Rank
Ch d S l d 1 664 $5 50 $0 43 7 8% $5 07 $8 437 L H Pl h ?
SALADS Menu in place for 6 months.
Chopped Salad 1,664 $5.50 $0.43 7.8% $5.07 $8,437 L H Plowhorse?
Wedge of Iceberg 1,183 $5.50 $0.33 6.0% $5.17 $6,116 H H Star?
Caesar Salad 1,508 $5.50 $0.41 7.5% $5.09 $7,676 H H Star?
House Salad 2,041 $5.50 $0.48 8.7% $5.02 $10,246 L H Plowhorse?
Averages $5.50 $0.41 7.5% $5.09
( / ) $ / $MM = (1/4) * .7 = 17.5%; GM = $32,474 / 6,396 = $5.08Flaw: Gross margin rank for dog/star calculation is based on unit level only, not extended contribution margin dollars.
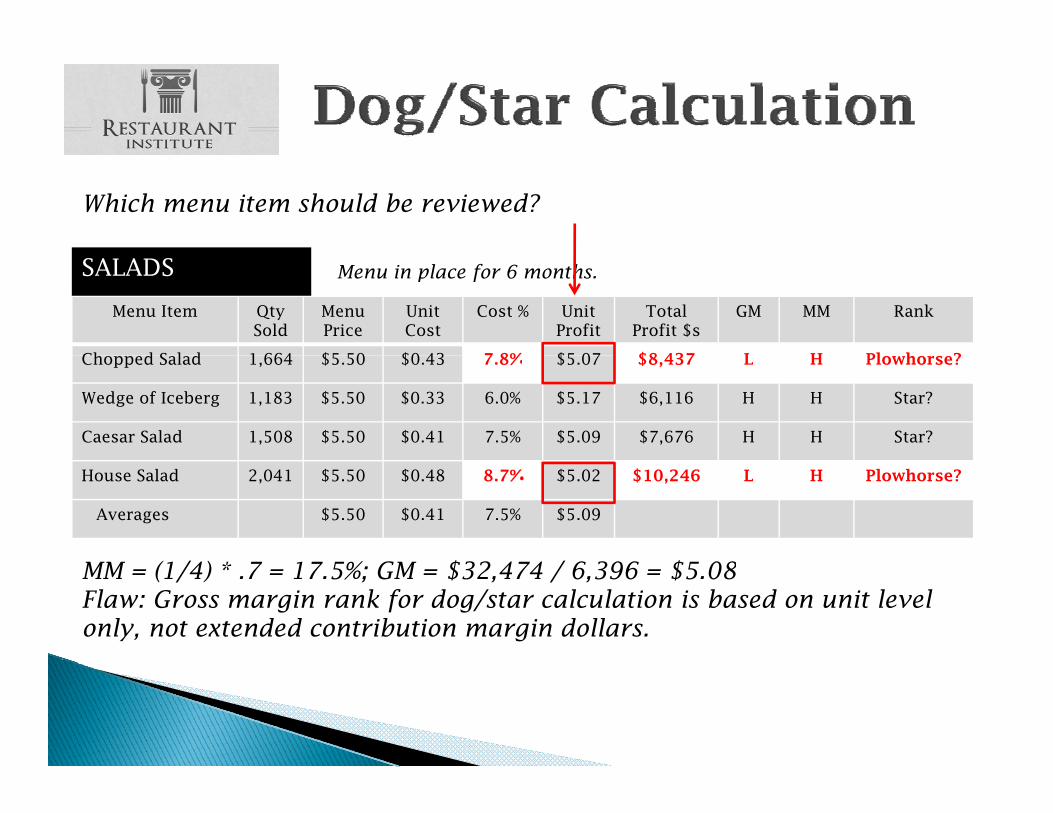
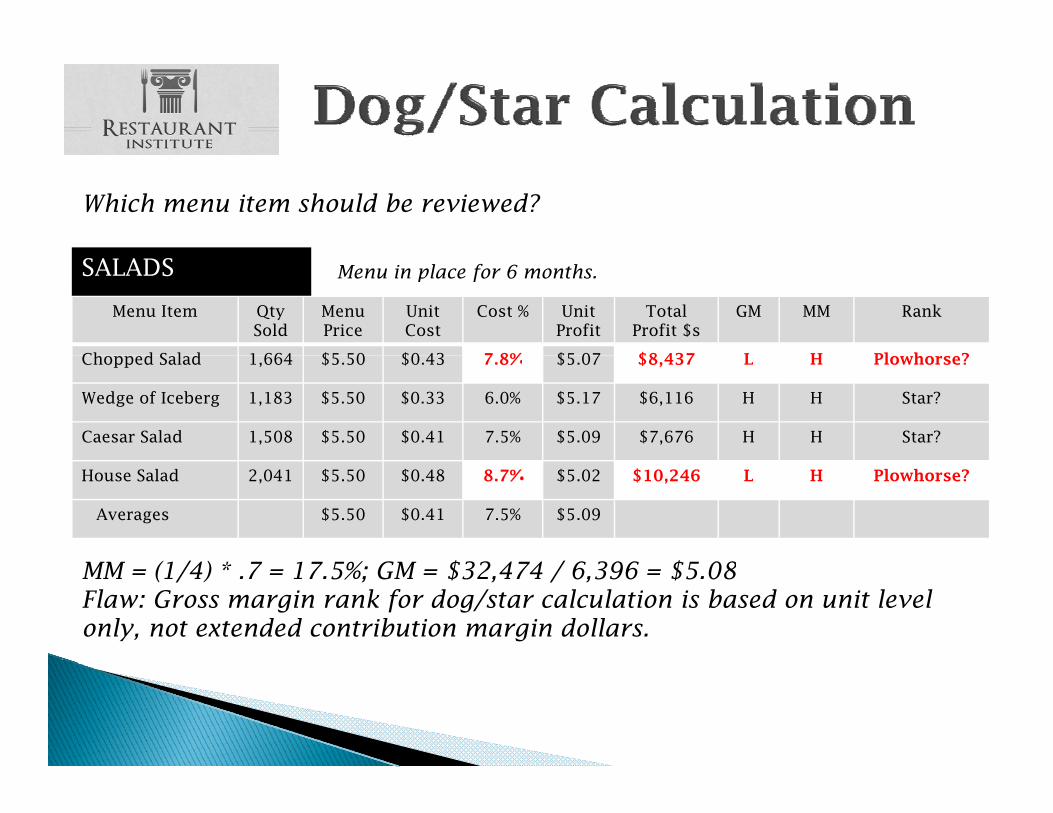
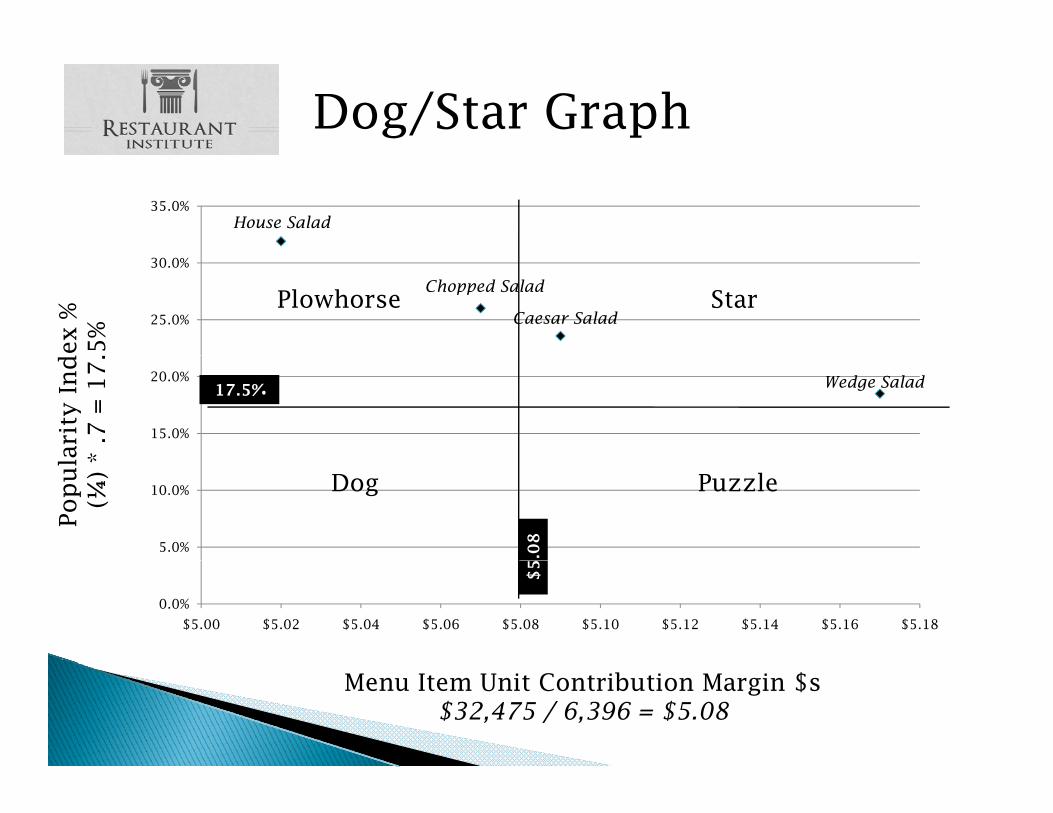
Dog/Star Graph
35.0%House Salad
25.0%
30.0%
ex %
5%
StarPlowhorseChopped Salad
Caesar Salad
15.0%
20.0%
arit
y I
nd
* .7
= 1
7.
17.5% Wedge Salad
5.0%
10.0%
Pop
ul
(¼)
*
.08
Dog Puzzle
0.0%
$5.00 $5.02 $5.04 $5.06 $5.08 $5.10 $5.12 $5.14 $5.16 $5.18
$5
Menu Item Unit Contribution Margin $s$32,475 / 6,396 = $5.08
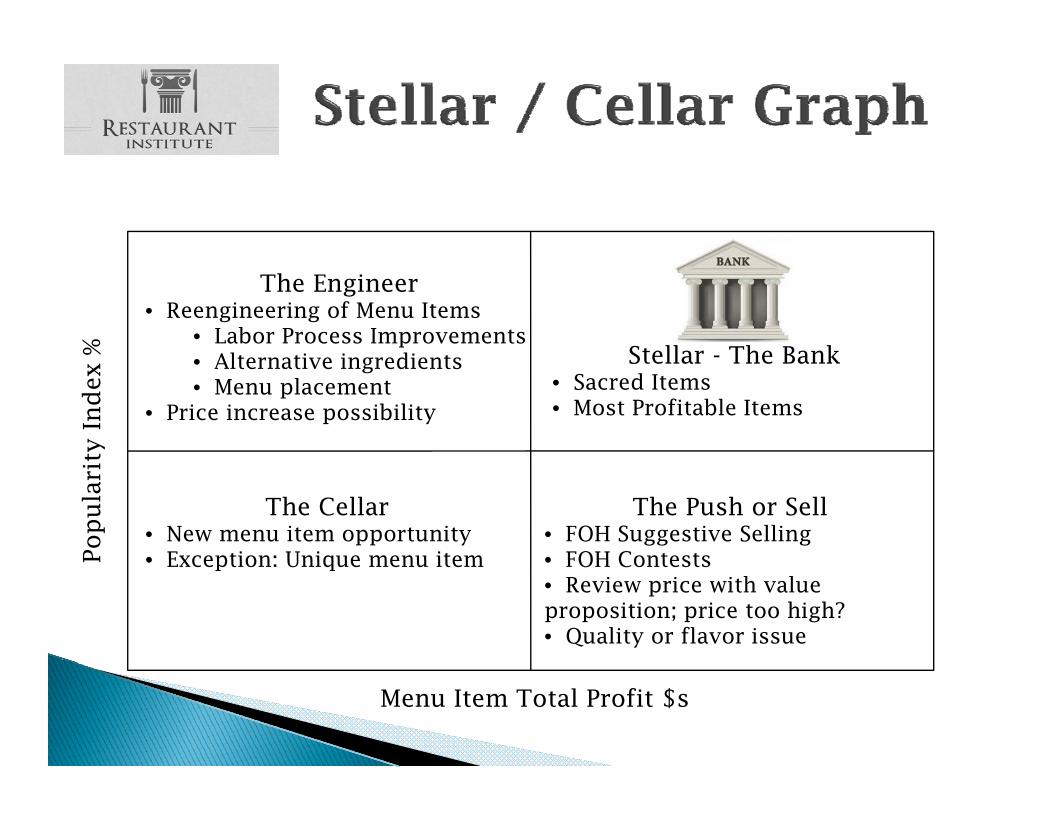
% Stellar The Bank
The Engineer• Reengineering of Menu Items
• Labor Process ImprovementsAlt ti i di t
ty I
nd
ex Stellar - The Bank
• Sacred Items• Most Profitable Items
• Alternative ingredients• Menu placement
• Price increase possibility
Pop
ula
rit
The Push or Sell• FOH Suggestive Selling• FOH Contests
The Cellar• New menu item opportunity• Exception: Unique menu itemP • FOH Contests
• Review price with value proposition; price too high?• Quality or flavor issue
• Exception: Unique menu item
Menu Item Total Profit $s
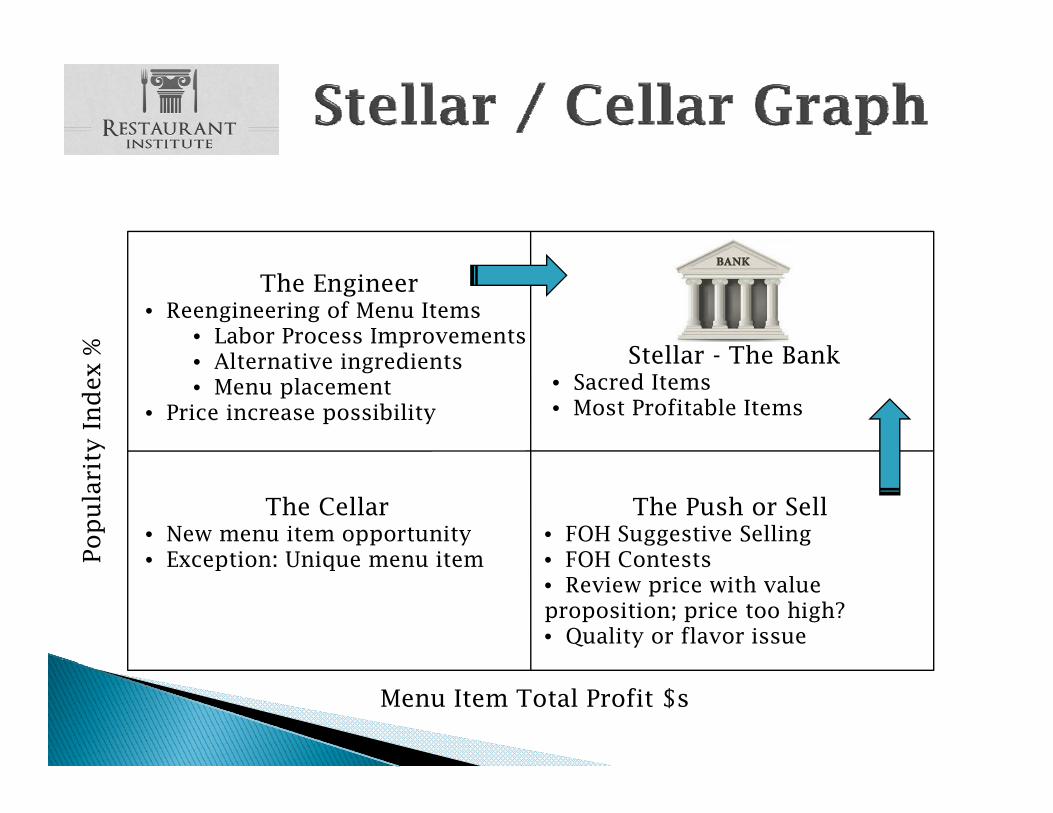
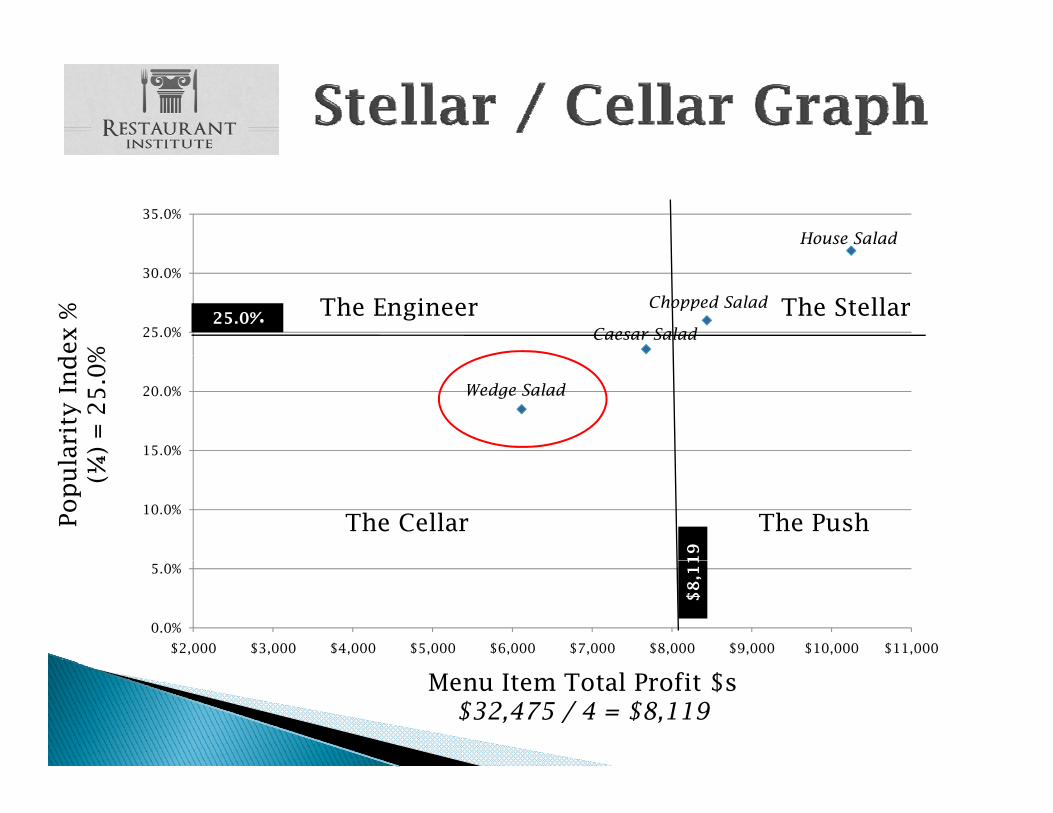
35.0%
House Salad
25.0%
30.0%
ex %
%
25.0%Chopped Salad
Caesar Salad
The StellarThe Engineer
15.0%
20.0%
arit
y I
nd
¼)
= 2
5.0
%
Wedge Salad
10.0%Pop
ul
(¼
19
The Cellar The Push
0.0%
5.0%
$2,000 $3,000 $4,000 $5,000 $6,000 $7,000 $8,000 $9,000 $10,000 $11,000
$8
,11
Menu Item Total Profit $s$32,475 / 4 = $8,119
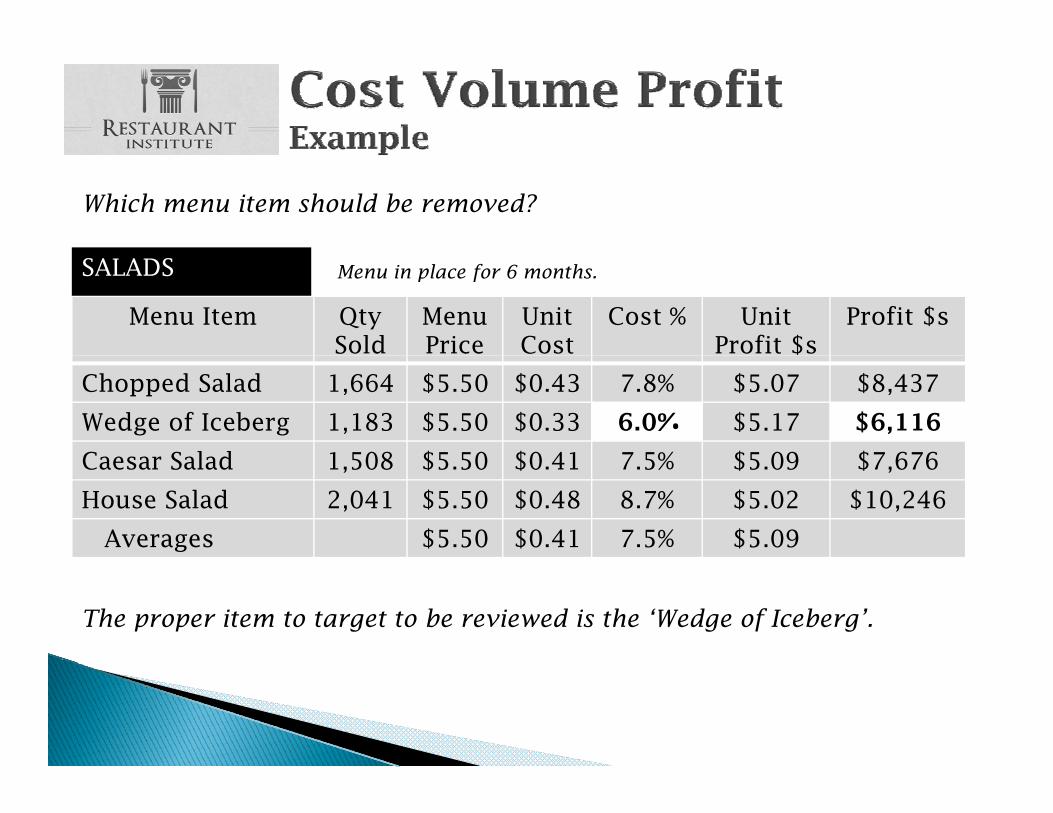
Which menu item should be removed?
Menu Item Qty Sold
Menu Price
Unit Cost
Cost % UnitProfit $s
Profit $s
SALADS Menu in place for 6 months.
Chopped Salad 1,664 $5.50 $0.43 7.8% $5.07 $8,437
Wedge of Iceberg 1,183 $5.50 $0.33 6.0% $5.17 $6,116
Caesar Salad 1 508 $5 50 $0 41 7 5% $5 09 $7 676Caesar Salad 1,508 $5.50 $0.41 7.5% $5.09 $7,676
House Salad 2,041 $5.50 $0.48 8.7% $5.02 $10,246
Averages $5.50 $0.41 7.5% $5.09
The proper item to target to be reviewed is the ‘Wedge of Iceberg’.
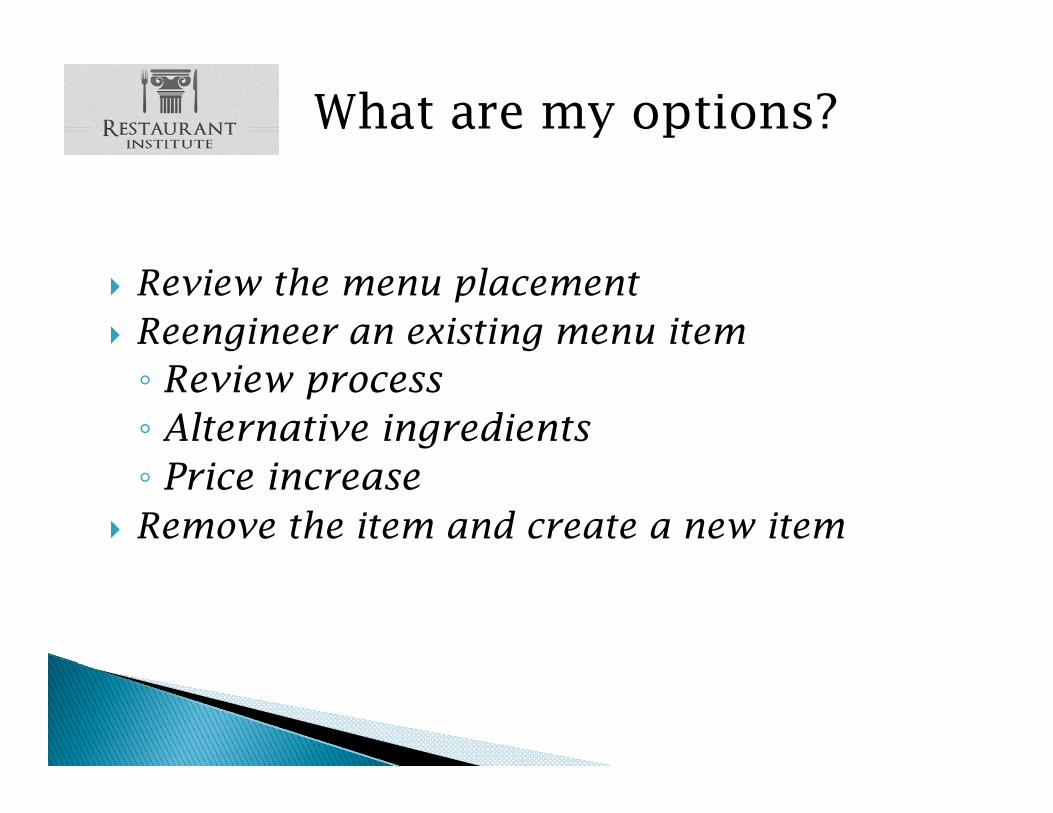
What are my options?
Review the menu placement Reengineer an existing menu item◦ Review process◦ Alternative ingredients◦ Price increase
Remove the item and create a new item
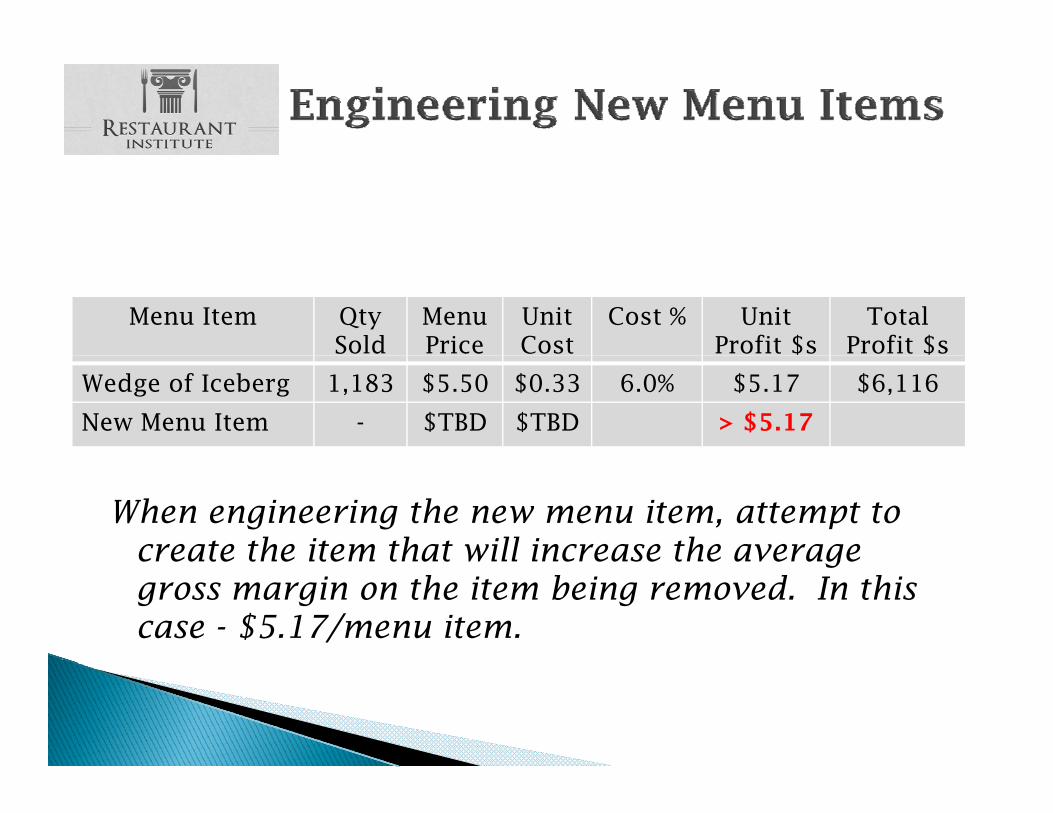
Menu Item Qty Sold
Menu Price
Unit Cost
Cost % UnitProfit $s
Total Profit $s
Wedge of Iceberg 1,183 $5.50 $0.33 6.0% $5.17 $6,116
New Menu Item - $TBD $TBD > $5.17
When engineering the new menu item, attempt to create the item that will increase the average create the item that will increase the average gross margin on the item being removed. In this case - $5.17/menu item.
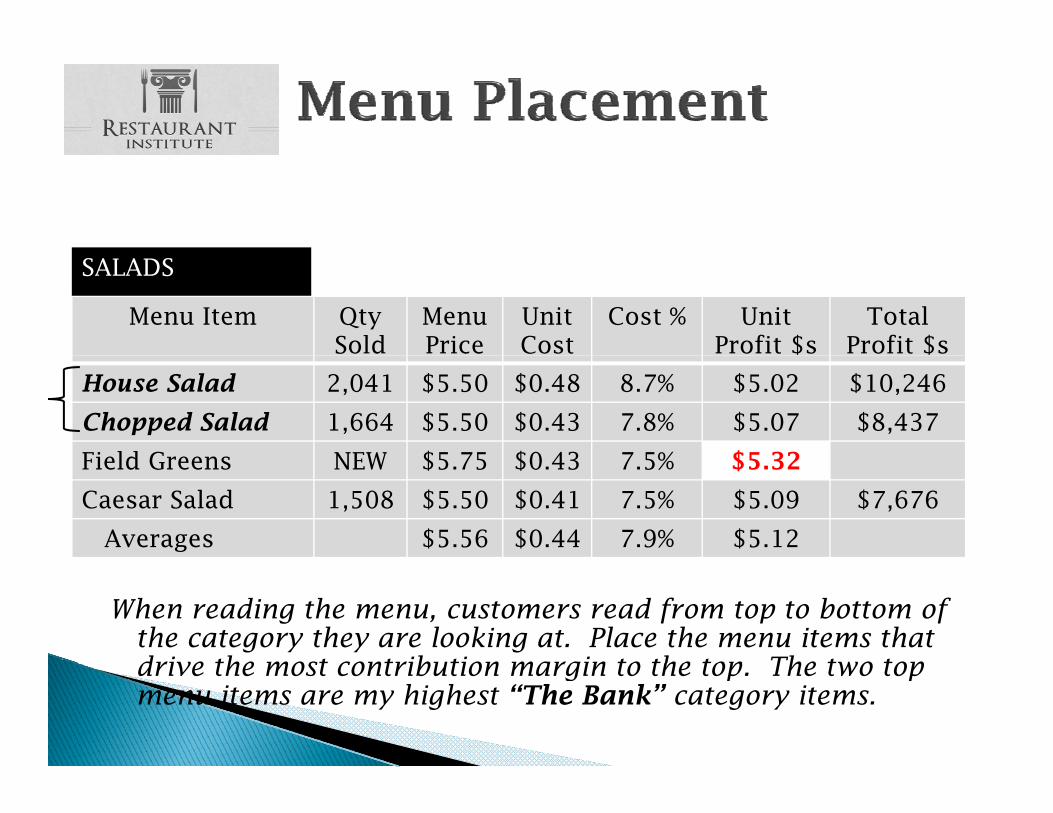
Menu Item Qty Sold
Menu Price
Unit Cost
Cost % UnitProfit $s
Total Profit $s
SALADS
House Salad 2,041 $5.50 $0.48 8.7% $5.02 $10,246
Chopped Salad 1,664 $5.50 $0.43 7.8% $5.07 $8,437
Field Greens NEW $5 75 $0 43 7 5% $5 32Field Greens NEW $5.75 $0.43 7.5% $5.32
Caesar Salad 1,508 $5.50 $0.41 7.5% $5.09 $7,676
Averages $5.56 $0.44 7.9% $5.12
When reading the menu, customers read from top to bottom of the category they are looking at. Place the menu items that drive the most contribution margin to the top The two top drive the most contribution margin to the top. The two top menu items are my highest “The Bank” category items.
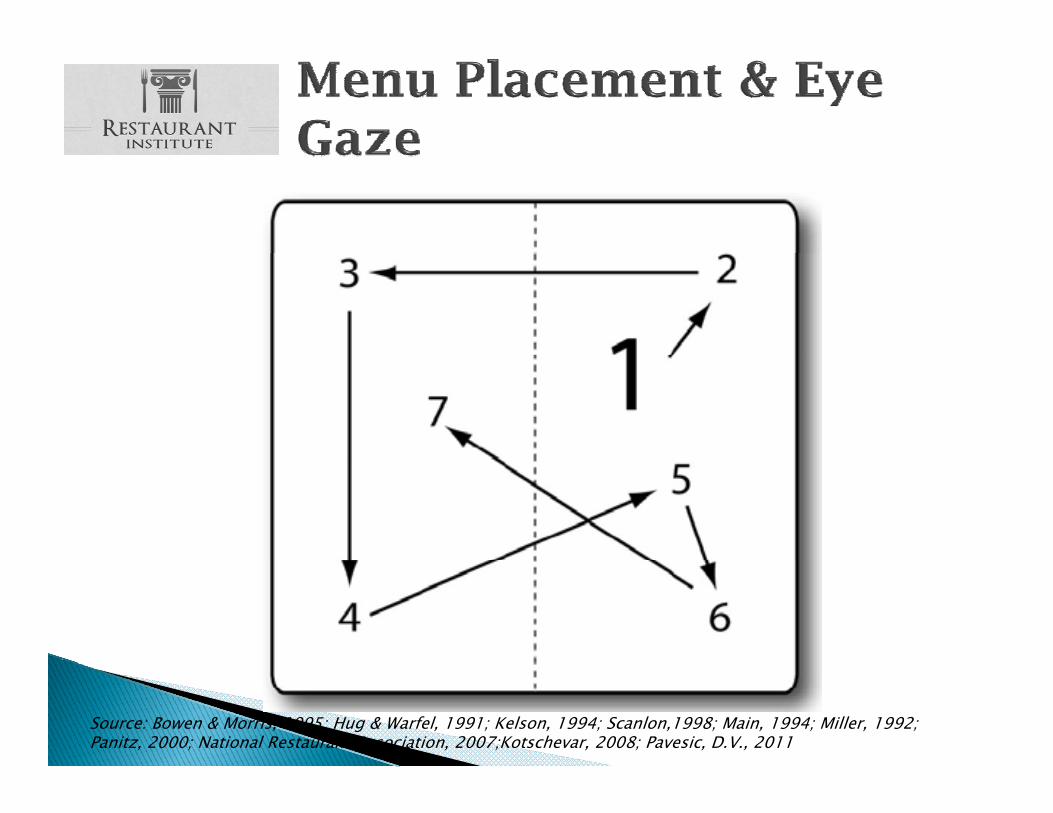
Source: Bowen & Morris, 1995; Hug & Warfel, 1991; Kelson, 1994; Scanlon,1998; Main, 1994; Miller, 1992; Panitz, 2000; National Restaurant Association, 2007;Kotschevar, 2008; Pavesic, D.V., 2011

Source: Glazer, Emily, Wall Street Journal, “The Eyes Have It: Retailers Now Track Shoppers’ Retinas”, 07/12/2012, p. B1
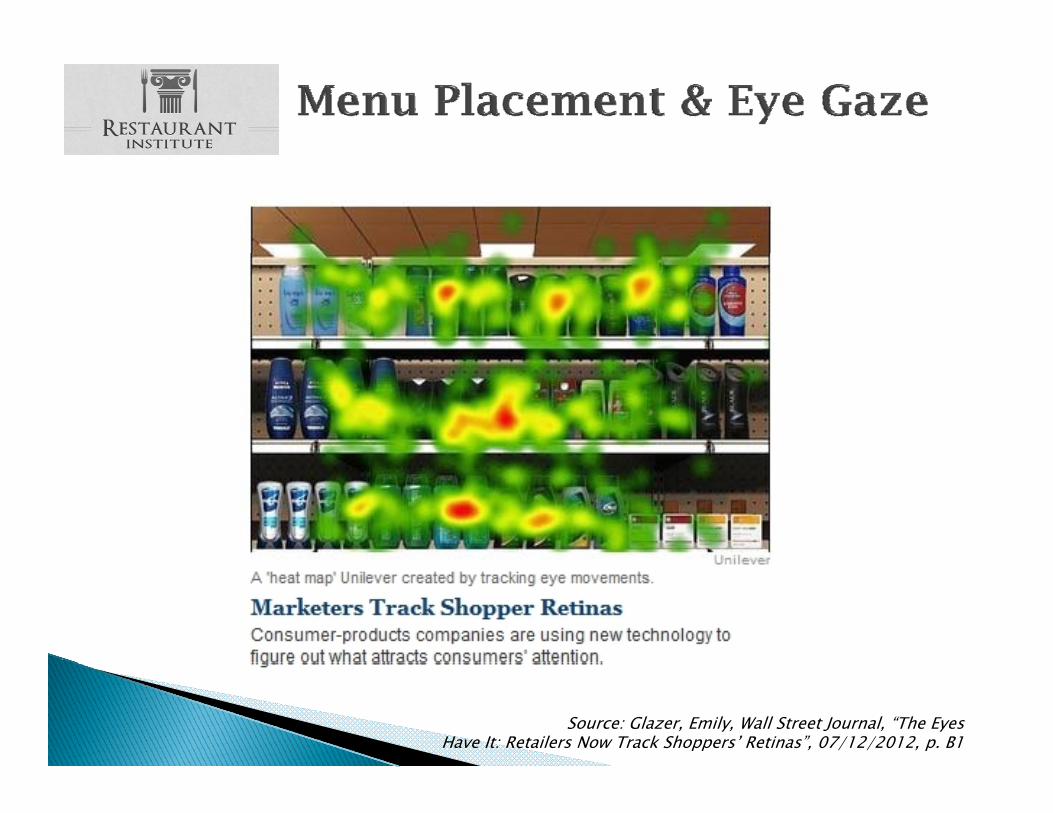
Source: Glazer, Emily, Wall Street Journal, “The Eyes Have It: Retailers Now Track Shoppers’ Retinas”, 07/12/2012, p. B1
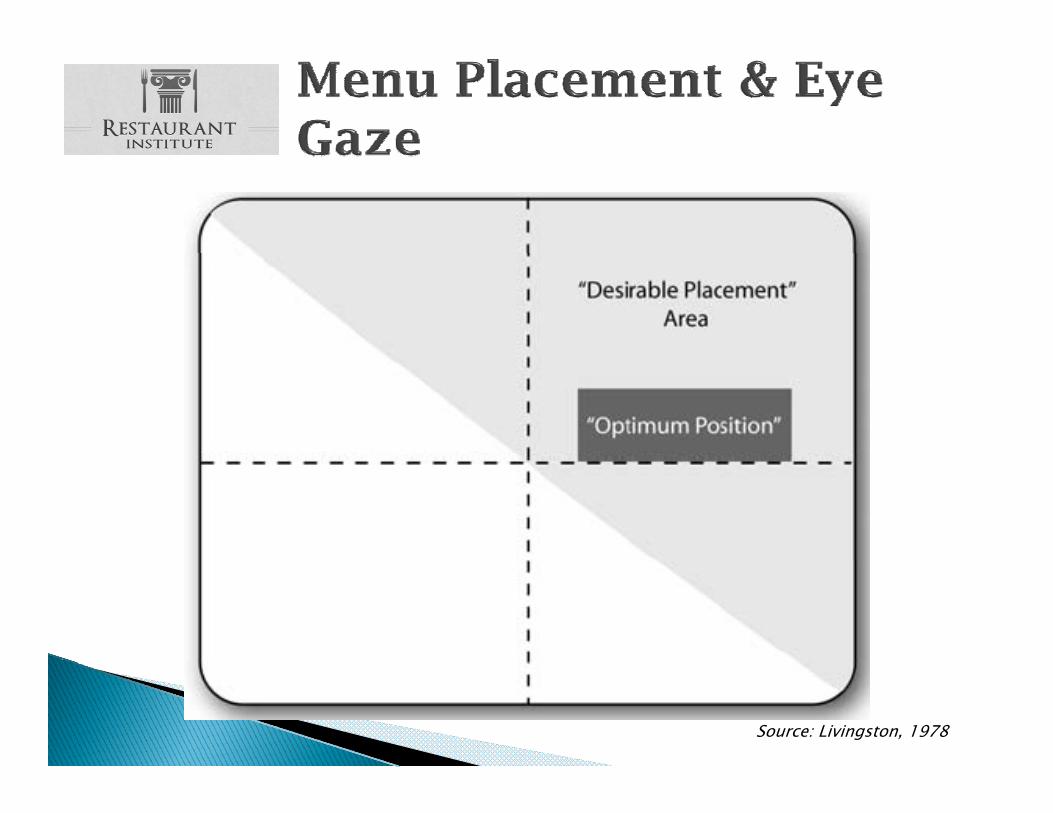
Source: Livingston, 1978
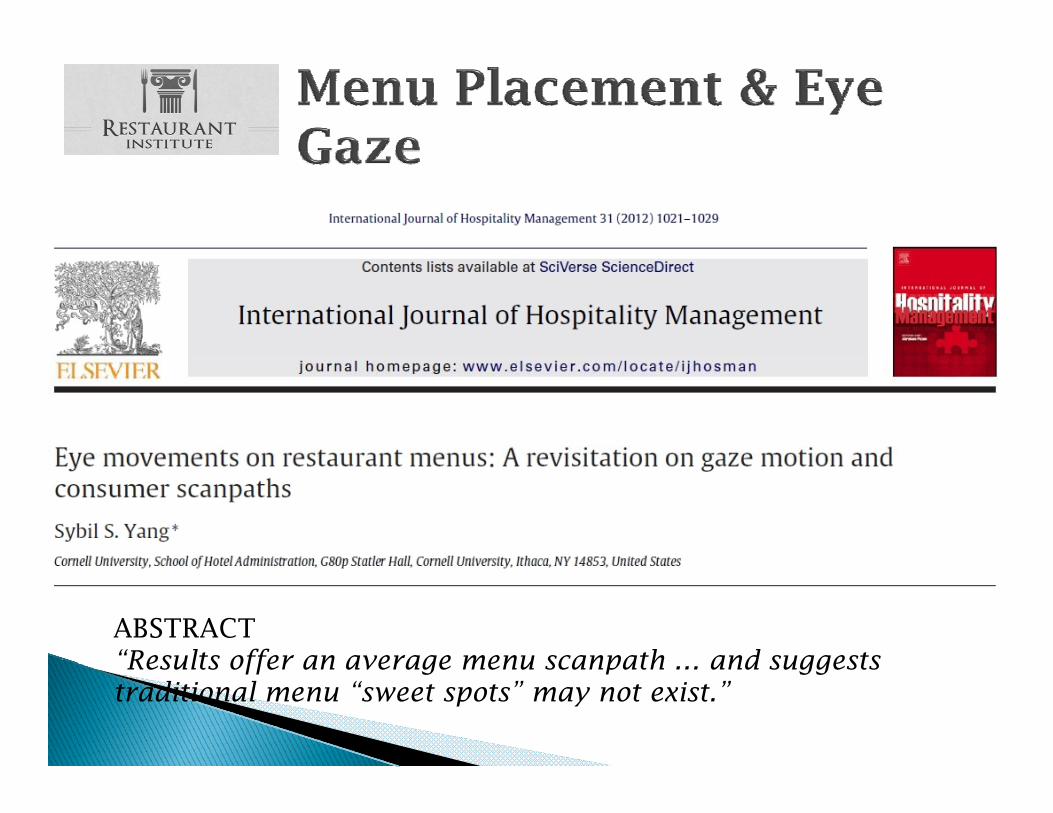
ABSTRACT“Results offer an average menu scanpath and suggests Results offer an average menu scanpath … and suggests traditional menu “sweet spots” may not exist.”
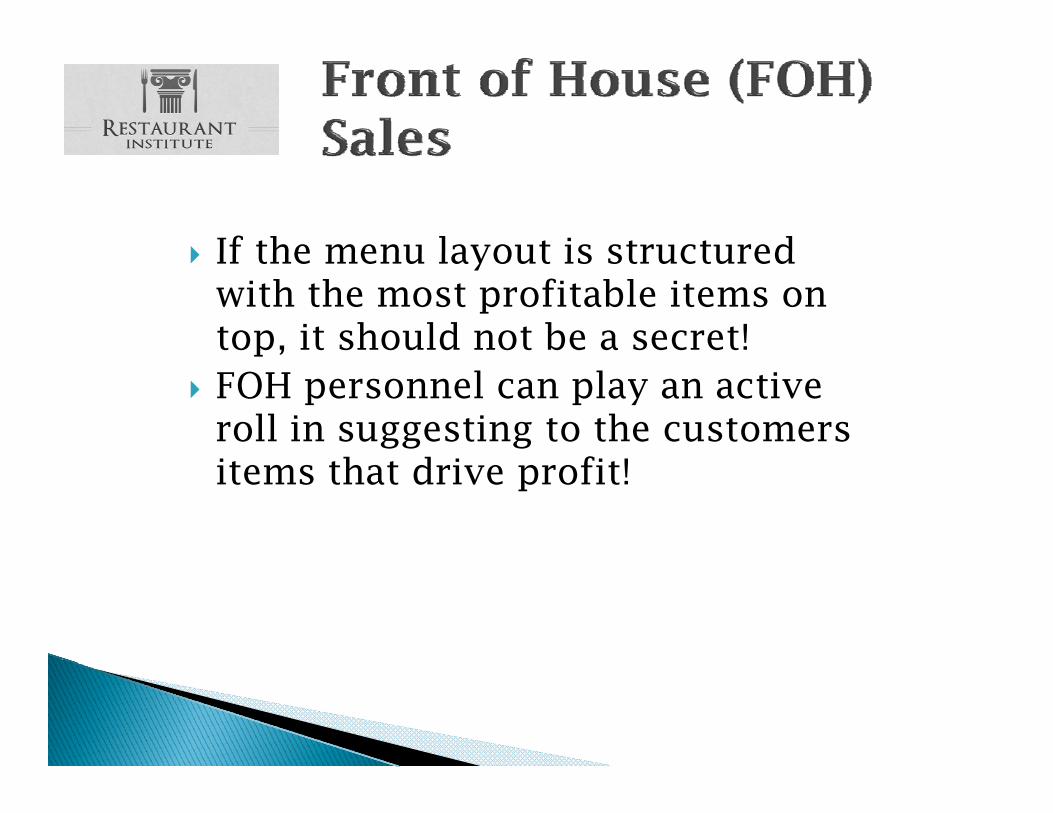
If the menu layout is structured If the menu layout is structured with the most profitable items on top, it should not be a secret!p
FOH personnel can play an active roll in suggesting to the customers
h d fitems that drive profit!
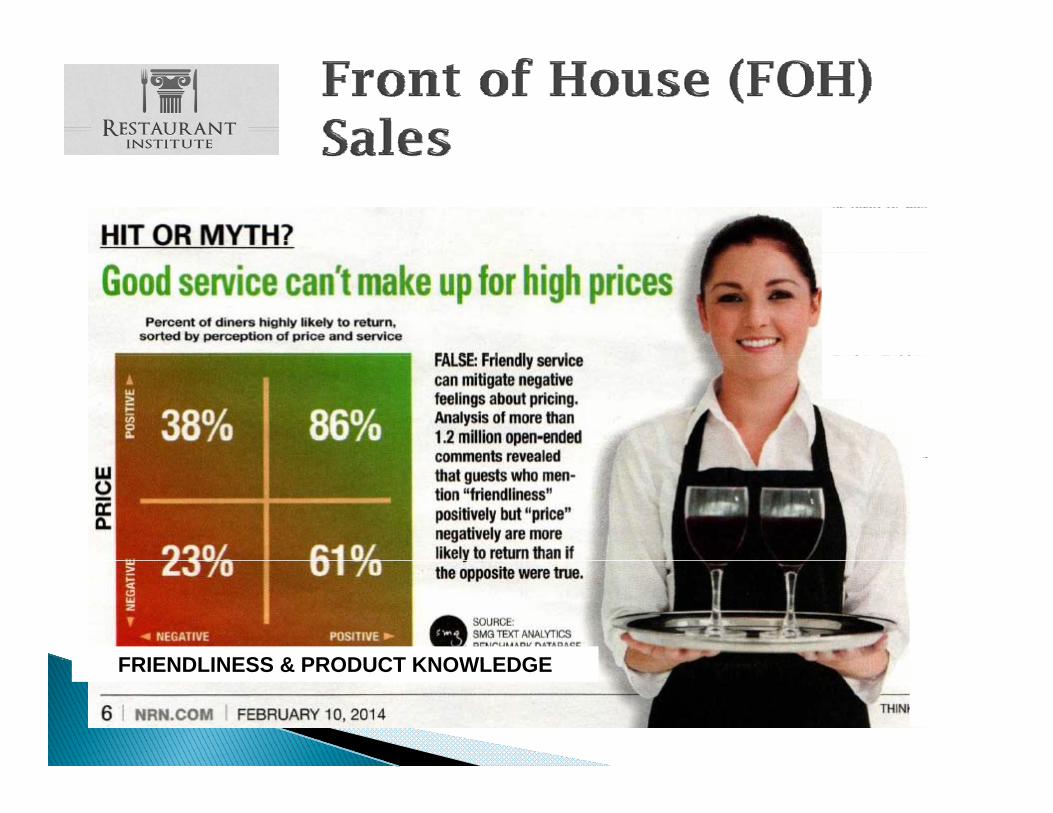
FRIENDLINESS & PRODUCT KNOWLEDGEFRIENDLINESS & PRODUCT KNOWLEDGE
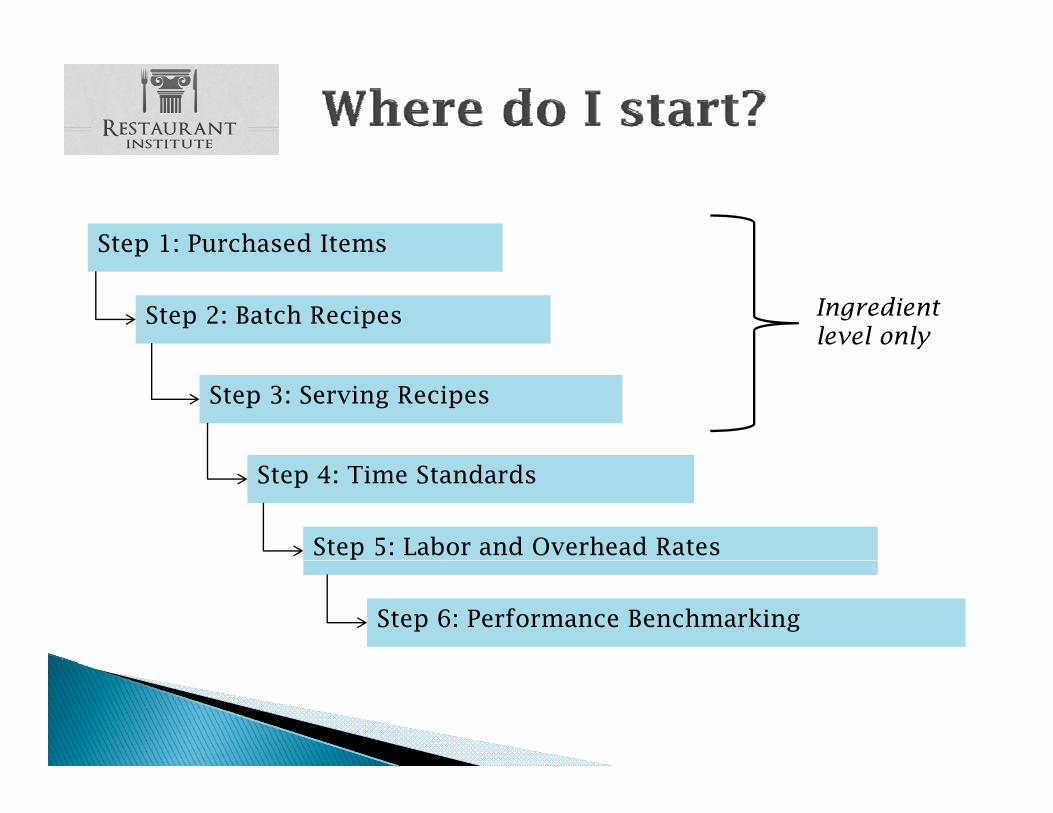
Step 1: Purchased Items p
Step 2: Batch Recipes Ingredient level only
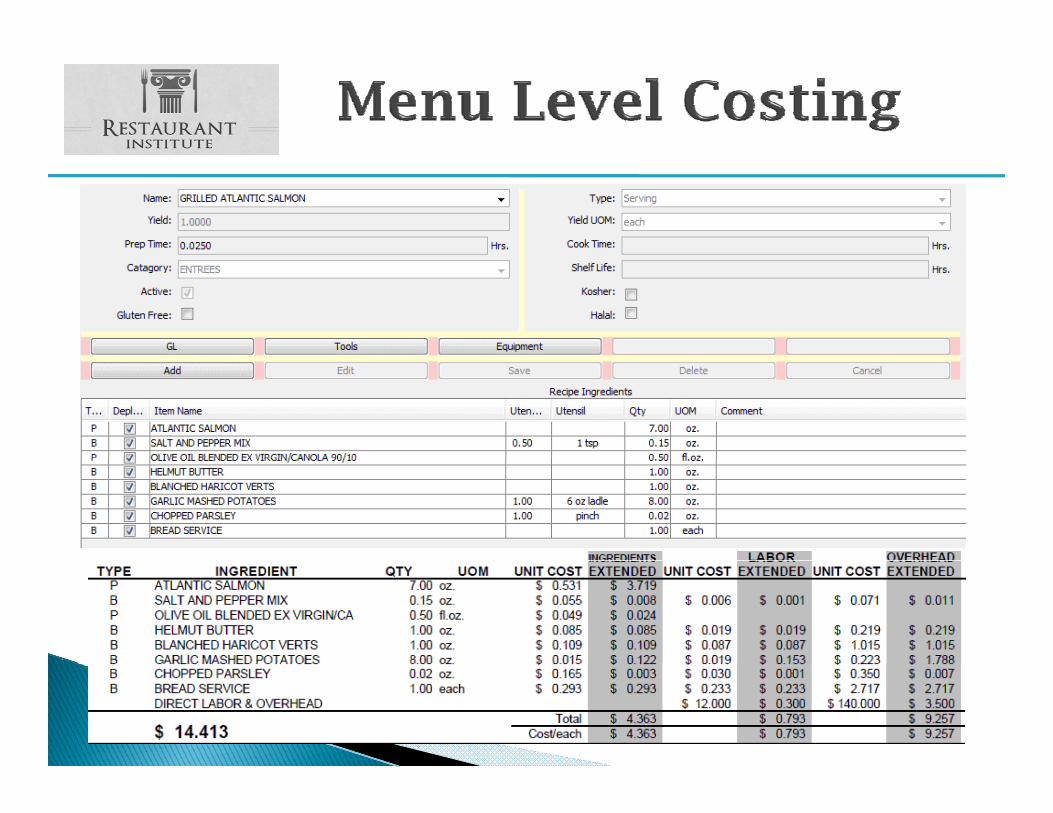
Step 3: Serving Recipes
Step 4: Time Standards
Step 5: Labor and Overhead Rates
Step 6: Performance Benchmarking

Systems & Software (do your y yresearch!)◦ Features (i.e.
recipes production ordering recipes, production, ordering, ◦ invoicing, menu engineering, etc.)◦ Service◦ Cost◦ Your overall plan (short and long term)
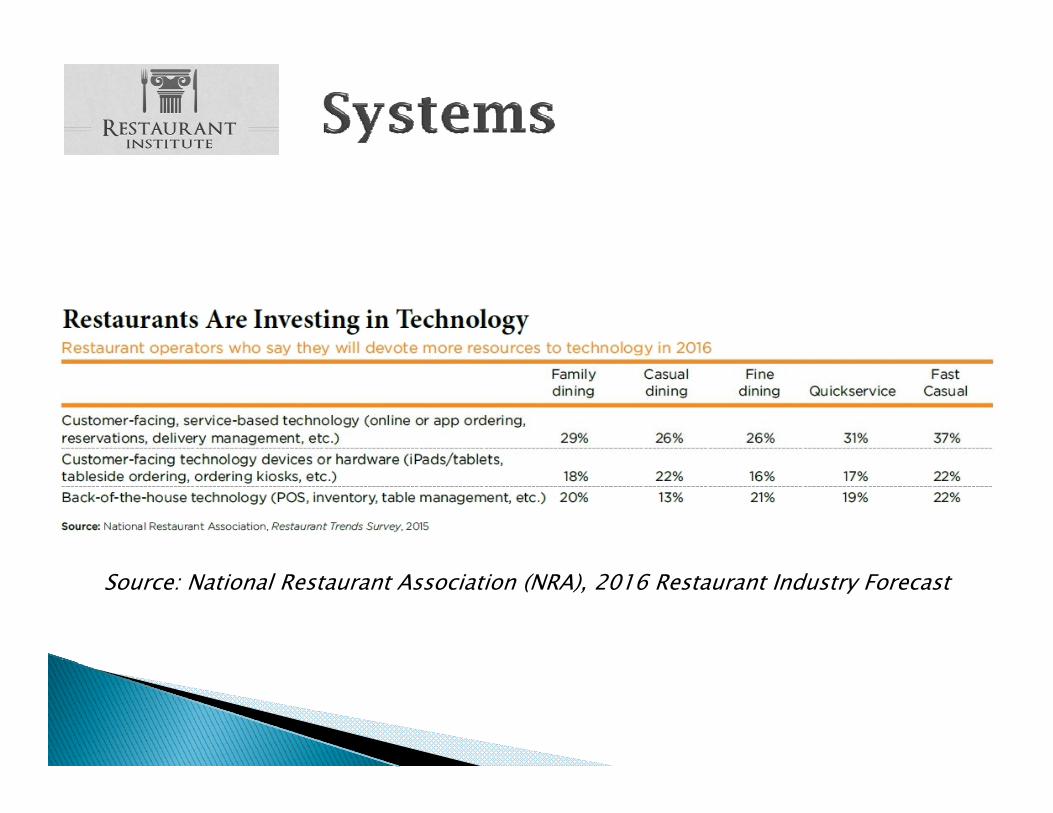
Source: National Restaurant Association (NRA), 2016 Restaurant Industry Forecast
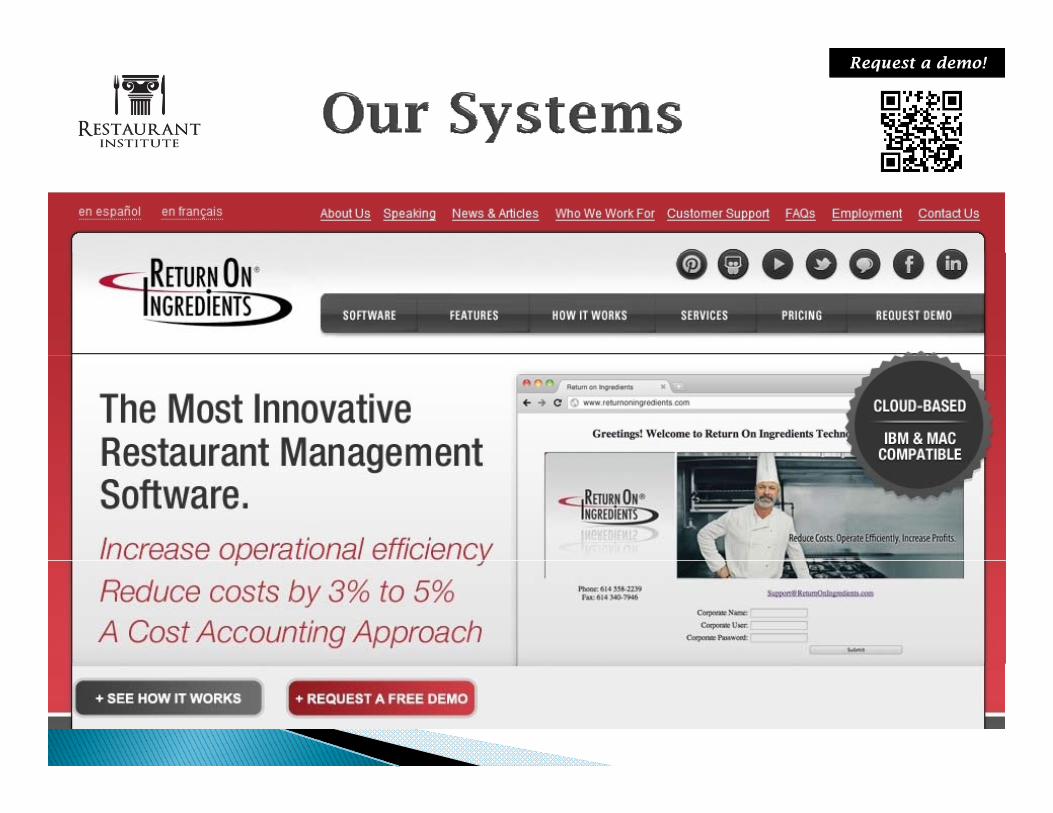
Request a demo!

hThe Top Top
TakeawaysTakeaways
Takeaway #1Takeaway #1Understand the impact recipe
costing has on menu engineering If costs are engineering. If costs are understated, profits are
d!overstated!
Takeaway #2Takeaway #2Your menu is too
important to guess at! Guessing is not good enough!Guessing is not good enough!There is too much as risk.
Takeaway #3Takeaway #3Unique printed menus should
be engineered separately. Engineer any menu that is in Engineer any menu that is in
print or displayed.
Takeaway #4Takeaway #4Engineer sections of menu.
Do not engineer the complete menu in whole complete menu in whole. Decisions should be made i hi h within each menu category.
Takeaway #5Takeaway #5“You cannot place percents in
k t !” Shift th your pockets!”. Shift the focus from cost percents to cost volume profit methods. Look at total profitability! p f y
Money in the bank!
Takeaway #6Takeaway #6Make decisions not only based on the passion and
emotion of the menu item –emotion of the menu item but also empirical data. Be
h di lmethodical.
Takeaway #7Takeaway #7The menu layout and
placement of menu items does matter Place higher does matter. Place higher contribution margin items
i d di don top in descending order.
Takeaway #8Takeaway #8Consider and vet systems to
assist in the process. Utilizing Excel is both time Utilizing Excel is both time
consuming and bcumbersome.
Takeaway #9Takeaway #9This is your call to action!
Start the process. If you do not have adequate time or not have adequate time or
skills, get some professional assistance!
Takeaway #10Takeaway #10To ensure success –The bottom line is know your costs!know your costs!Plan for success!
Be proactive, not reactive!
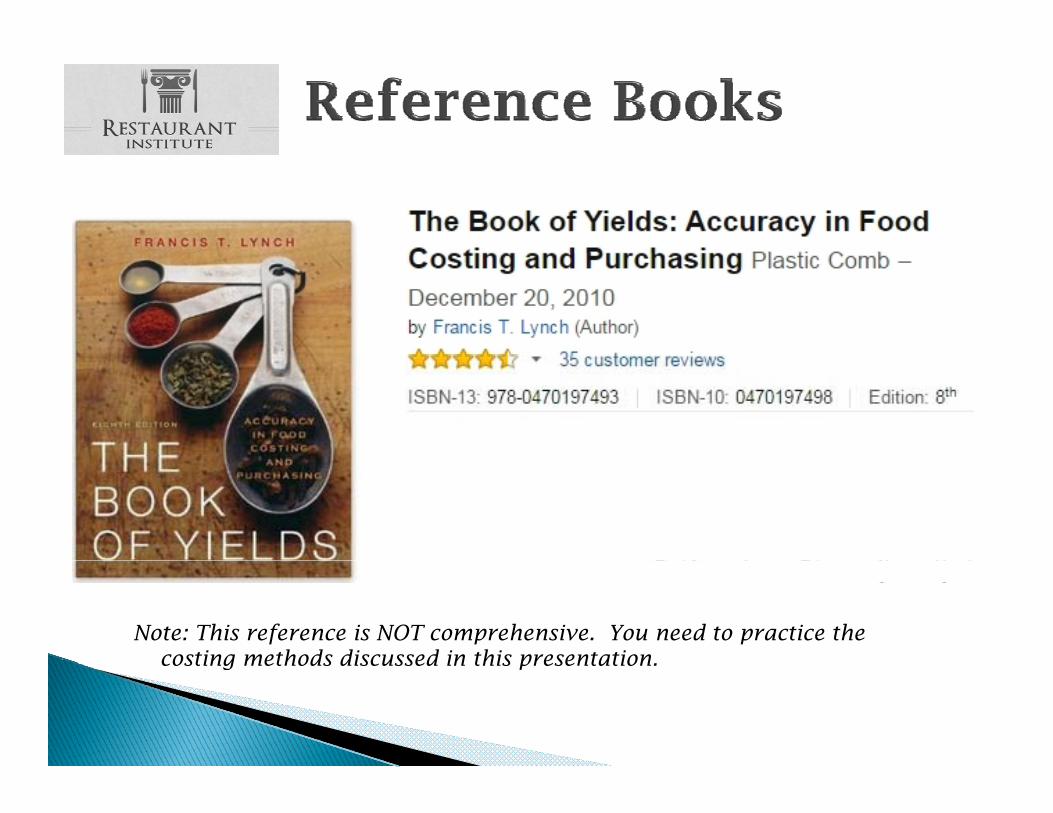
Note: This reference is NOT comprehensive. You need to practice the costing methods discussed in this presentationcosting methods discussed in this presentation.
Note: This reference is NOT comprehensive. You need to practice the f p pcosting methods discussed in this presentation.
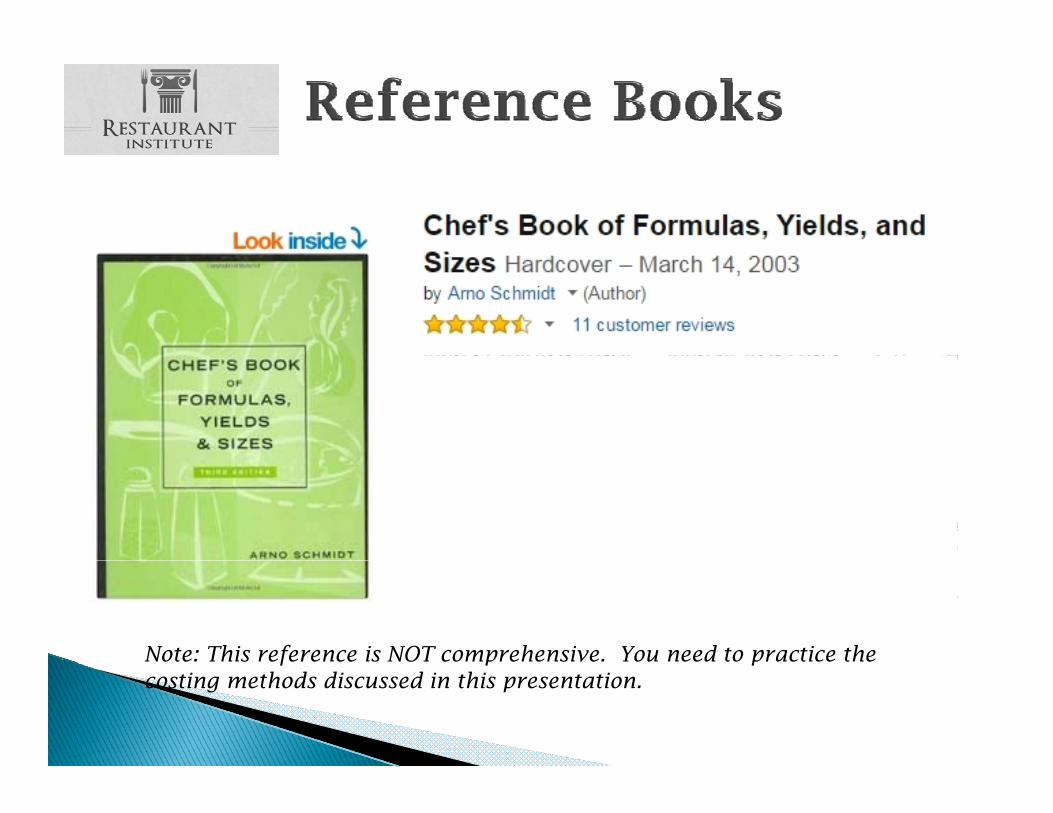
Note: This reference is NOT comprehensive. You need to practice the f p pcosting methods discussed in this presentation.
Search “Restaurant Institute”Search Restaurant Institute$1.99

04/17/2017 Columbus OH$149 per person 04/17/2017 - Columbus, OH8:30 a.m. – 5:00 p.m.
Greater Columbus Convention Center
$149 per person
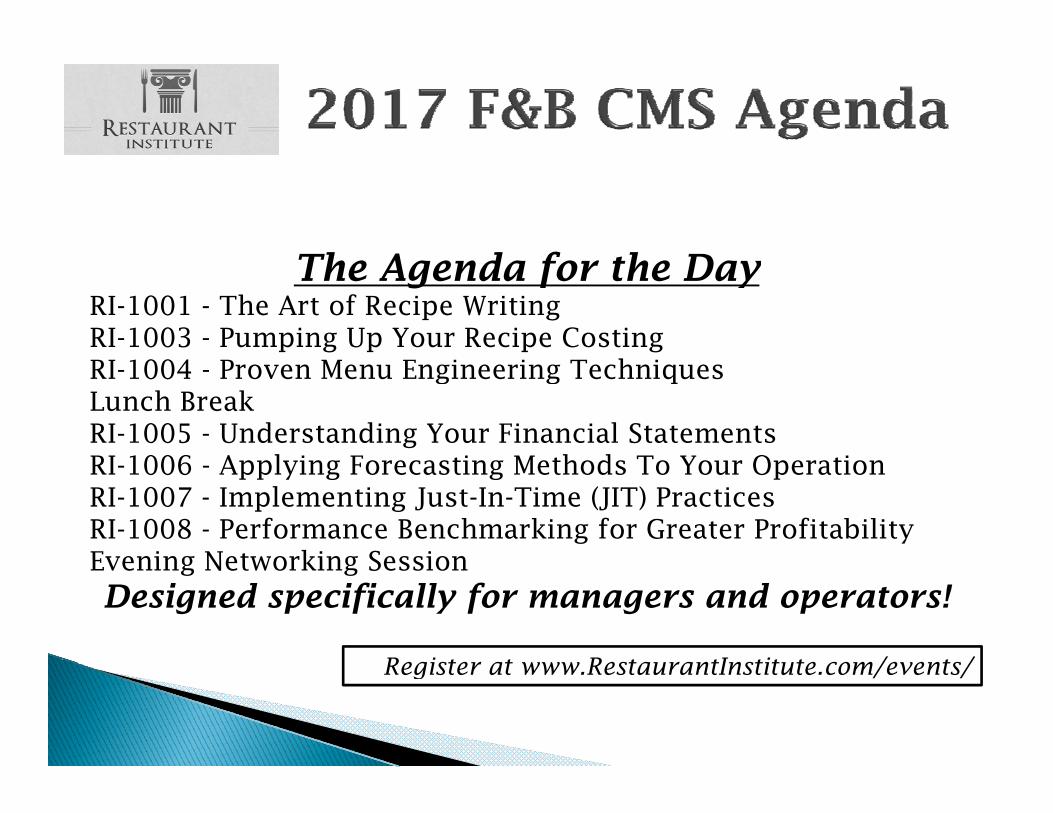
h d f hThe Agenda for the DayRI-1001 - The Art of Recipe WritingRI-1003 - Pumping Up Your Recipe CostingRI-1004 - Proven Menu Engineering TechniquesLunch BreakRI-1005 - Understanding Your Financial StatementsRI 1006 A l i F ti M th d T Y O tiRI-1006 - Applying Forecasting Methods To Your OperationRI-1007 - Implementing Just-In-Time (JIT) PracticesRI-1008 - Performance Benchmarking for Greater ProfitabilityEvening Networking SessionEvening Networking SessionDesigned specifically for managers and operators!
Register at www RestaurantInstitute com/events/Register at www.RestaurantInstitute.com/events/
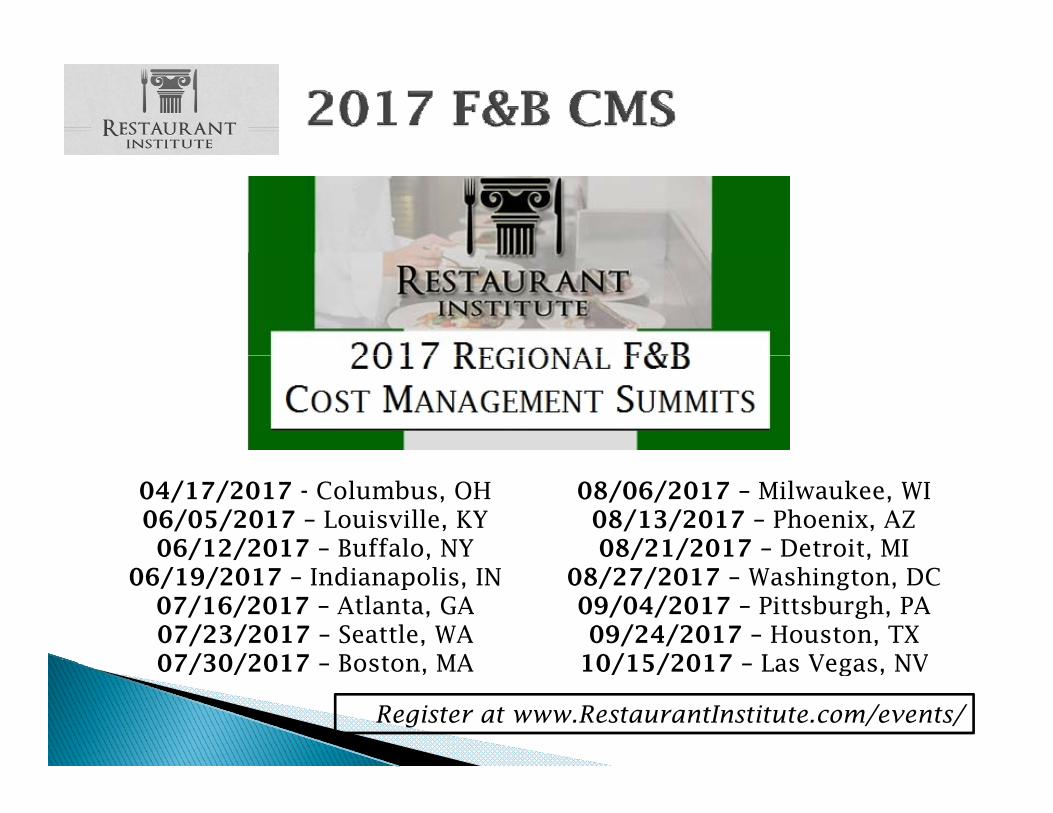
04/17/2017 - Columbus, OH06/05/2017 – Louisville, KY06/12/2017 – Buffalo, NY
08/06/2017 – Milwaukee, WI08/13/2017 – Phoenix, AZ08/21/2017 – Detroit, MI
06/19/2017 – Indianapolis, IN07/16/2017 – Atlanta, GA07/23/2017 – Seattle, WA07/30/2017 Boston MA
08/27/2017 – Washington, DC09/04/2017 – Pittsburgh, PA09/24/2017 – Houston, TX
10/15/2017 Las Vegas NV07/30/2017 – Boston, MA 10/15/2017 – Las Vegas, NV
Register at www.RestaurantInstitute.com/events/
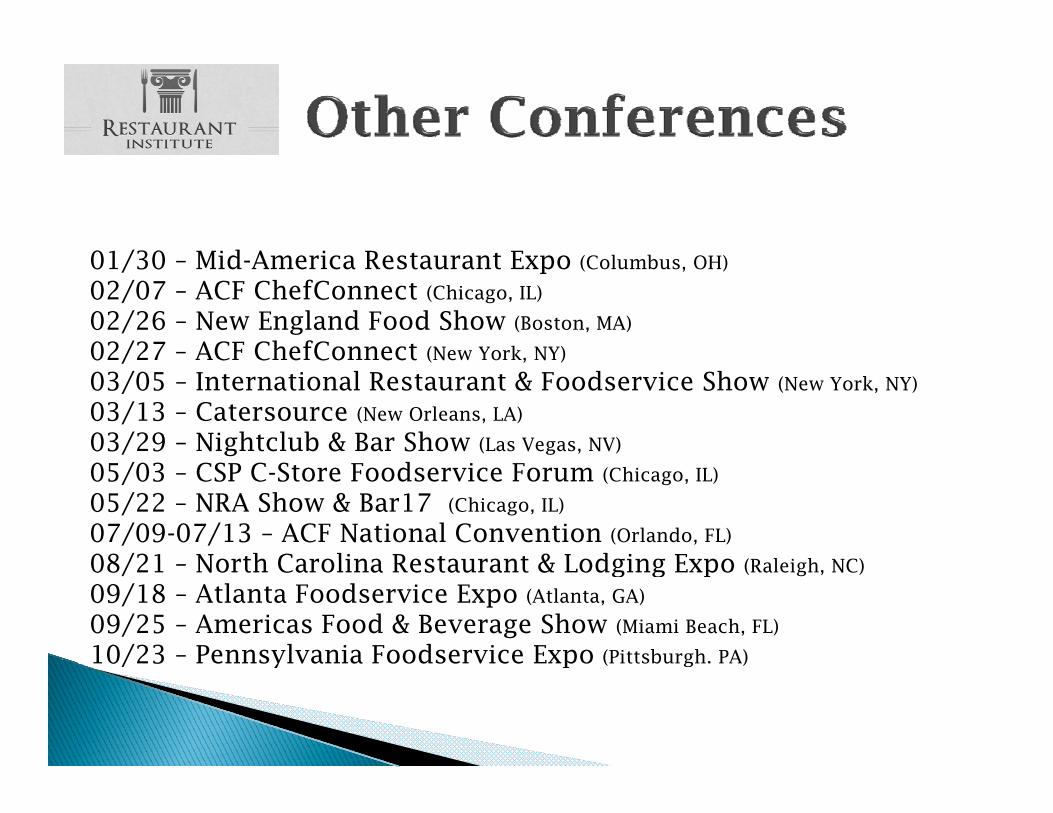
01/30 Mid A i R t t E 01/30 – Mid-America Restaurant Expo (Columbus, OH)
02/07 – ACF ChefConnect (Chicago, IL)
02/26 – New England Food Show (Boston, MA)
02/27 – ACF ChefConnect (New York NY)02/27 ACF ChefConnect (New York, NY)
03/05 – International Restaurant & Foodservice Show (New York, NY)
03/13 – Catersource (New Orleans, LA)
03/29 – Nightclub & Bar Show (Las Vegas, NV)
05/03 – CSP C-Store Foodservice Forum (Chicago, IL)
05/22 – NRA Show & Bar17 (Chicago, IL)
07/09-07/13 – ACF National Convention (Orlando, FL)
08/21 North Carolina Restaurant & Lodging Expo (R l i h NC) 08/21 – North Carolina Restaurant & Lodging Expo (Raleigh, NC)
09/18 – Atlanta Foodservice Expo (Atlanta, GA)
09/25 – Americas Food & Beverage Show (Miami Beach, FL)
10/23 – Pennsylvania Foodservice Expo (Pittsburgh. PA) 10/23 Pennsylvania Foodservice Expo (Pittsburgh. PA)
Over 7,000+ members from over f h ld140+ areas of the world